
Transitioning to Society 5.0 in Africa: Tools to Support ICT Infrastructure Sharing


1
School of Computing, Engineering and Digital Technology, Teesside University, Middlesbrough TS1 3BA, UK
2
Teesside University Business School, Teesside University, Middlesbrough TS1 3BA, UK
*
Author to whom correspondence should be addressed.
Data 2021, 6(7), 69; https://0-doi-org.brum.beds.ac.uk/10.3390/data6070069
Submission received: 21 April 2021
/
Revised: 16 June 2021
/
Accepted: 21 June 2021
/
Published: 25 June 2021
(This article belongs to the Special Issue Development of a Smart Future under Society 5.0)
Abstract
:Society 5.0 represents an opportunity to transform the economy and create a digital society with the goal of long-term sustainable development and economic growth. There is a growing importance of boosting ICT as an effective and efficient means of achieving this transformation, and Target 9c of the UN Sustainable Development Goals is to ‘Significantly increase access to information and communications technology and strive to provide universal and affordable access to the Internet in least developed countries’. Mobile telecommunication systems have become the most effective and convenient means of communicating in the world, and as such, they are revolutionizing business operations. Nigeria is the fastest growing telecommunication market in Africa, with approximately 298 million subscribers accommodated by over 53,000 base transceiver stations (BTSs) which are largely concentrated in urban areas. As a result of increasing subscribers, all mobile network service providers in Nigeria are building new BTSs, often without considering existing infrastructure. This has led to a proliferation of masts, defacing the environment and causing unnecessary environmental pollution as BTSs are largely powered by diesel generators. It is therefore becoming paramount for the telecommunication regulatory body in Nigeria to enforce principles of infrastructure sharing and the colocation of sites for all mobile network service provider BTSs to improve network availability, reliability, scalability, customer satisfaction and sustainability. This paper argues, through the development of ICT tools and their application to a case study, that infrastructure sharing and colocation of sites is not only feasible if supported correctly but also offers the potential to reduce operational and capital expenditure, reduce the number of BTSs required for the rapidly growing mobile telecoms industry in Nigeria and in doing so reduce environmental pollution.
1. Introduction
Society 5.0 represents an opportunity to transform the economy and create a digital society with the goal of long-term sustainable development and economic growth [1]. In order to effectively and efficiently achieve this transformation, there is—among many factors—a growing importance of boosting ICT, and there is a close link between UN Sustainability Goals and visions of Society 5.0 [2]. In this respect, target 9c of the UN Sustainable Development Goals is to ‘Significantly increase access to information and communications technology and strive to provide universal and affordable access to the Internet in least developed countries’. Nigeria is the fastest growing telecommunication market in Africa. The executive vice president of the Nigeria Communication Commission stated that the number of 3G and 4G base transceiver masts has increased from 30,000 to 53,460 over the past 5 years in a report published in January 2021. This statement implies that 1G, 2G, radio and television station masts, which are largely concentrated in urban areas, are excluded [3]. As a result of increasing subscribers, all mobile network service providers in Nigeria are building new BTSs, often without considering existing infrastructure. This has led to a proliferation of masts, defacing the environment and causing unnecessary environmental pollution as BTSs are largely powered by diesel generators. In addition, this proliferation of masts is not only unsustainable but presents unnecessary economic and service barriers to end users. It is therefore becoming paramount for the telecommunication regulatory body in Nigeria to address these issues and support transition to a sustainable digital society, with inclusive and reliable access to ICT without compromising business goals and profitability [4]. In this article it is suggested that principles of infrastructure sharing and the colocation of sites for all mobile network service provider BTSs should be enforced to improve network availability, reliability, scalability, customer satisfaction and sustainability. This work argues, through the development of ICT tools and their application to a case study, that infrastructure sharing and colocation of sites is not only feasible if supported correctly but also offers the potential to reduce operational and capital expenditure, reduce the number of BTSs required for the rapidly growing mobile telecoms industry in Nigeria and in doing so reduce environmental pollution and support the transition to a digital society with the goal of long-term sustainable development and economic growth.
1.1. Origin of Infrastructure Sharing
Telecommunication infrastructure sharing ideas and proposals for various approaches began in Europe in the 2000s when the Universal Mobile Telecommunications System (UMTS) was granted licenses. Academia and industry proffered useful ideas and directed their focus on infrastructure sharing, and because of this, the 3rd Generation Partnership Project (3GPP) collaborated with other telecommunication associations to produce a technical report on different standards for sharing [5]. In 2001 the Telecommunications Industry Association (TIA) in Europe published a report on shared 3G network infrastructure, while in 2009 the North Stream produced a report that analyzed the competitive and practical effects of network sharing, and the technical sharing structure was geared towards mobile network operators (MNOs) and mobile virtual operators with service level agreements [5]. Countries like the United Kingdom and Sweden have witnessed the structural separation between infrastructure and service provisioning whereby fixed line operators can leverage infrastructure sharing to optimize the use of their networks [6]. In the UK most of the infrastructures are shared to reduce the number of sites and masts [4,6]. This reduces site acquisition times for new entrants, provides easy access to places of strategic importance where spaces for new sites are limited, reduces capital and operating expenditure and reduces environmental health issues and visual impact [5,6]. It also helps to increase service coverage. The position of telecommunication infrastructure in strengthening economic growth is focused on by economists [5,6,7]. Economists argue that the development of a nation to its full potential in the contemporary world cannot be achieved without a modern telecommunication infrastructure in place [8,9]. As such, the development of telecommunication infrastructures significantly enhances economic growth and development. Studies have shown that there is a strong relationship between telecommunication infrastructure development and economic growth and a strong correlation between mobile phone penetration and economic growth [4]. Though telecommunication infrastructure sharing as a concept and practice is well established in Europe, America and Asia, it is new in Africa, and currently many operators are not willing to share infrastructure. Hence, there are no comprehensive reports on the environmental and social profitability of this model in Africa. However, it has proved successful in other international markets, and hence it will be appropriate to test its practicability and profitability in an African context. However, the African telecommunication market is somewhat unique, and hence presents peculiar challenges that other markets do not. The focus of this study was Nigeria.
1.2. Aims and Objectives
The aim of this research was to validate the concept of—and identify the potential of—telecoms infrastructure sharing opportunities in Nigeria through the development of supporting ICT tools and their application to a real case study.
The specific objectives of this research study were as follows:
- To review arguments and evidence that identifies the current problems associated with the lack of BTS infrastructure sharing and related problems linked to CO2 emissions in Nigeria;
- To develop mathematical models and a related optimization and decision support tool to assist with mast colocation decisions involving BTSs;
- To apply the developed mathematical and optimization approaches to a case study to provide initial supporting evidence that colocation of BTSs, if conducted appropriately using decision support tools, can reduce costs and CO2 emissions while maintaining adequate network service in Nigeria.
1.3. Motivation
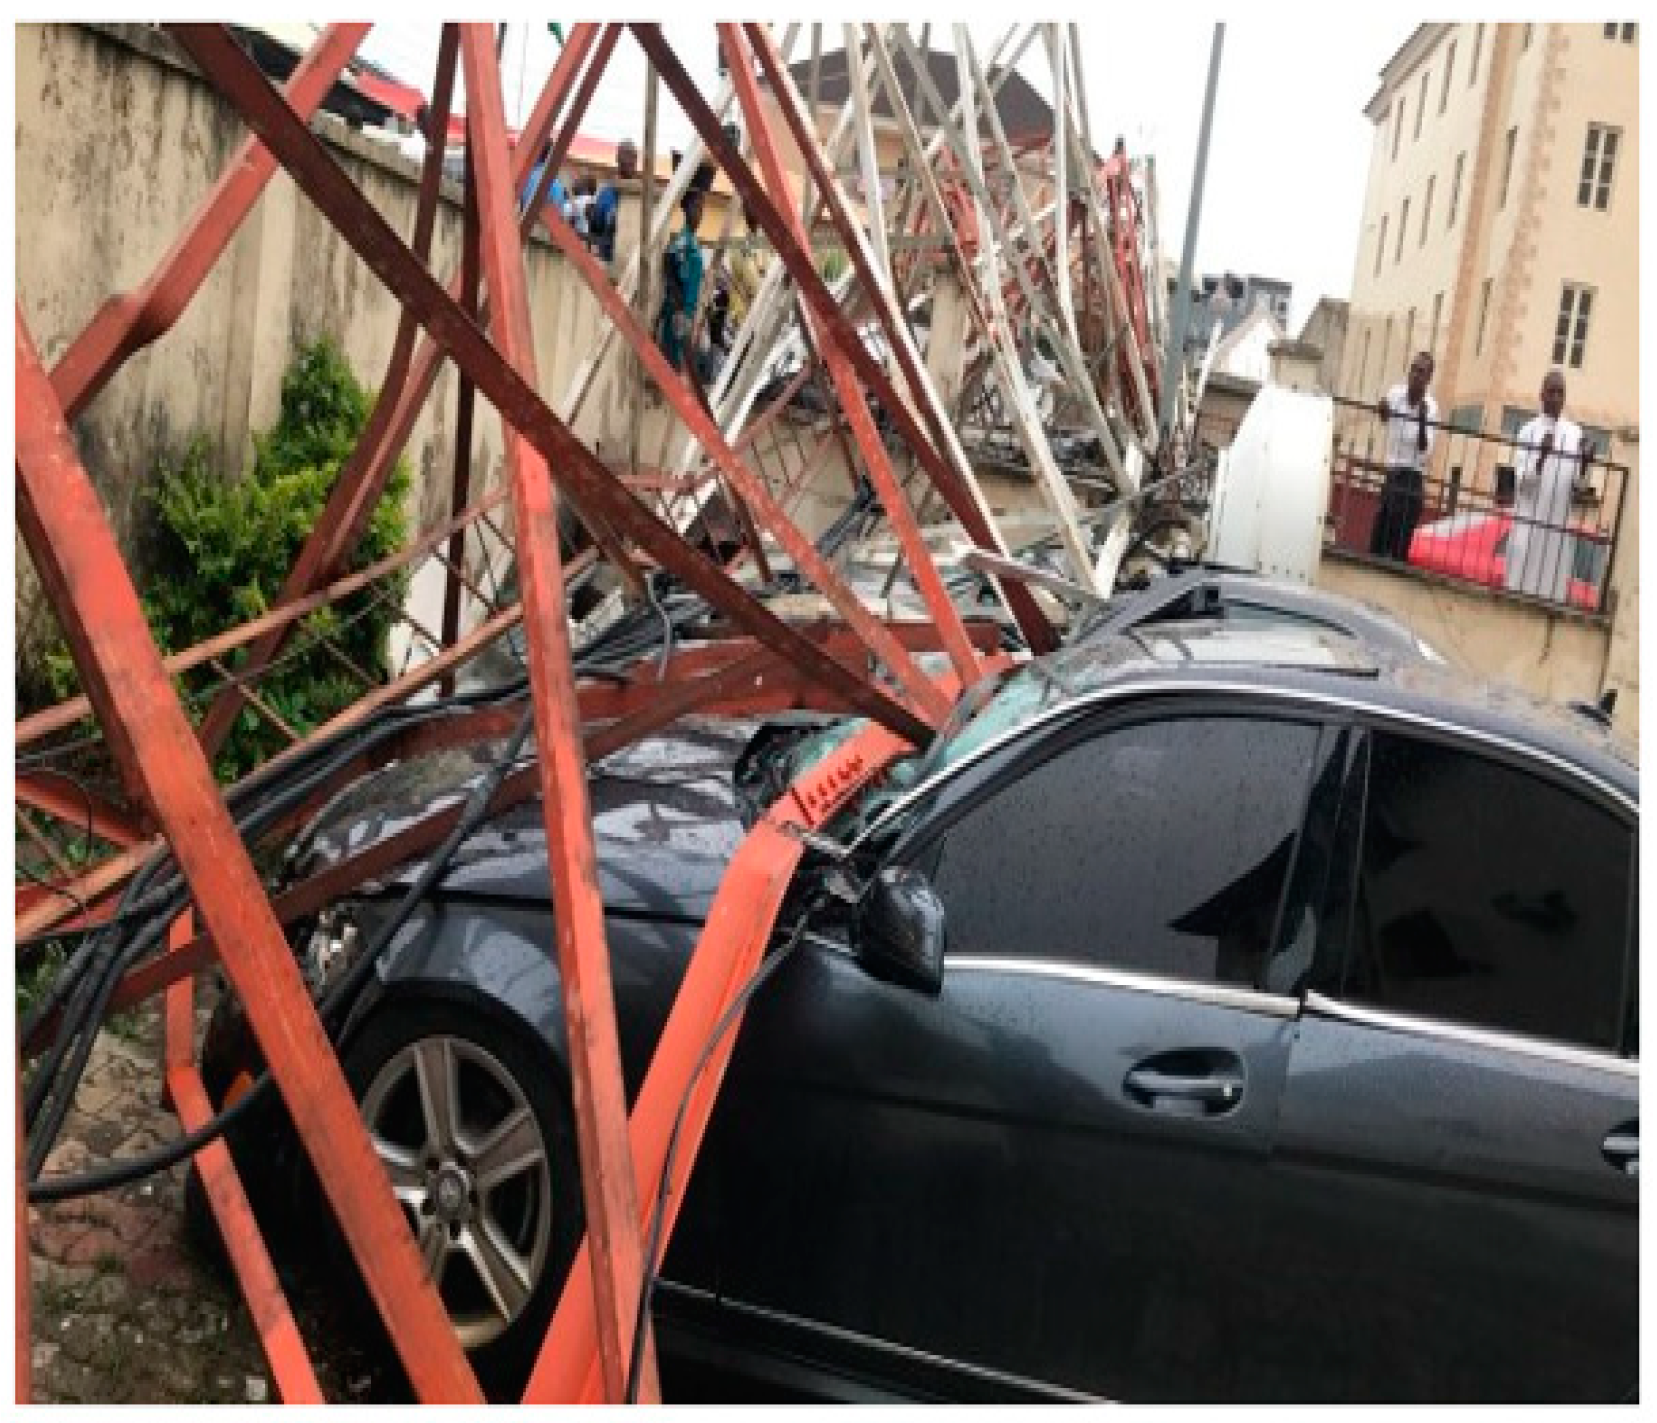
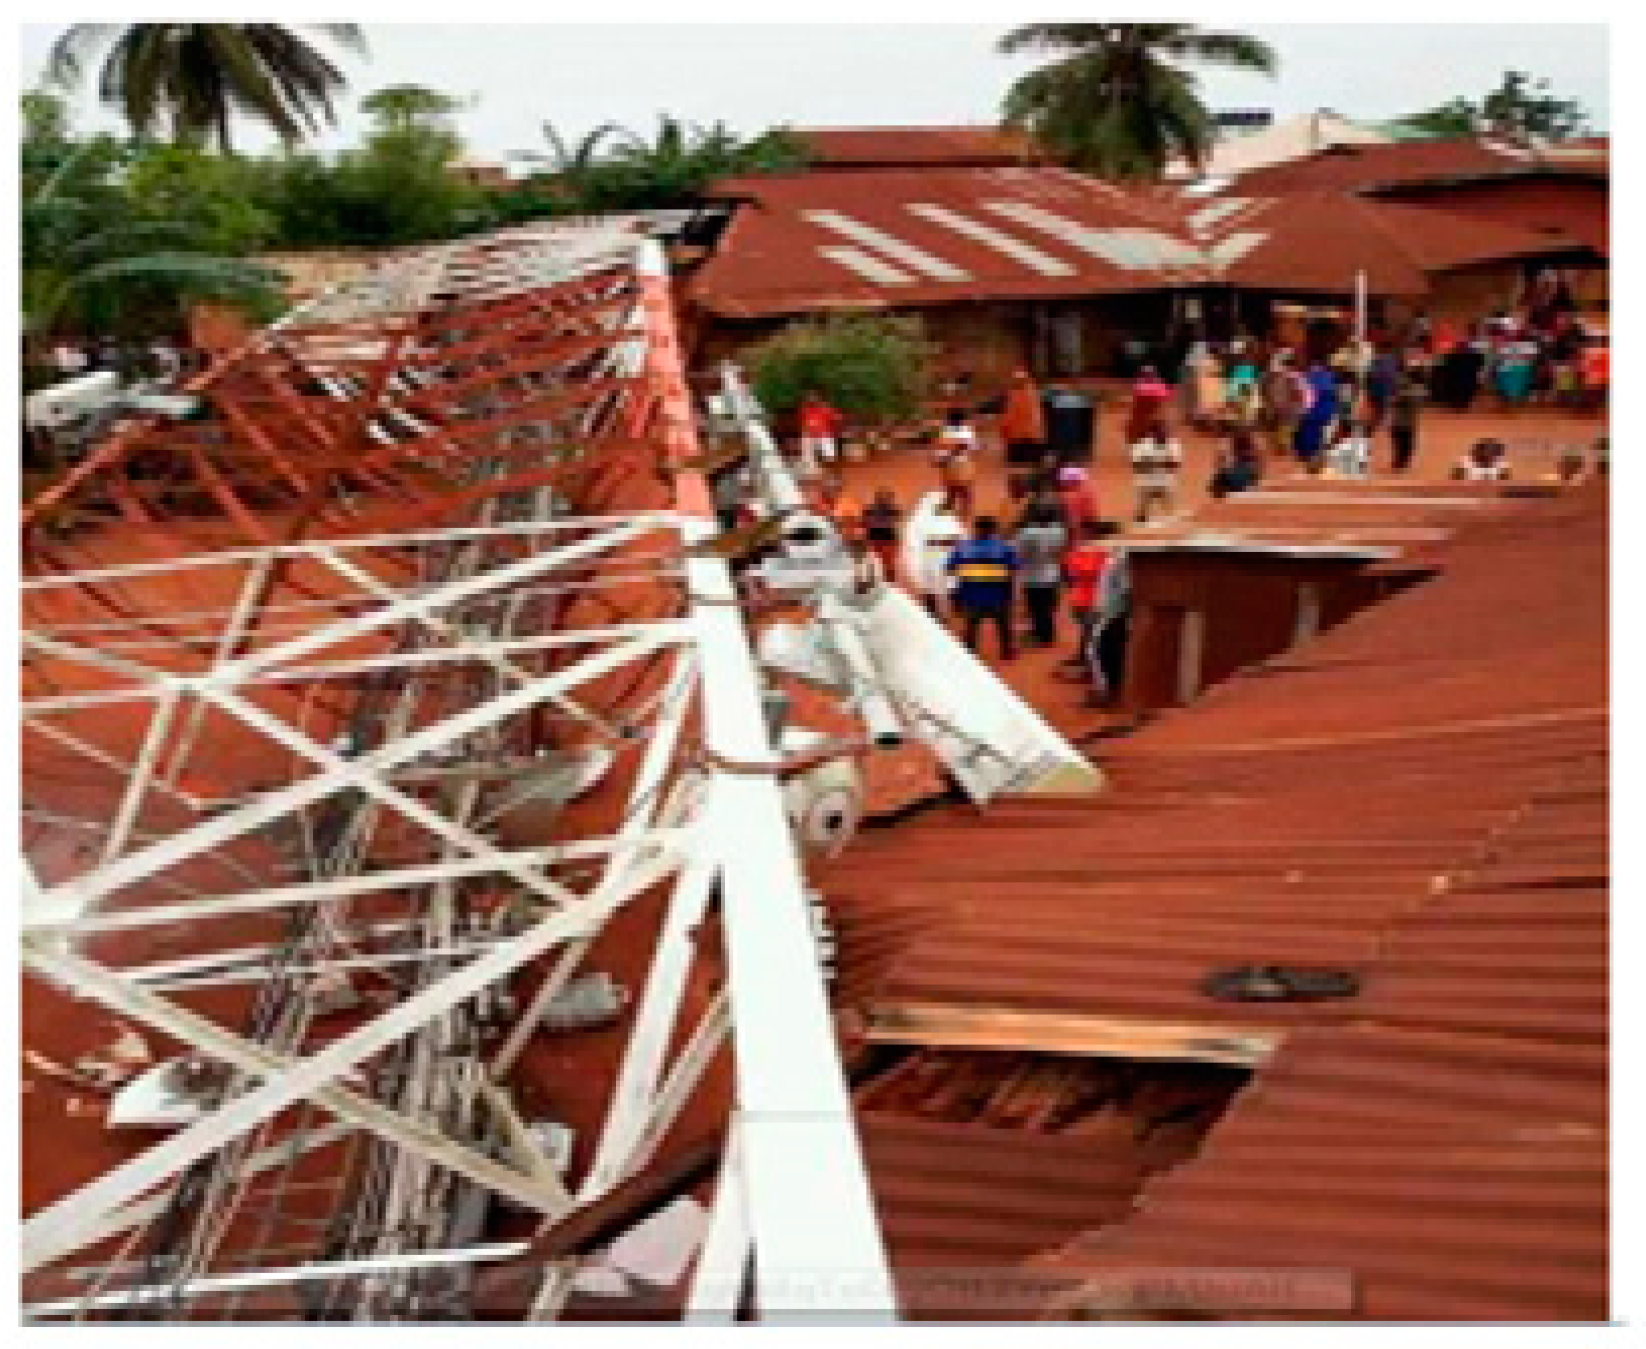
Currently each service provider operates its own base station network in Nigeria. This means that many urban areas have a proliferation of mobile base stations and masts as shown in Figure 1. If colocation is adhered to, there will be a potential reduction in operational/expenditure cost and reduction in CO2 emissions. As there are over 53,000 BTSs in Nigeria, this reduction could be significant. The presence of so many BTSs in a residential environment as shown in Figure 2 is causing concern [9,10]. The case of Nigeria is problematic as the BTSs are powered with diesel fueled electricity generators, posing a threat to the environment. Collapsing masts as shown in Figure 3 and Figure 4 have been reported in different urban cities in Nigeria, killing several people and injuring others and destroying properties; moreover, the fumes and noise from generators were also reported as problematic [11]. Infrastructure sharing has become one of the most viable options for reducing the total number of BTSs/masts and addressing the associated environmental issues [4].
1.4. Contribution and Structure
Although several scholars have made contributions to improving the Nigerian telecommunication infrastructure sharing, there is to date no proposed rigorous method or design guidelines on how to achieve success. The issue of which sites, BTSs or masts to select as the host(s) for colocation still poses significant hindrances and challenges for the telecommunication industry. The quality and amount of information are considered critical to support the basis for suitable decision-making. Good decision-making requires informative formulation, clear evaluation and quick reformulation of alternatives. Current research in the area is predominately top-down in nature and does not convince the telecoms industry that the benefits of mast colocation outweigh what they see as the potential negative impacts of mast colocation on their bottom line/profits. This study employed a bottom-up approach—using real world cases of mast locations in a particular area—in order to illustrate the economic and environmental benefits of mast colocation to the telecoms industry directly. In order to achieve this goal, mathematical models were developed and the colocation problem rigorously defined as an optimization problem, allowing development of an associated ICT tool to support decision-making. The remaining parts of this paper are organized as follows: Section 2 presents background/related work, specifically outlining the barriers and enablers of BTS infrastructure sharing in Nigeria, and existing work on tools for infrastructure sharing. Section 3 outlines the required mathematical models and optimization framework for infrastructure sharing, suitable to be embedded into a prototype ICT tool. Section 4 presents a real-world case study based in Nigeria, while Section 5 concludes the work.
2. Background and Related Work
2.1. Barriers and Enablers of Mobile Telecommunication Infrastructure Sharing
The government has a major role to play by enacting laws to stipulate how telecommunication businesses are run and as well providing the necessary facilities that will help the growth and development of the industry to thrive [6,12]. Regulatory bodies like the Nigeria Communication Commission (NCC), National Environmental Standards and Regulation Enforcement Agency (NESREA) should both be able to establish a clearer blueprint for the industry to ensure the atmosphere is conducive for the industry and ensure people’s safety [3,13]. Mobile infrastructure sharing holds significant cost saving potential, but the standalone operator sacrifices some of its control over the network operator, thereby affecting the ability of operators to compete and differentiate themselves based on network quality [5]. While infrastructure sharing in developing markets is used due to difficulties in new site acquisition, it is less likely to occur in rural regions where coverage can be used as a service differentiator and investment reduction for continued network rollout can potentially be avoided. In this context, Nigeria can potentially have a differentiated strategy based on geographical regions. As investment in telecommunications is critical to economic growth in Nigeria [14], the government needs to focus equitably on standalone operators and infrastructure sharing mechanisms. Infrastructure sharing significantly reduces equipment revenues as operators share the cost. However, differentiation by assisting in the network planning process and offering managed services can support equipment manufacturers.
Previous investigations by the current authors have found some commonly described problems in the Nigerian context [15]. Many operators often complain of incompatibility of equipment and systems employed by other operators as a major setback to infrastructure sharing. This hinders interoperability, which is the ability of systems or equipment from both sides to operate without the problems of mismatched configurations. Many operators often employ different suppliers, leading to some systems of substandard quality, and so others that are deemed to have superior systems might not be willing to share. New entrants into some telecoms markets in Africa often complain of anticompetitive or unfair monopolistic behaviors adopted by dominant incumbent players who have established wide network coverage before the entry of the inexperienced players. Hence, these monopolistic players create barriers of entry by showing unwillingness to share infrastructure. Towers are usually designed with specified permissible loading. In many instances, antennas are placed at a height that does not exactly match specifications. Tower loading covers anything added to the tower, initially or later, that will be exposed to the environment. A critical look at tower loading in an era of sharing passive network infrastructure has become very important. Since most existing towers were designed for a single operator, they are incompatible with sharing, and some modification/upgrading may be required. Finally, tower overload introduces complexity into microwave link design and quality. Compromising on optimal microwave antenna size or height to prevent overloading affects the quality of the links.
2.2. Benefits and Costs of Infrastructure Sharing
Several scholars have made initial contributions to improving the Nigerian telecommunication infrastructure system through colocation of BTSs and infrastructure sharing; however, there is no proposed method or design for how to successfully achieve this. The issue of which sites, BTSs or masts to select as the host for colocation still poses significant hindrances and challenges for the telecommunication industry [4]. Current research in the area follows a top-down approach considering the work of Nosiri et al. (2015); Koumadi et al. (2013) and Meddour, Rasheed and Gourhant (2011) does not convince the telecoms industry that the benefits of mast colocation outweigh what they see as the potential negative impacts of mast colocation on their bottom line/profits. In contrast, the method suggested in this paper uses a bottom-up approach to illustrate the economic and environmental benefits of mast colocation to the telecoms industry using real world cases of current mast locations in an area to demonstrate the benefits. Telecommunication infrastructure sharing played a significant role in checking the growth of mast erection. In the UK most of the infrastructures are shared to reduce the number of sites and mast erection, it reduce site acquisition times for new entrants, provide easy access to places of strategic importance where space for new sites is limited, reduce capital expenditure and operating expenditure, reduce environmental health issues as outlined by some scholars and reduce visual impact. This also helps to increase service coverage [4,5]. There are two main types of infrastructure sharing: passive and active sharing, as shown in Table 1 and summarized below.
Passive sharing involves the sharing of spaces and physical infrastructures that support telecommunication but does not play an active role in the operational network coordination, and good examples are site, mast and RAN sharing. In site sharing, mobile operators share the same compound but have separate installations such as masts, cabinets, backhaul equipment and antennas. Mast sharing involves mobile operators using the same mast, and each operator antenna is mounted on the mast. Active sharing, however, involves the sharing of some elements in the radio for operational coordination, which is usually performed by configuration of the radio network. This includes core network sharing, which involves the sharing of transmission node, switching center, billing platform and the network logical entities with another mobile operator. Normally, all these elements listed have up to two or more spares that can be leased out, but they are all logically separated. Network roaming is another form of active infrastructural sharing whereby a mobile subscriber is carried along or rides on another mobile operator network. Types of network roaming include national, international and inter-system [5].
Infrastructure sharing, if implemented correctly, can potentially enhance the improvement of service quality rendering to mobile telecommunication network subscribers, as identified in [16]. Many subscribers complain about poor services, and the initial stage of the research has identified that the quality of service offered by mobile operators in the country is unreliable [17,18,19,20,21]. Many GSM subscribers in Nigeria have been complaining about the incessant substandard services rendered by mobile telecommunication operators in Nigeria [19,20,21] and have experienced call drops, network congestion, crosstalk, occasional service outages and delays in short message service (SMS). Call drops, network congestion and others network problems are experienced because of poor received signal strength and poor energy per chip to interference energy ratio (Ec/Io). The quality-of-service challenges in the Nigerian telecommunication sector today exist due to the inability to expand and optimize the network as users increase with different real-time applications. Growth in the number of wireless subscribers is currently increasing worldwide, and mobile network operators are compelled to redesign and optimize their network often so that they can handle the ever-increasing network traffic demand [17,19,21,22]. Moreover, since radio bandwidth availability is always limited by the available radio frequency (RF) spectrum, it must be utilized effectively to resolve network coverage and capacity needs [13]. Another major issue in the Nigerian mobile communication sector is the quality of service (QoS) provided by the mobile operators [20]. These are some of the reasons why mobile subscribers in Nigeria and Sub-Saharan Africa still carry two or more mobile phones [20,21].
In Nigeria, most of the telecommunication base stations are powered by diesel generator sets because of unreliable and erratic centralized grid power supply. All telecommunication operators generate their own sources of electricity by continuously running diesel generator sets [4,8,20,21,23]. The mobile telecommunication operators are compelled to rely on diesel power for their operations [15,23]. Most of the diesel-powered generators used to power BTSs consume approximately 34 L per day and 12,444 L in a year. Burning a liter of diesel emits 2.68 kg of CO2 as shown in Table 2, which amounts to 33.3 metric tons of carbon yearly. However, the cost of the energy to power an off-grid site is 21,000 USD on average, and approximately 1700 L is consumed in a month equating to 20,400 L of diesel yearly, leading to about 7.61 metric tons of CO2 is released into the environment. In comparison, an unreliable grid site costs 10,823 USD and consumes approximately 1500 L in a month, equating to 18,000 L yearly, and emits about 6.72 metric tons of CO2 into the environment [24], as shown in Table 2 and Figure 5. However, it is argued that a minimum total of 1.4 million liters of diesel is consumed by all the BTS sites in Nigeria per day [24]. Evidence from Onwuegbuchi implies that 522,388 metric tons of CO2 is released into the atmosphere in Nigeria per day and 191,194,029 is released in a year by mobile telecommunication operators in Nigeria. This implies that the rapid growth of telecommunication sector in Nigeria has an impact on the environment through CO2 emission, which could also affect climate change. Therefore, the search for decision support tools for infrastructure sharing is warranted.
2.3. Colocation Tool Support
Colocation is the use of new telecommunication devices with an existing mast of a mobile telecommunication operator for the purpose of resource reduction through sharing or new customer integration. For the process to be successful, some optimization work typically needs to be carried out with the aid of supporting tools such as NETMAX or Atoll, which are advanced tools for analyzing the performance of a network. communication network analysis (CNA) is an intelligent wireless network tool that supports geographic information system (GIS) and data analysis functions. Geographical Resources Analysis Support System Radio Planning Tool (GRASS-RaPlaT) is an open-source tool with various modules for sectorization due to a given number of antenna radiation patterns that can be used to store complete radio network coverage data. Drones can be used for panoramic views, to survey the area for wide angular view and ensure that there is no blockage or obstruction of the line of sight. Google Earth is another relevant tool to check for elevation and coordinates of the geographical area. To assist with identification of the transmitter to mast allocations to support colocation, in this work several software tools were developed. The tools are described, starting with the underlying modelling and definition of the problem statement, in following section.
3. Mathematical Modelling and Problem Definition
3.1. Cost/Benefit Models
To consider the effects of infrastructure sharing on energy and emissions costs, first consider the general model to relate a telecommunications mast ‘load’ to costs, as presented in Equation (1) below:
where Ci represents costs (energy/fuel or emissions, and infrastructure itself) over a specified period of time for mast i, fi () represents a loading function for mast i and 0 ≤ li ≤ li,max represents a measure of the loading of mast i, including all components such as generators, batteries and RF equipment. In an infrastructure with N such masts and T transmitters, assuming one transmitter is assigned to each mast, we will have N such functions f1(l1), f2(l2), f3(l3), …, fN(lN), with each mast having a specified mast loading level l and the total cost C obtained through summation:
Although arbitrary functions may be used for each of the fi (), in reality they will be likely be discontinuous affine or quadratic functions of the load, for example:
In other words, with no transmitters assigned to the mast, there is effectively zero load, and the mast can be ‘switched off’, and for positive loads with one or more assigned transmitters, the mast is ‘switched on’ with base cost ai for operating the mast and an additional linear dependence upon the loading factor through the term bili for appropriate empirical constants ai and bi. Therefore, with mast colocation and infrastructure sharing, the opportunity arises to potentially minimize the operating costs by moving transmitter loads between masts to minimize the total cost C. Consider for example the effect of shifting load from mast 2 to mast 1 in an N mast system; assuming that l1 + l2 ≤ l1,max, if it holds that f1(l1 + l2) + f2(0) < f1(l1) + f2(l2), then this is a feasible colocation that will reduce the total cost C. One objective of the colocation problem is therefore to find a feasible minimal cost assignment of each of the T transmitters in a system to one of the N masts, with N ≤ T.
3.2. Signal Strength and Coverage Models
It must be remembered, however, that several factors in addition to economic and emissions costs must be considered for telecommunications infrastructure sharing. If a load is reassigned (transferred) from one mast j to another mast i, then there are implications in terms of network coverage, network operability and potentially network reliability issues that must be considered, some of which may even require human ‘expert’ judgement to be assessed. One way in which coverage and operability issues could be considered is to define a number R of receiver locations that are located at strategic areas of a map, which defines the total coverage area under consideration. Such locations could be critical areas of dense urban population, specific points of interest on the map such as the extremal edges or the center of a small town. Alternatively, a grid placed over the entire required coverage area could be employed. As elaborated below, as the number of locations increases, the accuracy of the discrete representation of the coverage area considered in the optimization problem increases, along with the complexity of the optimization problem itself; as with use of coverage simulation tools (e.g., Atoll) human judgement can be employed as needed to dimension the problem accordingly. Suppose that the distance from receiver location k to mast location i is measured at dk,i meters, and mast i is operational. Then, the receiver signal strength rk,i (in dB) from receiver location k to mast location i, assuming a mast base radius of 1 m, can be very well approximated as [5]:
where dBmi is the equivalent received signal strength at the base of the tower i (which can be taken as −43 dB in the absence of other information) and γk,i is the path loss exponent of the channel between mast i and receiver k (which can be taken as ≅ 4.0 in the absence of other information). Both the received signal level at the base of the mast and path loss exponent of the channel can be adjusted as required for a specific network configuration [5]. Clearly, network simulation tools in addition to physical measurements can be deployed to obtain more accurate estimates of receiver power and configuration at these specified locations than raw application of Equation (4) and are encouraged in most cases. In the default (initial) condition for the network, the coverage of the network configuration is given by the indication of certain (assumed acceptable) levels of receiver signal strength at each of the receiver locations given some initial assignment of T transmitters to the N masts. The reassignment of transmitter j to mast i clearly has an impact on the distance, directionality, height and terrain of the signal channel and hence affects receiver signal strength through expression (4). Thus, returning to the previous example, although it may hold that f1(l1 + l2) + f2(0) < f1(l1) + f2(l2), it may well be that for receiver 1, r1,1 << r1,2, and there is a loss of coverage indicated by reduction of signal strength at this location. It may well be the case that the assignment must be discarded due to not meeting performance requirements, as signal strength does not meet some minimum level rk,min. The discussions above may now be formalized into an optimization problem.
3.3. Optimization Problem
The following nonlinear mixed integer mast colocation optimization problem is presented:
Minimize:
Subject to:
where xi,j are introduced as binary decision variables to indicate an assignment of transmitter j with load lj to mast location i, and Equation (5) specifies the total costs for a given assignment of transmitters to masts through these variables. Constraint (6) ensures that a transmitter is assigned to one mast and one mast only, constraint (7) enforces binary behavior in the decision variables and constraint (8) ensures that each individual mast is not overloaded in terms of transmitter loading factor. Constraint (9) requires that the signal strength at each of the receiver locations, for the active masts given by the transmitter assignment specified by the decision variables, achieves the minimum required strength. When each cost function is of the form (3), and the signal strengths rk,i are precomputed and stored in a T-by-N matrix, this can be specified and solved as a mixed integer linear program (MILP). In such a situation, the number of binary decision variables is fixed by the number of transmitters and masts and not directly impacted by the number of receiver locations. However, the number of constraints over the binary decision variables increases with the number of receiver locations. Thus, the problem complexity is not dominated by this measure (number of receivers) but is certainly influenced by it. Modification of constraint (9) to a case in which, say, a certain number of receivers have a signal strength above a certain threshold (coverage metric) is also relatively straightforward. As the dimensions of N, R and T are normally of manageable size in many real-world applications (e.g., 10 masts, 200 receivers, 10 transmitters) this poses no real problems for modern commercial MILP solver packages. In the case of larger problem sizes, the area may potentially be subdivided or the problem instance sub-constrained to reduce combinatorial problem dimensions by splitting areas in which masts cannot feasibly cover cells (e.g., due to excessive distance or unviable path coefficient), either by application of Equation (4) or by expert inspection of signal strength analysis. The simplest way to achieve this splitting algorithmically is to limit the number of feasible transmitter assignments considered by a specific receiver location to those mast locations within a specific radius R of its location, with R set using Equation (4) to upper bound the achievable approximate signal strength for locations outside this distance in ideal path conditions. Exploration of the computational properties of the algorithm and extensions such as these is beyond the scope of the current work and will be considered as future work.
4. Case Study
In order to evaluate the use and effectiveness of the proposed algorithm, a simple implementation was coded into a prototype ICT tool for demonstration purposes (using the open-source MILP solver ‘lp_solve’) and applied to a small (N = 3, T =3) case study in Nigeria. This is described in the following sections.
4.1. Description
The case study is based upon a real three-mast telecommunication network configuration located in Port Harcourt, which is the fifth largest city in Nigeria and lies on the Niger Delta. Details of the location of the three masts are shown in Table 3 below. Each mast is currently operated independently by a telecommunication operator. The goal of the case study is to explore the possibilities of mast colocation using the tools and techniques described in the previous section.
4.2. Configuration of Models
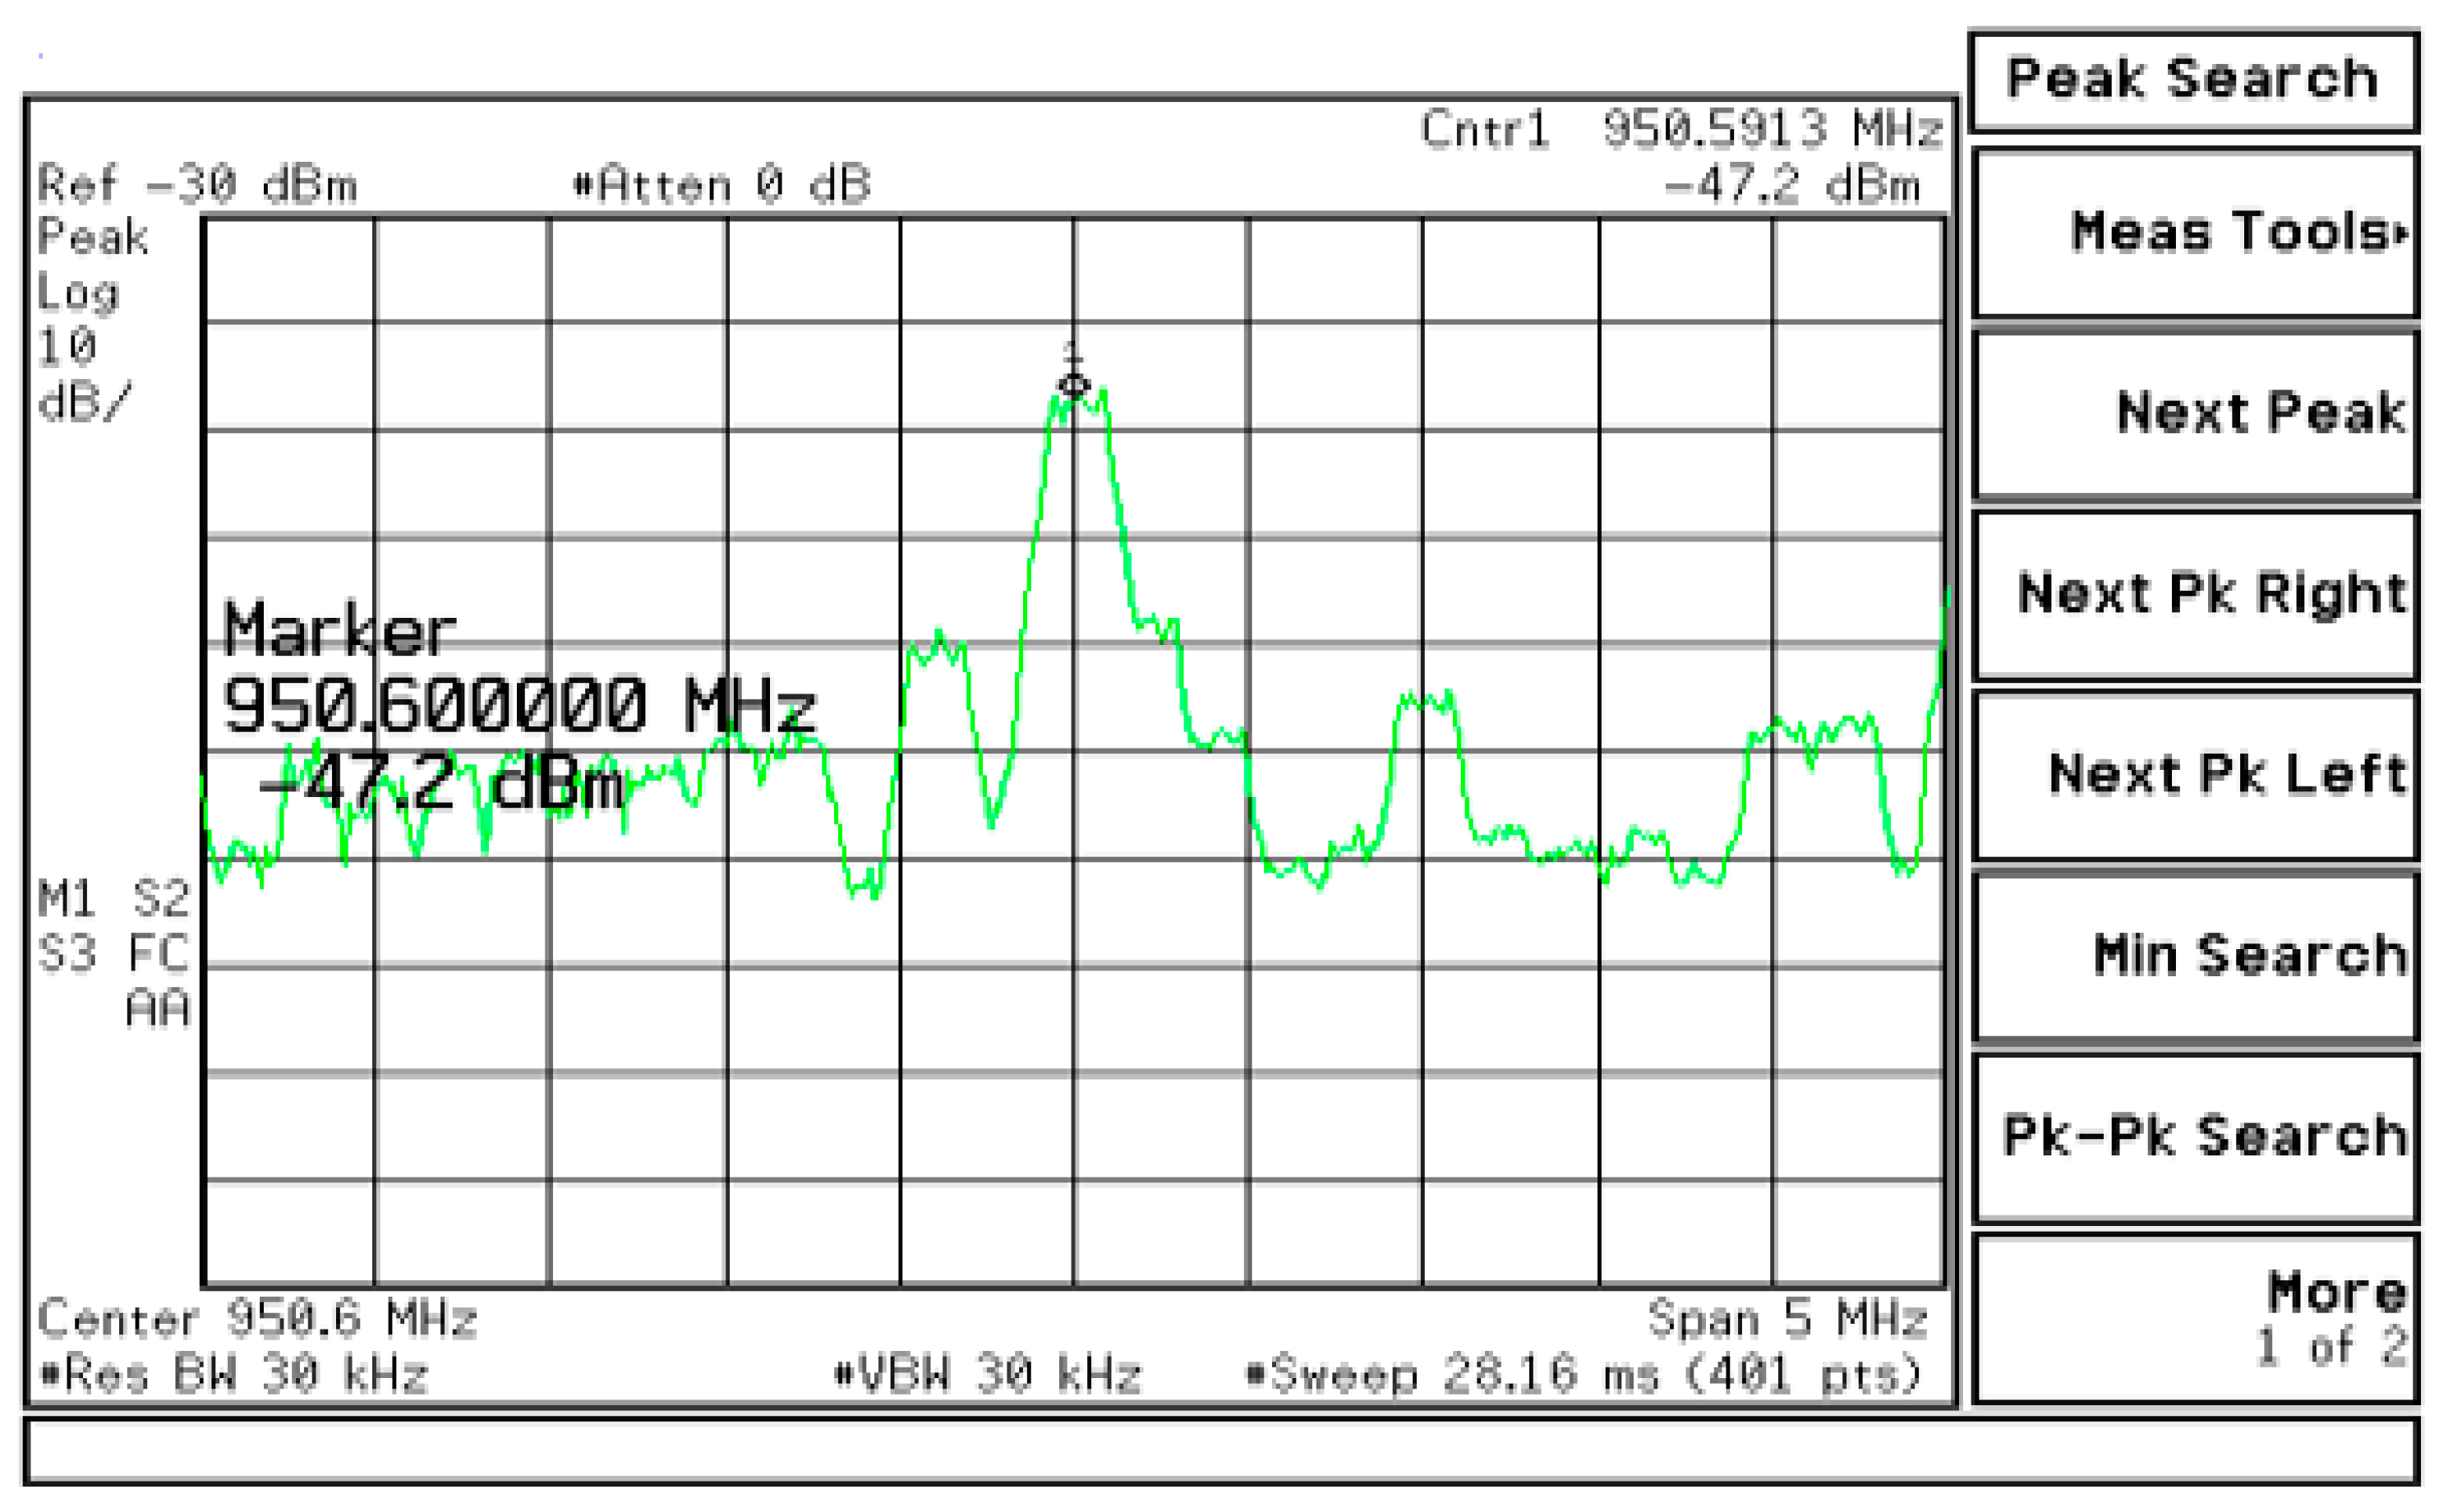
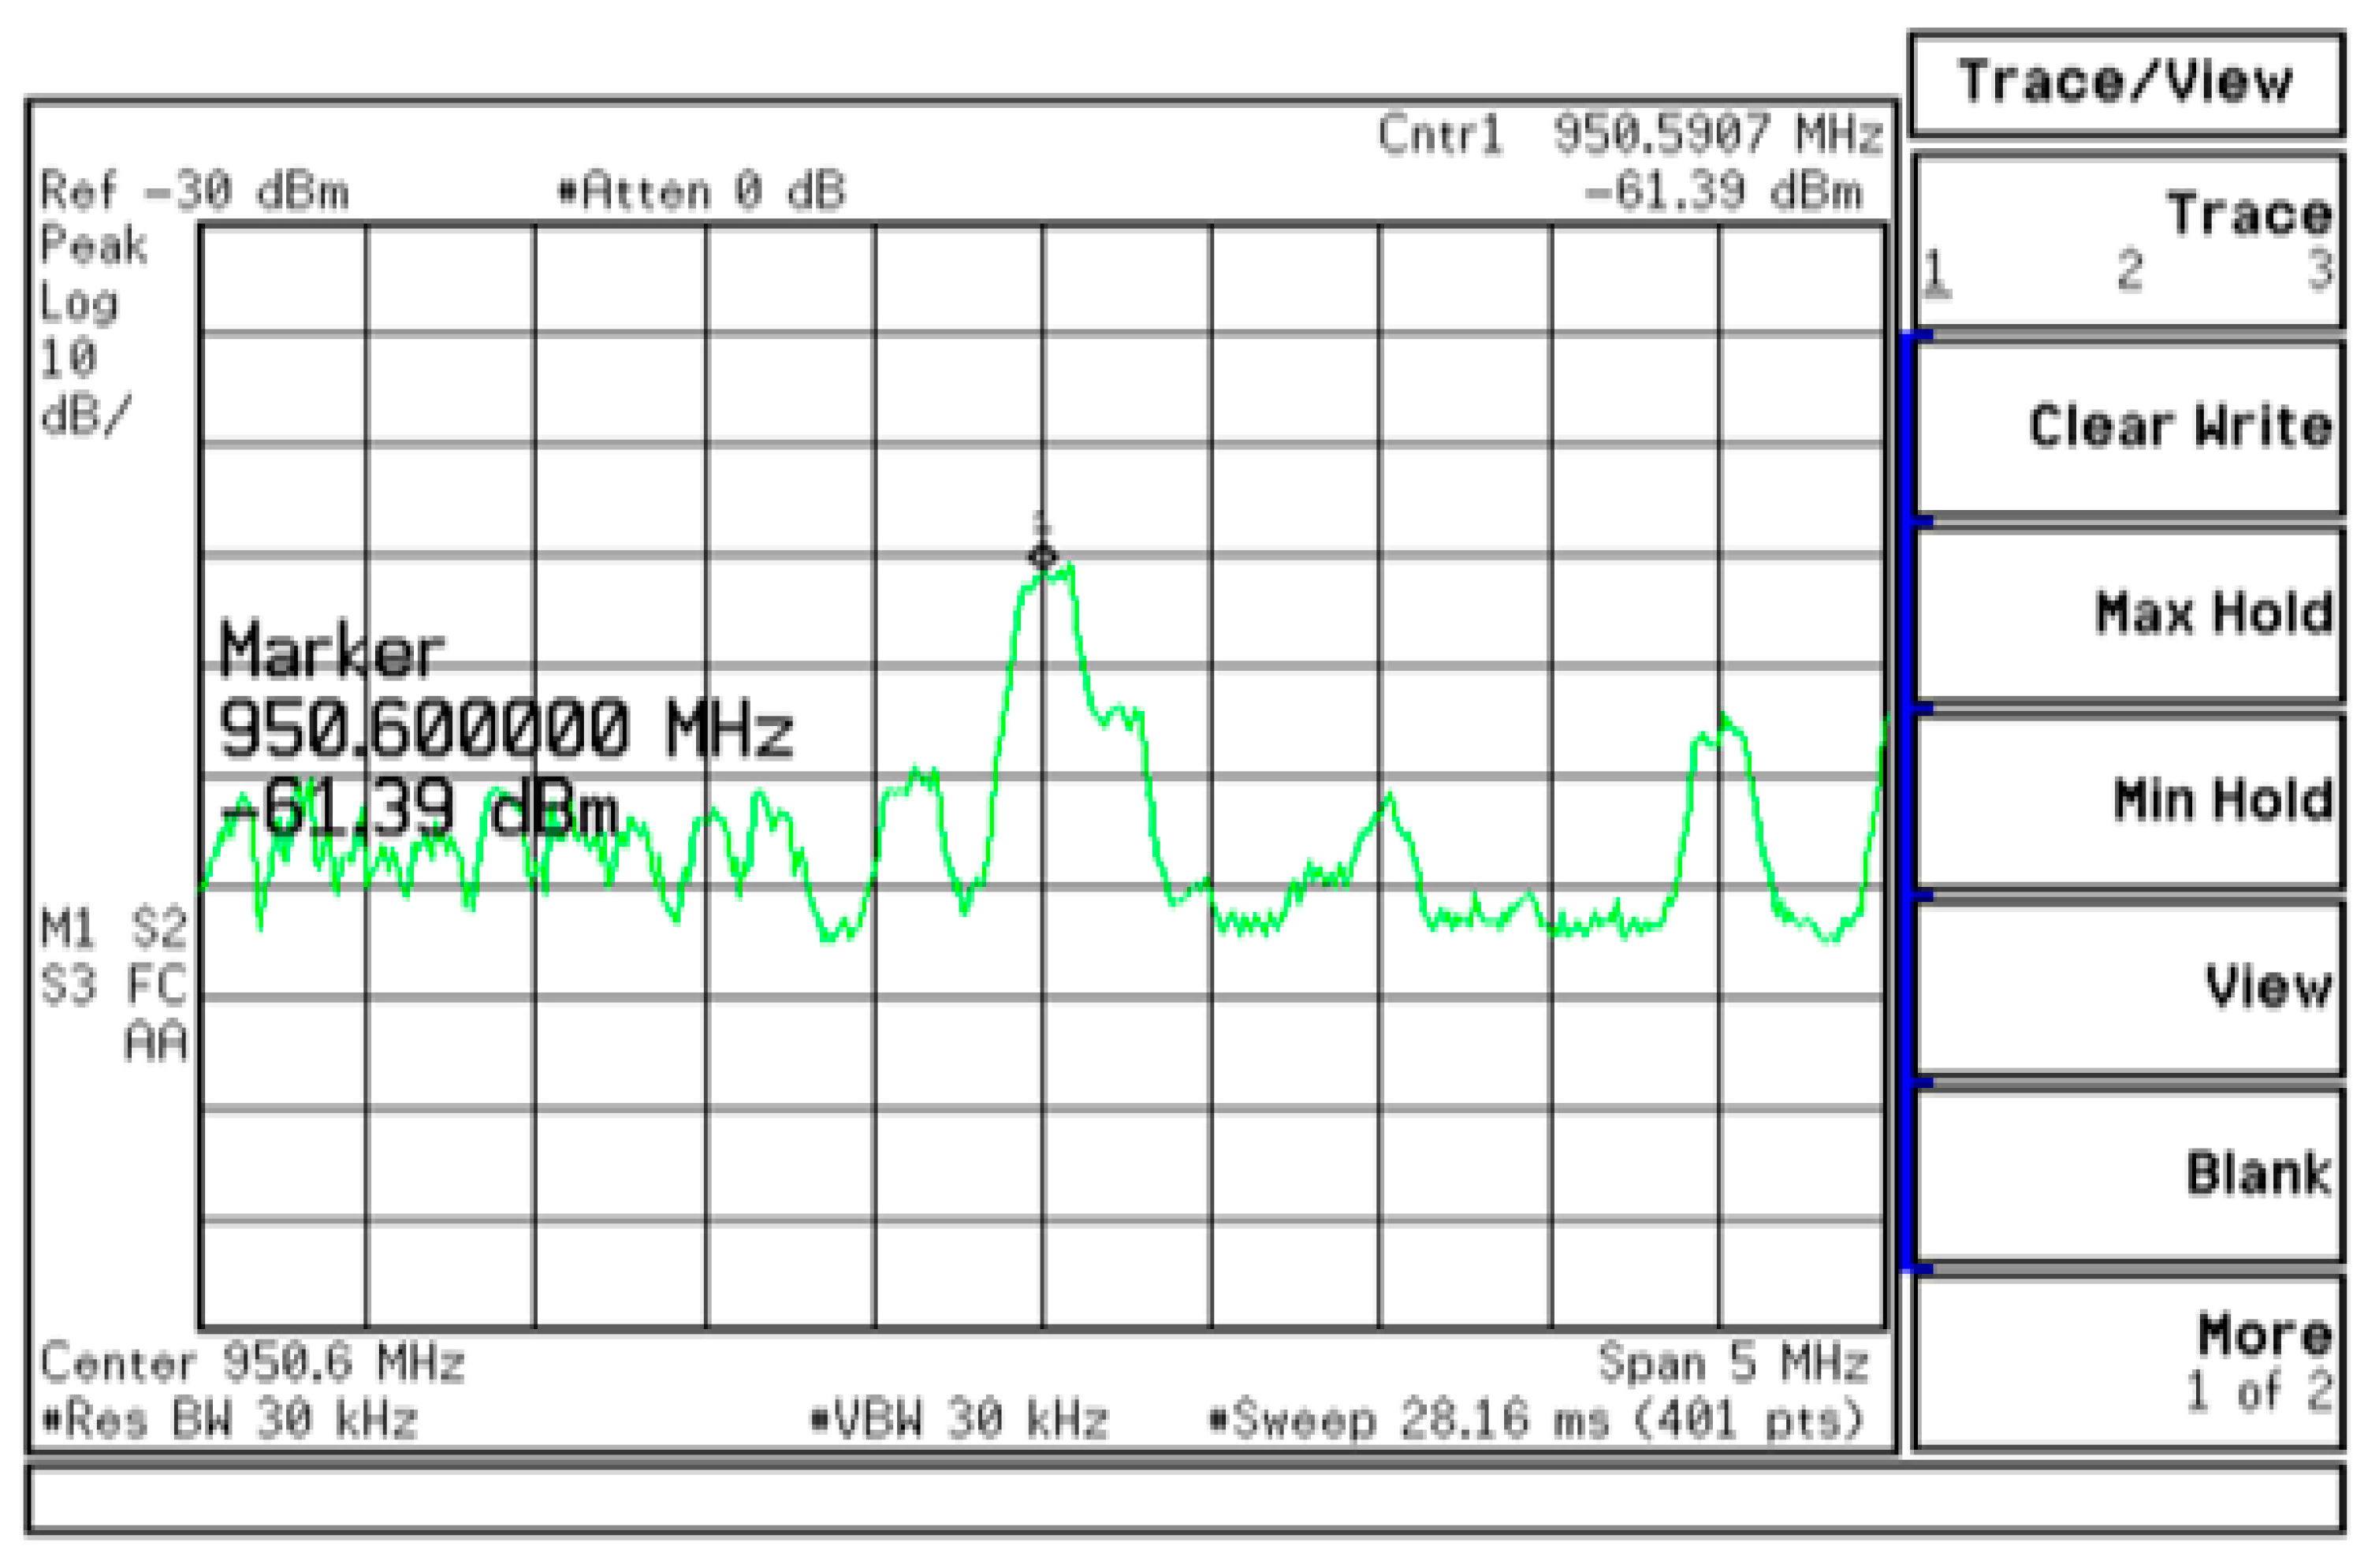
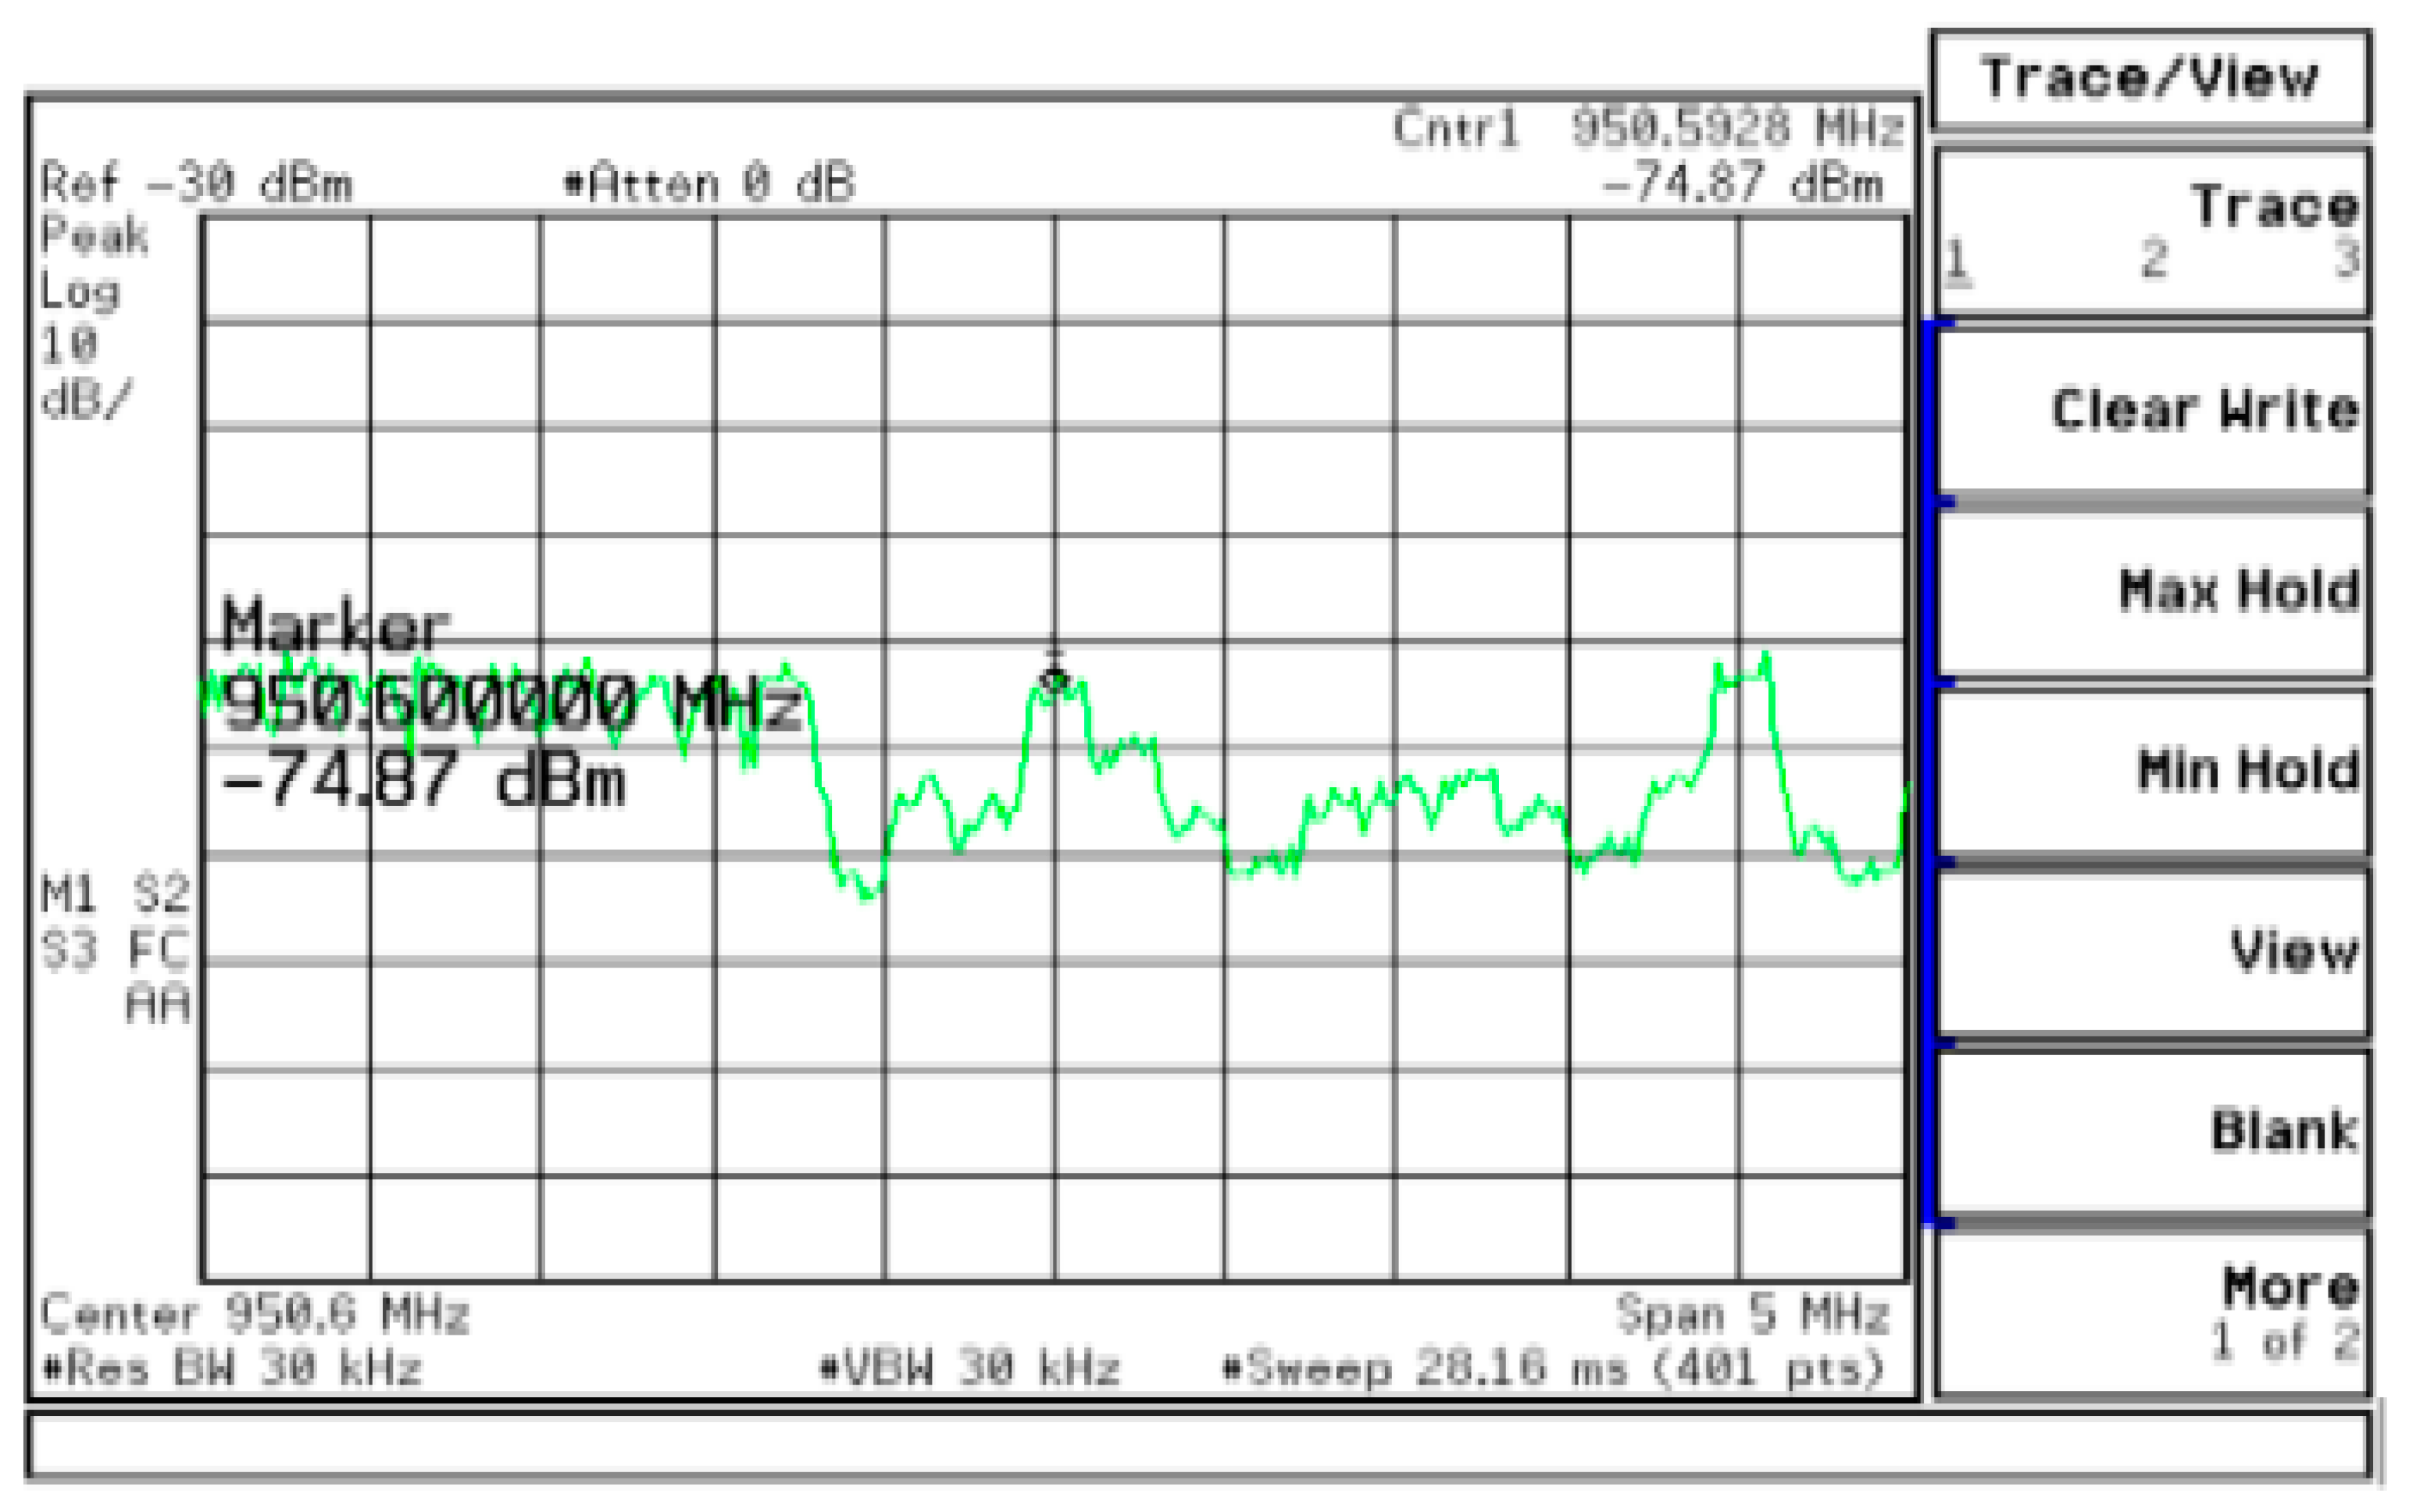
For the three BTSs presented in Table 3, operating in the same network coverage area, the masts heights were determined to be 30, 50 and 70 m, and other parameters such as transmit power and mechanical azimuth were also considered. A physical test drive was conducted in a case study area to obtain relevant data on signal strength and inspect the equipment and components present at each BTS site. Interviews of technical and managerial staff in the mobile telecommunication industry were also performed to gather related information required for the case study. The test drive technique involves using a vehicle, digital electromagnetic set, frequency spectrum analyzer, GPS and a laptop. Specifically, the test drive was undertaken to ascertain the signal quality of the area such as signal intensity, quality and interference, while GPS location coordinates were recorded for map calibration. The results from the drive test showing the various frequencies and antenna gain over different ranges of distances for one of the BTSs are shown in Figure 5, Figure 6 and Figure 7. In engineering, both measurement and modelling are a necessity to achieve a good, reliable outcome [16,17]. For this particular BTS, a channel model giving a good approximate fit to the measurements taken was obtained with dBm1 = −27.75 and γk,1 = 2.99. Similar measurements were also obtained for masts 2 and 3. Costs for each of the BTS sites were then determined, and the data are shown in Table 4 below. These measurements allowed calibration of the required models.
4.3. Infrastructure Sharing Methodology
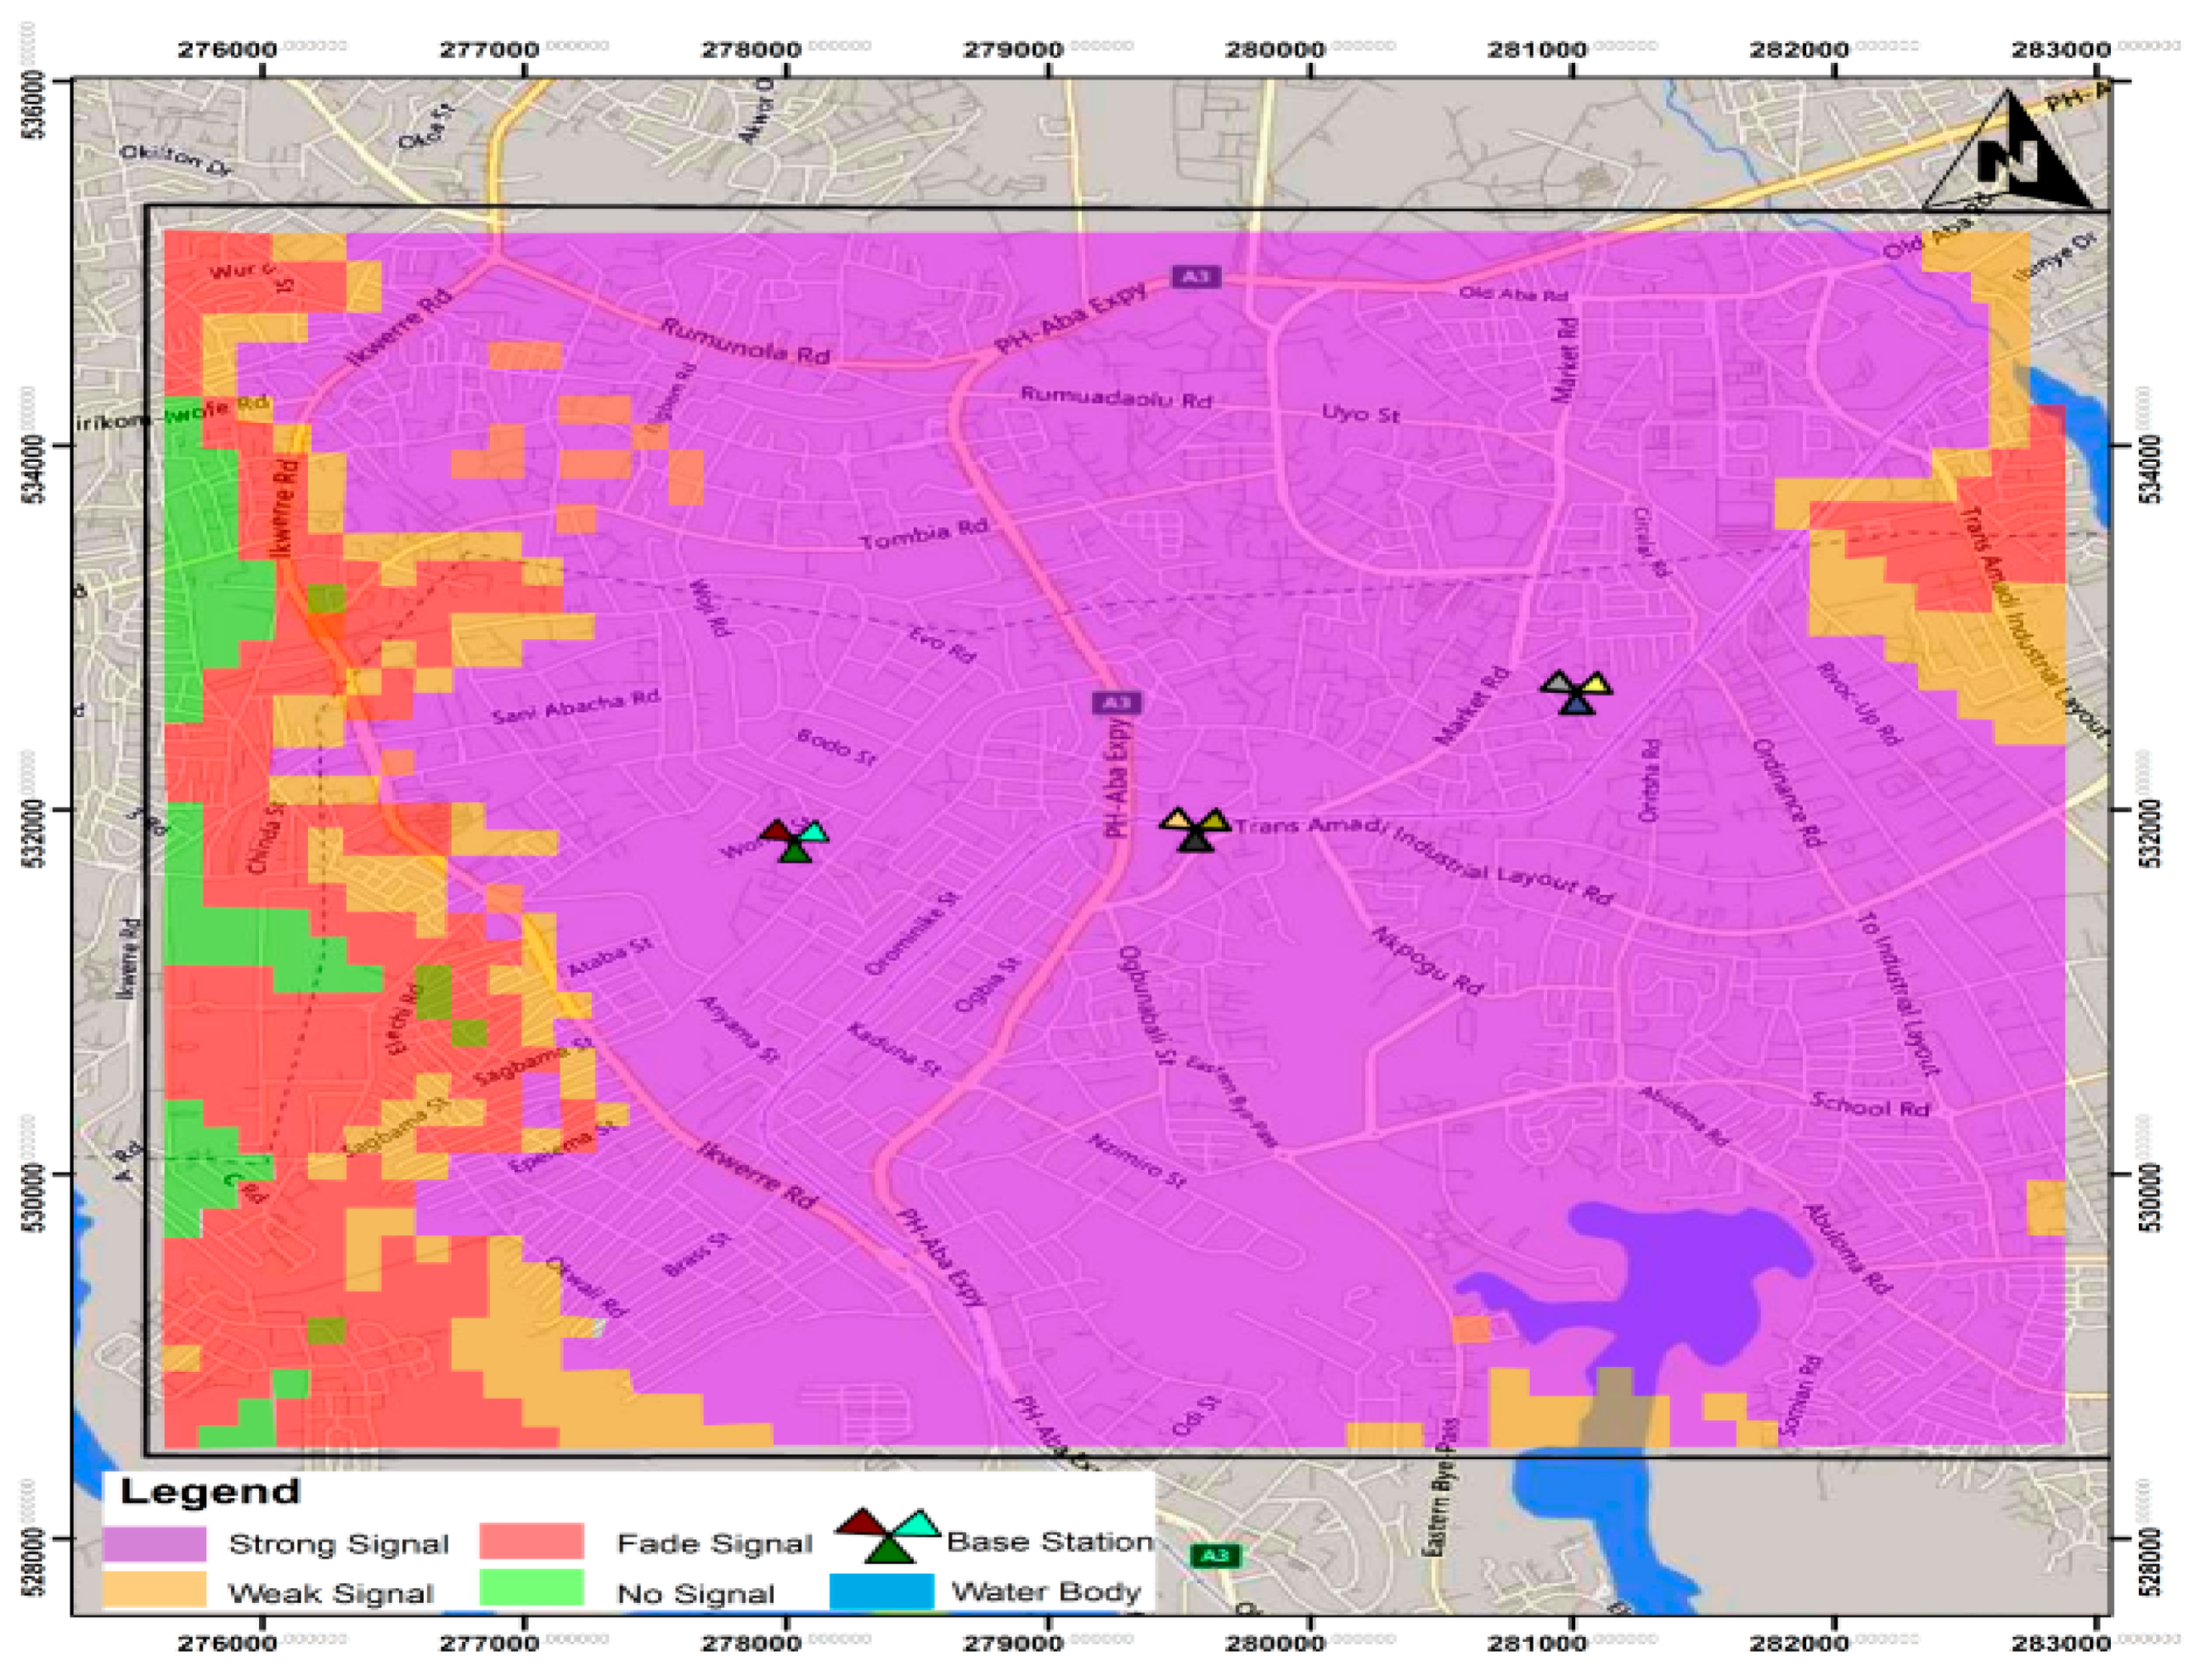
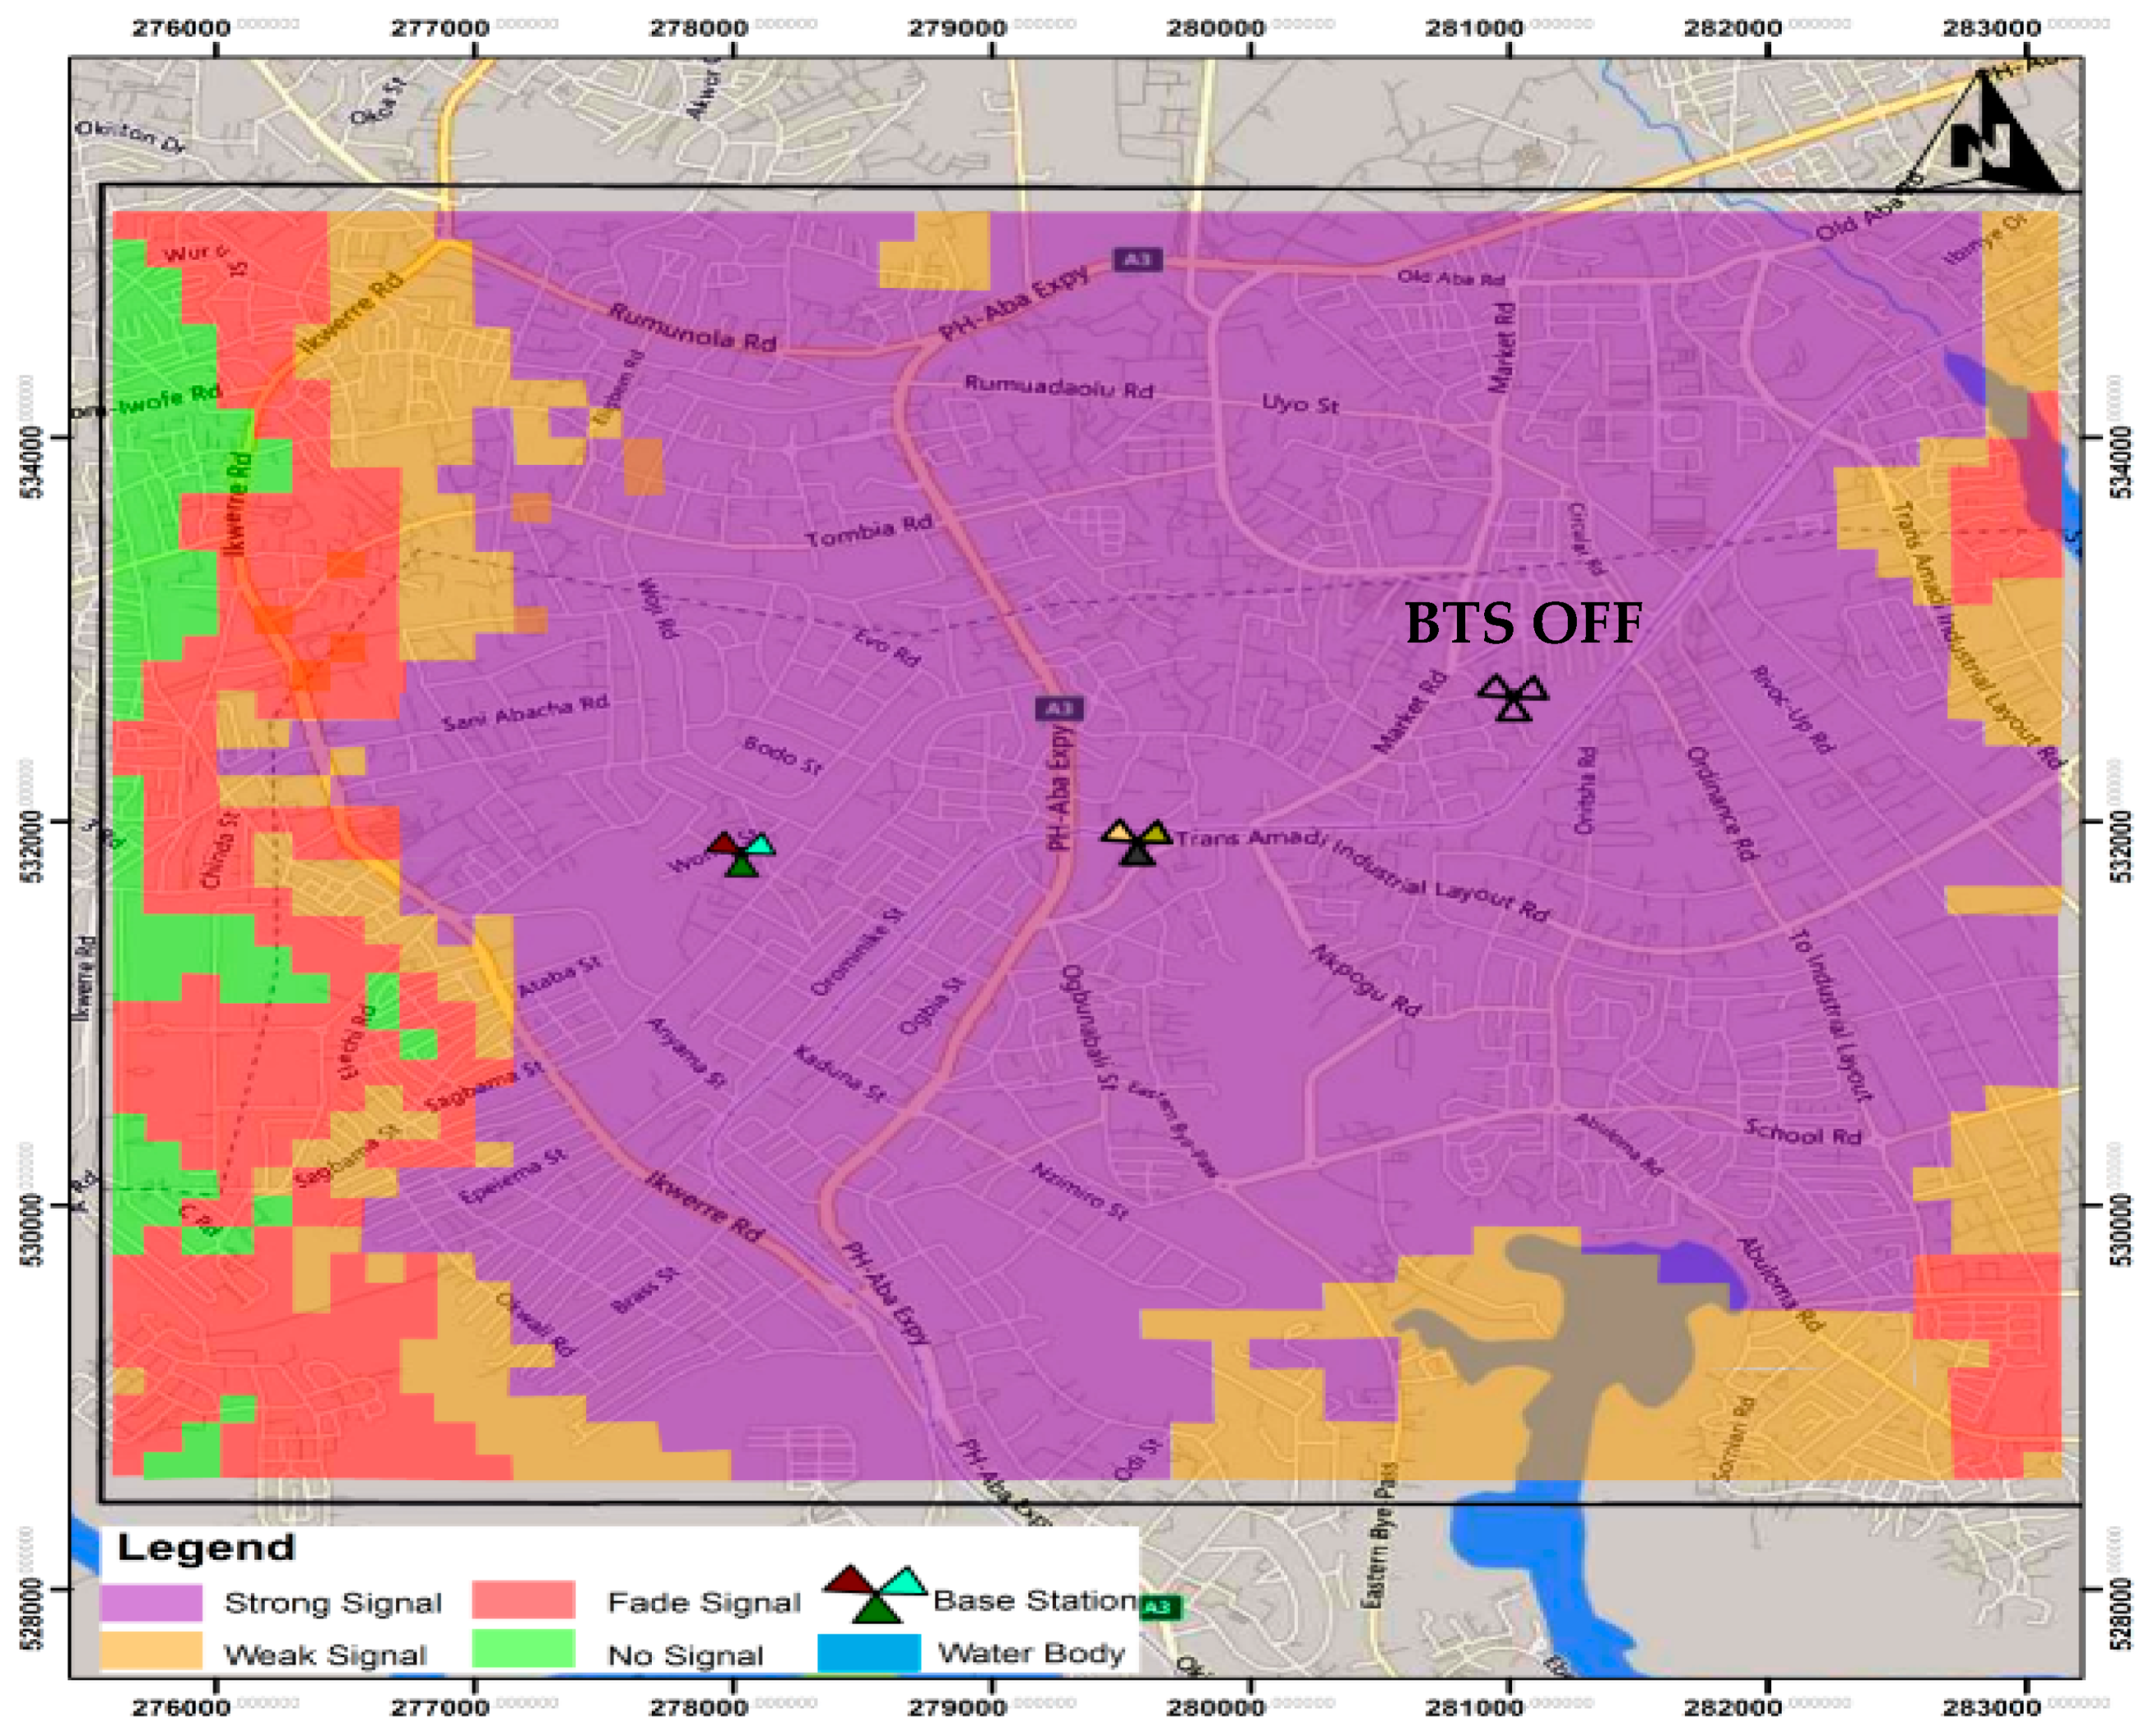
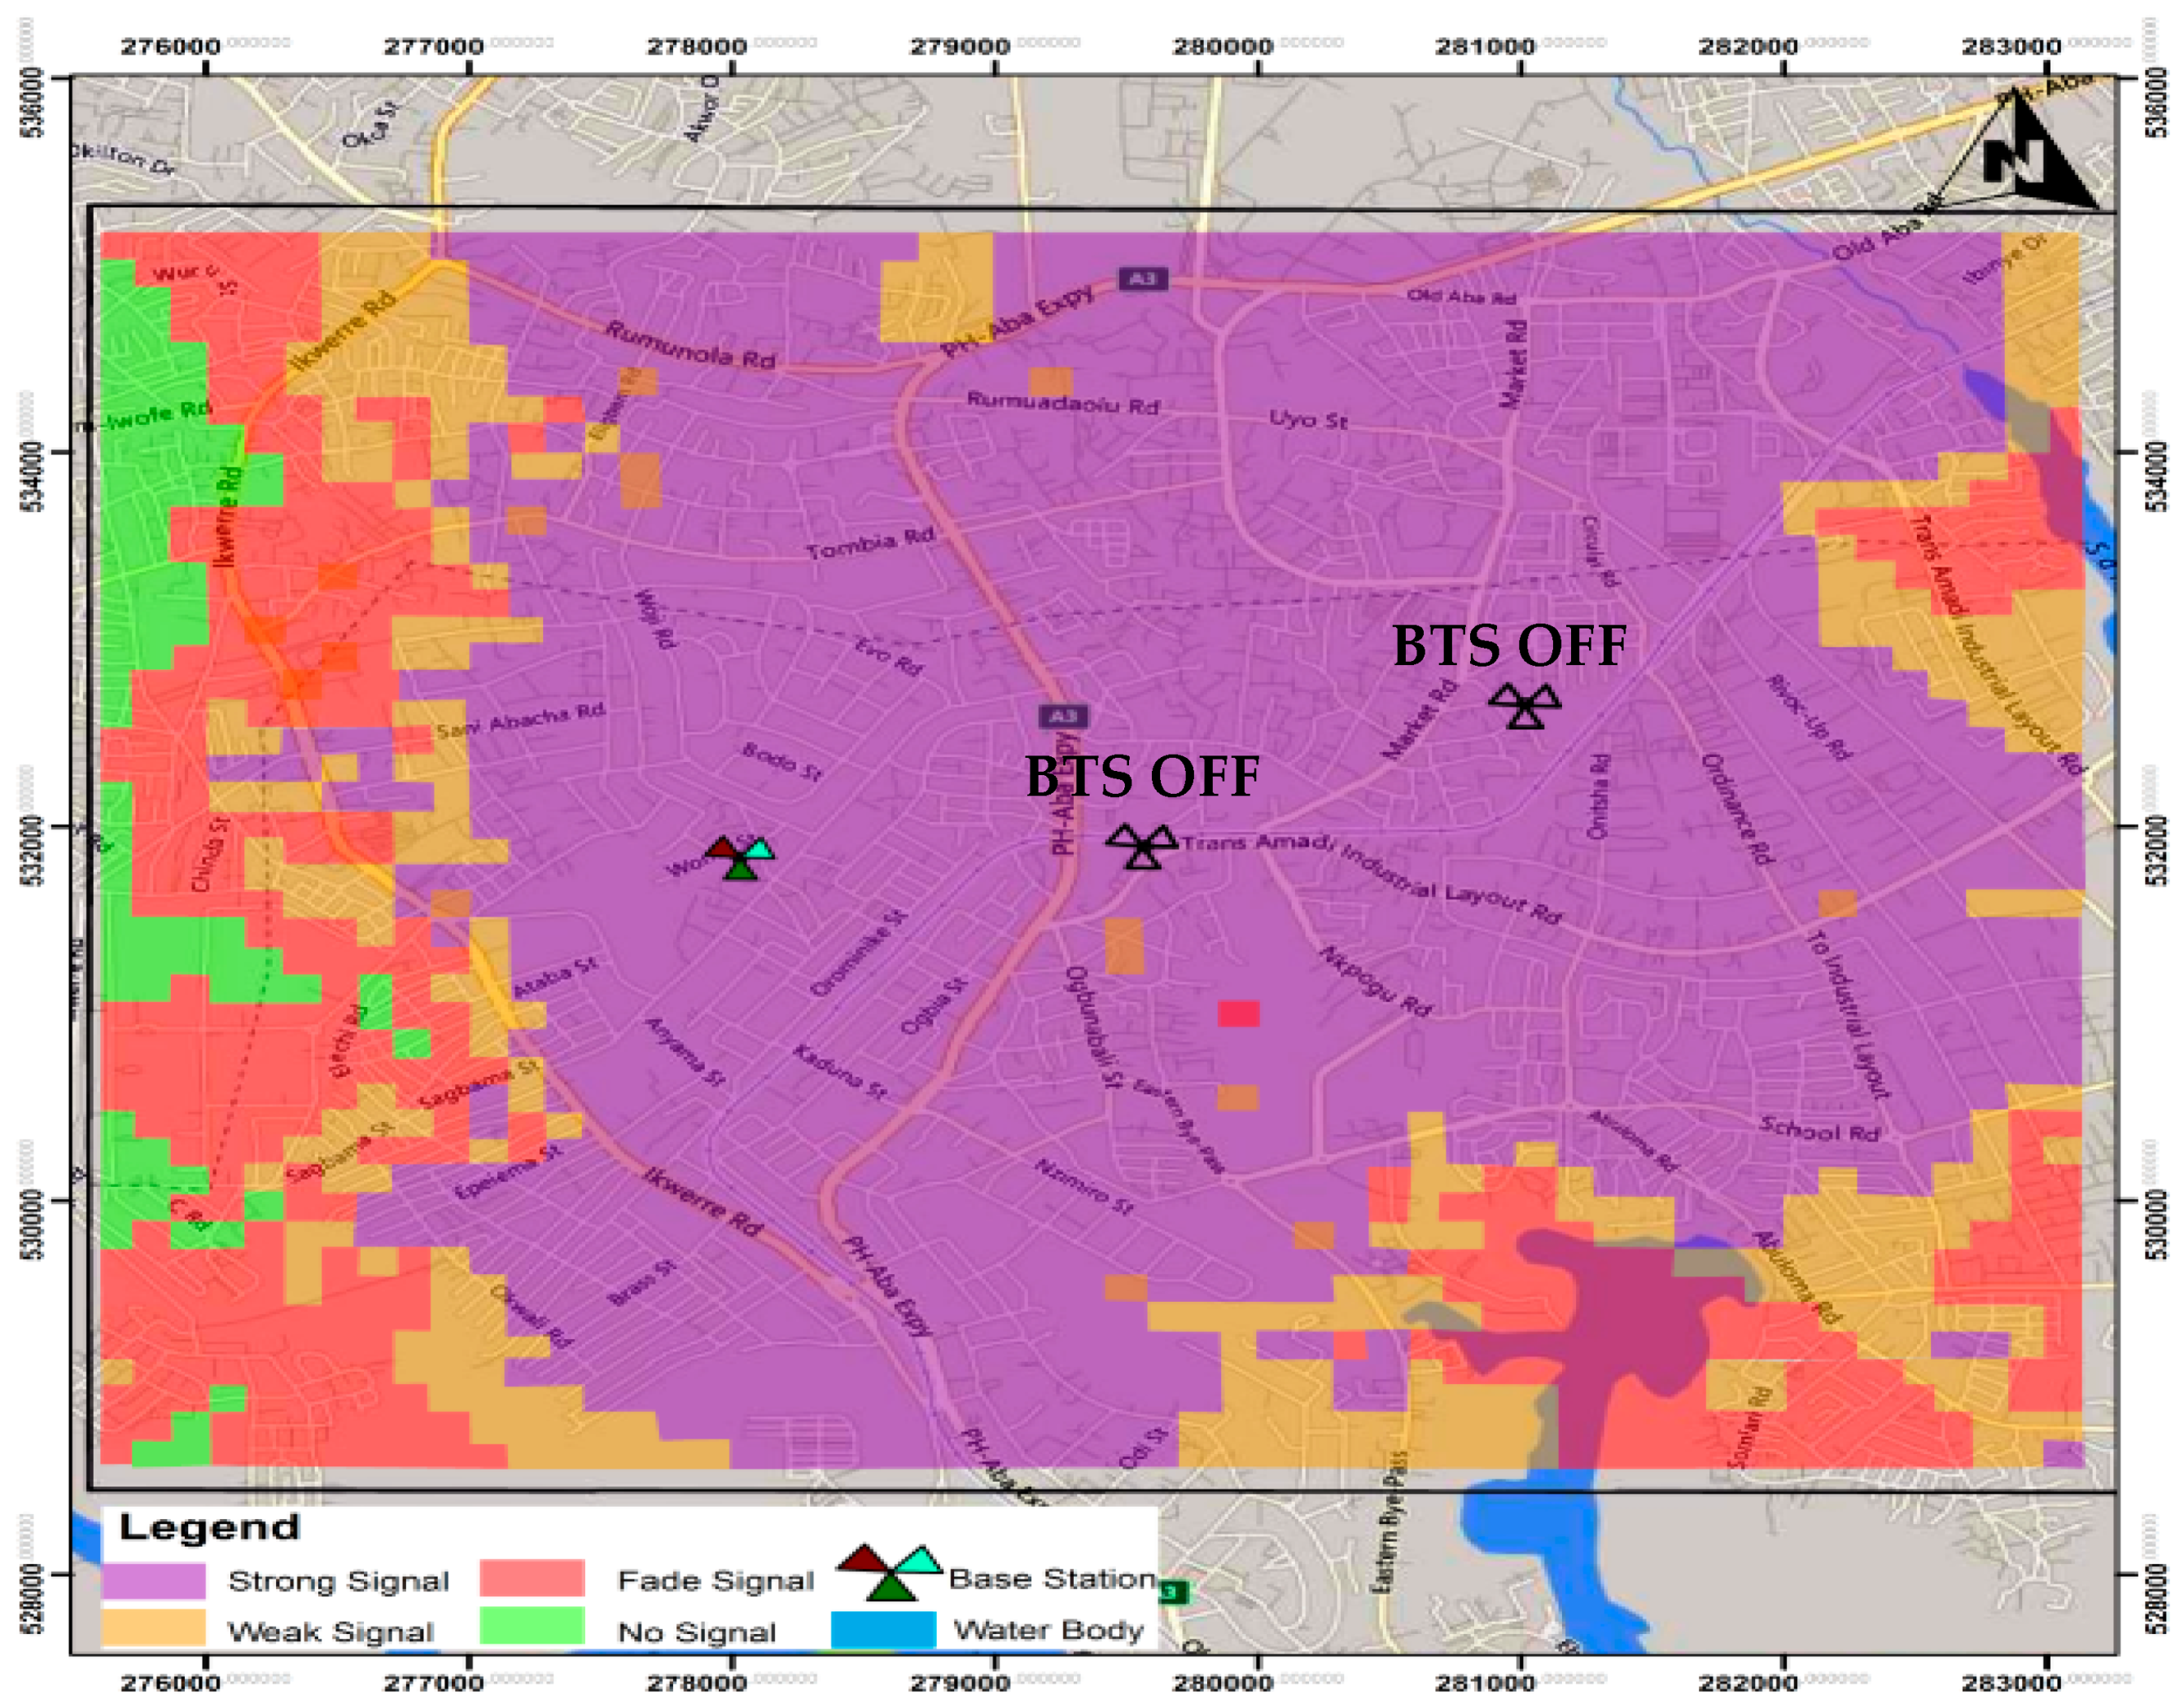
The required coverage area was divided into R = 323 elements in a strategically placed and evenly spaced grid, and the Atoll network simulation tool was used to model three different mobile telecommunication base transceiver stations (BTSs) to ascertain the level of network coverage. Figure 8 shows the network coverage with all three BTSs in place and powered on. Each square box represents 15.62 hectares, and the total network coverage area was 5044.71 hectares. Use of the tool allowed calibration of the matrix of receiver signal strengths rk,i, which were then stored in a T-by-N matrix. In the initial configuration, 81.42% of the grid cells received ‘strong’ network signal strength. In the initial network configuration, for three independent BTSs, it will therefore cost 21,074,000 × 3 = 63,222,000 NGN in total. Using the ICT tool developed, the colocation problem was then solved with constraints in place to achieve (i) ≥ 77.5% network coverage and also (ii) ≥ 75.0% network coverage, where coverage is the percentage of cells that receive ‘strong’ signals. The results obtained are described in the next section, while Figure 9 and Figure 10 display coverage after colocation onto two masts and one mast, respectively.
4.4. Result
A summary of the network coverage data for each of the conditions as obtained for the Atoll tool, using the recommended configurations from the ICT optimization tool, is shown in Table 5. The table shows the network signal strength in terms of weak, fade and no signal coverage across the entire area. For the case in which network coverage should be maintained above 77.5%, a single colocation could be allowed and one mast effectively switched off, as shown in Figure 9 and illustrated in Table 5. For the case in which network coverage should be maintained above 75%, a further colocation could be allowed and two masts effectively switched off, as shown in Figure 10 and also indicated in Table 5. Turning now to network and infrastructure costs, an analysis of the original costs with three independent sites (with coverage 81.42%) and one independent site (with coverage 75.24%) is shown in Table 6. As can be seen from the costs analysis presented, the level of cost can be reduced approximately by 60% if collocation is adhered to, moving from the three BTSs case to the one BTS case as shown in the table above, 237,065,800 NGN will be saved. In terms of equivalent CO2 emissions, when a liter of diesel is burnt, roughly 2.68 kg of CO2 is produced/emitted. Based upon the yearly fuel requirements (18,250 L) of a single BTS site, the yearly CO2 emission by three BTSs is therefore 146,730 kg and for one BTS is 48,910 kg. In this instance, 97,820 kg of CO2 emission can also be prevented through colocation.
4.5. Discussion
Lack of infrastructure sharing is thought to be largely responsible for the high cost of running the telecommunication infrastructure, especially in developing countries. In this paper it is argued that with appropriate ICT tool support, telecommunication infrastructure has high potential to be shared, and colocation can potentially reduce capital and operational expenditure without undue impact on network coverage. In this case study, as reflected in Table 5 and Table 6, this does indeed seem to be the case, and this work provides initial supportive evidence not just for the potential of infrastructure sharing but also an initial validation of the models and algorithm proposed in Section 4 of this paper. Further work, on potentially larger case studies, can explore such concepts in more depth and potentially add further weight to these arguments. The impact of uncontrolled mast erection will lead to proliferation of masts, littering and defacing of the environment. The presence of so many BTSs in a residential environment is causing concern. The case of Nigeria is problematic as the BTSs are powered with diesel fueled electricity generators, posing a threat to the environment. Collapsing masts have been reported in different urban cities in Nigeria, killing several people and injuring others and destroying properties; moreover, the fumes and noise from generators were also reported as problematic. Infrastructure sharing has become one of the most viable options for reducing the total number of BTSs/masts and addressing the associated environmental issues.
5. Conclusions
In order to transform the economy and create a digital society with the goal of long-term sustainable development and economic growth that underpins Society 5.0, there is a need to meet target 9c of the UN Sustainable Development Goals. This goal sets out to ‘Significantly increase access to information and communications technology and strive to provide universal and affordable access to the Internet in least developed countries’. As such, there is need for expansion and transformation of the mobile telecommunication industry in Africa. As has been argued in this paper, and demonstrated through a small case study using a prototype ICT tool, a promising way to achieve sustainable and accessible network coverage seems to be through a combination of infrastructure sharing, allowing cost-effective and cooperative network expansion whereby the various stakeholders in the telecommunication sector will see the largest benefits. As demonstrated by these results in the context of Nigeria, infrastructure sharing has the potential to help in improving the quality of service rendered by mobile network operators and reducing CO2 emission through reduced fuel consumption. This will help in reducing capital expenditure and operational expenditure of mobile network operators through sharing of running costs. As it has been demonstrated, the amount of emitted CO2 will be reduced through reductions in fuel consumption (although other influencing factors need to be considered). This will also potentially help in reducing the proliferation of masts defacing the environment. As a result, subscribers’ tariffs could also be reduced if regulators act appropriately. The results also indicate that infrastructure sharing could help to stimulate economic growth through better deployment of mobile broadband in less developed regions of Nigeria. This may also help in providing better services and network deployment in urban areas that are congested, especially in a situation where new site acquisition is not possible. Future work will involve more precise analysis and the deployment of larger case studies and focus upon the further development and analysis of optimization and decision support tools to support sustainable infrastructure sharing and expansion.
5.1. Managerial/Academic Implications
The managerial implications of this paper will assist low visual impact solutions and address the rising subscriber demand for mobile connectivity in rapidly growing areas. Limited spaces are maximized during colocation, and network coverage and quality are improved. This helps to reduce costs, increase availability and retain control. There is flexibility in colocation management, allowing the core values of the business to be focused on. The benefits of mast sharing must be balanced against future requirements of network operators, as modifications and alterations may be restricted on a shared mast. However, all forms of infrastructure sharing generally reduce costs and prices for consumers as they reduce the investment layout and operational expenditure required to provide a given level of service, while the academic implication will help to create a policy for the expansion of networks into underserved areas that would be unprofitable or have a payback time greater than the business target. This will serve as a resource for further research in the academic world.
This work summarizes the results in terms of actions in regard to colocation of masts for effective resource sharing. In other words, the management effects can be compared to the action pattern results and indicate which option is best. The effects of management have an effect on the data provided in the report and not on how the results are implemented, and the effects of management flow directly with the objectives, summarizing the answers to the questions asked and the evidence supporting the answers. These effects of management identify additional information needed for greater certainty.
5.2. Sustainability and Business Implications
An end to end value chain characterization is required to understand the overall benefits of sustainable access in telecommunication infrastructure. In particular, an environmental dimension needs to be integrated with the business, technology and geographic models of infrastructure sharing. The technology, business and geographic models are broadly reliant on operator bases, collaboration mechanisms with suppliers and future plans of rollout. These issues are widely addressed in various academic journals and governmental reports in terms of short-term economic sustainability, customer satisfaction and network availability. Connectivity is vital for growth. While economic sustainability is imperative, investment in infrastructure and technology development that uses minimal energy resources is decisive. Unless a significant analysis in the end–end value chain is conducted to characterize the economic, technology and growth implications, it is strenuous to identify the benefits in terms of sustainability.
5.3. Limitations of the Work
Larger case studies can explore such concepts in more depth and potentially add further weight to these arguments. The structural strength of the mast was not considered during colocation. The BTS parameters used in the colocation processes are limited to four factors, which are the load of the mast, utility cost, antenna radiation and cell coverage. This work is restricted to telecommunication services in Nigeria.
5.4. Future Studies and Recommendations
For further study, we recommend the formulation of energy use policies (such as the larger development of an optimized energy map for appropriate locations) for positioning BTSs in Nigeria, particularly in the rural off-grid areas. Future work will carry out more precise analysis and deploy larger case studies using the developed prototype ICT tool and focus upon the development of further decision support tools to support infrastructure sharing and expansion. Future work will also analyze performance of the ICT tools, and consider performance enhancements for larger problem sizes such as those suggested in Section 4. In addition, there seems a need to develop a resource management system for optimizing placement of new telecommunication infrastructure (e.g., masts), which could be developed using an adaptation of the algorithm presented in this work. A real-time geospatial GSM infrastructure monitoring technique should be developed to help arrange all GSM infrastructure symmetrically, and there is also a need to develop cost-effective and efficient electronic- and tele-crime monitoring and measurement infrastructure.
Author Contributions
Conceptualization, K.N.A., M.S. and T.C.; data curation, K.N.A.; formal analysis, M.S.; project administration, K.N.A. and M.S.; software, K.N.A. and M.S.; supervision, M.S. and T.C.; validation, K.N.A.; visualization, K.N.A. and M.S.; writing—original draft, K.N.A., M.S., T.C. and R.S.-P.; writing—review & editing, M.S., T.C. and R.S.-P. All authors have read and agreed to the published version of the manuscript.
Funding
This research received no external funding.
Institutional Review Board Statement
Ethical review and approval were waived for this study, due to lack of human participants.
Informed Consent Statement
Not applicable.
Data Availability Statement
The data presented in this study are available on request from the corresponding author. The data are not publicly available due to commercial sensitivity.
Acknowledgments
A preliminary version of this paper was presented at 20th IEEE International Conference on Environment and Electrical Engineering (EEEIC 2020) in Madrid, Spain, in June 2020 [15].
Conflicts of Interest
The authors declare no conflict of interest.
References
- Salgues, B. Society 5.0: Industry of the Future, Technologies, Methods and Tools; John Wiley & Sons: Hoboken, NJ, USA, 2018. [Google Scholar]
- Tavares, M.D.C.D.C.; Azevedo, G.M.D.C. Society 5.0 as a contribution to the sustainable development report. In Advances in Tourism, Technology and Systems; de Carvalho, J.V., Rocha, Á., Liberato, P., Peña, A., Eds.; Springer: Singapore, 2020; Volume 208, pp. 49–63. [Google Scholar]
- The Nigerian Communications Commission. Subscriber Data. 2021. Available online: https://www.ncc.gov.ng/statistics-reports/subscriber-data (accessed on 24 June 2021).
- Nosiri, O.C.; Agubor, C.K.; Akande, A.O.; Ekwuem, E.U. Telecommunication infrastructure sharing, a panacea for sustainability, cost and network performance optimization in Nigeria telecommunication industry. Int. J. Sci. Eng. 2015, 6, 621–626. [Google Scholar]
- Meddour, D.-E.; Rasheed, T.; Gourhant, Y. On the role of infrastructure sharing for mobile network operators in emerging markets. Comput. Netw. 2011, 55, 1576–1591. [Google Scholar] [CrossRef] [Green Version]
- Chanab, L.A. Telecommunication Infrastructure Sharing: Regulatory Enablers and Economic Benefits; Booz Allen Hamilton Consulting: Fairfax County, VA, USA, 2007; pp. 1–12. [Google Scholar]
- MacAfee, R.P.; Lewis, T.R.; Dale, D.J. Introduction to Economic Analysis: Version 2.1. 2009. Available online: https://www.kellogg.northwestern.edu/faculty/dale/ieav21.pdf (accessed on 24 June 2021).
- Otasowie, P.O.; Ezomo, P.I. Life cycle cost analysis of diesel generator set and national grid in Nigeria. J. Emerg. Trends Eng. Appl. Sci. 2014, 5, 363–367. [Google Scholar]
- Surajudeen-Bakinde, N.T.; Amuda, S.A.Y.; Ajibola, T.M. Development of Base Transceiver Station Selection Algorithm for Collocation Arrangement. Niger. J. Technol. 2015, 34, 115–125. [Google Scholar]
- Alenoghena, C.O.; Emagbetere, J.O.; Aibinu, M.A. Artificial intelligence based technique for BTS placement. In Proceedings of the 5th International Conference on Mechatronics (ICOM’13), Kuala Lumpur, Malaysia, 2–4 July 2013; Volume 53, pp. 3–8. [Google Scholar]
- Daily Post. Telecoms Mast Collapses in Port-Harcourt, Kills Three. Available online: https://dailypost.ng/2017/01/24/telecoms-mast-collapses-port-harcourt-kills-three (accessed on 24 June 2021).
- National Environmental Standards and Regulation Enforcement Agency (NESREA). Available online: https://www.nesrea.gov.ng/publications-downloads/laws-regulations/ (accessed on 24 June 2021).
- Agajo, J.; Joseph, O.; Ezewele, S.E.; Theophilus, A. Spatial analysis of signal strength in a wireless communication medium for indoor geolocation system. Int. J. Comput. Theory Eng. 2011, 3, 502–508. [Google Scholar] [CrossRef]
- Olalekan, D.O. The effect of investment in telecommunication on economic growth: Evidence from Nigeria. Int. J. Adv. Res. Technol. 2013, 2, 1–23. [Google Scholar]
- Amadasun, K.; Short, M.; Crosbie, T. Telecommunication infrastructure sharing: A remedy for the reduction of network operator costs and environmental pollution. In Proceedings of the 20th IEEE International Conference on Environment and Electrical Engineering (EEEIC 2020), Madrid, Spain, 9–12 June 2020. [Google Scholar]
- Lorincz, J.; Garma, T.; Petrovic, G. Measurement and modelling of base station power consumption under real traffic loads. Sensors 2012, 12, 4281–4310. [Google Scholar] [CrossRef] [PubMed]
- Lawal, B.Y.; Ukhurebor, K.E.; Adekoya, M.A.; Aigbe, E.E. Quality of service and performance analysis of a GSM network in eagle square, Abuja and its environs, Nigeria. Int. J. Sci. Eng. Res. 2016, 7, 1992–1999. [Google Scholar]
- Akinyemi, L.A.; Makanjuola, N.T.; Shoewu, O.O.; Edeko, F.O. Evaluation and analysis of 3G network in Lagos metropolis, Nigeria. Int. Trans. Electr. Comput. Eng. Syst. 2014, 2, 81–87. [Google Scholar]
- Isabona, J. Maximizing coverage and capacity with QOS guarantee in GSM network by means of cell cluster optimization. Int. J. Adv. Res. Phys. Sci. 2014, 1, 44–55. [Google Scholar]
- GSMA Green Power for Mobile. 2014. Available online: http://www.gsma.com/mobilefordevelopment/wp-content/uploads/2014/11/Africa-Market-Report-GPM-final.pdf (accessed on 24 June 2021).
- Alenoghena, C.O.; Emagbetere, J.O. Base station placement challenges in cellular networks: The Nigerian experience. In Proceedings of the IEEE 4th International Conference on Adaptive Science & Technology (ICAST), Kumasi, Ghana, 25–27 October 2012; pp. 7–11. [Google Scholar]
- Okeke, B.C.; Lazarus, O.; Agajo, J.; Okpe, G.; Kabis, S.D. Analysis and estimation of time of arrival and received signal strength in wireless communication for geolocation. J. Wirel. Sens. Netw. 2016, 3, 55–65. [Google Scholar]
- Alenoghena, C.O.; Ambafi, J.G.; Daud, U.S. Embracing the green communication initiative in powering telecommunication networks in Nigeria. In Proceedings of the IEEE 6th International Conference on Adaptive Science & Technology (ICAST), Ota, Nigeria, 29–31 October 2014. [Google Scholar]
- Onwuegbuchi, C. Operators Use 1.4 Million Litre of Diesel Daily to Power BTS. 2015. Available online: https://www.nigeriacommunicationsweek.com.ng/operators-use-1-4m-litres-of-diesel-daily-to-power-bts/ (accessed on 24 June 2021).
Figure 1.
Proliferation of masts in city of Lagos.

Figure 2.
Diesel plant and mast close to residential building.

Figure 3.
Fallen telecommunication mast and damage to cars.

Figure 4.
Fallen telecommunication mast and damage to buildings.

Figure 5.
Measurement taken from mast 1 at 300 m distance.

Figure 6.
Measurement taken from mast 1 at 1400 m distance.

Figure 7.
Measurement taken from mast 1 at 2000 m distance.

Figure 8.
Area coverage with three BTSs on.

Figure 9.
Area coverage with two BTSs on.

Figure 10.
Area coverage with one BTS on.


Table 1.
Infrastructure sharing components.
| Passive Components | Active Components |
|---|---|
| Sites | Base Stations |
| Towers/Masts | Microwave Radio Equipment |
| Shelters | Switches |
| Power Supply | Antennas |
| Easements | Transceivers |
| Ducts | Frequency Spectrum |
| Air Conditioners | Roaming |
Table 2.
The quantity of diesel consumed and CO2 emission by BTSs in Nigeria.
| Title 1 | Numeric Value | Unit |
|---|---|---|
| Number of BTSs using on Grid Power | 4000 | Count |
| Number of BTSs using off Grid Power | 36,000 | Count |
| Quantity of Diesel Consumed (on Grid) | 80,000 | Liters/Day |
| Quantity of Diesel Consumed (off Grid) | 1,224,000 | Liters/Day |
| Cost of Diesel (on Grid) | 33,600 | £/Day |
| Cost of Diesel (off Grid) | 514,080 | £/Day |
| CO2 Emissions (on Grid) | 214.4 | Tonnes/Day |
| CO2 Emissions (off Grid) | 3280.32 | Tonnes/Day |
Table 3.
BTSs used for the case study.
| Operator | GPS Coordinate | Address | Local Govt. Area |
|---|---|---|---|
| A | N 04 48′31.0″ E 006 59′55.0″ | 5 Wondi Street GRA III Olu-Obasanjo Road | Phalga |
| B | N 04 47′56.9″ E 007 00′29.9″ | 3 Amadi Operi Close Ogbunabali | Phalga |
| C | N 04 48′58.0″ E 007 01′31.8″ | 20 Ethinthinwa Street Elekhahia | Phalga |
Table 4.
BTS cost used for the case study.
| S/N | Items | Unit | Cost (NGN) |
|---|---|---|---|
| 1 | Land | 1 | 200,000 |
| 2 | Diesel generator | 2 | 6,000,000 |
| 3 | Diesel consumption/year | 18,250 | 4,161,000 |
| 4 | Battery | 24 | 4,320,000 |
| 5 | BTS radio | 1 | 1,500,000 |
| 6 | BTS antenna | 3 | 360,000 |
| 7 | Mast | 1 | 4,000,000 |
| 8 | Duplexer | 1 | 145,000 |
| 9 | Rectifier | 1 | 48,000 |
| 10 | Power amplifier | 1 | 190,000 |
| 11 | Converter | 1 | 25,000 |
| 12 | Air conditioner | 1 | 125,000 |
| 13 | Diesel storage tank | 1 | 150,000 |
| Total | 21,224,000 |
Table 5.
BTS signal strength coverage and area.
| Three Base Stations | Two Base Stations | One Base Station | |||||||
|---|---|---|---|---|---|---|---|---|---|
| Signal | Area (ha) | % | Boxes | Area (ha) | % | Boxes | Area (ha) | % | Boxes |
| Strong | 4108.06 | 81.42 | 263 | 3967.48 | 78.64 | 254 | 3795.66 | 75.24 | 243 |
| Weak | 359.26 | 7.12 | 23 | 562.23 | 11.15 | 36 | 484.22 | 9.60 | 31 |
| Fade | 437.36 | 8.67 | 28 | 359.26 | 7.12 | 23 | 562.32 | 11.15 | 36 |
| No signal | 150.58 | 2.79 | 9 | 150.62 | 3.10 | 10 | 203.06 | 4.03 | 13 |
| Total | 5044.71 | 100.00 | 323 | 5044.71 | 100.00 | 232 | 5044.71 | 100.00 | 323 |
Table 6.
Unit cost of components for original and collocated sites.
| 3 Independent Sites | 3 Colocated Sites | ||||
|---|---|---|---|---|---|
| SN | Item | Unit | Cost (NGN) | Unit | Cost (NGN) |
| 1 | Diesel generator | 3 | 18,000,000 | 1 | 6,000,000 |
| 2 | Land rent | 3 | 600,000 | 1 | 200,000 |
| 3 | Air conditioner | 3 | 375,000 | 1 | 125,000 |
| 4 | Mast | 3 | 12,000,000 | 1 | 4,000,000 |
| 5 | Power backup battery | 72 | 311,040,000 | 24 | 103,680,000 |
| 6 | Rectifier | 3 | 144,000 | 1 | 48,000 |
| 7 | Power amplifier | 3 | 570,000 | 1 | 190,000 |
| 8 | Converter | 3 | 750,000 | 1 | 250,000 |
| 9 | Diesel consumed (Liters) | 54,759 | 12,483,000 | 21,900 | 4,993,200 |
| 10 | Diesel tank | 3 | 450,000 | 1 | 150,000 |
| 11 | Duplexer | 3 | 435,000 | 1 | 145,000 |
| Total | 356,847,000 | 119,781,200 | |||
Publisher’s Note: MDPI stays neutral with regard to jurisdictional claims in published maps and institutional affiliations. |
© 2021 by the authors. Licensee MDPI, Basel, Switzerland. This article is an open access article distributed under the terms and conditions of the Creative Commons Attribution (CC BY) license (https://creativecommons.org/licenses/by/4.0/).
Share and Cite
MDPI and ACS Style
Amadasun, K.N.; Short, M.; Shankar-Priya, R.; Crosbie, T. Transitioning to Society 5.0 in Africa: Tools to Support ICT Infrastructure Sharing. Data 2021, 6, 69. https://0-doi-org.brum.beds.ac.uk/10.3390/data6070069
AMA Style
Amadasun KN, Short M, Shankar-Priya R, Crosbie T. Transitioning to Society 5.0 in Africa: Tools to Support ICT Infrastructure Sharing. Data. 2021; 6(7):69. https://0-doi-org.brum.beds.ac.uk/10.3390/data6070069
Chicago/Turabian StyleAmadasun, Kennedy Nomamidobo, Michael Short, Rajesh Shankar-Priya, and Tracey Crosbie. 2021. "Transitioning to Society 5.0 in Africa: Tools to Support ICT Infrastructure Sharing" Data 6, no. 7: 69. https://0-doi-org.brum.beds.ac.uk/10.3390/data6070069