
Contemporary Business Analytics: An Overview


1
Gabelli School of Business, Fordham University, New York, NY 10023, USA
2
Koppelman School of Business, Brooklyn College of the City University of New York, Brooklyn, NY 11210, USA
*
Author to whom correspondence should be addressed.
Data 2021, 6(8), 86; https://0-doi-org.brum.beds.ac.uk/10.3390/data6080086
Submission received: 28 June 2021
/
Revised: 30 July 2021
/
Accepted: 31 July 2021
/
Published: 4 August 2021
(This article belongs to the Special Issue Challenges in Business Intelligence)
Abstract
:We examine the state-of-the-art of the business analytics field by identifying and describing the four types of analytics and the three pillars of modeling. Further, we offer a framework of the interplay between the types of analytics and those pillars of modeling. The article describes the architectural framework and outlines an analytics methodology life cycle. Additionally, key contemporary design issues and challenges are highlighted. In this paper, we offer researchers and practitioners a contemporary overview of business analytics. As business analytics has emerged as a distinct discipline with the key objective to gain insight to make informed decisions, this state-of-the art survey sheds light on recent developments in the business analytics discipline.
1. Introduction
The past several years has seen an exponential increase both in the number of available information technology (IT) applications and their use by businesses [1]. This trend is supported by several developments: government stimulation in the way of laws and regulations, the proliferation and availability of various applications, the rapidly declining costs of acquisition and storage of structured and unstructured data, the adoption of interoperability and standards, and, most importantly, business transformation via IT [1]. It is not surprising, therefore, that data acquisition is increasing substantially across different types of IT, including databases, web applications, enterprise resource planning (ERP), customer relationship management (CRM), supply chain management (SCM), etc.
Data is also being accumulated in various web 2.0 and social media applications, such as Twitter, Facebook, YouTube, blogs, and wikis, as well as via email messages and mobile applications. The forms of data include numerical, audio, textual, video, and unstructured. These high volumes of data are collected for, among other reasons, compliance and regulation reporting. Stakeholders in various businesses and industries recognize the opportunity and potential for exploiting their large datasets with advanced analysis to gain insight for making informed business decisions, thereby improving quality of decisions and business outcomes [1,2,3,4,5,6,7,8]. However, the challenge lies in harnessing the data from multiple sources into coherent business intelligence by effectively adding context, interpretation, and reflection [9]. This is where analytics comes into play by enabling the conversion of information into knowledge [10,11] for effective decision-making [12].
While some aspects of analytics, such as the use of statistical models, data mining and machine learning, and artificial intelligence, have existed for decades, only recently have more advanced and sophisticated information technologies and tools been available to support decision-making in an integrated fashion [13,14,15,16,17]. In this research, business analytics is used as a generic term that consolidates the various dimensions of analysis [18,19,20,21]. The range of technologies and tools—databases, data warehouses, CRM, ERP, SCM, web applications, and others—are integrated for interoperability and the seamless processing of business data for insight [22]. Such integrated applications help decision-makers, such as managers and executives, understand and make sense of business data [23,24,25].
2. Business Analytics
We define business analytics as the “application of models, methods, and tools to the analysis of data to gain insight to make informed decisions [26,27,28,29]”. Models include statistical (e.g., regression), machine learning and data mining (e.g., clustering), artificial intelligence (e.g., search, planning), domain (e.g., in finance), net present value (NPV), return on investment (ROI), internal rate of return (IRR) etc.), and general models (Monte Carlo simulation, etc.). Methods include such alternatives as visualization, numerical outputs, etc. Tools include business intelligence analytic tools (e.g., Tableau, Tibco Spotfire, Qliksense, Alteryx, etc.) and programming languages (e.g., Python, R). In this context, business analytics is the use of data, information technology, statistical analysis, quantitative methods, and mathematical computer-based models and visualization to help decision-makers gain improved insight about stakeholders (such as customers, suppliers, etc.) and make better, fact-based decisions [30,31,32,33,34,35,36]”. The key is to be ‘data-driven’ in decision-making. Let the data ‘reveal’ itself and inform choices.
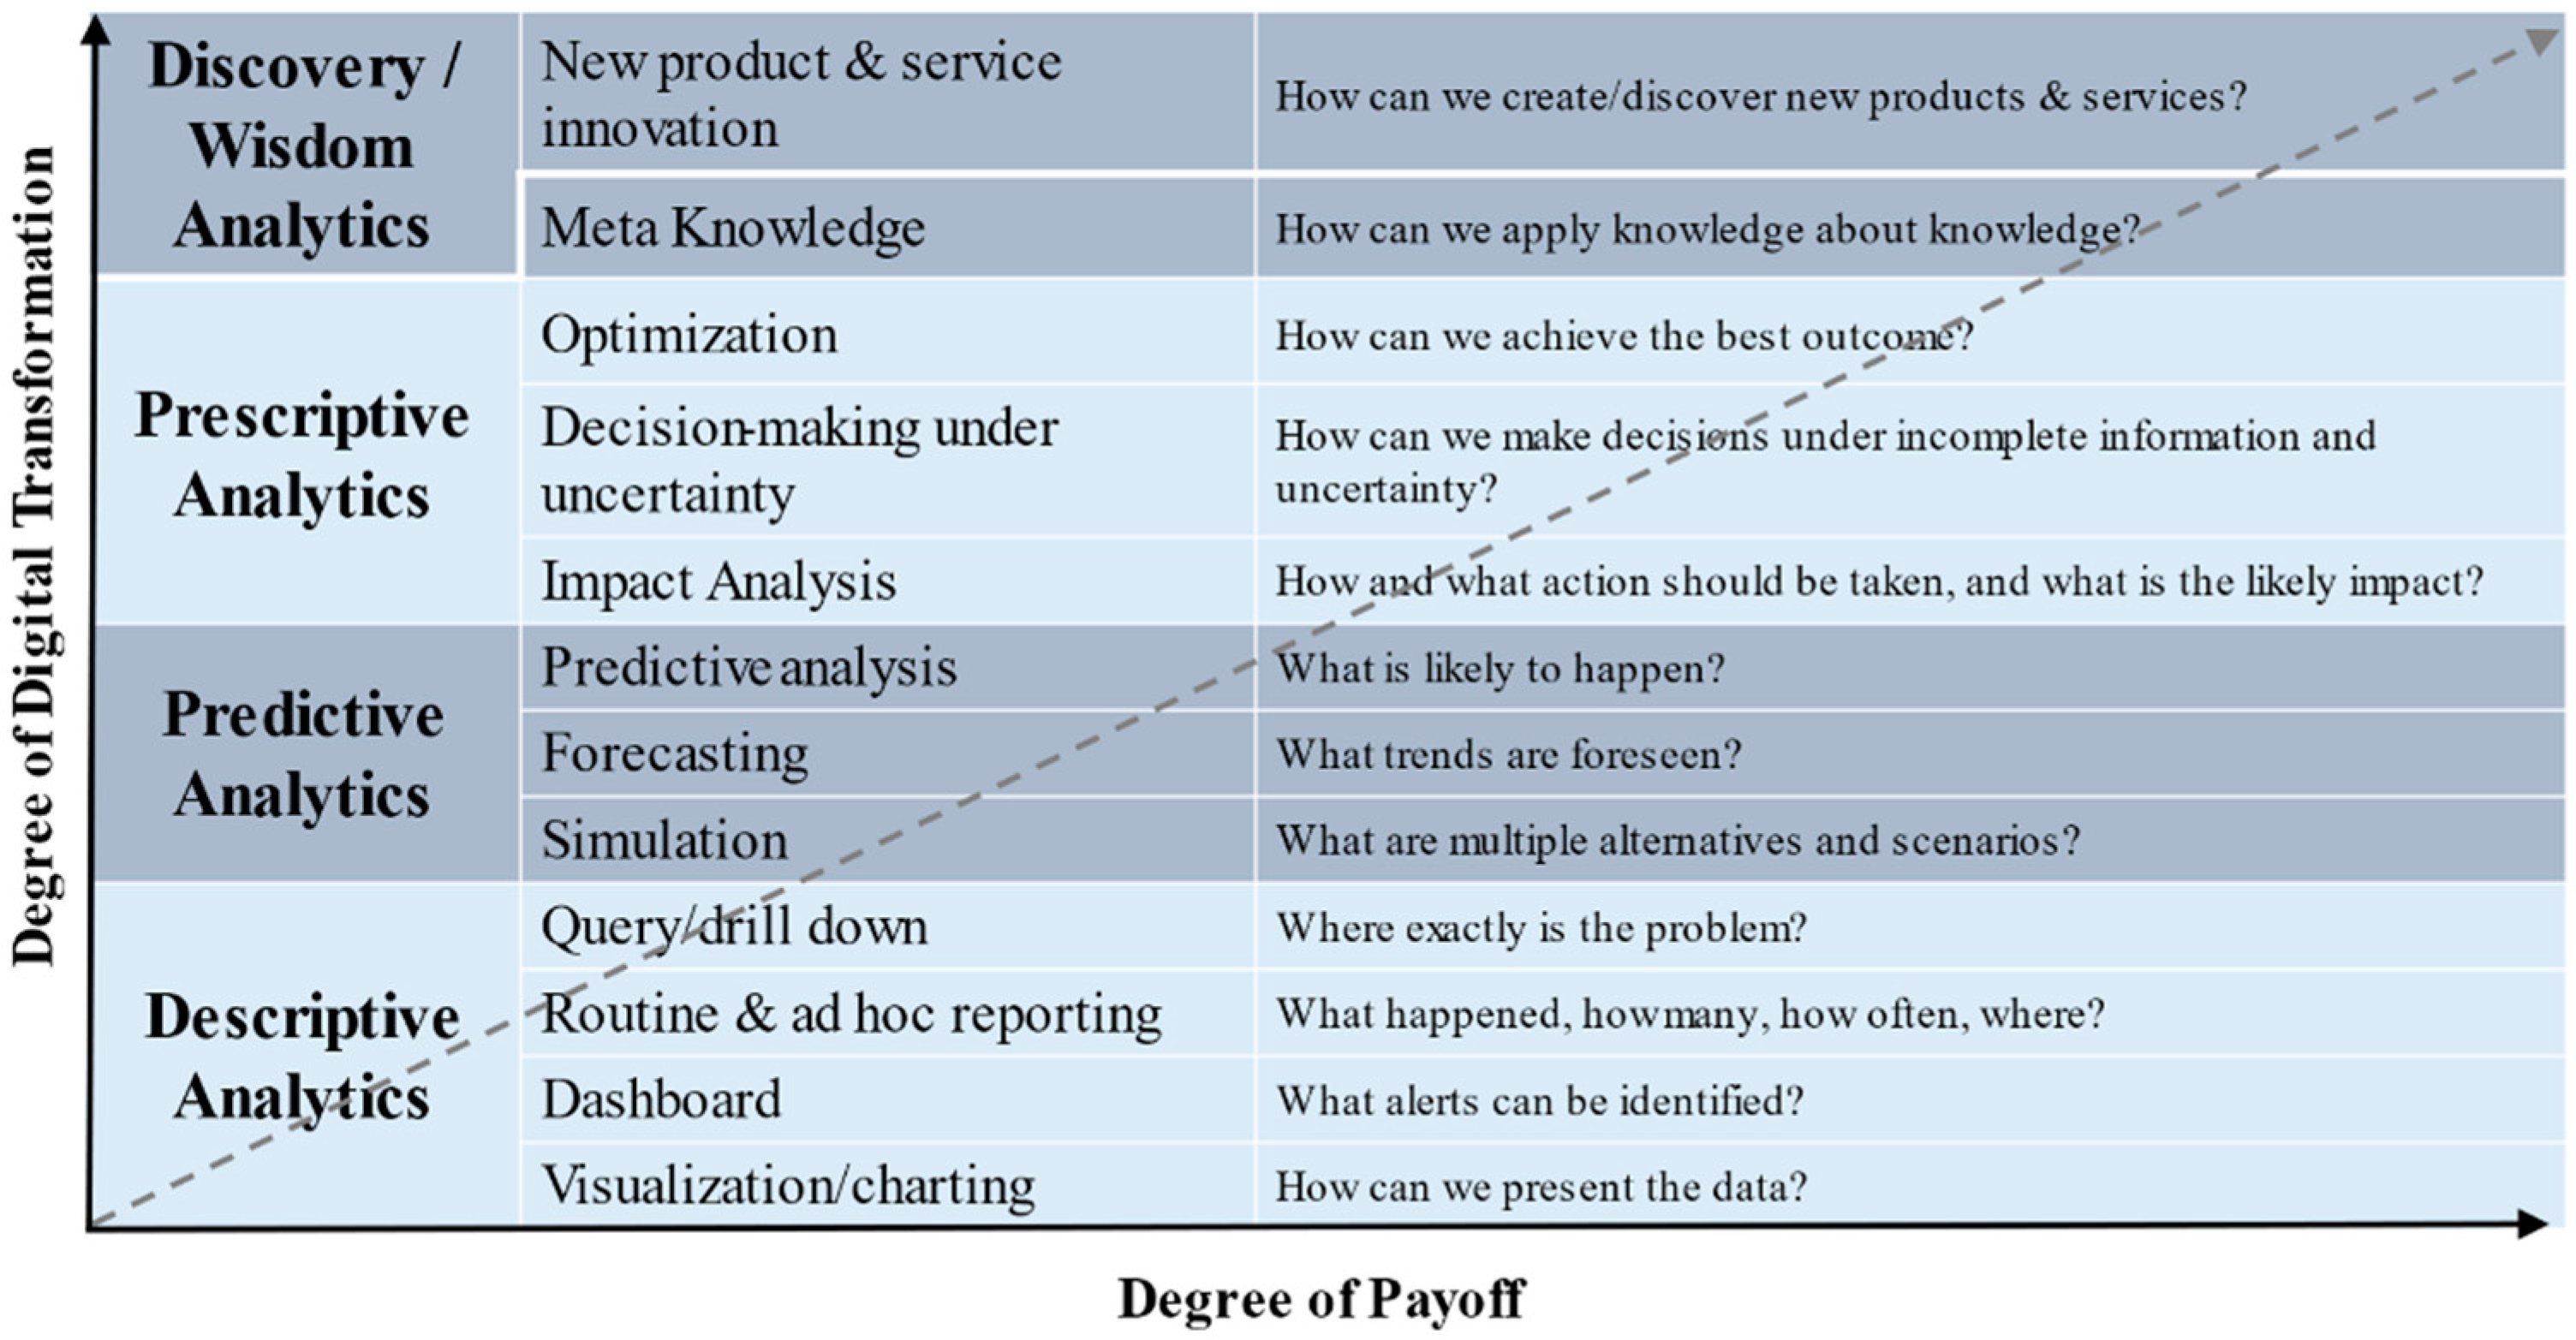
Businesses in the past have mostly applied descriptive analytics towards their cases. Managers have utilized query and reporting tools to gather historical performance data and classify and categorize data that is typically structured [1,19]. Now, with data warehouses, disparate data can be merged and dashboards, and customer views and repositories created. Business entities can build on the functionalities of descriptive analytics to move on to predictive analytics, to forecast future events using what-if analyses and models [30]. Soon, these same entities will utilize prescriptive analytics that can help in forecasting, as well as proactive decision-making. Prescriptive analytics includes recommended actions as well. To descriptive, predictive, and prescriptive analytics we add the term discovery or wisdom analytics, the next frontier in analytics, which will help businesses identify new markets, products, and strategies. Figure 1 highlights aspects of the four types of analytics. On a continuum, businesses would progress from the routine application of analytics (e.g., visualization) to more advanced applications such as artificial intelligence and deep learning (e.g., prescriptive/discovery analytics), although the four types of analytics share some of the features. As businesses move through efficient digital transformation, analytics would result in higher payoff as data-driven decisions drive performance [37,38,39]. For example, businesses may use dashboards and scorecards to evaluate performance through key performance indicators. Analytics applications, particularly role-based performance analytic applications, allow different views of data depending on a user’s role within a business. This facilitates individual decision-making to be aligned with corporate strategy [40,41].
3. Four Types of Analytics
3.1. Descriptive Analytics
Descriptive analytics is the type of analytics that is most understood and widely used. Being the earliest type of analytics to be introduced, it is by far the simplest to implement, since it provides a description of the data “as is” without any complex calculations [1]. When compared to other models, descriptive analytics is more data-driven. Most businesses deploy descriptive analytics to use data to understand past and current business decisions (“IS”) and make fact-based decisions. By categorizing, characterizing, aggregating, and classifying data, descriptive analytics convert the data into useful information for analyzing business decisions and outcomes. The summarized information can be displayed either as reports/charts or as responses to queries using SQL. Descriptive analytics deploys visualization to a great extent [42]. The functionality extends to obtaining standard or customized reports, drilling down into the data, and using queries on the data to better understand the trends and patterns [34]. Descriptive analytics helps answers such questions as, how many customers purchased a particular product in the past five years? What was our cost and revenue for the last quarter? What types of products, and how many of each type did we service? Which of the products offers the highest cost–profit margin ratio? Which customers should we target for special discounts? Which are the customers with high overhead cost? [1].
3.2. Predictive Analytics
In predictive analytics, which is a more advanced type of analytics, there is emphasis on the use of information (versus data) [1]. In this, future performance can be predicted through any of the following ways: by examining historical or past business data, by detecting relationships or patterns in the data and extrapolating these patterns to make an informed forecast (“COULD”). For example, a finance executive can predict the responses of various investment client groups to different financial product and pricing offerings. Predictive analytics have the ability to anticipate risk and identify relationships that may not be apparent with descriptive analytics. Through statistical modeling, data mining, and other advanced techniques, predictive analytics can identify hidden relationships or patterns in huge volumes of data. This is integral to group or segment data into meaningful sets for detecting tends or predicting behavior.
3.3. Prescriptive Analytics
When a provider cannot effectively consider descriptive or predictive analytics due to the involvement of too many alternatives and choices, prescriptive analytics comes into play. In addition to using data or information, this type of analytics also utilizes business knowledge. It is normative since it addresses the question of what should be (“SHOULD”) [1]. Prescriptive analytics is deployed in business areas such as finance, marketing, supply chain management, customer relationship management, and others. The key question prescriptive analytics is designed to answer is, What ‘should’ be the outcome (optimal)? Additionally, once the outcomes are predicted, prescriptive analytics follows up with recommended courses of actions.
3.4. Discovery Analytics
Discovery analytics is the utilization of wisdom or meta-knowledge (knowledge about knowledge) in the identification of new products and services (e.g., drug discovery) [1]. In the domain of new drug discovery, the utilization of computer simulations and what-if analyses are standing examples of discovery analytics. Although the tools and models used in the four types of analytics (descriptive, predictive, prescriptive, and discovery) may be different, most applications typically involve all four [1]. Three main ‘pillars’ drive the modeling utilized in conducting analytics [1]. These are discussed next.
4. The Three Pillars of Analytics
In addition to the four types of analytics, this study identifies three pillars of analytics that inform business modeling: visualization, statistical modeling, and machine learning [19,30,33,34,35,36].
4.1. Visualization
Visualization is most appropriate for descriptive analytics and involves visualizing the data, including the various variables, dimensions, correlations, insights, etc. More and more often, visual storytelling is considered a ‘science’. In fact, at this time, a picture is not just worth a thousand but a million words [1]. A variety of charts can express the characteristics of data or describe the data [42]. Collectively, these charts can tell a ‘story’ about the data, the problem being analyzed, the insight that is revealed, and the potential implications for policy. Numerous tools, such as business intelligence tools, enable visualization [33].
4.2. Statistical Modeling
Statistical modeling involves mathematical modeling and representation of the data. This method works with a set of assumptions [19,35]. For example, linear regression is used to explore the relationship between two variables x and y. Prior to conducting a regression analysis, we need to make sure that the following four assumptions are met: linearity (there exists a linear relationship between the independent variable x and the dependent variable y); independence (the residual errors are independent and identically distributed random variables); homoscedasticity (the residual errors have constant variance at every level of x); and normality (the residual errors are normally distributed). Inferences regarding the population data set are drawn from an examination of a sample sub-set of the data. There are different and numerous statistical models, and the discipline is well established. Statistical modeling is most appropriate for predictive analytics.
4.3. Machine Learning
Like statistical modeling, machine learning involves the application of mathematical modeling to the data. Machine learning is more data-driven, that is, the problem-solving (the identification of patterns) is found within the data [30,36]. Machine learning overcomes some of the limits of statistical modeling; there are no strict assumptions to comply with, and one can handle noisy data and data with missing values. Typically, there are three steps involved in this type of modeling—training, validation, and testing of the data. Machine learning is also typically appropriate for unstructured data: text, audio, and video among them. Additionally, it offers advantages for big data analytics. Machine learning, a subset of artificial intelligence, can also be extended to deep learning methods. The three pillars are not mutually exclusive. Depending on the problem, one or more of the three pillars may be applied in the context of one or more types of analytics. Choosing the right modeling method is an important step in analytics/data science. See Table 1 below for a summary of the four types of analytics and the three pillars.
5. Architectural Framework
Figure 2 provides the architectural framework of business analytics. It depicts the various components and how they interact to enable analytics [1,22]. The framework contains four key elements.
5.1. Data Sources
Data is extracted from both internal and external data sources. Internal data sources include data residing in various business information technology applications. External data sources include datasets that are publicly available, including data from governments, customers, suppliers, industry and trade associations, media, and others that supplement internal data sources [1]. Analytic tasks are performed over data that often come from diverse sources that contain data of varying quality that need to be reconciled. The preparation of data in terms of the processes of integration, cleansing, and standardization presents a lot of challenges [1]. Data can come from multiple, disparate systems (e.g., databases, CRM systems, ERP, SCM systems, etc.) found in various locations within the wider business ecosystem, and it may be either structured (quantitative) or unstructured (text). All this data needs to be organized, structured, and otherwise standardized in a way that readies it for analytics. The formal process of data engineering techniques is applied to help prepare the data for processing.
5.2. Business Data Transformation
For analytics purposes, data has to be pooled. The data is in a raw state and so requires processing or transformation. For this, several options are available. A service-oriented architectural approach combined with web services is one route. The data stays raw, and services that perform the routine and standardized processes across the organization are used to call, retrieve, and process the data. Another approach is data warehousing (middleware), whereby data from various sources is aggregated and made ready for processing. Data blending tools have emerged as well. However, not all the data is available in real-time. Business analytics tasks usually need to be executed in real-time and incrementally as new data arrives, as, for example, when data for processed customer orders, or stock trades, and closed sales are made available. Therefore, capabilities of scalable and efficient data loading, as well as refreshing, are critical for business analytics. Data from diverse sources are cleansed and made ready through the steps of extract, transform, and load (ETL).
5.3. Platform and Tools
After the data are readied for analytics, an array of tools can be deployed to perform the four types of analytics. These may include statistical tools (e.g., SAS, R, SPSS etc.), advanced business intelligence tools for visualization (Cognos, Business Objects, Tableau, Hyperion, etc.), and programming languages such as Python and packages for machine learning. By performing a thorough needs assessment as well as a comparative analysis, the user has the option to select from a variety of vendors and/or tools.
5.4. Business Analytics Applications
By deploying various tools, analytics applications such as queries, reports, online analytical processing, and data mining can be executed to support managerial decision-making. For example, consider the task “Identify customers who have incurred high overhead costs (e.g., in returns, exchanges) during the sales year and whose overall cost exceeds the average overhead cost by at least 40%” [1]. The various tools and applications can be used to address this task. Similarly, various reports that are essential for business compliance and for identifying KPI (key performance indicators) can be produced and presented in the form of dashboards or scorecards. With OLAP, real-time decision support and customer relationship data analysis can be enabled. Finally, advanced decision support is facilitated by data mining techniques such as association, classification, and clustering [43].
6. Methodology
Business analytics is an emerging discipline, and, therefore, many studies have proposed different methodologies. However, in the current study, we develop a hands-on and practical kind of approach [1]. Our methodology for a business analytics project covers the stages of concept design (conceptualization of the problem or need to be addressed), proposal (development of problem statement and the appropriateness of the analytics approach to address the problem), implementation (hypothesis/proposition development, data collection, analytics platform/tool selection, and application of analytic techniques to test the hypothesis/proposition), and finally, presentation and walkthrough to the stakeholders.
Table 2 displays the main stages of this methodology. In Stage One, the business analytics team, which is interdisciplinary, collaboratively develops a concept design. This denotes an attempt at coming up with a problem statement or research question that can highlight the need for the project. Next is the description of the significance of the project. In this aspect, trade-offs can encompass inexpensive options, problem–solution alignment, risk, and others [1]. Once the concept design gets approved, Stage two is the proposal development stage. In this stage, with the concept design as an input, an abstract outlining the methodology and implementation process is developed [1]. An introduction to the business analytics domain follows. Some of the questions to be addressed include: What is the nature of the problem? Why is the problem critical to the company? What is the justification for adopting an analytics approach? [1]. Considering the cost and complexity associated with the use of analytics, it is critical that its usage is justified. In this stage, the team should provide a sound background on the problem domain and conduct a comprehensive review of prior research in the domain.
The concept design and the proposal are evaluated in terms of the four Cs of “completeness, correctness, consistency, and communicability” [1] (p. 5):
Completeness–Is the concept design complete?
Correctness–Is correct terminology used, and is the design technically sound?
Consistency–Is there flow and continuity in the proposal, and is it cohesive?
Communicability–Does the report communicate the design in a comprehensible manner? Is the report formatted professionally?
Stage Three is the implementation. The problem statement is translated into many hypotheses or propositions, even though the hypotheses may not be quantitatively defined as in statistical approaches. Rather, the hypotheses are developed to help guide the business analytic process, and the independent, control, and dependent variables are identified in this stage. In terms of the analytics, there is no great need to classify the variables, but it is useful to identify causal relationships or correlations. The data sources as outlined in Figure 2 are identified; the data is collected (longitudinal data, if necessary), described, and transformed to make it ready for analytics. Data engineering, including data preparation, data cleaning, etc., are carried out. At this time, a key step is the selection and evaluation of the platform/tool. Several options in the market include Cognos, Business Objects, Tableau, Hyperion, among others. An important consideration is the availability of the platform, whether on the desktop or on the cloud. While a desktop version enables business control over the application, the cloud has the benefits of being cheaper, superior support, and of having version control. The next step involves applying the various business analytics techniques to the data. These are much like routine analytics except that they are scaled-up to large datasets. Insight can be gained through what-if analyses and iterations, and informed decisions can be made from the analytics. Finally, in the last step, the team offers conclusions, identifies the scope and limitations, and discusses policy implications. In Stage four, the stakeholders are presented with the findings.
As proposed in [1] (p. 6), validation of an analytics project is made with the following criteria:
- Robustness of analyses, queries, reports, and visualization
- Variety of insight
- Substantiveness of research question
- Demonstration of analytics application
- Some degree of integration among components
- Sophistication and complexity of analysis
- Reproducibility and replication of results/model
In the implementation stage, there are several phases, and in each phase, there are built-in feedback loops. This is done to minimize the risk of failure as well as to make it interactive, engaging the users/clients at every phase of the development process. It is also an interactive approach, particularly the analytics step, in which the analyst conducts the what-if analysis. Careful interpretation of the charts and outputs is essential. Additionally, the model is operationalized into a customized application and deployed for the users using a number of methods and tools, such as agile method and DevOps engineering.
7. Challenges
The contemporary analytics landscape faces several challenges [13,14,15,16,26]. The most significant of these challenges in business analytics relates to data. Data from multiple sources have to be assembled, cleaned, integrated, put in standard format, and made ready for analytics. Selecting an appropriate platform for implementation is a major hurdle. For one, it needs to support the key functions that are necessary to process the data. Platform evaluation criteria may encompass continuity, availability, scalability, ease of use, privacy and security enablement, quality assurance, and the ability to operate with varying granularity. In order to be successful, business analytics applications need to be “shrink-wrapped, user-friendly, and transparent” [1] (p. 10). In addition, business data has to be analyzed in real-time and needs to address the time-lag between data collection and processing [1]. The feature of a drop-down menu with a choice of methods, models, and algorithms facilitates ease of use, as well as adoption [1]. Also, the different alternatives of local processing (e.g., desktop/laptop, network), software as a service (SaaS), cloud computing, SOA-web services delivery mechanisms, and DevOps engineering warrant additional investigation [1]. Key managerial issues to be addressed include maintaining ownership, privacy and security, governance and standards, and continuous data cleansing and data acquisition [1,44,45]. Data ethics is a critical issue to address from the lens of the cultural, global, legal, organizational, and compliance and regulatory aspects. Detailed plans need to be developed to safeguard ethics in the gathering, storage, and use of data. The entire field of big data analytics also demands attention in terms of applications and managerial challenges [46,47]. Finally, reproducibility of results and replication of the methods are major issues, especially because of coding differences and the ‘black box’ of the machine learning process. Preventing algorithmic bias and discrimination have emerged as urgent issues in the design of advanced applications in artificial intelligence and deep learning. Transparency in all aspects of analytics/data science is essential. Future research should address the ontology as well as other design issues. An application-driven approach such as access through mobile computing or wireless device should be promoted [1]. Developing models to monetize the value of data and the insight gained from the data warrant additional research. The overall role of analytics as a fundamental strategy in digital transformation of businesses can be examined via case studies.
8. Conclusions
This paper presents a contemporary overview of business analytics. To this end, it is not an empirical study nor is it a summary review of the extant literature. The progress and changes in digital technology, particularly analytics, has driven businesses to change their existing models in an effort to keep up with the innovation. These shifts can, in turn, lead to business and societal transformation [48,49,50]. Businesses strive to give purpose to the data and obtain value-driven solutions to increase their performance [51], influencing the decision-making process of various entities such as individuals, society, and the environment [48,52,53]. For example, by offering free wearable personal fitness devices that utilize data analytics to employees who meet targeted activity goals, companies can motivate employees to take care of their health. This, can in turn, can improve the quality of life of the employee, increase the productivity of the company, reduce healthcare costs for the government, and improve the overall health of society.
Additionally, analytical methods are “assumption-free” [1] (p. 12) and can serve as inputs to rigorous statistical techniques and tools [1]. There are alternative business analytics technologies that can be considered—such as web analytics, which provides an understanding of how visitors interact with the features of a company’s website—or which ‘landing pages’ are likely to encourage visitors seeking a product/service. Mobile analytics is yet another fecund area that allows exploring applications of analytics on mobile devices. Business analytics, though in its nascent stage of use, has the potential to greatly improve outcomes, decision-making quality, and cost-efficiency of businesses. Finally, while it is true that the algorithms and concepts covered here may have been around for a while, it is only recently that information technology with the desired level of sophistication and advancement has become available. The discipline of analytics/data science continues to mature at a rapid pace as businesses embrace its potential.
Author Contributions
W.R. and V.R. contributed equally to all parts of the manuscript preparation and submission. All authors have read and agreed to the published version of the manuscript.
Funding
This research received no external funding.
Conflicts of Interest
The authors declare no conflict of interest.
References
- Raghupathi, W.; Raghupathi, V. An Overview of Health Analytics. J. Health Med. Inform. 2013, 4, 132. [Google Scholar] [CrossRef] [Green Version]
- Acito, F.; Khatri, V. Business analytics: Why now and what next? Bus. Horizons 2014, 57, 565–570. [Google Scholar] [CrossRef]
- Appelbaum, D.; Kogan, A.; Vasarhelyi, M.; Yan, Z. Impact of business analytics and enterprise systems on managerial accounting. Int. J. Account. Inf. Syst. 2017, 25, 29–44. [Google Scholar] [CrossRef]
- Davenport, T.H.; Bensoussan, B.E.; Fleisher, C.S. The Complete Guide to Business Analytics (Collection); Pearson: Boston, MA, USA, 2012. [Google Scholar]
- Krishnamoorthi, S.; Mathew, S.K. Business analytics and business value: A comparative case study. Inf. Manag. 2018, 55, 643–666. [Google Scholar] [CrossRef]
- Kunc, M.; O’brien, F.A. The role of business analytics in supporting strategy processes: Opportunities and limitations. J. Oper. Res. Soc. 2019, 70, 974–985. [Google Scholar] [CrossRef]
- Sharma, R.; Reynolds, P.; Scheepers, R.; Seddon, P.B.; Shanks, G. Business Analytics and Competitive Advantage: A Review and a Research Agenda. In Bridging the Socio-Technical Gap in DSS—Challenges for the Next; Respicaio, A., Adam, F., Phillips-Wren, G., Eds.; IOS Press: Amsterdam, The Netherlands, 2010; Volume 212, pp. 187–198. [Google Scholar]
- Sharma, R.; Mithas, S.; Kankanhalli, A. Transforming decision-making processes: A research agenda for under-standing the impact of business analytics on organizations. Eur. J. Inf. Syst. 2014, 23, 433–441. [Google Scholar] [CrossRef] [Green Version]
- Davenport, T.S.; DeLong, D.W.; Beers, M.W. Successful knowledge management projects. Sloan Manag. Rev. 1998, 39, 43–57. [Google Scholar]
- Martínez-Martínez, A.; Suárez, L.M.C.; Montero, R.S.; Del Arco, E.A. Knowledge management as a tool for improving business processes: An action research approach. J. Ind. Eng. Manag. 2018, 11, 276–289. [Google Scholar] [CrossRef] [Green Version]
- Martínez, A.M.; Navarro, J.G.C.; Garcia-Perez, A.; Moreno-Ponce, A. Environmental knowledge strategy: Driving success of the hospitality industry. Manag. Res. Rev. 2019, 42, 662–680. [Google Scholar] [CrossRef]
- Raghu, T.; Vinze, A. A business process context for Knowledge Management. Decis. Support Syst. 2007, 43, 1062–1079. [Google Scholar] [CrossRef]
- Bayrak, T. A Review of Business Analytics: A Business Enabler or another Passing Fad. Procedia Soc. Behav. Sci. 2015, 195, 230–239. [Google Scholar] [CrossRef] [Green Version]
- Delen, D.; Ram, S. Research challenges and opportunities in business analytics. J. Bus. Anal. 2018, 1, 2–12. [Google Scholar] [CrossRef]
- Gillon, K.; Aral, S.; Lin, C.Y.; Mithas, S.; Zozulia, M. Business analytics: Radical shift or incremental change? Commun. Assoc. Inf. Syst. 2014, 34, 13. [Google Scholar] [CrossRef]
- Hindle, G.; Kunc, M.; Mortensen, M.; Oztekin, A.; Vidgen, R. Business analytics: Defining the field and identifying a research agenda. Eur. J. Oper. Res. 2020, 281, 483–490. [Google Scholar] [CrossRef]
- Holsapple, C.; Lee-Post, A.; Pakath, R. A unified foundation for business analytics. Decis. Support Syst. 2014, 64, 130–141. [Google Scholar] [CrossRef]
- Camm, J.; Cochran, J.; Fry, M.; Ohlmann, J.; Anderson, D. Essentials of Business Analytics (Book Only); Nelson Education: Scarborough, ON, Canada, 2014. [Google Scholar]
- Evans, J.R. Business Analytics, 3rd ed.; Pearson: London, UK, 2019. [Google Scholar]
- Evans, J.R.; Lindner, C.H. Business analytics: The next frontier for decision sciences. Decis. Line 2012, 43, 4–6. [Google Scholar]
- Kumar, U.D. Business Analytics: The Science of Data-Driven Decision Making; Wiley: Hoboken, NJ, USA, 2017. [Google Scholar]
- Chaudhuri, S.; Dayal, U.; Narasayya, V. An overview of business intelligence technology. Commun. ACM 2011, 54, 88–98. [Google Scholar] [CrossRef]
- Laursen, G.H.; Thorlund, J. Business Analytics for Managers: Taking Business Intelligence beyond Reporting; John Wiley & Sons: Hoboken, NJ, USA, 2016. [Google Scholar]
- Seddon, P.B.; Constantinidis, D.; Tamm, T.; Dod, H. How does business analytics contribute to business value? Inf. Syst. J. 2017, 27, 237–269. [Google Scholar] [CrossRef]
- Shanks, G.; Bekmamedova, N. Achieving benefits with business analytics systems: An evolutionary process perspective. J. Decis. Syst. 2012, 21, 231–244. [Google Scholar] [CrossRef]
- Jalali, S.M.J.; Park, H.W. State of the art in business analytics: Themes and collaborations. Qual. Quant. 2018, 52, 627–633. [Google Scholar] [CrossRef]
- Kohavi, R.; Rothleder, N.J.; Simoudis, E. Emerging trends in business analytics. Commun. ACM 2002, 45, 45–48. [Google Scholar] [CrossRef]
- Power, D.J.; Heavin, C.; McDermott, J.; Daly, M. Defining business analytics: An empirical approach. J. Bus. Anal. 2018, 1, 40–53. [Google Scholar] [CrossRef] [Green Version]
- Schniederjans, M.J.; Schniederjans, D.G.; Starkey, C.M. Business Analytics Principles, Concepts, and Applications: What, Why, and How; Pearson Education: London, UK, 2014. [Google Scholar]
- Barga, R.; Fontama, V.; Tok, W.H.; Cabrera-Cordon, L. Predictive Analytics with Microsoft Azure Machine Learning; Apress: Berkeley, CA, USA, 2015; pp. 21–43. [Google Scholar]
- Cao, G.; Duan, Y.; Li, G. Linking Business Analytics to Decision Making Effectiveness: A Path Model Analysis. IEEE Trans. Eng. Manag. 2015, 62, 384–395. [Google Scholar] [CrossRef] [Green Version]
- Das, S. Computational Business Analytics; CRC Press: Boca Raton, FL, USA, 2013. [Google Scholar]
- Dill, J.; Earnshaw, R.; Kasik, D.; Vince, J.; Wong, P.C. (Eds.) Expanding the Frontiers of Visual Analytics and Visualization; Springer Science & Business Media: Berlin/Heidelberg, Germany, 2012. [Google Scholar]
- Hoyt, R.E.; Snider, D.; Thompson, C.; Mantravadi, S. IBM Watson Analytics: Automating Visualization, Descriptive, and Predictive Statistics. JMIR Public Health Surveill. 2016, 2, e157. [Google Scholar] [CrossRef] [PubMed]
- Ohri, A. R for Business Analytics; Springer: Berlin/Heidelberg, Germany, 2013. [Google Scholar]
- Shmueli, G.; Bruce, P.C.; Yahav, I.; Patel, N.R.; Lichtendahl, K.C., Jr. Data Mining for Business Analytics: Concepts, Tech-Niques, and Applications in R; John Wiley & Sons: Hoboken, NJ, USA, 2017. [Google Scholar]
- Tamm, T.; Seddon, P.; Shanks, G. Pathways to Value from Business Analytics. In Proceedings of the International Conference on Information Systems, Milano, Italy, 15–18 December 2013. [Google Scholar]
- Vidgen, R.; Shaw, S.; Grant, D.B. Management challenges in creating value from business analytics. Eur. J. Oper. Res. 2017, 261, 626–639. [Google Scholar] [CrossRef]
- Wixom, B.H.; Yen, B.; Relich, M. Maximizing value from business analytics. MIS Q. Exec. 2013, 12, 111–123. [Google Scholar]
- McKeon, C. How analytics can “role” over to improve performance. Bus. Perform. Manag. 2007, 13–16. [Google Scholar]
- Kaplan, R.S.; Norton, D.P. Using the balanced scorecard as a strategic management system. Harv. Bus. Rev. 1996, 74, 75–85. [Google Scholar]
- Raghupathi, W.; Raghupathi, V. An empirical study of chronic diseases in the United States: A visual analytics approach to public health. Int. J. Environ. Res. Public Health 2018, 15, 431. [Google Scholar] [CrossRef] [Green Version]
- Vanani, I.R.; Jalali, S.M.J. A comparative analysis of emerging scientific themes in business analytics. Int. J. Bus. Inf. Syst. 2018, 29, 183. [Google Scholar] [CrossRef]
- Schwartz, P.M. Privacy, Ethics, and Analytics. IEEE Secur. Priv. Mag. 2011, 9, 66–69. [Google Scholar] [CrossRef]
- Vidgen, R.; Hindle, G.; Randolph, I. Exploring the ethical implications of business analytics with a business ethics canvas. Eur. J. Oper. Res. 2020, 281, 491–501. [Google Scholar] [CrossRef]
- Raghupathi, W.; Raghupathi, V. Big data analytics in healthcare: Promise and potential. Health Inf. Sci. Syst. 2014, 2, 3. [Google Scholar] [CrossRef]
- Raghupathi, W.; Raghupathi, V.; Kudyba, S. Big Data Analytics—Architectures, Implementation Methodology, and Tools; Informa UK Limited: London, UK, 2014; pp. 49–70. [Google Scholar]
- Chen, H.; Chiang, R.H.L.; Storey, V.C. Business Intelligence and Analytics: From Big Data to Big Impact. MIS Q. 2012, 36, 1165. [Google Scholar] [CrossRef]
- Loebbecke, C.; Picot, A. Reflections on societal and business model transformation arising from digitization and big data analytics: A research agenda. J. Strat. Inf. Syst. 2015, 24, 149–157. [Google Scholar] [CrossRef]
- Pappas, I.O.; Mikalef, P.; Giannakos, M.N.; Krogstie, J.; Lekakos, G. Big data and business analytics ecosystems: Paving the way towards digital transformation and sustainable societies. Inf. Syst. E-Bus. Manag. 2018, 16, 479–491. [Google Scholar] [CrossRef] [Green Version]
- Kim, K.-J.; Lee, K.; Ahn, H. Predicting Corporate Financial Sustainability Using Novel Business Analytics. Sustainability 2018, 11, 64. [Google Scholar] [CrossRef] [Green Version]
- Agarwal, R.; Dhar, V. Editorial—Big Data, Data Science, and Analytics: The Opportunity and Challenge for IS Research. Inf. Syst. Res. 2014, 25, 443–448. [Google Scholar] [CrossRef]
- Muntean, M. Business Intelligence Issues for Sustainability Projects. Sustainability 2018, 10, 335. [Google Scholar] [CrossRef] [Green Version]
Figure 1.
Types of Analytics.

Figure 2.
Business Analytics Architectural Framework. Source: Adapted from [1].
Figure 2.
Business Analytics Architectural Framework. Source: Adapted from [1].


Table 1.
Pillars/Types of Analytics Matrix Framework.
| Pillar/Analytic Task | Visualization | Statistical Modeling | Machine Learning |
|---|---|---|---|
| * Charting * Value of a picture * Visual storytelling * Scientific/cognitive BI tools (Tableau, Looker, Tibco, Qliksense, Alteryx, etc.) * Careful design | * Strict rules for modeling * Satisfy assumptions * Clean, clear data * Structured, quantitative data * More formal scientific method * R, statistical packages–SAS, SPSS, etc. | * Data-driven * Noisy/missing values data * Unstructured data–text, audio, video * Black box * Mathematical modeling/basis * Python, ML tools, libraries * AI, Deep Learning | |
| Descriptive Analytics | * All charts to display historical data—variables, dimensions, measures | * Descriptive statistics (mean, median, mode, standard deviation, correlation matrix, anova, etc.) | * Word count, association * Co-occurrence * Row similarity * TF-IDF, LDA, etc. |
| Predictive Analytics | * Scatter plot/trend line * Formula/calculations/ * Extrapolation | * ANOVA/Regression/Chi-square, etc. to predict grouping, dependent variable(s), non-parametric statistics etc. | * Clustering* Classification * Deep learning neural network models, etc. * Training/testing |
| Prescriptive Analytics | * What-if analysis in charts * Impact analysis in charts * New variables * Insight | * Causal studies * Slope and intercept; recommend action * Impact study | * Artificial intelligence/deep learning models * Study consequences * Impact of outcomes/labels |
| Discovery (Wisdom) Analytics | * Create new dimensions, measures, variables in charts | * Perceptual mapping, conjoint analysis * New product & services discovery * New metrics, variables, composites, ratios * Causal analysis | * Using artificial intelligence and deep learning models for creating new models, problem solving, new learning algorithms * Causal analysis |
Table 2.
Outline of Business Analytics Methodology.
| Stage One | Concept Design
|
| Stage Two | Proposal
|
| Stage Three | Implementation
|
| Stage Four | Presentation and Evaluation
|
Source: Adapted from [1].
Publisher’s Note: MDPI stays neutral with regard to jurisdictional claims in published maps and institutional affiliations. |
© 2021 by the authors. Licensee MDPI, Basel, Switzerland. This article is an open access article distributed under the terms and conditions of the Creative Commons Attribution (CC BY) license (https://creativecommons.org/licenses/by/4.0/).
Share and Cite
MDPI and ACS Style
Raghupathi, W.; Raghupathi, V. Contemporary Business Analytics: An Overview. Data 2021, 6, 86. https://0-doi-org.brum.beds.ac.uk/10.3390/data6080086
AMA Style
Raghupathi W, Raghupathi V. Contemporary Business Analytics: An Overview. Data. 2021; 6(8):86. https://0-doi-org.brum.beds.ac.uk/10.3390/data6080086
Chicago/Turabian StyleRaghupathi, Wullianallur, and Viju Raghupathi. 2021. "Contemporary Business Analytics: An Overview" Data 6, no. 8: 86. https://0-doi-org.brum.beds.ac.uk/10.3390/data6080086