Data Descriptor

Seismic Envelopes of Coda Decay for Q-coda Attenuation Studies of the Gargano Promontory (Southern Italy) and Surrounding Regions

by
Marilena Filippucci
1,*,
Salvatore Lucente
1,
Salvatore de Lorenzo
1,
Edoardo Del Pezzo
2,3,
Giacomo Prosser
4 and
Andrea Tallarico
1
1
Department of Earth and Geo-Environmental Science, University of Bari Aldo Moro (UniBa), 70126 Bari, Italy
2
Osservatorio Vesuviano, National Institute of Geophysics and Volcanology (INGV), 80124 Napoli, Italy
3
Instituto Andaluz de Geofisica, Universidad de Granada, 18071 Granada, Spain
4
Department of Science, University of Basilicata (UniBas), 85100 Potenza, Italy
*
Author to whom correspondence should be addressed.
Submission received: 20 August 2021 / Accepted: 3 September 2021 / Published: 13 September 2021
(This article belongs to the Section Spatial Data Science and Digital Earth)

Abstract

:
Here, we describe the dataset of seismic envelopes used to study the S-wave Q-coda attenuation quality factor Q c of the Gargano Promontory (Southern Italy). With this dataset, we investigated the crustal seismic attenuation by the Q c parameter. We collected this dataset starting from two different earthquake catalogues: the first regarding the period from April 2013 to July 2014; the second regarding the period from July 2015 to August 2018. Visual inspection of the envelopes was carried out on recordings filtered with a Butterworth two-poles filter with central frequency f c = 6 Hz. The obtained seismic envelopes of coda decay can be linearly fitted in a bilogarithmic diagram in order to obtain a series of single source-receiver measures of Q c for each seismogram component at different frequency f c . The analysis of the trend Q c ( f c ) gives important insights into the heterogeneity and the anelasticity of the sampled Earth medium.
Dataset: 10.17632/w9hsj2whzm.1
Dataset License: CC-BY 4.0

1. Summary

The dataset is a collection of seismic envelopes computed from the seismograms of 280 earthquakes occurred in the Gargano area (Southern Italy) and recorded by both the OTRIONS (OT) and INGV (IV) seismic networks. The selected earthquakes belong to two bulletins: the first refers to earthquakes that occurred from June to September 2013; the second refers to earthquakes that occurred from July 2015 to August 2018. All of these earthquakes belong to a seismic database that was recently released and described [1,2,3] together with the seismic bulletins, station locations, velocity model [3], and seismograms.
Seismic attenuation estimates are calculated from the decay of coda waves that constitute the end of the seismic recording for local and regional events. The coda waves start after the S waves and are composed of incoherent waves scattered by inhomogeneities. The amplitude of coda waves is thought to decrease because of the seismic attenuation (both intrinsic and scattering) and because of the geometrical spreading of the wave front. Aki and Chouet [4] showed that, assuming that coda waves are single-scattered S waves, at short source–receiver distances, the coda amplitude decay A ( f c , t ) is given by:
log A ( f c , t ) π f c t Q c ( f c )
that is a linearly decreasing function of the time t elapsed from the origin time of the earthquake for a given central frequency f c . Therefore, Q c can be estimated by the slope of the linear regression in Equation (1) in a selected time window called a lapse time window t L . On the seismogram S ( t ) , the seismic coda decay A ( f c , t ) can be evaluated by the seismic envelope calculated using the Hilbert transform H S ( t ) , as follows:
A ( f c , t ) = H [ S ( t ) ] 2 + S ( t ) 2 .
The dependence of A ( f c , t ) on f c is obtained by band-pass filtering the signal S ( t )   around f c . 
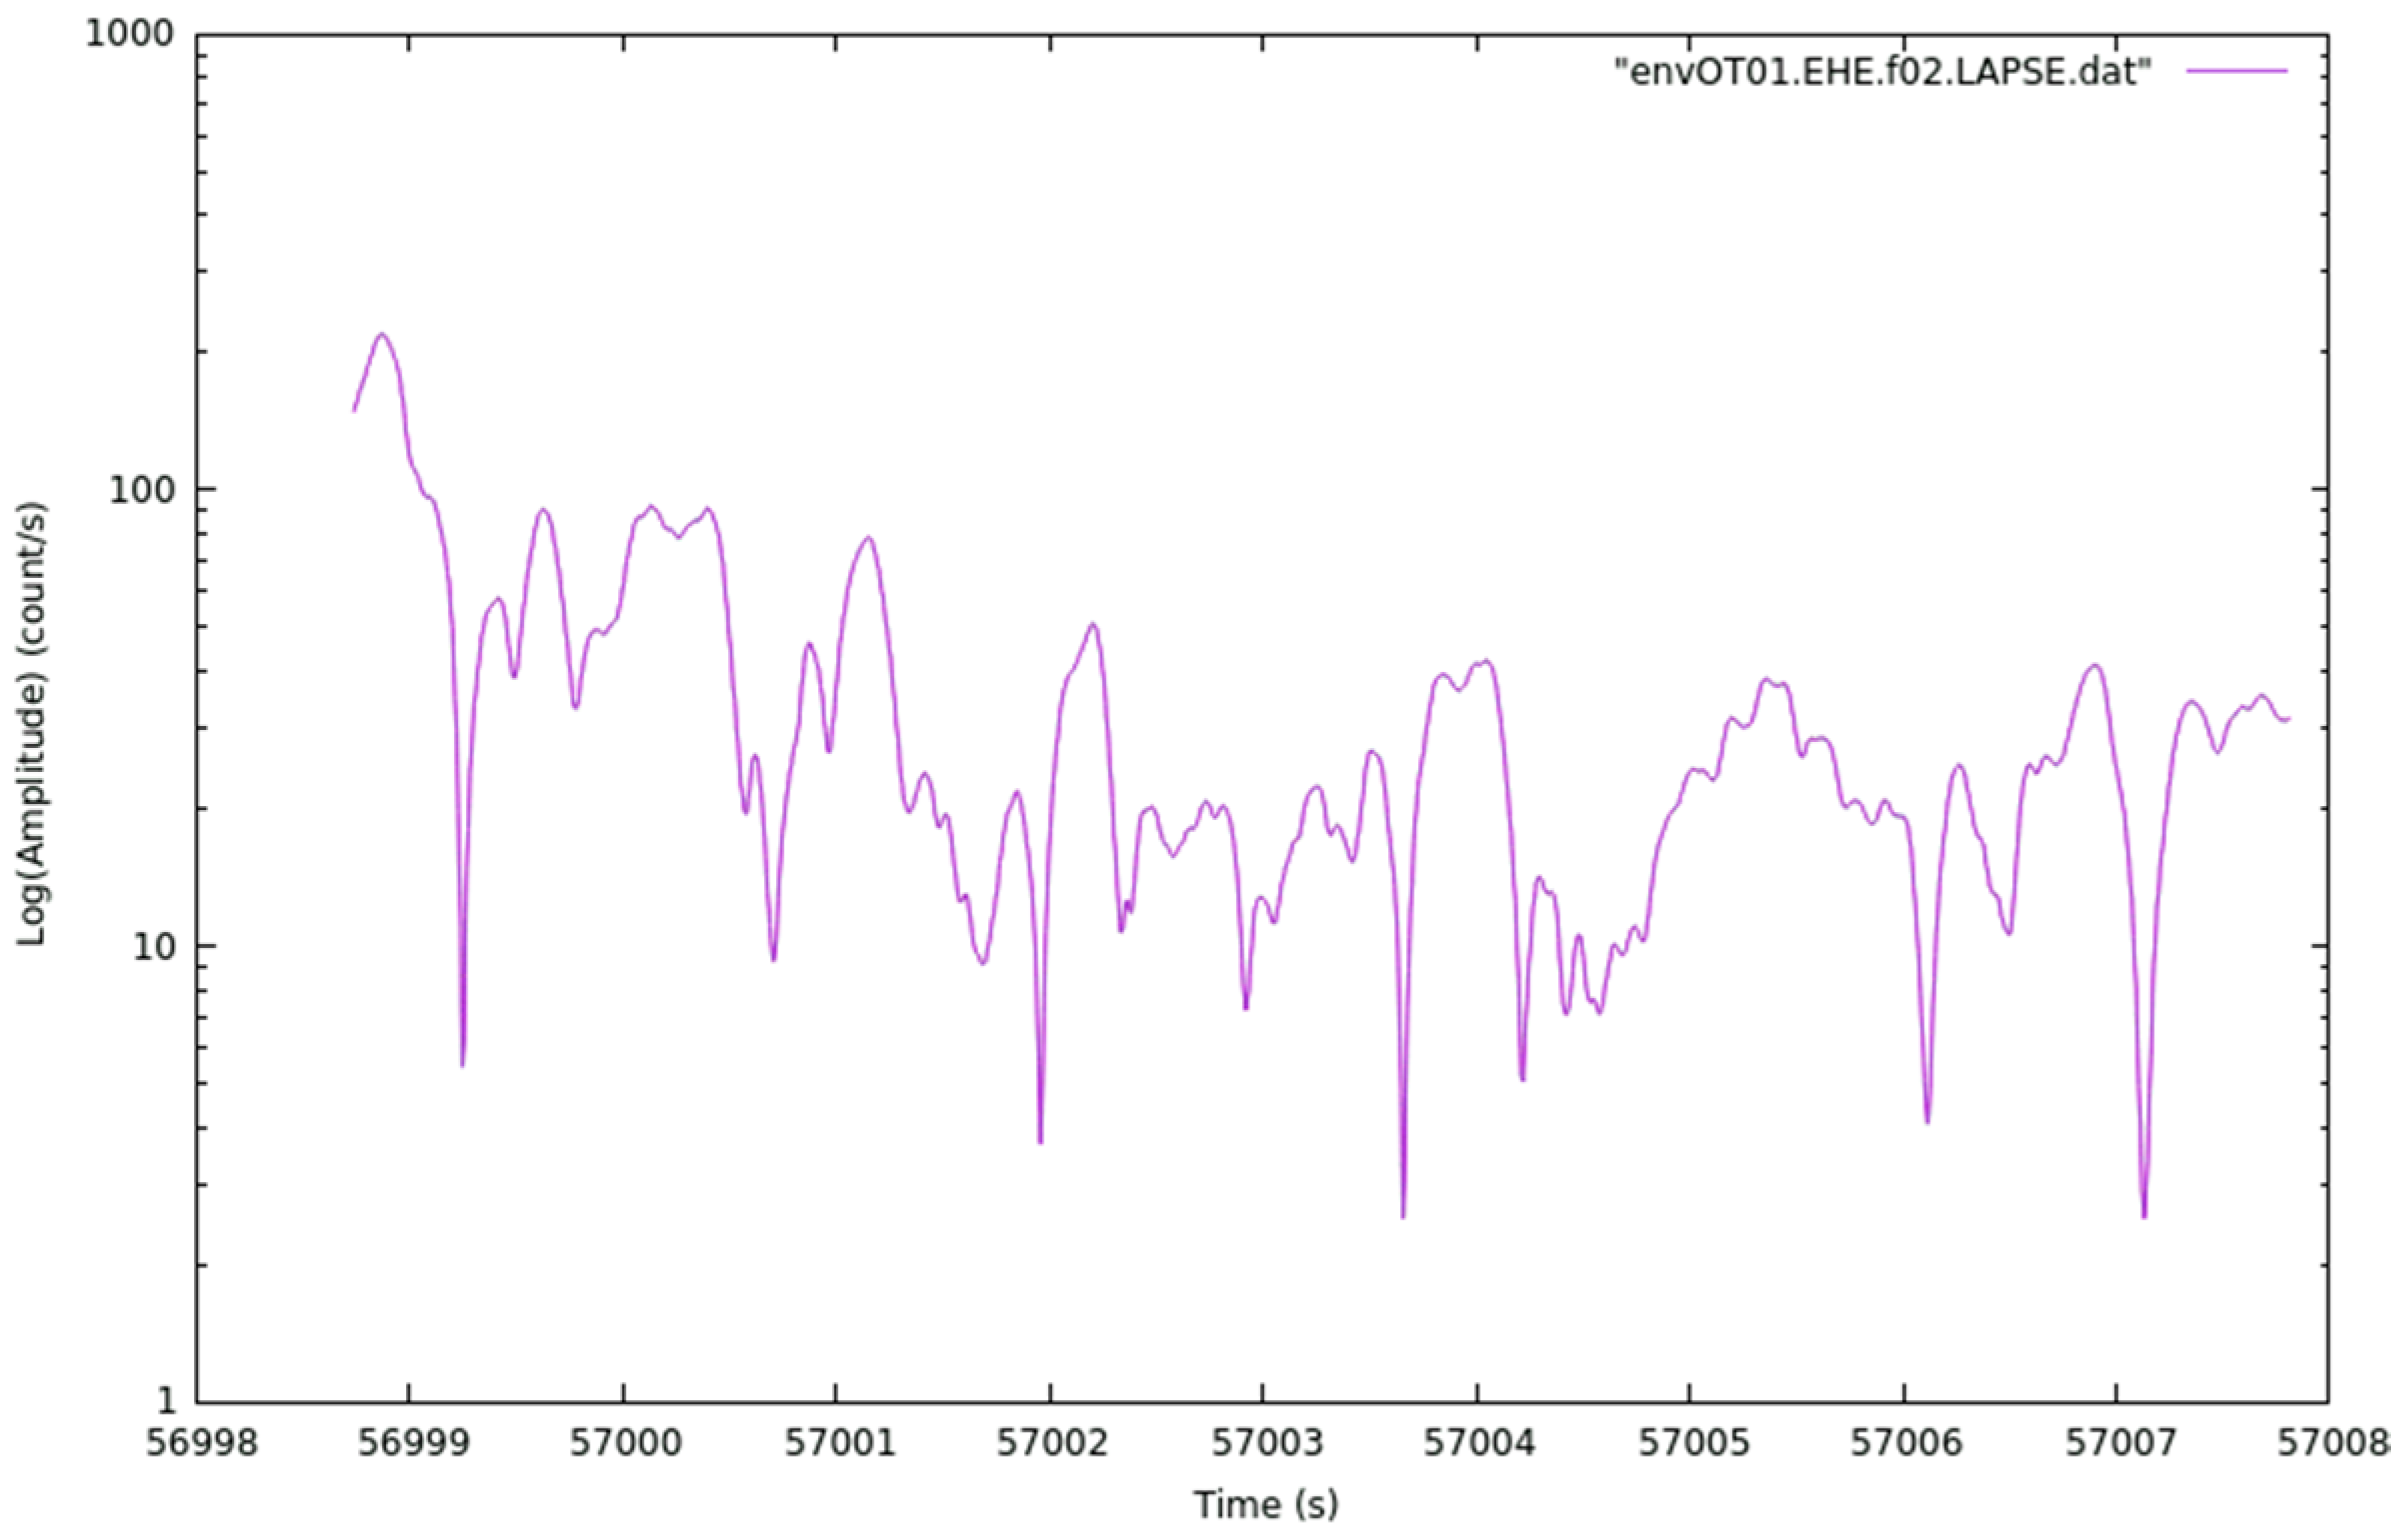
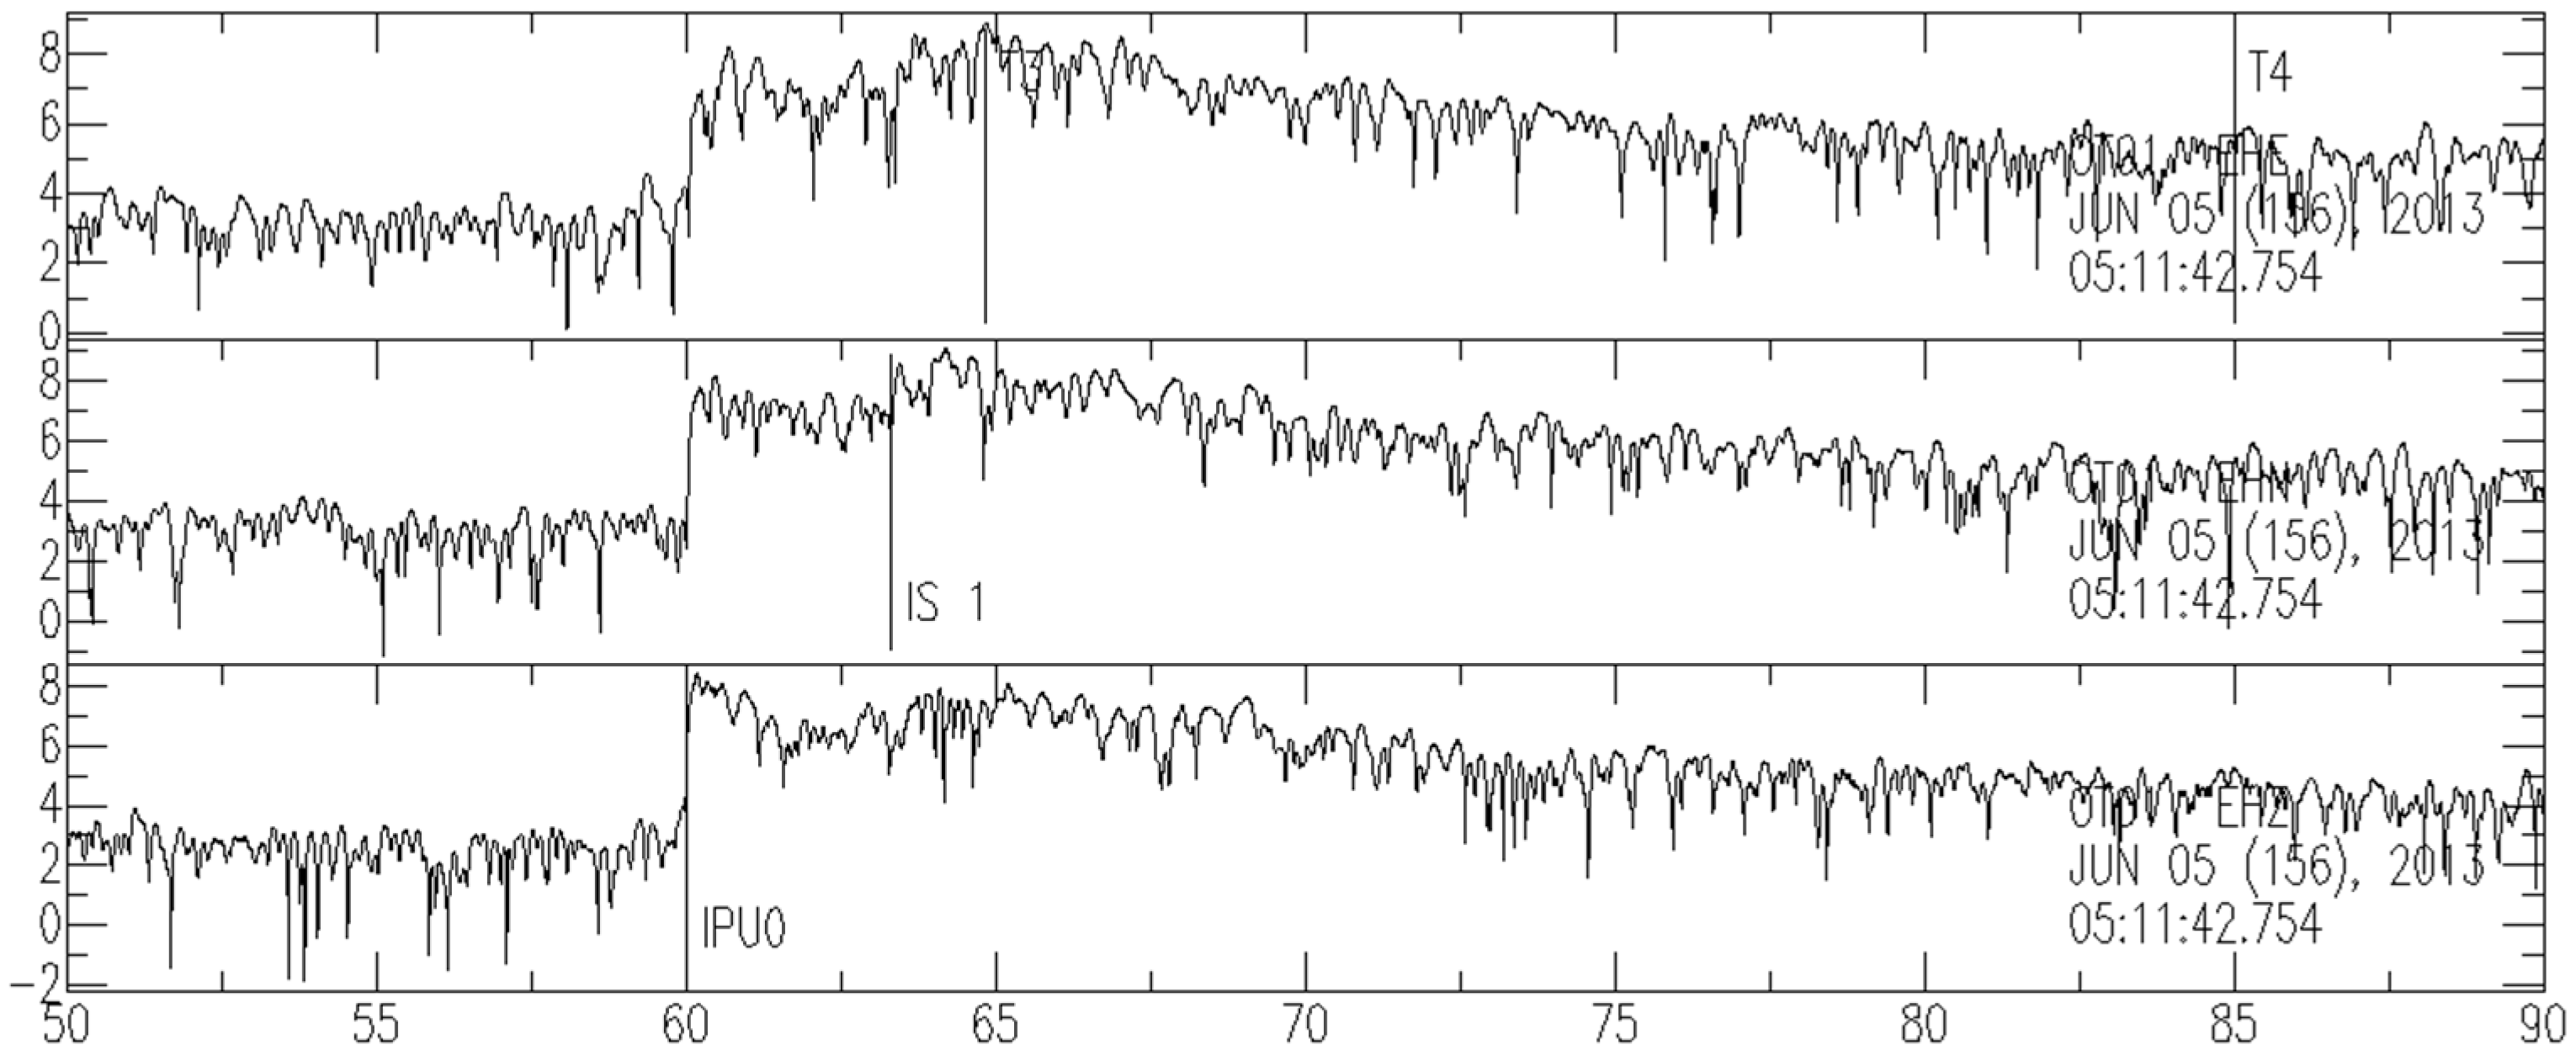
In this work, we release the seismic envelopes A ( f c , t ) cut between the time T3, marked on the seismogram after the S-wave arrival time, until time T4, marked on the seismogram before an energy bump or an irregularity of the coda decay or when the coda waves are indistinguishable from the noise content. All released envelopes are band-pass filtered with a two-pole Butterworth filter, considering 11 values of f c = [ 2 , 3 , 4 , 5 , 6 , 7 , 8 , 10 , 12 , 14 , 16 ] Hz and a band-width [ f c 2 ;   f c 2 ] , following Bianco et al. [5]. Times T3 and T4 were manually marked on seismogram envelopes filtered with central frequency f c = 6 Hz and band-width [4.2; 8.5] Hz.
The first dataset of envelopes (http://0-dx-doi-org.brum.beds.ac.uk/10.17632/w9hsj2whzm.1#folder-7a917d26-6be4-4014-8103-a8760541264a, accessed on 5 September 2021), which consists of the recordings of the period from June to September 2013, was already used for the first 2D Q c study [6] of the Gargano Promontory (Southern Italy). It consists of the recordings of 89 microearthquakes, with magnitudes ranging between 0.8 and 1.8, that were recently used to study the Gargano stress field [7] and the rheology of the Gargano crust [8].
The second dataset of envelopes (http://0-dx-doi-org.brum.beds.ac.uk/10.17632/w9hsj2whzm.1#folder-7a917d26-6be4-4014-8103-a8760541264a, accessed on 5 September 2021), which consists of the recordings of the period from July 2015 to August 2018, was used in a 3D study of Q c ([9]) of the Gargano Promontory and surrounding areas (Southern Italy). It consists of the recordings of 191 microearthquakes, with magnitudes ranging between 1 and 2.8, that were recently used to study the Gargano active faults [10].
The manual work behind the time markers recognizing procedure is very expensive in terms of time costs. Nevertheless, we think that with this manual time marking procedure we obtained a very robust dataset of time envelopes with respect to an automatic time cut of seismic recordings. The released datasets of seismic envelopes can be very useful for seismological studies of intrinsic and scattering attenuation of Southern Italy, the Adriatic Sea, and other surrounding regions at different time lapse windows t L .

2. Data Description

2.1. First Envelope Dataset

The compressed folder Seismic_Envelopes_2013.zip contains 89 folders named with a numerical code (YYMMDDHHmm) each of them related to the earthquake origin time (YY = year, MM = month, DD = day, HH = hour, mm = minute) (see Table 1).
Each event’s folder collects the time envelope files in data format (.dat) named as follows: “envSTNM.COM.ffc.LAPSE.dat” (STNM = station name, COM = component, fc = central frequency) (see Table 2).
Each envelope file is made of two columns: time (s) from absolute midnight and amplitude in (counts/s) (see Table 3).
The envelope file in Table 3 is plotted in Figure 1.

2.2. Second Envelope Dataset

The compressed folder Seismic_Envelopes_2015_2018.zip contains 191 folders named with a numerical code (YYMMDDHHmm) each of them related to the earthquake origin time (YY = year, MM = month, DD = day, HH = hour, mm = minute) (see Table 4).
Each event’s folder collects the time envelope files in text format (.TXT) named as follows: “SN.STNM..COM.D.YYYY,JuD,hh/mm/ss.FCfc.TXT” (SN = station network, STNM = station name, COM = component, YYYY = year, JuD = Julian day, hh:mm:ss = hours:minutes:seconds of the recording origin time, fc = central frequency) (see Table 5).
Each envelope file is made of two columns: amplitude in (counts/s) and time (s) elapsed from the origin time of the event (see Table 6).
The first envelope file in Table 6 is plotted in Figure 2.

3. Methods

The two datasets described in Section 2.1 and Section 2.2 were collected by using the SAC (Seismic Analysis Code) software [11,
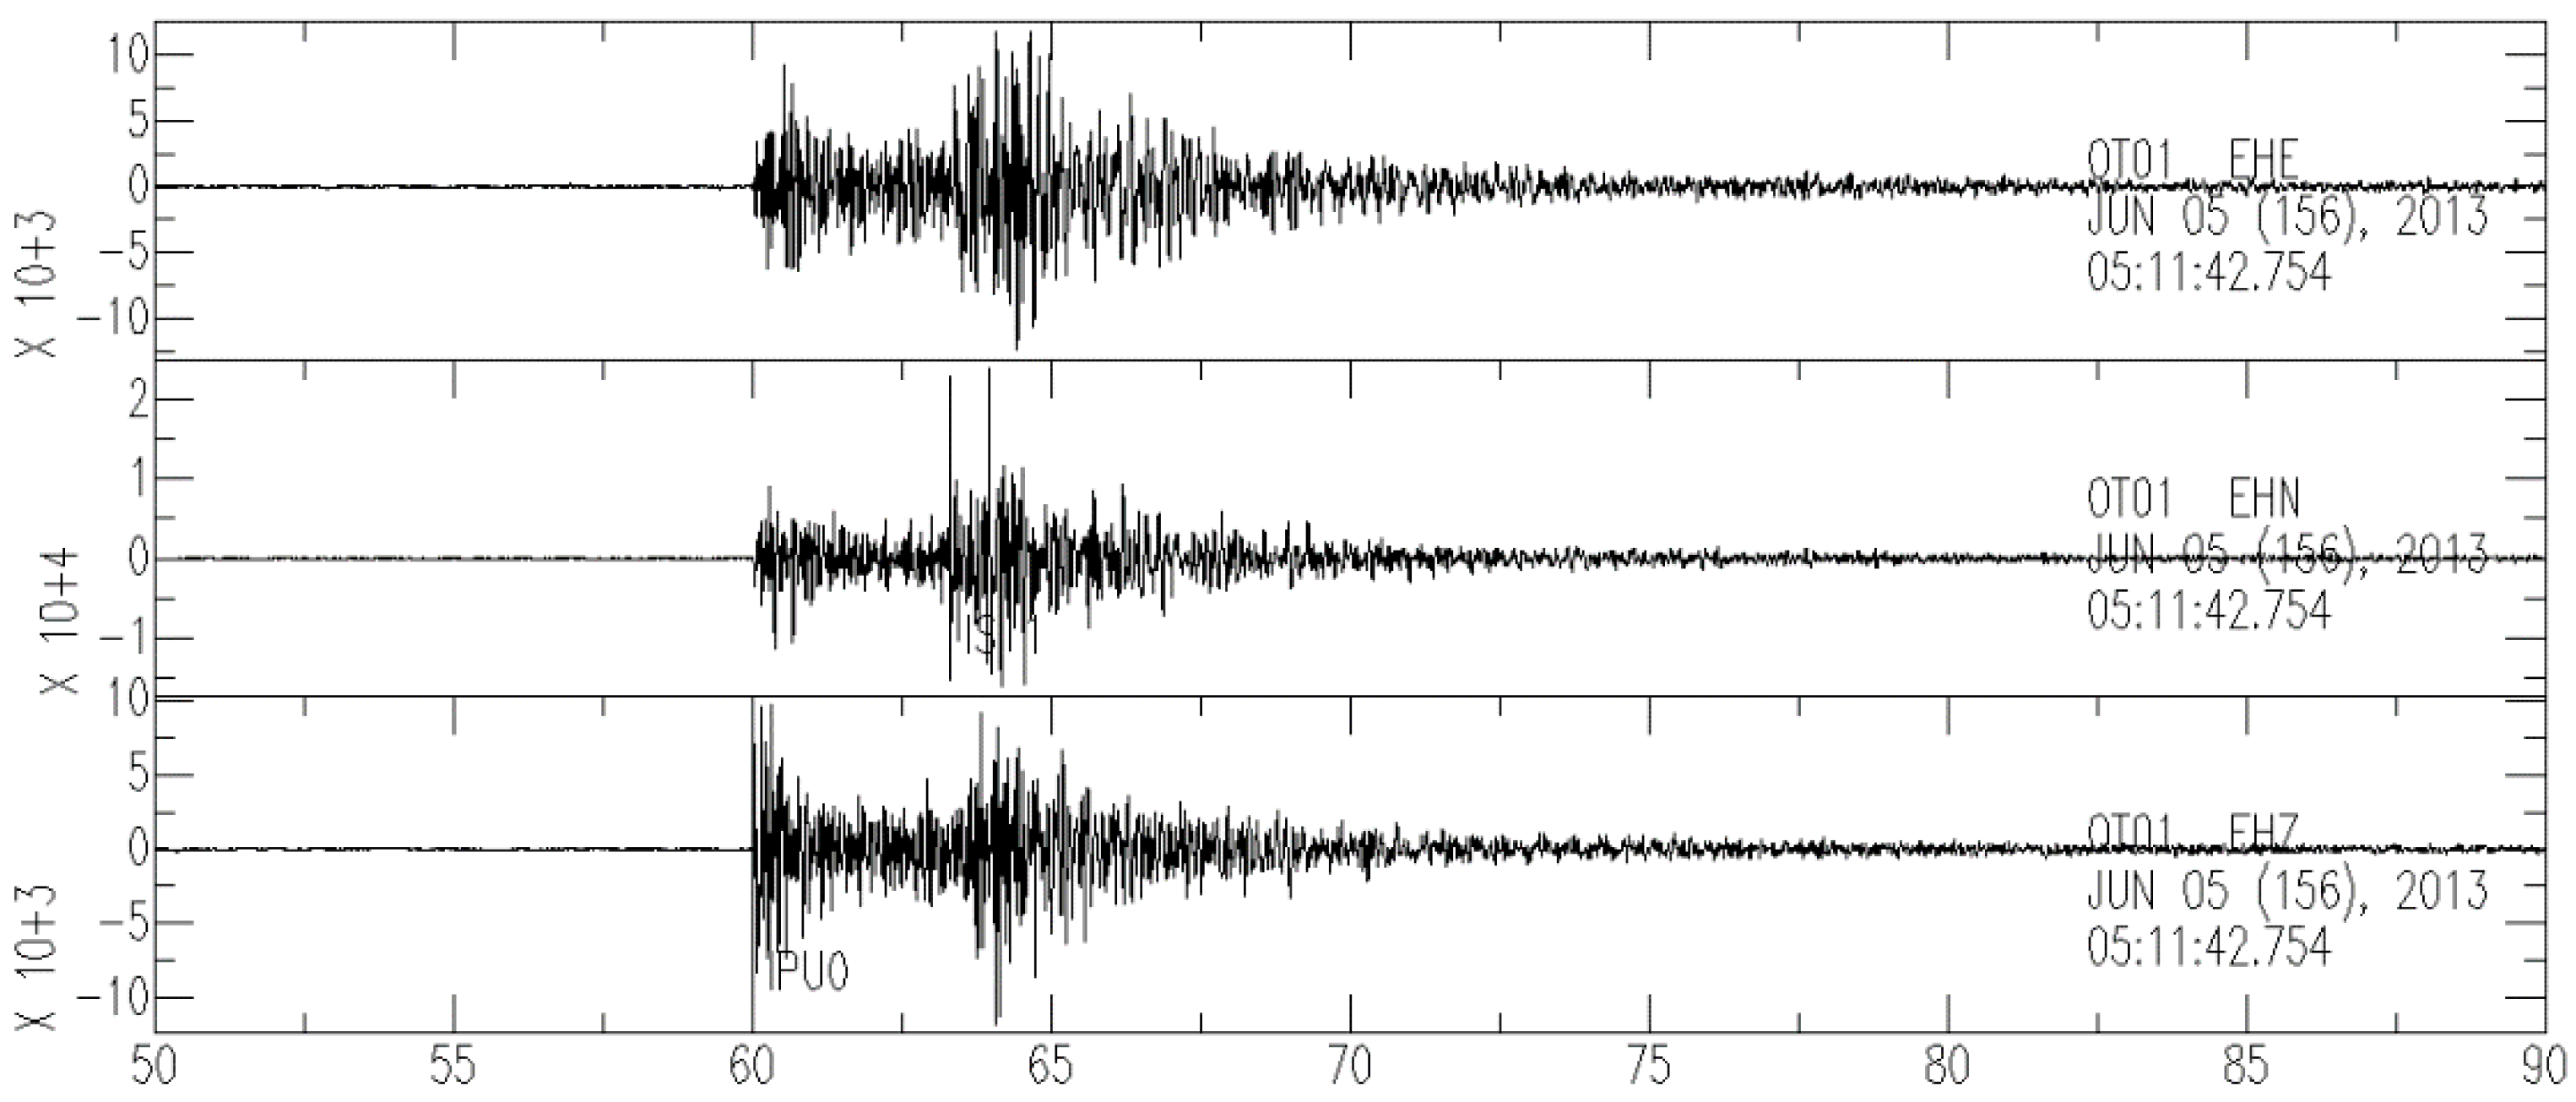
12]. Starting from the original seismogram in Figure 3, a filtering procedure is applied by using a two-pole Butterworth filter considering a central frequency f c = [ 2 , 3 , 4 , 5 , 6 , 7 , 8 , 10 , 12 , 14 , 16 ] Hz and a band-width [ f c 2 ;   f c 2 ] 
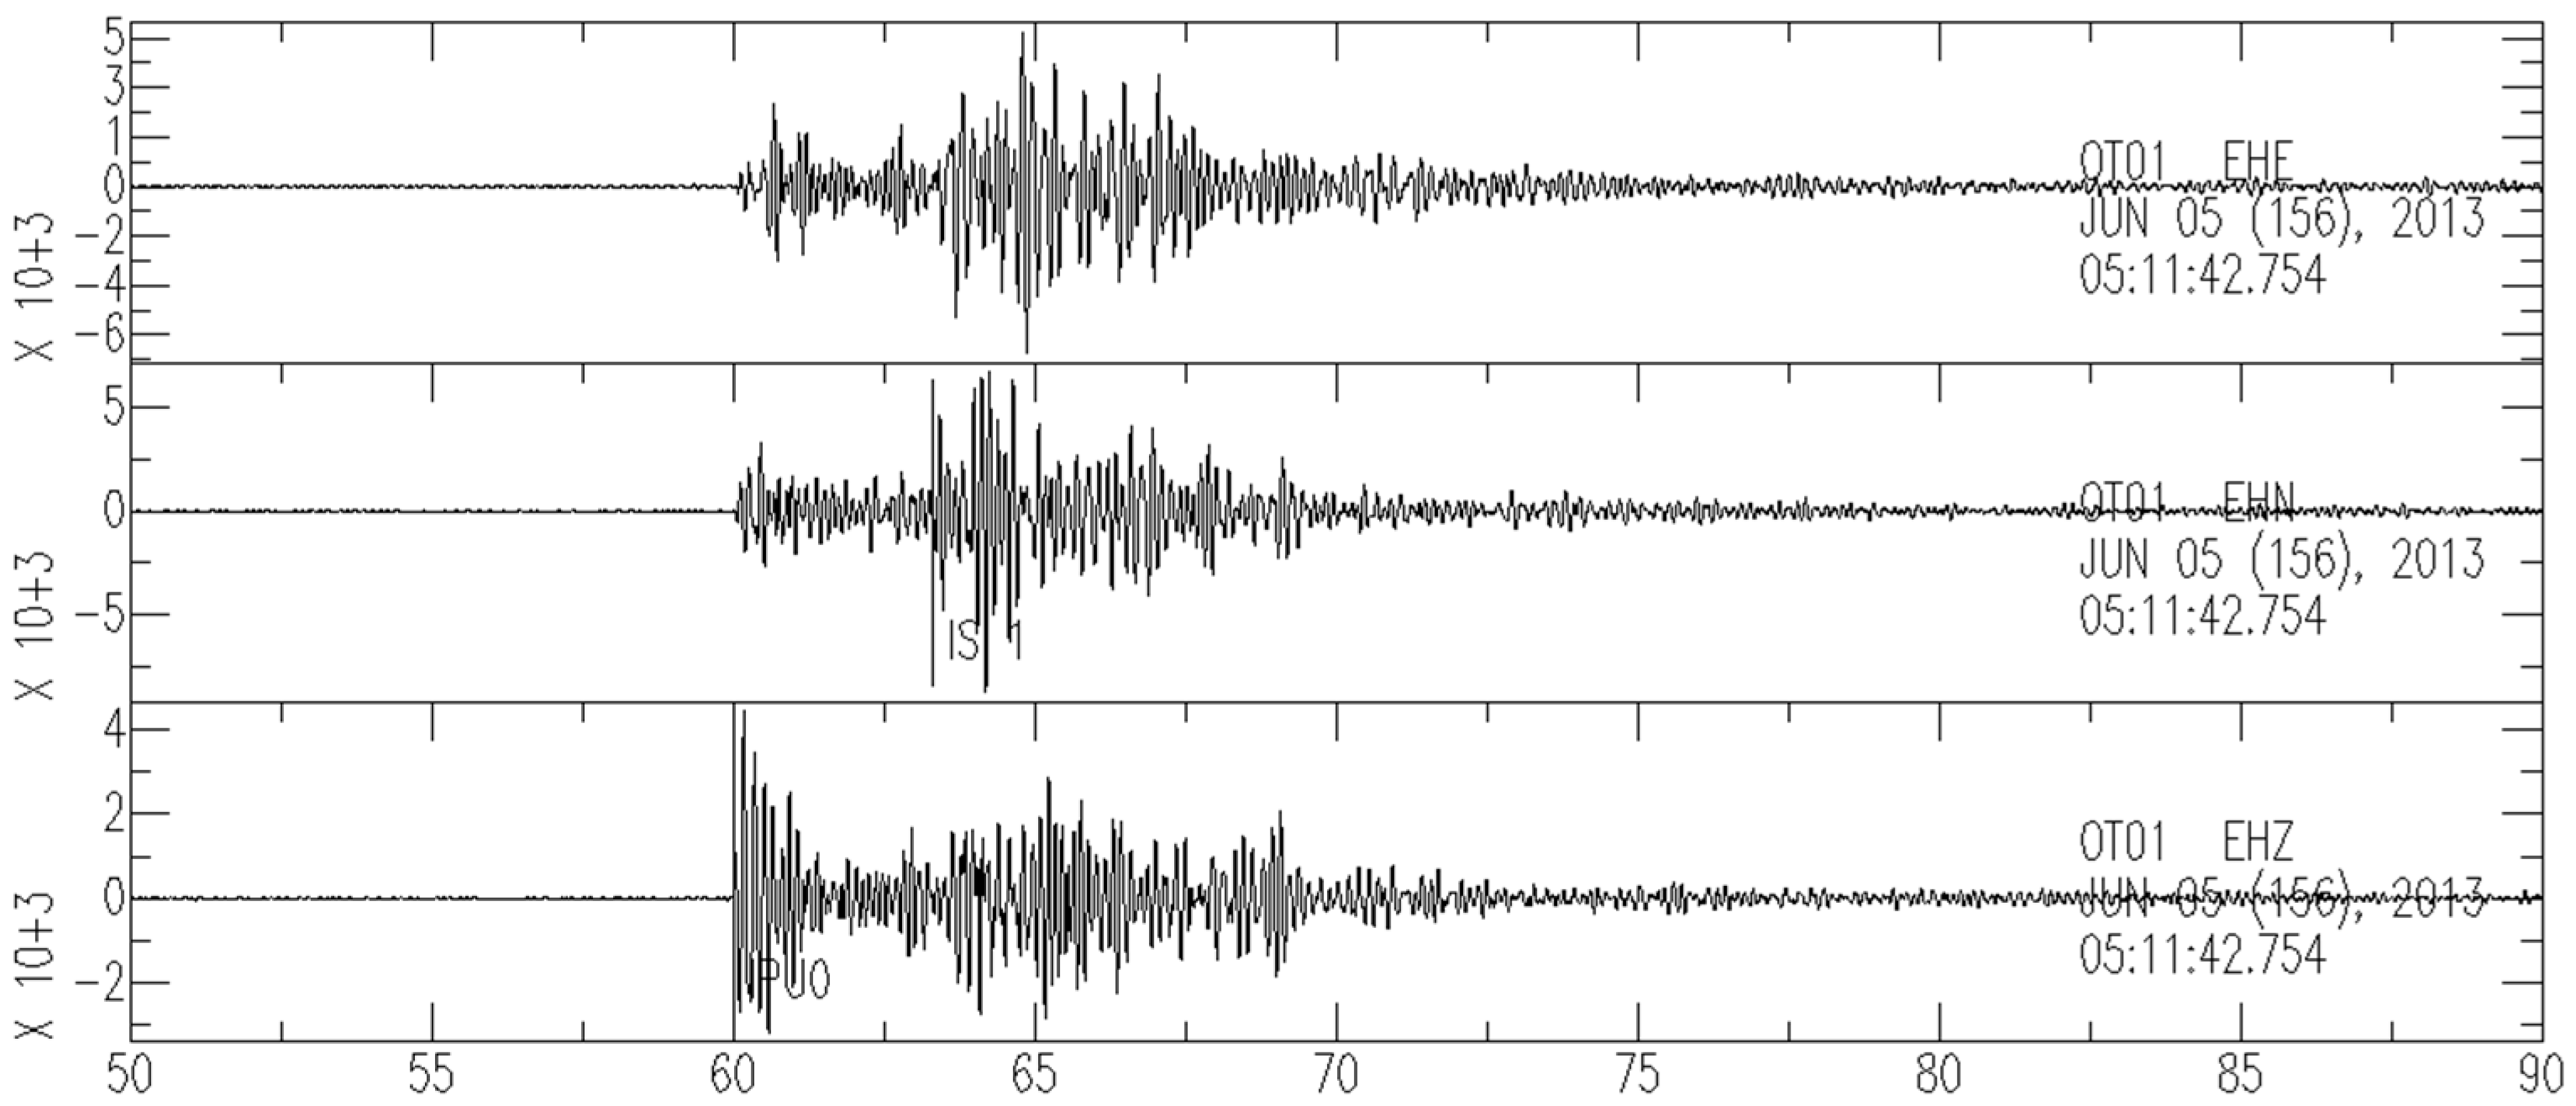
, thereby obtaining 11 new files for each seismogram component (for an example, see 
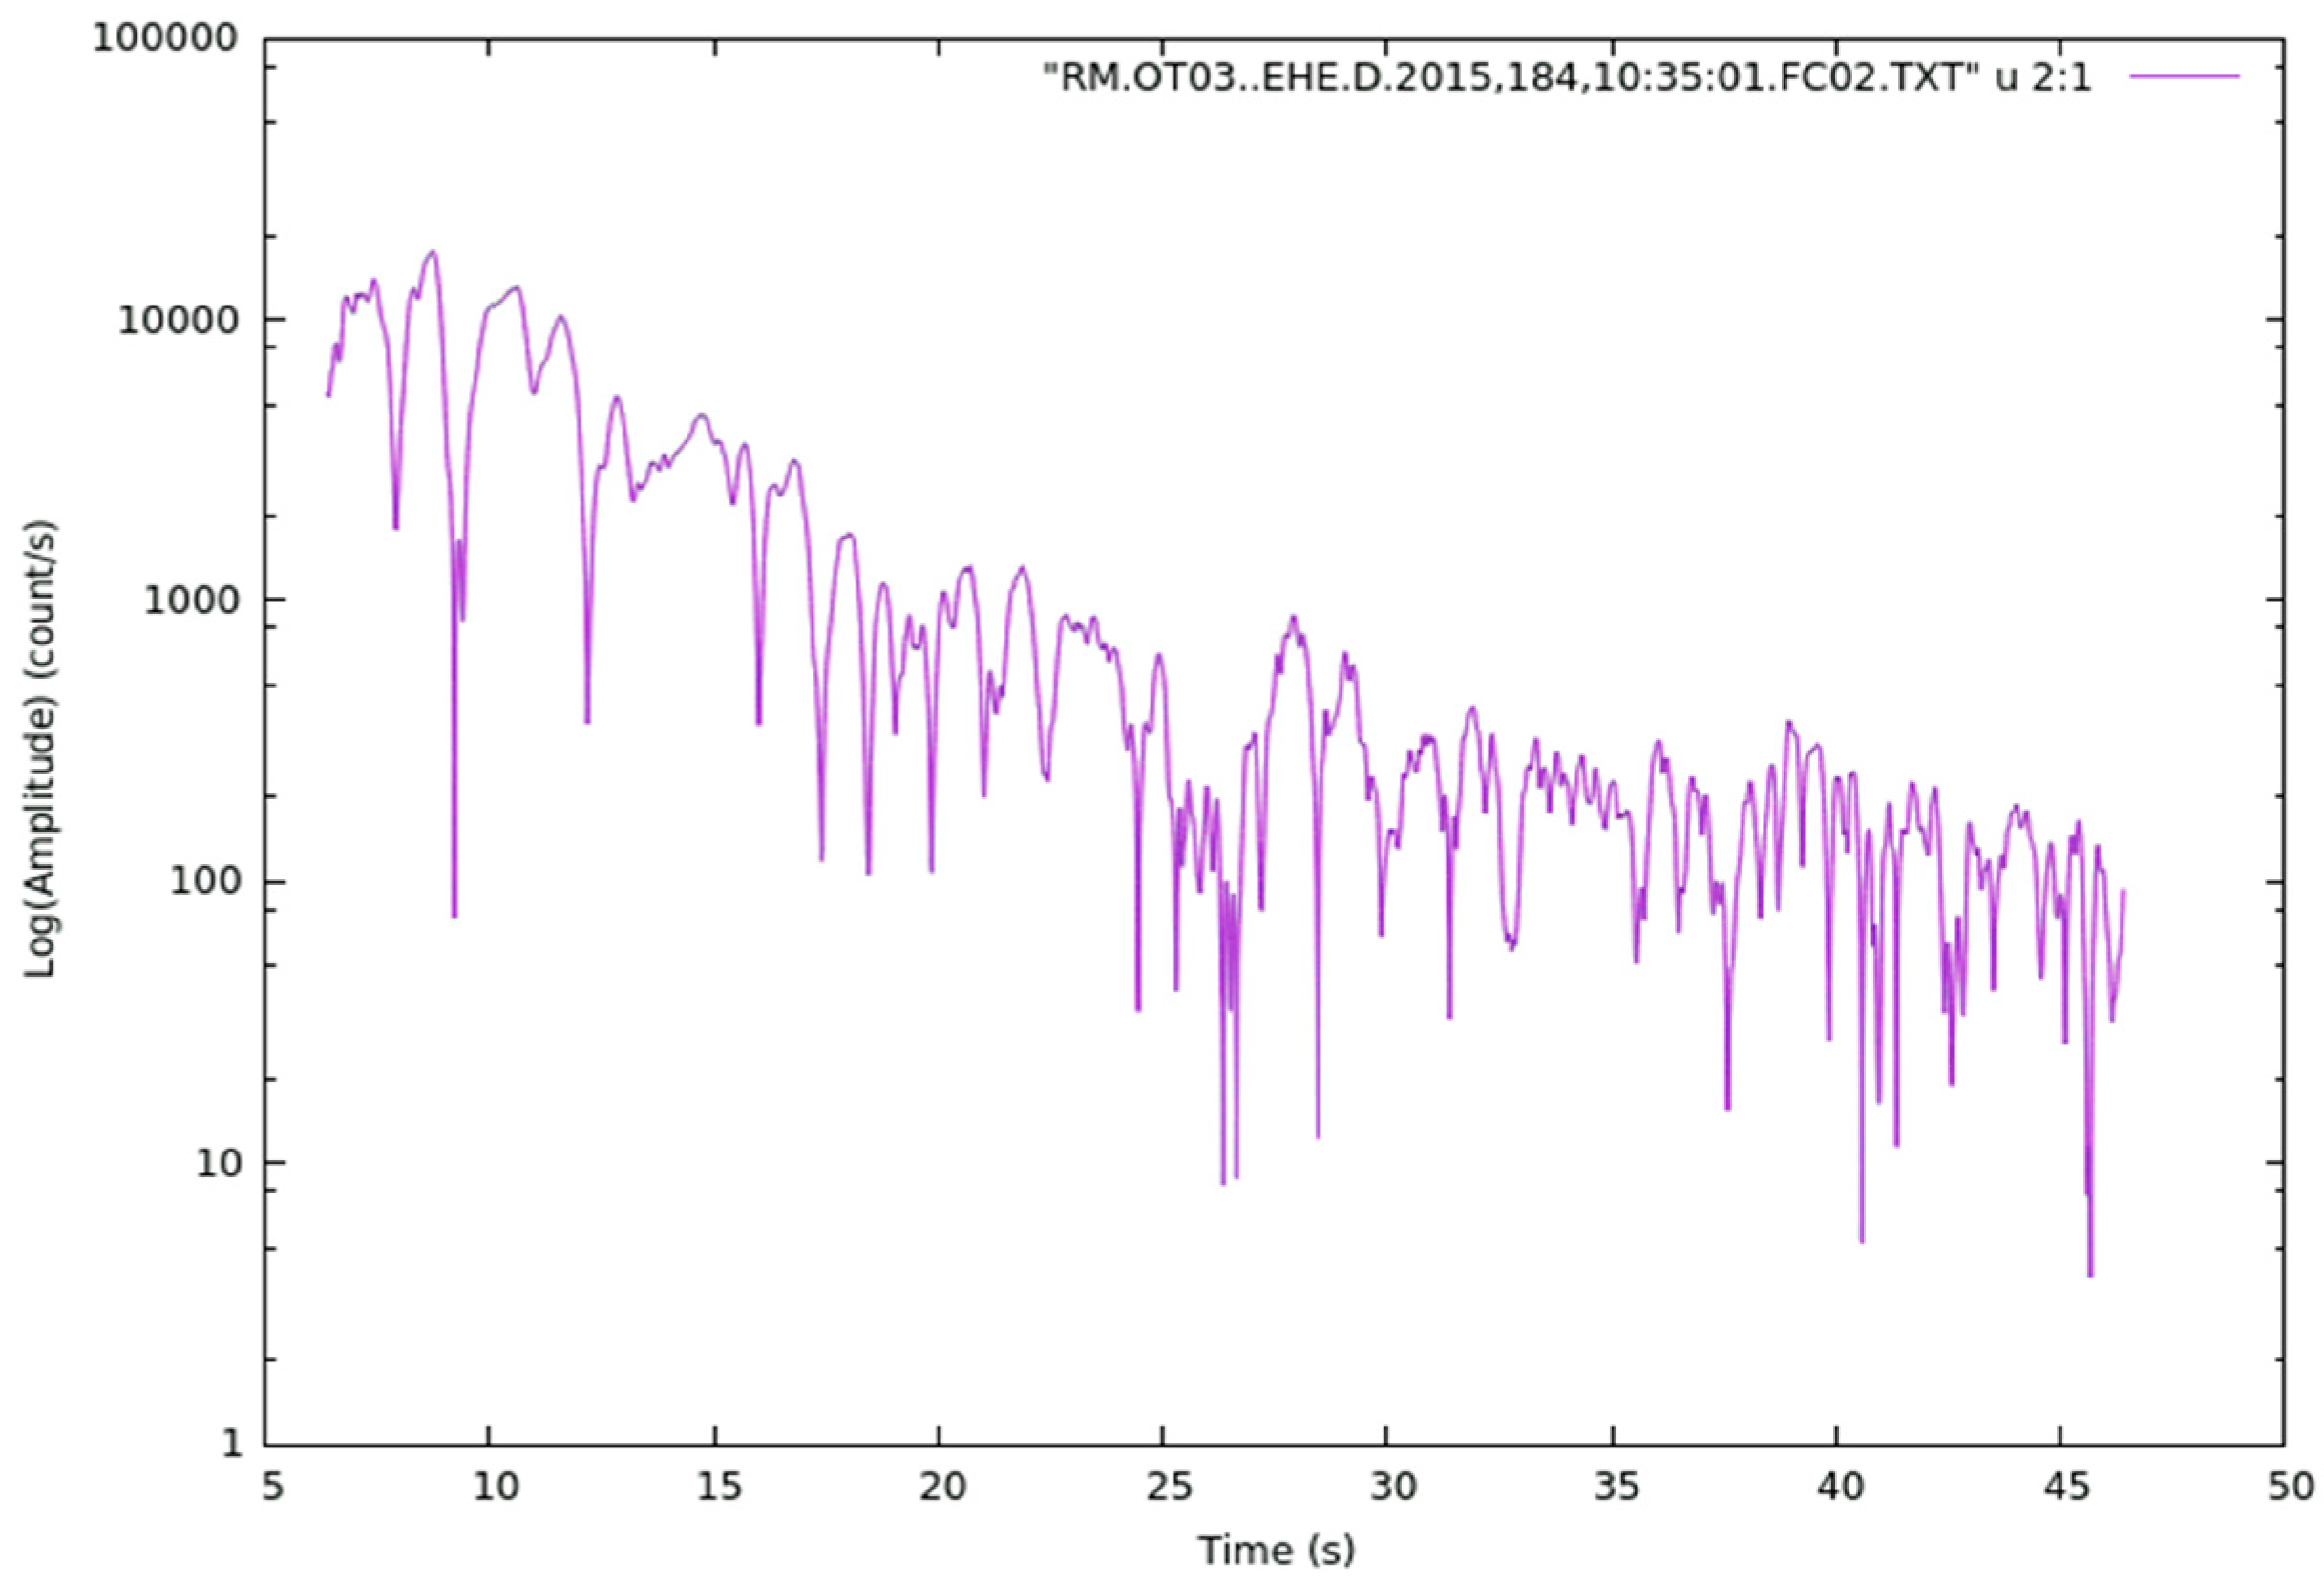
Figure 4). To each filtered seismogram, the SAC function “ENVELOPE” was applied, which computes the envelope function using a Hilbert transform using Equation (2) (for an example, see Figure 5). The released datasets are the envelopes cut inside the [T3, T4] time window, as shown in Figure 1. To these files, a linear regression in Equation (1) was applied to retrieve the Q c value at each frequency [6]. A discussion about errors and uncertainties can be found in [9].

Author Contributions

Conceptualization: M.F. and S.d.L.; Data curation: M.F., S.L. and S.d.L.; Funding acquisition: E.D.P. and A.T.; Project administration: A.T.; Resources: E.D.P. and A.T.; Supervision: M.F., S.d.L., E.D.P., G.P., E.D.P. and A.T.; Validation: M.F. and S.d.L.; Writing—original draft: M.F.; Writing—review and editing: M.F., S.L., S.d.L., E.D.P., G.P. and A.T. All authors have read and agreed to the published version of the manuscript.

Funding

This work was partially supported by Project PRIN n. 201743P29 FLUIDS (Detection and tracking of crustal fluid by multi-parametric methodologies and technologies). E.D.P. was partially funded by the Spanish Mineco Project FEMALE, PID2019-106260GB-I00.

Institutional Review Board Statement

Not applicable.

Informed Consent Statement

Not applicable.

Data Availability Statement

Data [1] are available at Mendeley Data repository: doi:10.17632/w9hsj2whzm.1, accessed on 19 August 2021.

Acknowledgments

The computational work was executed on the IT resources of the ReCaS-Bari data center, which have been made available by two projects financed by the MIUR (Italian Ministry for Education, University and Re-search) in the “PON Ricerca e Competitività2007-2013” Program: ReCaS (Azione I—Inter- venti di rafforzamento strutturale, PONa3_0 0 052, Avviso 254/Ric) and PRISMA (Asse II -Sostegno all’innovazione, PON04a2_A).

Conflicts of Interest

The authors declare no conflict of interest.

References

  1. Filippucci, M.; Lucente, S.; de Lorenzo, S.; Del Pezzo, E.; Tallarico, A. Energy Envelope Data for Seismic Attenuation Study of the Gargano Promontory (Southern Italy) and Surrounding Regions. Mendeley Data 2021, 1. [Google Scholar] [CrossRef]
  2. Filippucci, M.; Miccolis, S.; Castagnozzi, A.; Cecere, G.; de Lorenzo, S.; Donvito, G.; Falco, L.; Michele, M.; Nicotri, S.; Romeo, A.; et al. Seismicity of the Gargano Promontory (Southern Italy) after 7 Years of Local Seismic Network Operation: Data Release of Waveforms from 2013 to 2018. Data Brief 2021, 35, 106783. [Google Scholar] [CrossRef] [PubMed]
  3. de Lorenzo, S.; Michele, M.; Emolo, A.; Tallarico, A. A 1D P-Wave Velocity Model of the Gargano Promontory (South-Eastern Italy). J. Seismol. 2017, 21, 909–919. [Google Scholar] [CrossRef]
  4. Aki, K.; Chouet, B. Origin of Coda Waves: Source, Attenuation, and Scattering Effects. J. Geophys. Res. (1896–1977) 1975, 80, 3322–3342. [Google Scholar] [CrossRef]
  5. Bianco, F.; Pezzo, E.D.; Malagnini, L.; Luccio, F.D.; Akinci, A. Separation of Depth-Dependent Intrinsic and Scattering Seismic Attenuation in the Northeastern Sector of the Italian Peninsula. Geophys. J. Int. 2005, 161, 130–142. [Google Scholar] [CrossRef] [Green Version]
  6. Filippucci, M.; Del Pezzo, E.; de Lorenzo, S.; Tallarico, A. 2D Kernel-Based Imaging of Coda-Q Space Variations in the Gargano Promontory (Southern Italy). Phys. Earth Planet. Int. 2019, 297, 106313. [Google Scholar] [CrossRef]
  7. Filippucci, M.; Pierri, P.; de Lorenzo, S.; Tallarico, A. The Stress Field in the Northern Apulia (Southern Italy), as Deduced from Microearthquake Focal Mechanisms: New Insight from Local Seismic Monitoring. In International Conference on Computational Science and Its Applications; Springer: Cham, Switzerland, 2020; pp. 914–927. [Google Scholar] [CrossRef]
  8. Filippucci, M.; Tallarico, A.; Dragoni, M.; de Lorenzo, S. Relationship Between Depth of Seismicity and Heat Flow: The Case of the Gargano Area (Italy). Pure Appl. Geophys. 2019, 176, 2383–2394. [Google Scholar] [CrossRef]
  9. Filippucci, M.; Lucente, S.; Del Pezzo, E.; de Lorenzo, S.; Prosser, G.; Tallarico, A. 3D-Kernel Based Imaging of an Improved Estimation of (Qc) in the Northern Apulia (Southern Italy). Appl. Sci. 2021, 11, 7512. [Google Scholar] [CrossRef]
  10. Miccolis, S.; Filippucci, M.; de Lorenzo, S.; Frepoli, A.; Pierri, P.; Tallarico, A. Seismogenic Structure Orientation and Stress Field of the Gargano Promontory (Southern Italy) From Microseismicity Analysis. Front. Earth Sci. 2021, 9, 179. [Google Scholar] [CrossRef]
  11. Goldstein, P.; Dodge, D.; Firpoand, M.; Lee Minner, S. Signal Processing and Analysis Tools for Seismologists and Engineers; Lee, W.H.K., Kanamori, H., Jennings, P.C., Kisslinger, C., Eds.; Academic Press: London, UK, 2003. [Google Scholar]
  12. IRIS: Data Services: Nodes: DMC: Software Downloads: SAC. Available online: http://ds.iris.edu/ds/nodes/dmc/software/downloads/sac/ (accessed on 22 May 2021).
Figure 1. Plot of the first envelope file in Table 3, as an example.
Data 06 00098 g001
Figure 2. Plot of the first envelope file in Table 6, as an example.
Data 06 00098 g002
Figure 3. Three-component seismograms at station OT01, as an example. Over each record, the origin time in absolute time is overwritten; the X-axis is time (s), the Y-axis is amplitude (counts/s). The P-wave marker (IPU0) and S-wave marker (IS) are overwritten.
Data 06 00098 g003
Figure 4. Three-component seismograms at station OT01, filtered with f c = 6 Hz and band-width [4.24; 8.48] Hz, as an example. Over each record, the origin time in absolute time is overwritten; the X-axis is time (s), the Y-axis is amplitude (counts/s).
Data 06 00098 g004
Figure 5. Envelopes of the filtered seismograms in Figure 4. Over the first record, the T3 and T4 markers are overwritten; the X-axis is time (s), the Y-axis is amplitude (counts/s).
Data 06 00098 g005
Table 1. Contents of the folder Seismic_Envelopes_2013.
First DatasetEvent Folders
Seismic_Envelopes_2013201306031549
201306050513
201306061512
Table 2. Contents of the event folder.
Event FolderEnvelope File
201306031549envOT01.EHE.f02.LAPSE.dat
envOT01.EHE.f03.LAPSE.dat
envOT01.EHE.f04.LAPSE.dat
Table 3. Contents of the envelope file.
Envelope FileFile Content
envOT01.EHE.f02.LAPSE.dat(Time s)(Amplitude counts/s)
56,998.7383148.276596
56,998.7422151.102402
56,998.7461154.158295
Table 4. Content of the folder Seismic_Envelopes_2015_2018.
First DatasetEvent Folders
Seismic_Envelopes_2015_2018201607031216
201507040338
201507201850
Table 5. Content of the event folder.
Event FolderEnvelope File
201607031216RM.OT03..EHE.D.2015,184,10:35:01.FC02.TXT
RM.OT03..EHE.D.2015,184,10:35:01.FC02.TXT
Table 6. Content of the envelope file.
Envelope FileFile Content
RM.OT03..EHE.D.2015,184,10:35:01.FC02.TXT(Amplitude counts/s)(Time s)
5549.866216.40
5474.113776.41
5359.189046.42
Publisher’s Note: MDPI stays neutral with regard to jurisdictional claims in published maps and institutional affiliations.

