
An Ensemble Model for Predicting Retail Banking Churn in the Youth Segment of Customers


1
Symbiosis Centre for Information Technology, Symbiosis International, Deemed University, Pune 411057, India
2
Symbiosis Institute of Business Management, Pune, Symbiosis International, Deemed University, Pune 412115, India
*
Author to whom correspondence should be addressed.
Data 2022, 7(5), 61; https://doi.org/10.3390/data7050061
Submission received: 23 April 2022
/
Revised: 4 May 2022
/
Accepted: 5 May 2022
/
Published: 9 May 2022
(This article belongs to the Special Issue Knowledge Extraction from Data Using Machine Learning)
Abstract
:(1) This study aims to predict the youth customers’ defection in retail banking. The sample comprised 602 young adult bank customers. (2) The study applied Machine learning techniques, including ensembles, to predict the possibility of churn. (3) The absence of mobile banking, zero-interest personal loans, access to ATMs, and customer care and support were critical driving factors to churn. The ExtraTreeClassifier model resulted in an accuracy rate of 92%, and an AUC of 91.88% validated the findings. (4) Customer retention is one of the critical success factors for organizations so as to enhance the business value. It is imperative for banks to predict the drivers of churn among their young adult customers so as to create and deliver proactive enable quality services.
1. Introduction
The outlook of the retail banking industry towards its customers has been witnessing a steady transformation since the 2008 financial crisis [1]. Marketing strategies of the pre-crisis period primarily focused on acquiring more and more customers instead of creating new bank accounts at a rapid pace [2]. Post the collapse of the financial markets, one of the challenging yet critical lessons learnt by the banking industry was the trade-off between new customer acquisition and existing customer retention [3]. Studies of the past found that it is seven-times more costly to acquire a new customer than to retain an existing one. It became evident that losing customers can be detrimental to the bank’s financial stability [4,5,6,7]. As one of the traditional industry verticals, the banking sector globally has been undergoing a digital revolution over the last 10 years [8]. Today, banks sit on a sizeable database of its customers, hoping to gain a competitive advantage in the industry, especially in the developing world [9]. Nevertheless, banks have not been able to keep up with the pace of technology advancement to leverage customer data in addressing one of its most recognized problems, customer churn [10].
The industry has already made significant investments in the time, cost, and effort to increase the lifetime value of customers, which is one of the universally accepted critical success factors [11,12]. On the flip side, customer churn is a critical failure factor for the banks if they do not see it coming in the first place. Therefore, predicting customer churn at the right time has become imperative [13,14]. Accurate and timely churn prediction empowers the relationship-management teams of the bank with insights to proactively create engaging customer initiatives.
Currently, there is a dearth of analysing the service quality feedback that directly impacts customer touchpoints [15]. An integral component of customer experience management is service quality analysis. It enables firms to track and analyse the myriad of touch points throughout the customer’s engagement with the firm’s products and services. Service quality analysis also strengthens the ability of a company to understand customer pain points better in this age of increasingly intricate customer behaviour.
Churn prediction is one of the most popular and widely researched application areas in data science [16]. Various data mining techniques are used to guess customer churn by identifying the most severe contributing factor. Supervised data mining algorithms, such as decision trees, genetic algorithms, k nearest neighbours, Naïve Bayes, and support vector machines, are comparatively the most extensively explored for churn prediction [15,17]. From an industry application standpoint, the telecommunication industry is by far the most extensively researched domain for churn prediction [18]. Churn prediction research works are also available in other industry verticals, such as retail, media and entertainment, and BFSI (banking, financial services, and insurance) [19].
Churn prediction research is comparatively limited in the retail banking sector. The pandemic-driven digital transformation has created a compelling need for customer defection analysis in the banking sector, specifically for a younger segment of customers [20]. The forced digital shift in retail services is a differentiating feature of the “new normal” created by the ongoing COVID-19 pandemic to the banking industry [21]. It means that customer intentions today are predominantly driven by protection motivation, causing a drastic shift in their banking engagement by behaving digitally [22].
Banks can take advantage of the digital behaviour shift by supporting their customers to utilize better digital and remote channel engagements [23]. In the pre-COVID times, customer experience in retail banking was confined majorly to customer happiness (satisfaction, loyalty, increased acceptance of services, and cost-effectiveness). Post-COVID, customer experience will predominantly be upon transparency, clarity, and trust, supported by a robust and reliable digital ecosystem [24,25]. However, the ground reality is that many banks are still evolving to enhance their digital presence among their customers.
Banks need to eloquently reset their customer segmentation to fulfil suitable needs, such as remote access and digital services. Such a resetting will help banks identify the right target segment who are highly device-centric and digitally aware [26]. Today, businesses are increasingly impacted by their youth segment of customers. Gen Z and millennials have greater exposure and savviness to a wide variety of electronic devices, which is a critical element for businesses to enhance their digital footprints [27].
This research is motivated by the fact that the customers’ learning curve about digital acceptance widely varies across age groups. The youth segment, particularly the millennials and centennials (Gen Z), find it much faster and easier to adopt the digital environment than their older counterparts. At the same time, the group is susceptible to service quality variations. Their preferences vary widely from their parents (baby boomers). Since the recent past, the banking industry has preferred to digitalize the decades-old core banking processes that have gained momentum, a welcome sign to attract and retain the youth customer segment.
The younger the customers, the lesser are their face-to-face interactions with the bank. They prefer to engage, explore, and find information online and attempt to consume services independently [28]. There is an exceedingly high degree of multitasking ability among young customers, enabling them to engage simultaneously with various digital platforms. Bank services with digital experience can leverage the skillsets of youth customers resulting in retaining them [29].
Retail bank marketers must be watchful of the churn expected from the younger generation. Recent studies found that millennials (Gen Z) customers are more likely to switch banks when compared with baby boomers (Gen X) [30]. The experience from the ongoing pandemic shows that customers in the age group of 25–34, who form the peak of technology-enabled banking usage, are likely to close their bank accounts for want of a better service through the digital platform [31,32].
Based on the context explained in the previous paragraphs, the current study can effectively identify and analyse critical factors of churn among youth customers. Therefore, the research objectives were
- To predict whether or not a young customer will discontinue his retail bank account;
- To analyse and discuss the features impacting churn using appropriate data science algorithms.
The realization of the first objective involved an in-depth analysis of the data collected by applying the most appropriate machine learning techniques. The second objective was realized by discussing the impactful features of churn based on the output from the machine learning techniques.
The rest of the research paper is organized in the following manner. Section 2 is the Literature review. It explains the extent of earlier research on the need for customer churn prediction and the widely applied data science techniques in different industry verticals and states the research gap. Section 3 is about the method. After defining the research design and setting, sampling, data collection, procedure, and instrument, the section goes on to present a detailed analysis of the data for churn prediction. Section 4 discusses the results and contribution in light of the research objectives. Section 5 is the conclusion, which summarizes the academic value of the research.
2. Literature Review
2.1. Need for Churn Prediction in the Industry
The wide use of data mining techniques to predict churn primarily involves identifying contributing factors to ensure timely marketing and sales promotion interventions to prevent defection. The availability of large volumes of demographic and transactional data combined with proven supervised data mining algorithms have ensured outcome accuracy [33]. Identifying potential churners at an early stage of the contract is critical for service providers to initiate promotional offers to prevent an imminent churn [34]. The primary focus of Chinese banks is churn prediction, aiming for customer retention and satisfaction. The imbalance of data distribution is a significant challenge impeding prediction quality. Improved balanced random forests scored high in predicting power over their traditional counterparts [35]. The integration of three algorithms, namely neural networks, regression trees, and regression, was significantly effective to predict churn based on complaint data of dissenting customers [36].
Customer relationship management is poised for a transformation in the next decade, with churn prediction taking centre-stage along with customer value analysis. The combination will enable businesses to proactively position their promotional programs to specific customer groups across multiple age groups [37]. Churn prediction is considered a critical use case in the banking industry. Predictive algorithms on customer quitting can enable banks to identify the sensitive features that drive churn. A sensitivity analysis can enhance a bank’s ability to know the customer closely and can alert a probable decision to churn [38]. Churn prediction is an integral part of customer relationship management. It enables the combination of various types of predictors (demographic and environmental) and contributes to creating a comprehensive retention model [39].
Churn prediction in an information-intensive industry, such as financial services, can significantly benefit in understanding customer attrition factors and in intelligent identification of prevention strategies to remain competitively advantageous [40]. The retention of loyal customers and constantly monitoring their pain and gain points is a crucial result area to the services industry [41]. Investment in data analytics has considerably increased across all of the industry verticals. The identification of complex patterns in customer data is a significant differentiator among the service sector to gain a competitive edge over its rivals and progressively shift from an intuition-based to an insight-based decision support environment. Today, it is a futile effort to concentrate only on acquisition if it does not know the whys of customers leaving [42].
A customer attrition analysis is an essential to-do list in today’s banking industry because it directly impacts customer retention strategies, increasing market share and even the acquisition of new customers in a cost-effective manner [43,44]. Customer churn sharply impacts a company’s revenues, irrespective of industry types; identifying critical factors and detecting customers with a high degree of possible defection is imperative in modern-day businesses [45]. The CustomerGauge 2018 NPS® and CX Benchmarks Report present insightful retention rates across multiple industry verticals. According to the report, the banking sector is among the bottom five industry verticals with one-fourth or more customer attrition. According to the study, the retention rate of the banking industry is alarmingly below the overall industry average. Digital technologies and data science are among the top priorities for the industry to enhance its customer experience (CX) initiatives [46].
2.2. Churn Prediction Techniques
To strengthen the conversation drawn from the past research works, we present a systematic collection in Table 1 to bring out the multi-dimensional relevance of churn prediction across industries and the choice of a machine learning predictive algorithm. The table will strengthen the motivation of the current research by identifying the research gap, which is explained in the subsequent paragraph.
Based on the systematic table presented above, the banking industry is gaining a lot of research interest in churn prediction from among the bottom-ranked industries in customer retention.
However, there are less research works in the banking sector when compared with the telecommunication sector, healthcare, and retail. Hence, based on the research motivation, the current research will contribute to the gap existing in research works on retail banking churn prediction. In light of the aforementioned paragraphs, we position our research from two important standpoints. First, we substantiate the underpinning need of customer churn prediction in banking by targeting the most dynamic youth segment of the population, which has immense research potential. Second, we aim to extend the application of machine learning models of churn prediction by identifying the nativities of the banking domain.
3. Method
In this section, first we enumerate the data collection method and description of data. Then, we proceed to describe the machine learning model used for prediction drawn out of the existing literature. We applied various machine learning approaches to build the predictive models for bank customers’ churn. Finally, we present the data analysis.
3.1. Research Design
The study used an online questionnaire to collect the data [62,63]. The questionnaire comprised two broad sections and solicited data from young adult bank customers. Section 1 included the questions about the demographic characteristics of the respondents. Section 2 consisted of questions relating to the respondents’ retail banking experience. The questions were framed based on various features selected through literature search.
3.2. Setting
The study was conducted across India for two primary reasons. (i) India has the largest youth population in the world. A little over one-fifth of its populace is of the average age of 29 years [64]. (ii) India has one of the highest mobile penetrations in the world. The smartphone mobile penetration rate in 2020 reached 54% and is expected to reach 96% by 2040. During the period of 2016–2020, the rate of penetration more than doubled from 23% to 54% [65].
3.3. Sampling and Data Collection
A simple random sampling method was applied to select the sample size for the target respondents [66,67,68]. The initial target was 700 Indian respondents. However, only 628 responses were submitted, out of which only 602 records were found eligible for further processing. A total of 26 responses were dropped due to a mismatch of the profile and disinterested responses [69]. Data management was applied to arrive at a cleaned dataset consisting of the eligible samples. Data management ensured efficient and effective collection of data from varied sources and included its storage, transformation, and analysis [70,71,72].
3.4. Procedure
The online questionnaire was circulated through social media platforms such as LinkedIn and Facebook, in addition to the authors’ professional and personal networks. The survey was conducted during November and December, 2021. The survey link was opened during the first week of November and remained opened for 45 days.
3.5. Instrument
The instrument for data collection comprised of two components. Component 1 was about the features of retail banking, and 2 contained the question(s) relating to the features on a binary-type scale. The features were identified carefully from the existing literature. Table 2 presents the features and their instrument.
3.6. Data Analysis
The data analysis is presented in two segments. The first one gives the descriptive statistics pertaining to the demographic profile of the respondents (see Table 3). The second segment is the application of appropriate data science techniques and tools to create the model for the churn prediction analysis.
3.6.1. Demographic Profile

Table 3.
Respondents’ demographic profile.
| Frequency | % | ||
|---|---|---|---|
| Gender | Female | 214 | 36 |
| Male | 388 | 64 | |
| Opened any new savings Bank account in the past 1 year | Yes | 286 | 48 |
| No | 313 | 52 | |
| Closed an existing Savings Bank account in the past 1 year | Yes | 267 | 44 |
| No | 335 | 56 | |
| Type of city in which they are currently living | Metropolitan | 172 | 29 |
| Non-Metropolitan | 430 | 71 | |
| Industry | Information Technology and allied | 355 | 59 |
| Insurance | 126 | 21 | |
| Manufacturing | 66 | 11 | |
| Others (Retails, Logistics, Hospitality) | 55 | 9 | |
3.6.2. Machine Learning Models
Machine learning (ML) is a branch of Artificial Intelligence (AI), and it uses data and algorithms to help machines imitate human behaviour. Machine learning algorithms are used for predictive modelling [82]. Unsupervised and supervised algorithms are available for machine learning and are based on mathematics and statistical models. Commonly used machine-learning algorithms carry out two categories of tasks, Classification and Regression. Based on the input features, we classify a data instance and assign a class label in the classification technique. Some pertinent examples of classification scenarios include predicting whether a customer will purchase an item or not, whether a candidate will accept a job offer, and whether a student is employable [83]. On the contrary, the regression method is used for continuous values and helps identify the relationship between two variables. In this study, we have defined this problem as a classification method to predict whether the young bank customer will churn or not.
In this study, the authors used some efficient machine learning techniques, including Ridge Classifier Cross Validation (RCCV), Logistic Regression, Decision Tree, K Nearest Neighbor Classifier (KNN), Support Vector Classifier (SVC), and Linear Support Vector Classifier (Linear SVC). Ridge regression is a regression method variant used for eliminating the effects of correlated features [84]. RCCV uses cross-validation to select an optimal classification model. Logistic regression is another regression variant used for predicting the probability of certain outcomes [85]. A decision tree is a simple classifier that is based on a decision criterion to do the classification. KNN is a nonparametric method and uses the neighbours of a data point to decide its class. The Bernoulli Naive Bayes classifier and Gaussian Naive Bayes classifier are probabilistic methods that use Bernoulli distribution and Gaussian distribution, respectively. A support vector machine (SVM) is a supervised technique that is used for both classification and regression scenarios. SVM is a nonparametric method and uses a clustering approach to classify the data points by deciding the optimal boundary. The Linear SVC identifies the best-fit hyperplane for classifying the data points. These methods use the loss function to train the classifier [86].
Adaboost is a boosting-based ensemble model that modulates various classifiers on the same dataset. Furthermore, the weights of wrongly classified data points are adjusted to focus more on rightly classifying them in the next iteration. The gradient-boosting ensemble supports both classification and regression, wherein the weak decision tree learners are combined to form additive trees stepwise. Extra trees are also based on many unpruned decision trees, and predictions are made by majority voting in the case of classification problems [87,88].
We used the following steps to carry out the analysis, using the analytical tools python and Jupiter notebook:
- Data preparation: The collected data were pre-processed and checked for duplication, correctness, and missing data. Cleaning and transformation were done, and feature selection was carried out.
- Select Machine learning algorithms: 13 algorithms, including ensembles, were shortlisted for this study.
- Predictive modelling: In this step, we used a 70:30 ratio and cross-validation methods for building the models.
- Prediction and evaluation: The selected models were used to predict churn, and performances were compared. The performance matrix selected included accuracy, F1 score, sensitivity, specificity, AUC, and precision.
The classification model had the discrete output, and in this case, 1 meant that the customer will churn, and 0 meant the customer will not churn. The performance of classification ML models is evaluated using various metrics. The simplest metric used for evaluation is the classification accuracy, which indicates the correct number of predictions out of the total number of predictions. The confusion matrix provides visualization in a tabular format, with the predicted versus actual class. It shows True Positives (TP), True Negatives (TN), False Positives (FP), and False Negatives (FN). TP indicates the positive cases that are predicted correctly, TN indicates negative cases that are predicted correctly, FP indicates the positive cases that are predicted incorrectly, and FN indicates negative cases that are predicted incorrectly.
Accuracy = (TP + TN(/TP + TN + FP + FN)
The remaining metrics are calculated from the confusion matrix. Precision signifies the ratio of TP and the total number of positives.
Precision = TP/TP + FP
Recall/Sensitivity signifies the ratio of true positives to all positives in the truth table.
Recall = TP/TP + FN
Sensitivity = TP/TP + FN
The F1 score is the harmonic mean of precision and recall and signifies balance between precision and recall and generally gives a good score when an imbalanced dataset is used.
F1 score = (2 × precision × recall)/(precision + recall)
The area under the receiver operating characteristics curve (AUC-ROC) plots true positive rates and false positive rates on a single graph. The resulting curve is called the ROC, and the metric is the area under the curve. The AUC portrays the ability of a classifier to segregate positive and negative classes, and a perfect classification will give AUC 1. Specificity indicates the proportion of TN that is correctly predicted.
Specificity = TN/TN + FN
In this study, we compared the various ML models using metrics such as accuracy, sensitivity/recall, precision, specificity, AUC, and F1 score. In this study, we gave preference to F1 and AUC scores while selecting models [89].
- Model selection: Based on the performance matrix above-mentioned, the model was finalized.
This problem can be considered a classification problem to predict whether a customer will churn or not. Hence, the Supervised machine learning approaches, including ensembles, were selected as the candidate techniques for building the predictive model.
The base models were built, and then, hyperparameter tuning was performed to find out whether that helped in increasing the predictive performance of models.
The ExtraTrees algorithm is an ensemble method and uses a top-down approach to make an unpruned decision from many decision trees. It uses a full learning sample and has few hyperparameters. In this study, we used the number of decision trees, the number of input features randomly selected for each split point, and a new split point creation criteria in terms of the number of minimum nodes. Extra trees are considered an extension of the random forest algorithm and use a subset of random features for training the base estimators. It does not overfit the dataset [90,91].
As the model’s hyperparameters influence the predictive performance, robustness, and generalization capability, hyperparameter selection is very important. The cross-validation approach was used for optimization and to prevent overfitting problems. In this study, we used 10-fold cross-validation for optimal hyperparameter selection. We used the Gini impurities as the criterion for splits. Gini Impurity refers to the likelihood of incorrect classification.
Gini importance is used to calculate the node impurity, and feature importance here means the reduction in impurity of a node with the weight number of samples reaching the node out of the total samples.
Node impurity can be calculated as
whereas
nodej = wjIj − wl(j)Il(j) − wr(j)Ir(j)
- nodej = importance of node j
- wj = weighted number of samples arriving at node j
- Ij = impurity of node j
- l(j) = child node on the left
- r(j) = child node on the right
- Feature importance of a node i
fi = ∑j:split nodej on feature i nodej/∑j∈all nodes nodej
This means that features are normalized against the sum of all features values and then divided by the total no. of trees to get the feature importance.
A zero Gini impurity indicates that all samples are of the same class. Thus, a lower Gini is better, and generally, the Gini values are between 0 and 0.5 [92]. The tree depth was not tuned for this study, as the features were not very large. Extra trees gave a decent accuracy when constructed with 72 trees, and the accuracy did not increase much with an increase in the number of trees. Hence, we kept the number of trees at 72.
3.6.3. Results
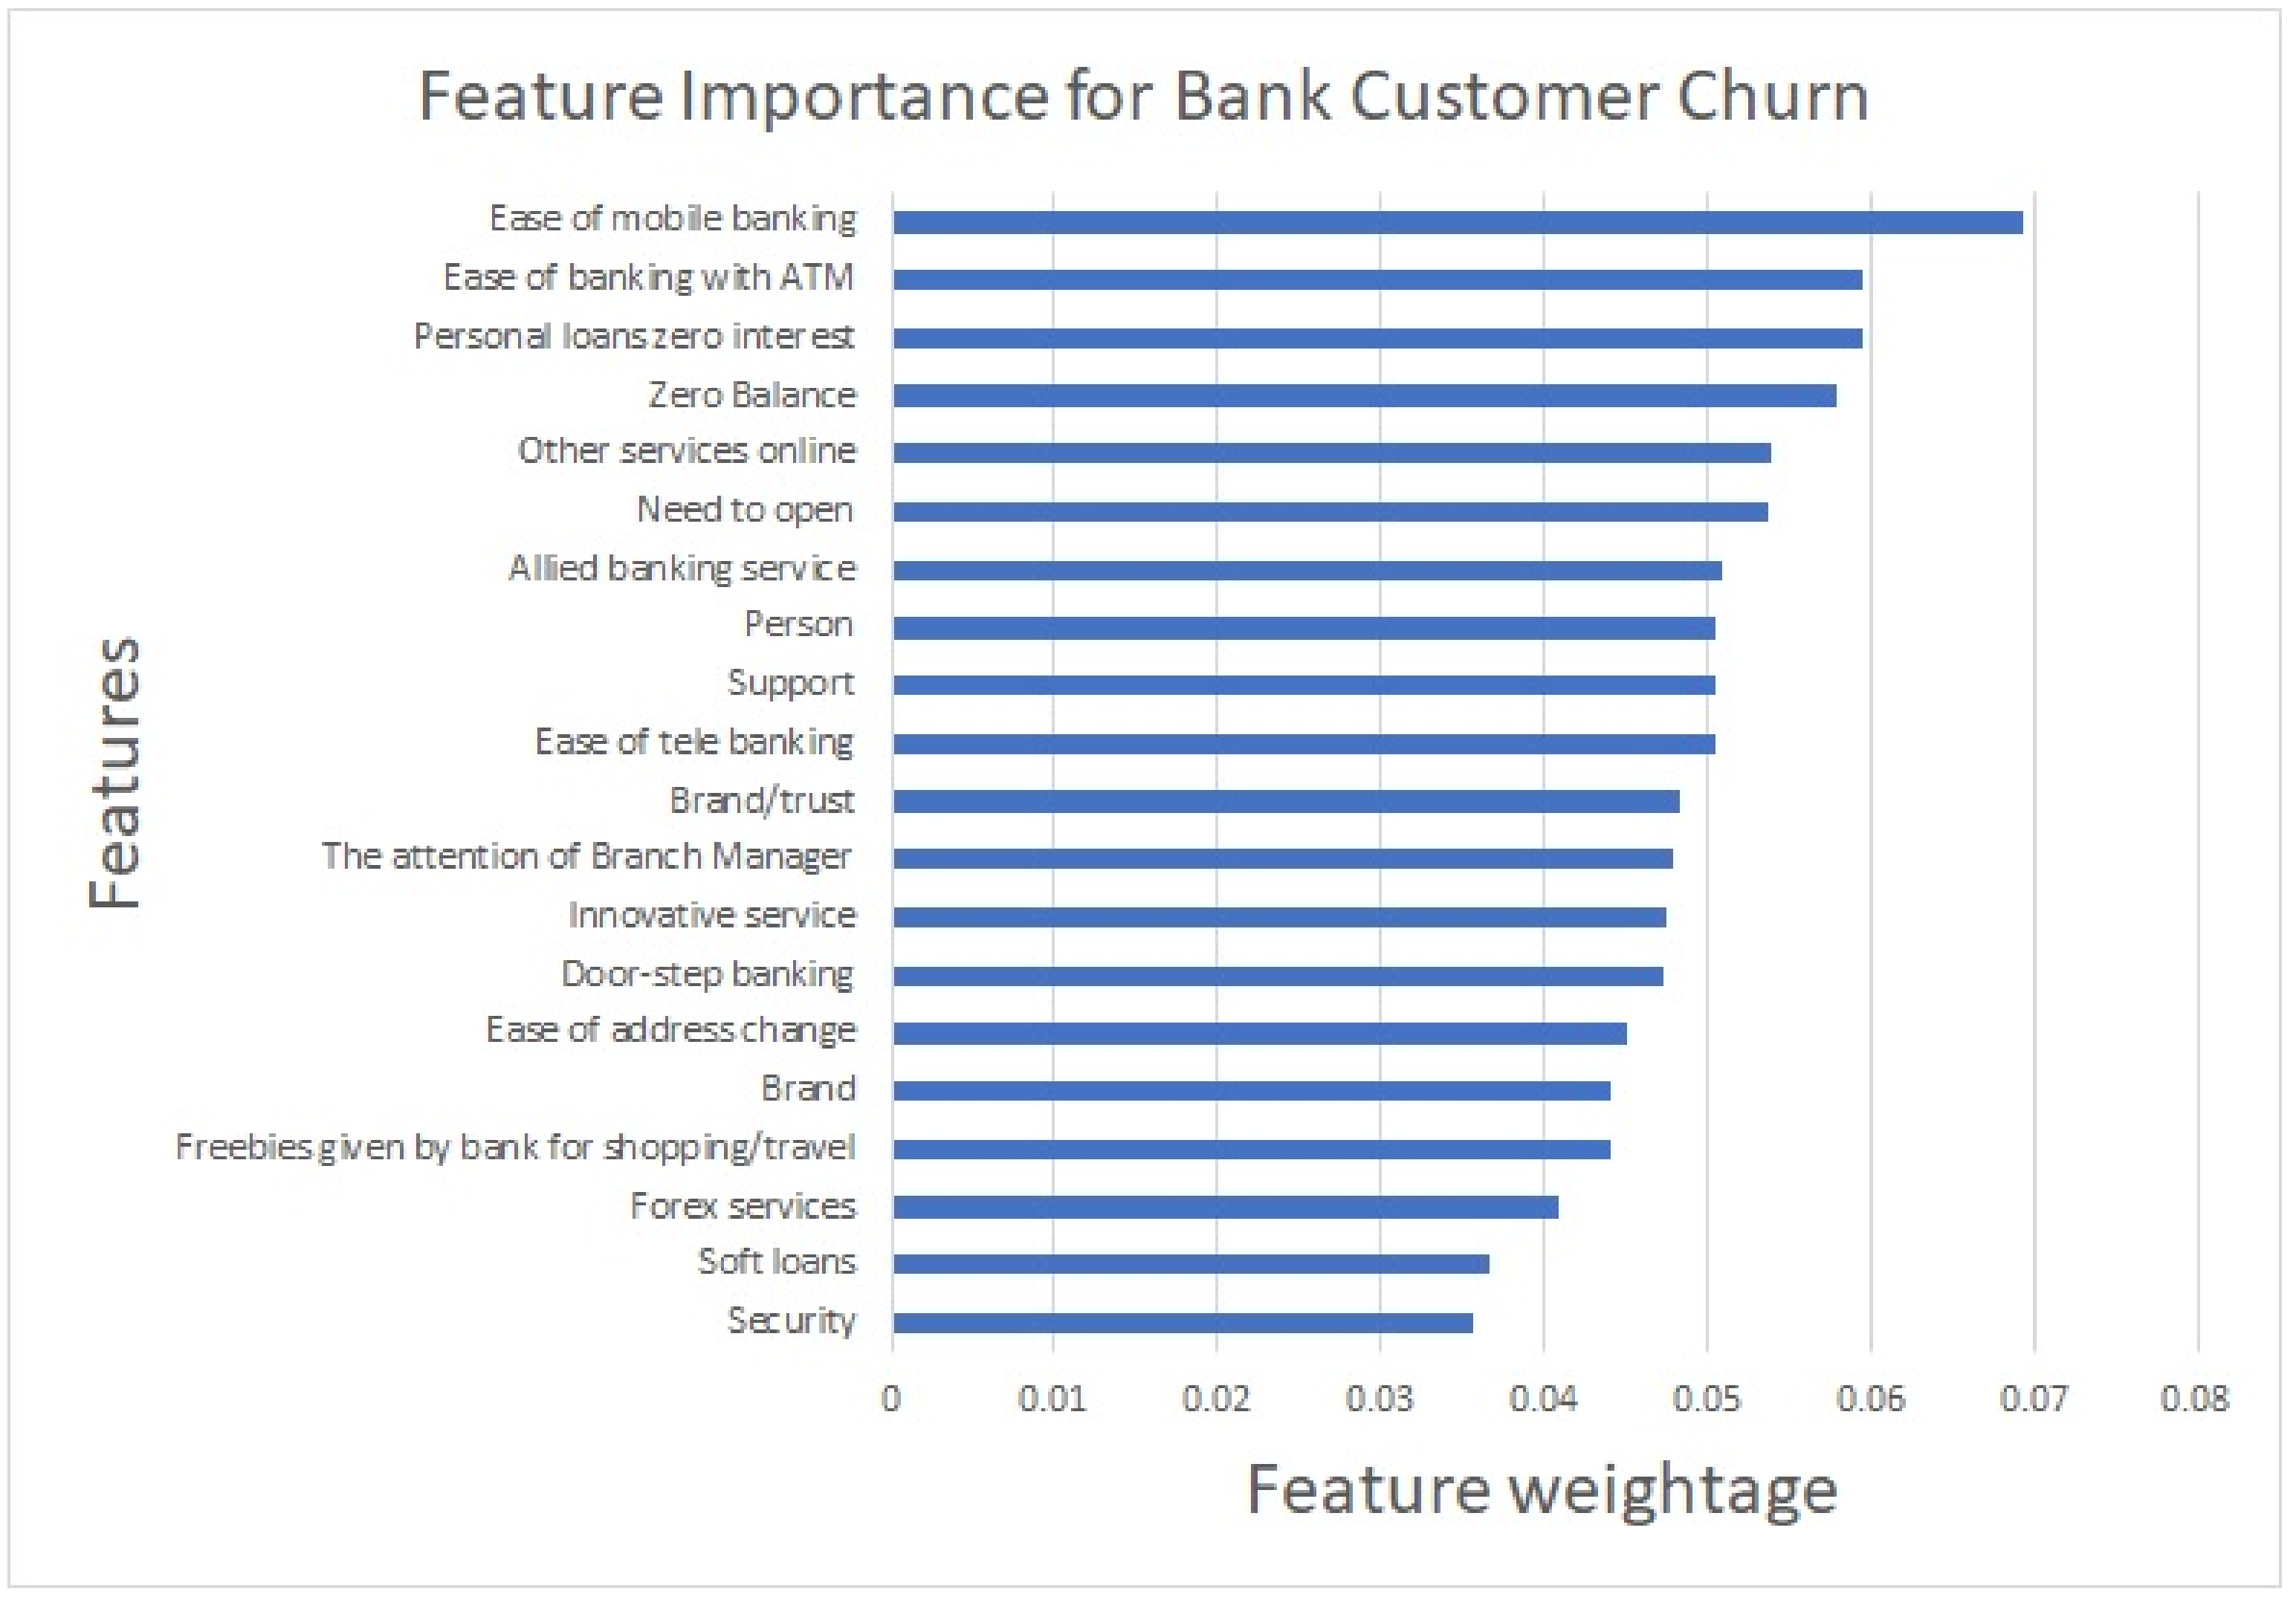
The models built were compared against well-known performance metrics and are summarized in Table 4. The results were sorted as per the value of the metrics in descending order. The final model that we proposed is an ensemble ExtraTreeClassifier, which gave an accuracy of 92%, along with an AUC of 0.9188. In this study, we further analysed the feature importance in the churn prediction, which is presented in Figure 1. Feature importance was calculated using the sklearn feature_importances_ attribute. Furthermore, we found that the Gini impurities shown as feature importances were closer to zero.
It was found that all the features were relevant and significant in customers’ association with the bank. However, the ease of mobile banking and the ease of banking with an ATM were the most deciding factors for a customer to continue with the bank. Though security in banking is very relevant in this digital world, the study revealed that security was not a primary concern for customers’ churn. It was also important to note that customers were not worried about the bank’s soft loan provisions.
4. Discussion
Digital transformation has impacted the Banking, Financial services, and insurance sectors heavily, and the way banks engage with the customers has changed tremendously. Especially, young adults prefer to have more conveniences while availing the banking services and prefer online engagement. The study effectively understood the young customers’ choices, and the predictive model emerged as an acceptable one, with good performance measurement.
In this study, relevant machine learning algorithms were used to build models and further make predictions. The 10-fold cross validation methods were applied to candidate machine learning algorithms for reducing overfitting and fine-tuning hyperparameters. The Naïve Bayes variants BenoulliNB and GaussianNB performances were found to not be sufficient. This indicates a possible relationship between features that affect the accuracy of the probabilistic method, such as naïve Bayes. Regression variants, such as logistic regression, Ridge classifier, and KNN, gave average performance, whereas tree-based ensembles gave better performances. When hyperparameter tuning was applied with k = 3 to k = 20, KNN gave the best performance at k = 4, wherein the training and test accuracy was found to be realistic, and not much variance was observed. When hyperparameters such as the number of trees, split criteria, and the random split were used on a random forest, the performance was found to be better at 100 trees, and no considerable improvement was observed with an increase in trees. Extra trees showed a better performance at 72 trees with a random split and Gini impurities, and the addition of more trees was not found to increase performance. It was also noted that the ExtraTrees gave a similar satisfactory performance at depth = 12 with 72 trees. Overall, ExtraTrees gave better performance in terms of accuracy, precision, sensitivity, AUC, and F1 score. Hence, Extra trees were selected as the final model, with 92% accuracy and an AUC of 0.9188 and F1-score of 0.9286. As this study used distribution-based, penalty-based, and ensemble-based models as candidates, the results of AUC were found to vary from approximately between 61% and 91%. However, for tree-based ensembles, the models gave performance in a narrow range.
The feature importance extracted does not have high coefficient values for features, and since Gini impurities are used for building the trees, they contribute to the predictability of model and, hence, acceptability.
Our model was comparable to similar studies and gave acceptable results. The bank churn study [35] gave varying accuracies for different models: ANN (78.1%), DT (62%), CWC-SVM (87.2%), and improved balanced random forests (IBRF) (93.2%). Another study [55] gave accuracies for models such as DT (91.58%), SVM (92.65%), NaiveBayes (78.58%), and Logistic Regression (89.65%). The customer churn problem solved in another study [52] observed accuracy measures such as LR (85.86%), DT (86.05%), NaiveBayes (85.75%), and XGBoost (95.54%). Other performance metrics such as AUC and the F1-score were also found to be proportionally better in most of the models. A Random Forest was found to give better performance, with 98.3% accuracy, 84.3% ROC, 82.7% precision, and 83.2% sensitivity in banking churn prediction [93]. The customer churn studies found in literature used machine learning models with a gaussian distribution, penalized models, and ensembles. RandomForest and boosting methods were recommended in many studies. ExtraTrees, being very recent, had no studies available in the banking domain, but they were found in intrusion prediction and image classification. As ExtraTrees are fast compared to RandomForest, they have less cost implications [89].
According to the feature importance presented in Figure 1, ATM and mobile banking services were the essential services expected from the bank. The provision for zero balance and personal loans with no interest also helped in retaining customers to a large extent. We also found that many were continuing their accounts because they had opened it for a purpose and, hence, needed to keep it open. It was also interesting to note that the bank employee’s ‘personal’ connection with the customer and the support given were taken as features in the study. Customers appreciated both. The customers also valued the brand and trust, innovative services, doorstep services, and other online services provided by banks.
The literature review showed that churn analysis is critical to any business, including banking, and the acquisition and retainment of customers need to be done in a cost-effective manner. It was also observed that churn in the Banking domain has not been addressed well compared to other industries. In this era of intelligence and analytics, the efforts made in this study to build a machine learning model are futuristic and will pave the way for technology to enable customer retainment strategies. In the literature, we found that many studies used baseline machine learning models for churn prediction, and in this study, we added various ensemble techniques to build the model. The study will enable banks to predict young customers who may churn shortly and, accordingly, connect to them for retaining them.
The contribution of our study to the existing literature is two-fold. First, the study extends the application of the ensemble model to retail banking, which is one of the most traditional, yet digitally transforming, verticals in the service industry. Second, the study addressed customer churn, a recurrent business challenge in the banking industry, specifically targeting the youth segment of the customer base, which is prone to attrition. The critical factors of churn resulting from feature importance corroborated with the characteristics and expectations of youth drawn out of literature. The study provides implications to marketing professionals of banks to position/reposition their service offerings to ensure retention of their vibrant customer base.
5. Conclusions
Retaining customers is one of the top priorities of any organization as they bring value to a business tremendously. There is enormous competition in the banking domain to attract and retain customers. The youngsters are the long-standing customers of banks, and hence, this study was conducted to predict their churn. It will help banks understand the relevant services, quality of services, and lacunas in current processes and rectify them to retain customers. We recommend the ExtraTreeClassifier to predict young customers’ churn, and the model’s performance of an AUC of 91.88 was found to be acceptable. Tree-based classifiers and ensembles performed better due to the nature of the dataset and hyperparameter tuning. The distribution-based classifiers were found to not give satisfactory performance. The study is limited in its sample size and geographical context and is cross-sectional. Therefore, we recommend that the study can be extended to similar or comparable geographies with a larger sample size to strengthen its validity and generalisability. In addition, a longitudinal study can explain the increasing or decreasing trend of the youth customer churn in retail banking services.
Author Contributions
Conceptualization, R.R.; methodology, D.P., V.B.S. and R.R.; software, D.P.; validation, V.B.S. and D.P.; writing—original draft preparation, R.R.; writing—review and editing, V.B.S.; visualization, D.P.; supervision, V.B.S.; project administration, R.R. All authors have read and agreed to the published version of the manuscript.
Funding
This research received no external funding.
Institutional Review Board Statement
Not applicable.
Informed Consent Statement
Not applicable.
Data Availability Statement
Data sharing is not applicable to this article due to ethical issue.
Conflicts of Interest
The authors declare no conflict of interest.
References
- Rughoo, A.; Sarantis, N. The global financial crisis and integration in European retail banking. J. Bank. Financ. 2014, 40, 28–41. [Google Scholar] [CrossRef] [Green Version]
- Ahmed, S.; Bangassa, K.; Akbar, S. A study on trust restoration efforts in the UK retail banking industry. Br. Account. Rev. 2019, 52, 100871. [Google Scholar] [CrossRef]
- Broby, D. Financial technology and the future of banking. Financ. Innov. 2021, 7, 47. [Google Scholar] [CrossRef]
- Amin, A.; Anwar, S.; Adnan, A.; Nawaz, M.; Alawfi, K.; Hussain, A.; Huang, K. Customer churn prediction in the telecommunication sector using a rough set approach. Neurocomputing 2017, 237, 242–254. [Google Scholar] [CrossRef]
- Colgate, M.; Stewart, K.; Kinsella, R. Customer defection: A study of the student market in Ireland. Int. J. Bank Mark. 1996, 14, 23–29. [Google Scholar] [CrossRef]
- Rust, R.T.; Zahorik, A.J. Customer satisfaction, customer retention, and market share. J. Retail. 1993, 69, 193–215. [Google Scholar] [CrossRef]
- Gupta, S.; Lehmann, D.R.; Stuart, J.A. Valuing Customers. J. Mark. Res. 2004, 41, 7–18. [Google Scholar] [CrossRef]
- Dahlman, C.; Mealy, S.; Wermelinger, M. Harnessing the Digital Economy for Developing Countries; OECD Development Centre Working Papers, No. 334; OECD Publishing: Paris, France, 2016. [Google Scholar]
- Abdulquadri, A.; Mogaji, E.; Kieu, T.A.; Nguyen, N.P. Digital transformation in financial services provision: A Nigerian perspective to the adoption of chatbot. JEC 2021, 15, 258–281. [Google Scholar] [CrossRef]
- Chayjan, M.R.; Bagheri, T.; Kianian, A.; Someh, N.G. Using data mining for prediction of retail banking customer’s churn behaviour. Int. J. Electron. Bank. 2020, 2, 303. [Google Scholar] [CrossRef]
- Libai, B.; Bart, Y.; Gensler, S.; Hofacker, C.F.; Kaplan, A.; Kötterheinrich, K.; Kroll, E.B. Brave New World? On AI and the Management of Customer Relationships. J. Interact. Mark. 2020, 51, 44–56. [Google Scholar] [CrossRef]
- Kumar, V. A theory of customer valuation: Concepts, metrics, strategy, and implementation. J. Mark. 2018, 82, 1–19. [Google Scholar] [CrossRef] [Green Version]
- Yaseen, A. Next-wave of E-commerce: Mobile customers churn prediction using machine learning. Res. J. Comput. Sci. Inf. Technol. 2021, 5, 62–72. [Google Scholar] [CrossRef]
- Chauhan, S.; Akhtar, A.; Gupta, A. Customer experience in digital banking: A review and future research directions. IJQSS 2022, 14, 311–348. [Google Scholar] [CrossRef]
- Al Zadjali, M.; Al Busaidi, K.A. The values of BI-empowered customer service in telecom. IJECRM 2018, 11, 363. [Google Scholar] [CrossRef]
- Hassani, H.; Huang, X.; Silva, E.; Ghodsi, M. Deep Learning and Implementations in Banking. Ann. Data Sci. 2020, 7, 433–446. [Google Scholar] [CrossRef]
- Chen, P.-Y.; Hsieh, C.-J.; Li, B.; Liu, S. Third Workshop on Adversarial Learning Methods for Machine Learning and Data Mining (AdvML 2021). In Proceedings of the 27th ACM SIGKDD Conference on Knowledge Discovery & Data Mining, Virtual Event, Singapore, 14–18 August 2021; ACM: New York, NY, USA, 2021; pp. 4112–4113. [Google Scholar] [CrossRef]
- Ahn, J.; Hwang, J.; Kim, D.; Choi, H.; Kang, S. A Survey on Churn Analysis in Various Business Domains. IEEE Access 2020, 8, 220816–220839. [Google Scholar] [CrossRef]
- Borah, S.B.; Prakhya, S.; Sharma, A. Leveraging service recovery strategies to reduce customer churn in an emerging market. J. Acad. Mark. Sci. 2020, 48, 848–868. [Google Scholar] [CrossRef]
- Senanu, B.; Narteh, B. Banking sector reforms and customer switching intentions: Evidence from the Ghanaian banking industry. J. Financ. Serv. Mark. 2022. ahead-of-print. [Google Scholar] [CrossRef]
- Ajmal, M.M.; Khan, M.; Shad, M.K.; AlKatheeri, H.; Jabeen, F. Socio-economic and technological new normal in supply chain management: Lessons from COVID-19 pandemic. IJLM 2021. ahead-of-print. [Google Scholar] [CrossRef]
- Caimi, G.; Anderson, J.; Hoppe, F. COVID-19: Building a Digital Bridge to the New Normal. 2020. Available online: https://bit.ly/39ImmDR (accessed on 2 April 2022).
- Diebner, R.; Silliman, E.; Ungerman, K.; Vancauwenberghe, M. Adapting Customer Experience in the Time of Coronavirus. 2020. Available online: https://www.mckinsey.com/business-functions/marketing-and-sales/our-insights/adapting-customer-experience-in-the-time-of-coronavirus (accessed on 22 April 2022).
- Bhalla, R.; Osta, E. Digital transformation and the COVID-19 challenge. J. Digit. Bank. 2021, 5, 291–304. [Google Scholar]
- Hussain, M.; Papastathopoulos, A. Organizational readiness for digital financial innovation and financial resilience. Int. J. Prod. Econ. 2021, 243, 108326. [Google Scholar] [CrossRef]
- Liyanaarachchi, G.; Deshpande, S.; Weaven, S. Online banking and privacy: Redesigning sales strategy through social exchange. IJBM 2021, 39, 955–983. [Google Scholar] [CrossRef]
- Velez-Calle, A.; Mariam, M.; Gonzalez-Perez, M.A.; Jimenez, A.; Eisenberg, J.; Santamaria-Alvarez, S.M. When technological savviness overcomes cultural differences: Millennials in global virtual teams. CPOIB 2020, 16, 279–303. [Google Scholar] [CrossRef]
- Gabbi, G.; Giammarino, M.; Matthias, M.; Monferrà, S.; Sampagnaro, G. Does face-to-face contact matter? Evidence on loan pricing. Eur. J. Financ. 2019, 26, 820–836. [Google Scholar] [CrossRef]
- Borg, K.; Smith, L. Digital inclusion and online behaviour: Five typologies of Australian internet users. Behav. Inf. Technol. 2018, 37, 367–380. [Google Scholar] [CrossRef]
- Valluri, C.; Raju, S.; Patil, V.H. Customer determinants of used auto loan churn: Comparing predictive performance using machine learning techniques. J. Mark. Anal. 2021. ahead-of-print. [Google Scholar] [CrossRef]
- Chen, X.; You, X.; Chang, V. FinTech and commercial banks’ performance in China: A leap forward or survival of the fittest? Technol. Forecast. Soc. Chang. 2021, 166, 120645. [Google Scholar] [CrossRef]
- Amankwah-Amoah, J.; Khan, Z.; Wood, G.; Knight, G. COVID-19 and digitalization: The great acceleration. J. Bus. Res. 2021, 136, 602–611. [Google Scholar] [CrossRef]
- Huang, B.; Kechadi, M.T.; Buckley, B. Customer churn prediction in telecommunications. Expert Syst. Appl. 2012, 39, 1414–1425. [Google Scholar] [CrossRef]
- Wei, C.-P.; Chiu, I.-T. Turning telecommunications call details to churn prediction: A data mining approach. Expert Syst. Appl. 2002, 23, 103–112. [Google Scholar] [CrossRef]
- Xie, Y.; Li, X.; Ngai, E.W.; Ying, W. Customer churn prediction using improved balanced random forests. Expert Syst. Appl. 2009, 36, 5445–5449. [Google Scholar] [CrossRef]
- Hadden, J.; Tiwari, A.; Roy, R.; Ruta, D. Churn prediction: Does technology matter. Int. J. Intell. Technol. 2006, 1, 104–110. [Google Scholar]
- Mutanen, T.; Nousiainen, S.; Ahola, J. Customer churn prediction—A case study in retail banking. In Data Mining for Business Applications; IOS Press: Amsterdam, The Netherlands, 2010; pp. 77–83. [Google Scholar]
- Veningston, K.; Rao, P.V.; Selvan, C.; Ronalda, M. Investigation on Customer Churn Prediction Using Machine Learning Techniques. In Proceedings of International Conference on Data Science and Applications; Springer: Singapore, 2022; pp. 109–119. [Google Scholar] [CrossRef]
- Van den Poel, D.; Larivière, B. Customer attrition analysis for financial services using proportional hazard models. Eur. J. Oper. Res. 2004, 157, 196–217. [Google Scholar] [CrossRef]
- Ahn, Y.; Kim, D.; Lee, D.-J. Customer attrition analysis in the securities industry: A large-scale field study in Korea. IJBM 2019, 38, 561–577. [Google Scholar] [CrossRef]
- Khan, Y.; Shafiq, S.; Naeem, A.; Ahmed, S.; Safwan, N.; Hussain, S. Customers Churn Prediction using Artificial Neural Networks (ANN) in Telecom Industry. IJACSA 2019, 10, 132–142. [Google Scholar] [CrossRef]
- Anjum, A.; Usman, S.; Zeb, A.; Uddin, I.; Masoom, P.; Anwar, Z.; Anjum, A.; Raza, B.; Kamran, A.; Ur, S. Optimizing Coverage of Churn Prediction in Telecommunication Industry. IJACSA 2017, 8, 179–188. [Google Scholar] [CrossRef] [Green Version]
- Vo, N.N.Y.; Liu, S.; Li, X.; Xu, G. Leveraging unstructured call log data for customer churn prediction. Knowl. Based Syst. 2020, 212, 106586. [Google Scholar] [CrossRef]
- Charandabi, S.; Ghanadiof, O. Evaluation of Online Markets Considering Trust and Resilience: A Framework for Predicting Customer Behavior in E-Commerce. J. Bus. Manag. Stud. 2022, 4, 23–33. [Google Scholar] [CrossRef]
- Abou el Kassem, E.; Ali, S.; Mostafa, A.; Kamal, F. Customer Churn Prediction Model and Identifying Features to Increase Customer Retention based on User Generated Content. IJACSA 2020, 11, 522–531. [Google Scholar] [CrossRef]
- CustomerGauge. The 2018 NPS® & CX Benchmarks Report. Available online: https://customergauge.com/benchmarks-report (accessed on 2 February 2022).
- Shaaban, E.; Helmy, Y.; Khedr, A.; Nasr, M. A proposed churn prediction model. Int. J. Eng. Res. Appl. 2012, 2, 693–697. [Google Scholar]
- Ahmad, A.K.; Jafar, A.; Aljoumaa, K. Customer churn prediction in telecom using machine learning in big data platform. J. Big Data 2019, 6, 28. [Google Scholar] [CrossRef] [Green Version]
- Ullah, I.; Raza, B.; Malik, A.K.; Imran, M.; Islam, S.U.; Kim, S.W. A Churn Prediction Model Using Random Forest: Analysis of Machine Learning Techniques for Churn Prediction and Factor Identification in Telecom Sector. IEEE Access 2019, 7, 60134–60149. [Google Scholar] [CrossRef]
- Alboukaey, N.; Joukhadar, A.; Ghneim, N. Dynamic behavior based churn prediction in mobile telecom. Expert Syst. Appl. 2020, 162, 113779. [Google Scholar] [CrossRef]
- Idris, A.; Iftikhar, A.; Rehman, Z.U. Intelligent churn prediction for telecom using GP-AdaBoost learning and PSO undersampling. Clust. Comput. 2017, 22, 7241–7255. [Google Scholar] [CrossRef]
- Xu, T.; Ma, Y.; Kim, K. Telecom Churn Prediction System Based on Ensemble Learning Using Feature Grouping. Appl. Sci. 2021, 11, 4742. [Google Scholar] [CrossRef]
- Jaisakthi, S.M.; Gayathri, N.; Uma, K.; Vijayarajan, V. Customer Churn Prediction Using Stochastic Gradient Boosting Technique. J. Comput. Theor. Nanosci. 2018, 15, 2410–2414. [Google Scholar] [CrossRef]
- Mohammadzadeh, M.; Hoseini, Z.Z.; Derafshi, H. A data mining approach for modeling churn behavior via RFM model in specialized clinics Case study: A public sector hospital in Tehran. Procedia Comput. Sci. 2017, 120, 23–30. [Google Scholar] [CrossRef]
- Karvana, K.G.M.; Yazid, S.; Syalim, A.; Mursanto, P. Customer churn analysis and prediction using data mining models in banking industry. In Proceedings of the 2019 International Workshop on Big Data and Information Security (IWBIS), Bali, Indonesia, 11 October 2019; pp. 33–38. [Google Scholar] [CrossRef]
- Dingli, A.; Marmara, V.; Fournier, N.S. Comparison of Deep Learning Algorithms to Predict Customer Churn within a Local Retail Industry. IJMLC 2017, 7, 128–132. [Google Scholar] [CrossRef]
- He, Y.; Xiong, Y.; Tsai, Y. Machine Learning Based Approaches to Predict Customer Churn for an Insurance Company. In Proceedings of the 2020 Systems and Information Engineering Design Symposium (SIEDS), Charlottesville, VA, USA, 24 April 2020; pp. 1–6. [Google Scholar] [CrossRef]
- Mauritsius, T.; Kristianto; Sayoga, R.Y.; Alamas, N.; Anggraeni, M.; Binsar, F. Customer Churn Prediction Models for PT. XYZ Insurance. In Proceedings of the 2020 8th International Conference on Orange Technology (ICOT), Daegu, Korea, 18–21 December 2020; pp. 1–6. [Google Scholar] [CrossRef]
- Jain, H.; Yadav, G.; Manoov, R. Churn prediction and retention in banking, telecom and IT sectors using machine learning techniques. In Advances in Machine Learning and Computational Intelligence; Springer: Singapore, 2021; pp. 137–156. [Google Scholar] [CrossRef]
- Matuszelański, K.; Kopczewska, K. Customer Churn in Retail E-Commerce Business: Spatial and Machine Learning Approach. J. Theor. Appl. Electron. Commer. Res. 2022, 17, 165–198. [Google Scholar] [CrossRef]
- Xiahou, X.; Harada, Y. B2C E-Commerce Customer Churn Prediction Based on K-Means and SVM. J. Theor. Appl. Electron. Commer. Res. 2022, 17, 458–475. [Google Scholar] [CrossRef]
- Wright, K.B. Researching Internet-Based Populations: Advantages and Disadvantages of Online Survey Research, Online Questionnaire Authoring Software Packages, and Web Survey Services. J. Comput. Mediat. Commun. 2005, 10, JCMC1034. [Google Scholar] [CrossRef]
- Regmi, P.R.; Waithaka, E.; Paudyal, A.; Simkhada, P.; Van Teijlingen, E. Guide to the design and application of online questionnaire surveys. Nepal J. Epidemiol. 2017, 6, 640–644. [Google Scholar] [CrossRef]
- Ministry of External Affairs, GoI. One of The Youngest Populations in the World—India’s Most Valuable Asset. 2021. Available online: https://bit.ly/3L1qH2I (accessed on 22 April 2022).
- Statista. Smartphone Penetration Rate in India 2010–2040. 2021. Available online: https://bit.ly/3uY31GJ (accessed on 22 April 2022).
- Gui, M.; Argentin, G. Digital skills of internet natives: Different forms of digital literacy in a random sample of northern Italian high school students. New Media Soc. 2011, 13, 963–980. [Google Scholar] [CrossRef] [Green Version]
- Khazaal, Y.; Van Singer, M.; Chatton, A.; Achab, S.; Zullino, D.F.; Rothen, S.; Khan, R.A.; Billieux, J.; Thorens, G. Does Self-Selection Affect Samples’ Representativeness in Online Surveys? An Investigation in Online Video Game Research. J. Med. Internet Res. 2014, 16, e164. [Google Scholar] [CrossRef]
- Dewaele, J.M. Online questionnaires. In The Palgrave Handbook of Applied Linguistics Research Methodology; Palgrave Macmillan: London, UK, 2018; pp. 269–286. [Google Scholar]
- Porter, S.R.; Whitcomb, M.E. Non-response in student surveys: The Role of Demographics, Engagement and Personality. Res. High. Educ. 2005, 46, 127–152. [Google Scholar] [CrossRef]
- Chu, X.; Ilyas, I.F.; Krishnan, S.; Wang, J. Data Cleaning: Overview and Emerging Challenges. In Proceedings of the 2016 International Conference on Management of Data, San Francisco, CA, USA, 26 June–1 July 2016; ACM: New York, NY, USA, 2016; pp. 2201–2206. [Google Scholar] [CrossRef]
- Kumar, A.; Boehm, M.; Yang, J. Data Management in Machine Learning: Challenges, Techniques, and Systems. In Proceedings of the 2017 ACM International Conference on Management of Data, Chicago, IL, USA, 14–19 May 2017; ACM: New York, NY, USA, 2017; pp. 1717–1722. [Google Scholar] [CrossRef]
- Ilyas, I.F.; Rekatsinas, T. Machine Learning and Data Cleaning: Which Serves the Other? J. Data Inf. Qual. 2020; ahead-of-print. [Google Scholar] [CrossRef]
- Omar, A.; Sultan, N.; Zaman, K.; Bibi, N.; Wajid, A.; Khan, K. Customer Perception towards Online Banking Services: Empirical Evidence from Pakistan. J. Int. Bank. Commer. 2011, 16, 24. [Google Scholar]
- Jun, M.; Palacios, S. Examining the key dimensions of mobile banking service quality: An exploratory study. Int. J. Bank Mark. 2016, 34, 307–326. [Google Scholar] [CrossRef]
- Hossain, M.M.; Irin, D.; Islam, M.S.; Saha, S. Electronic-Banking Services: A Study on Selected Commercial Banks in Bangladesh. Asian Bus. Rev. 2015, 3, 53. [Google Scholar] [CrossRef] [Green Version]
- Chawla, D.; Joshi, H. Consumer attitude and intention to adopt mobile wallet in India—An empirical study. Int. J. Bank Mark. 2019, 37, 1590–1618. [Google Scholar] [CrossRef]
- Wijaya, A.F.B.; Surachman, S.; Mugiono, M. The Effect of Service Quality, Perceived Value and Mediating Effect of Brand Image on Brand Trust. J. Manaj. Kewirausahaan 2020, 22, 45–56. [Google Scholar] [CrossRef]
- Khan, I.; Hollebeek, L.D.; Fatma, M.; Islam, J.U.; Rahman, Z. Brand engagement and experience in online services. J. Serv. Mark. 2019, 34, 163–175. [Google Scholar] [CrossRef]
- Sahut, J.M. Advantages of E-Banking. J. Int. Bank. Commer. 2021, 26, 1. [Google Scholar]
- Hassan, M.K.; Rabbani, M.R.; Ali, M.A.M. Challenges for the Islamic Finance and Banking in Post COVID Era and the Role of Fintech. J. Econ. Coop. Dev. 2020, 41, 93–116. [Google Scholar]
- Kumari, P.B.; Madhumitha, L. Customer Preference in Availing New Generation Banking Facilities of ICICI (with Special Reference to Employees). Eurasian J. Anal. Chem. 2018, 13, 121–124. [Google Scholar]
- Raman, R.; Bhattacharya, S.; Pramod, D. Predict employee attrition by using predictive analytics. BIJ 2018, 26, 2–18. [Google Scholar] [CrossRef]
- Raman, R.; Pramod, D. The role of predictive analytics to explain the employability of management graduates. BIJ, 2021; ahead-of-print. [Google Scholar] [CrossRef]
- McDonald, G.C. Ridge regression. WIREs Comput. Stat. 2009, 1, 93–100. [Google Scholar] [CrossRef]
- Peng, C.-Y.J.; Lee, K.L.; Ingersoll, G.M. An Introduction to Logistic Regression Analysis and Reporting. J. Educ. Res. 2002, 96, 3–14. [Google Scholar] [CrossRef]
- Bansal, A.; Singhrova, A. Performance Analysis of Supervised Machine Learning Algorithms for Diabetes and Breast Cancer Dataset. In Proceedings of the 2021 International Conference on Artificial Intelligence and Smart Systems (ICAIS), Coimbatore, India, 25–27 March 2021; pp. 137–143. [Google Scholar] [CrossRef]
- Dong, X.; Yu, Z.; Cao, W.; Shi, Y.; Ma, Q. A survey on ensemble learning. Front. Comput. Sci. 2019, 14, 241–258. [Google Scholar] [CrossRef]
- Shtar, G.; Rokach, L.; Shapira, B.; Nissan, R.; Hershkovitz, A. Using Machine Learning to Predict Rehabilitation Outcomes in Postacute Hip Fracture Patients. Arch. Phys. Med. Rehabil. 2020, 102, 386–394. [Google Scholar] [CrossRef]
- Ampomah, E.K.; Qin, Z.; Nyame, G. Evaluation of Tree-Based Ensemble Machine Learning Models in Predicting Stock Price Direction of Movement. Information 2020, 11, 332. [Google Scholar] [CrossRef]
- Geurts, P.; Ernst, D.; Wehenkel, L. Extremely randomized trees. Mach. Learn. 2006, 63, 3–42. [Google Scholar] [CrossRef] [Green Version]
- John, V.; Liu, Z.; Guo, C.; Mita, S.; Kidono, K. Real-Time Lane Estimation Using Deep Features and Extra Trees Regression. In Image and Video Technology; Springer International Publishing: Cham, Switzerland, 2016; pp. 721–733. [Google Scholar]
- Grabmeier, J.L.; Lambe, L.A. Decision trees for binary classification variables grow equally with the Gini impurity measure and Pearson’s chi-square test. Int. J. Bus. Intell. Data Min. 2007, 2, 213. [Google Scholar] [CrossRef]
- Silveira, L.J.; Pinheiro, P.R.; Junior, L.S.D.M. A Novel Model Structured on Predictive Churn Methods in a Banking Organization. J. Risk Financ. Manag. 2021, 14, 481. [Google Scholar] [CrossRef]
Figure 1.
Feature importance in bank customer’s churn.

Table 1.
Systematic collection of churn prediction techniques across industry.
| Industry | Data Science Technique(s) | Notable Contributors |
|---|---|---|
| Telecommunication | Artificial Neural Network | [41] |
| Deep Learning, Logistic Regression, and Naïve Bayes algorithms | [45] | |
| Logistic Regressions, Linear Classifications, Naive Bayes, Decision Trees, Multilayer Perceptron Neural Networks, Support Vector Machines, and the Evolutionary Data Mining Algorithm | [33] | |
| Linear regression, neural networks, decision trees, k- nearest neighbours, genetic algorithms, Naïve Bayes, Support Vector Machines (SVM), and Multilayer Perceptron Neural Networks | [47] | |
| Decision Tree, Random Forest, Gradient Boosted Machine Tree “GBM”, and Extreme Gradient Boosting “XGBOOST” | [48] | |
| Random Forest | [49] | |
| Long Short-term Memory (LSTM) and Convolutional Neural Networks (CNN) Models | [50] | |
| Genetic Programming-based AdaBoost (GP-based AdaBoost) | [51] | |
| Ensemble Learning with feature-grouping | [52] | |
| Healthcare | Stochastic Gradient Boosting Technique | [53] |
| Decision Trees, Naïve Bayes, and Neural Networks | [54] | |
| Banking | Artificial neural networks, decision trees, and class- weighted core support vector machines (CWC- SVM) and improved balanced random forests | [35] |
| Naïve Bayes model | [38] | |
| Artificial Neural Networks (ANN) and Random Forests | [44] | |
| Support Vector Machines | [55] | |
| Retail | Convolution Neural Networks and Restricted Boltzmann Machine | [56] |
| Insurance | Randomized Trees Classifier and Gradient Boosting Model | [57] |
| Decision Tree (DT), Naïve Bayes (NB), and ANN. | [58] | |
| IT Services | Logistic regression, random forest, SVM, and Extreme Gradient Boosting (XGBoost), on three different domains. | [59] |
| e-Commerce | Logistic regression, Extreme Gradient Boosting K-means, and SVM | [60] [61] |
Table 2.
Features and Instrument for Data Collection.
| Feature | Instrument (Questions with Binary-Type Scale) | Source |
|---|---|---|
| Ease of banking with an ATM | I am not satisfied with the automated teller machine (ATM) location and access | [73,74] |
| The attention of the Branch Manager | I am not satisfied with the attention given by the Branch Manager | [74] |
| Allied banking service | The bank does not have allied banking services | [73,75] |
| Ease of address change | I cannot easily change my address via mobile or internet banking | [74] |
| Other services online | The bank does not have many essential online services | [76] |
| Ease of telebanking | I cannot do transactions via telebanking | [76,77] |
| Ease of mobile banking | I cannot do transactions very easily via mobile banking | [76,77] |
| Freebies are given by bank for shopping/travel | The bank does not provide any shopping/travel freebies | [76,77] |
| Security | The bank does not have adequate security features | [78] |
| Brand | The brand image of bank is not appealing | [77,78] |
| Zero Balance | Bank does not offer a zero-balance savings account | [79] |
| Personal loans zero interest | The bank charges interest on personal loans | [80] |
| Soft loans | The bank does not have a soft loan facility | [80] |
| Need to open | It was of NO NEED for me anymore | [79] |
| Brand/trust | The bank failed to build trust as its brand image is not good | [78] |
| Innovative service | The services provided by the bank are legacy | [74] |
| Door-step banking | The bank does not provide a door-step banking facility | [81] |
| Support | I am not satisfied with the support provided by bank | [81] |
| Person | The employees are not approachable and are unfriendly and not willing to help | [73] |
| Forex services | The Bank does not offer Forex Cards for a variety of currencies | [76] |
Table 4.
Machine learning models to predict bank customers’ churn.
| Algorithm | Accuracy | Sensitivity | Specificity | Precision | AUC | F1 Score |
|---|---|---|---|---|---|---|
| ExtraTreesClassifier | 92.0 | 0.9286 | 0.9091 | 0.9286 | 0.9188 | 0.9286 |
| BaggingClassifier | 88.0 | 0.8571 | 0.9091 | 0.9231 | 0.8831 | 0.8889 |
| RandomForestClassifier | 88.0 | 1.0000 | 0.7272 | 0.8235 | 0.8636 | 0.9032 |
| GradientBoostingClassifier | 84.0 | 1.0000 | 0.6364 | 0.7778 | 0.8182 | 0.8750 |
| DecisionTreeClassifier | 80.0 | 0.7857 | 0.8182 | 0.8462 | 0.8019 | 0.8148 |
| SVC | 80.0 | 1.0000 | 0.5455 | 0.7368 | 0.7727 | 0.8485 |
| KNeighboursClassifier | 72.0 | 0.6429 | 0.8182 | 0.8182 | 0.7305 | 0.7200 |
| AdaBoostClassifier | 72.0 | 0.7857 | 0.6364 | 0.7333 | 0.7110 | 0.7586 |
| LogisticRegression | 72.0 | 0.7857 | 0.6364 | 0.7333 | 0.7110 | 0.7586 |
| LinearSVC | 72.0 | 0.7857 | 0.6364 | 0.7333 | 0.7110 | 0.7586 |
| RidgeClassifierCV | 72.0 | 0.7857 | 0.6364 | 0.7333 | 0.7110 | 0.7586 |
| BernoulliNB | 60.0 | 0.5000 | 0.7273 | 0.7000 | 0.6136 | 0.5833 |
| GaussianNB | 60.0 | 0.5000 | 0.7273 | 0.7000 | 0.6136 | 0.5833 |
Publisher’s Note: MDPI stays neutral with regard to jurisdictional claims in published maps and institutional affiliations. |
© 2022 by the authors. Licensee MDPI, Basel, Switzerland. This article is an open access article distributed under the terms and conditions of the Creative Commons Attribution (CC BY) license (https://creativecommons.org/licenses/by/4.0/).
Share and Cite
MDPI and ACS Style
Bharathi S, V.; Pramod, D.; Raman, R. An Ensemble Model for Predicting Retail Banking Churn in the Youth Segment of Customers. Data 2022, 7, 61. https://0-doi-org.brum.beds.ac.uk/10.3390/data7050061
AMA Style
Bharathi S V, Pramod D, Raman R. An Ensemble Model for Predicting Retail Banking Churn in the Youth Segment of Customers. Data. 2022; 7(5):61. https://0-doi-org.brum.beds.ac.uk/10.3390/data7050061
Chicago/Turabian StyleBharathi S, Vijayakumar, Dhanya Pramod, and Ramakrishnan Raman. 2022. "An Ensemble Model for Predicting Retail Banking Churn in the Youth Segment of Customers" Data 7, no. 5: 61. https://0-doi-org.brum.beds.ac.uk/10.3390/data7050061