
DriverMVT: In-Cabin Dataset for Driver Monitoring including Video and Vehicle Telemetry Information


1
Information Technology and Programming Faculty, ITMO University, 197101 St. Petersburg, Russia
2
St. Petersburg Federal Research Center of the Russian Academy of Sciences (SPC RAS), 199178 St. Petersburg, Russia
*
Author to whom correspondence should be addressed.
Data 2022, 7(5), 62; https://0-doi-org.brum.beds.ac.uk/10.3390/data7050062
Submission received: 6 April 2022
/
Revised: 3 May 2022
/
Accepted: 5 May 2022
/
Published: 11 May 2022
(This article belongs to the Section Information Systems and Data Management)
Abstract
:Developing a driver monitoring system that can assess the driver’s state is a prerequisite and a key to improving the road safety. With the success of deep learning, such systems can achieve a high accuracy if corresponding high-quality datasets are available. In this paper, we introduce DriverMVT (Driver Monitoring dataset with Videos and Telemetry). The dataset contains information about the driver head pose, heart rate, and driver behaviour inside the cabin like drowsiness and unfastened belt. This dataset can be used to train and evaluate deep learning models to estimate the driver’s health state, mental state, concentration level, and his/her activity in the cabin. Developing such systems that can alert the driver in case of drowsiness or distraction can reduce the number of accidents and increase the safety on the road. The dataset contains 1506 videos for 9 different drivers (7 males and 2 females) with total number of frames equal 5119k and total time over 36 h. In addition, evaluated the dataset with multi-task temporal shift convolutional attention network (MTTS-CAN) algorithm. The algorithm mean average error on our dataset is 16.375 heartbeats per minute.
1. Introduction
Road accidents cause the death of hundreds of thousands of people every year. According to the World Health Organization, they are considered in the top ten of death causes in the low and middle income countries [1], because they affect not only the drivers and passengers but also the pedestrians. Human error is the main reason for most of these accidents. To eliminate the human factor, huge attention has been drawn to developing automated vehicles that are fully operated by Artificial Intelligence (AI).
With the advance of automated vehicle spreading in the world, driving will become a shared activity between the human and the machine, which generates demand for systems that can evaluate the driver state and his/her ability to take control of the vehicle at any moment.
Developing a driver monitoring system that can estimate the driver’s state has drawn the researchers’ attention lately. These systems aim to increase the safety level on the roads by alerting the driver. They systems include:
- The detection of the driver’s vital signs like heart rate, blood pressure, oxygen saturation, and respiratory rate.
- The detection of the driver’s mental state like fatigue.
- Measurement of the driver’s attention and concentration levels.
- Detection of the driver’s activity inside the cabin.
Over last decades, researchers investigated the drivers’ behaviours to estimate the crash risk using the naturalistic driving data like speed, acceleration, and braking. The data was collected using Global Positioning System (GPS) and On Board Diagnostics (OBD) [2], accelerometers [3], and smartphones [4] to identify risky and abnormal driving events and evaluate the crash risk. Researchers [5] developed a driver assessment and recommendation system to evaluate individual driving performance and improve the traffic safety. The researchers used features like the trip distance and duration, the average and maximum speed, the number of hard brake and speed up to adopt Gaussian mixture model-universal background model and the maximum likelihood method to capture driver signature. Researcher [6] developed a driving behavior-based relative risk evaluation model using a non-parametric optimization method taking into consideration the frequency and the severity level of the different risky driving behaviors.
Researchers [7,8,9] have studied the driver behaviour factors like: road traffic violation, lapses, fail to maintain a safe gap, errors related to visual perception failure, and others. Different methods were used to evaluate and prioritize the significant driver behavior factors related to road safety. paper [7] designed an analytic hierarchy process with best-worst method (AHP-BWM) model to evaluate driver behavior factors within a designed three-level hierarchical structure. Paper [8] introduced to combine the best-worst method with the triangular fuzzy sets as a supporting tool for ranking and prioritizing the critical driver behavior criteria. While paper [9] performed Pythagorean Fuzzy Analytic Hierarchy Process to assess and prioritize the driver critical behavior criteria designed into a hierarchical model based on data gathered from observed driver groups in Budapest city. This evaluation is valuable to make drivers aware of individual traffic risks and it may assist in the implementation of effective local road safety policies.
Researchers have developed different methods to detect the driver fatigue. Some of these methods depends on detecting biological signal like the heart rate [10,11], others depends on physhical features like the face and eyes [12,13].
In this paper, we present an annotated dataset DriverMVT (Driver Monitoring dataset with Videos and Telemetry). for monitoring the driver inside the vehicle cabin. This dataset can be used to train and evaluate deep learning models to estimate the driver’s state like the fatigue, the distraction, bad health situation, etc. Developing models to detect such critical behaviour and alert the driver can prevent many accidents and increase the safety on the road.
The rest of the paper is organized as follows: A review of the methods and datasets used for driver monitoring is presented in Section 2. Section 3 contains detailed information about our proposed dataset and how to use it. Section 4 shows the experiments for data evaluation. Finally, the conclusion is presented in Section 5.
2. Related Work
In this section, we present a small overview of the methods and datasets used for driver monitoring. The authors of paper [14] introduced a diverse benchmark with 2000 video sequences and over 650,000 frames that contain normal, critical, and accidental situations together in each video sequence. The dataset is for the scenes outside the vehicle. The researchers are answering the following question: Can we predict a driving accident if we know the driver’s attention level?
The authors of paper [15] proposed a dataset called DrivFace that contains images sequences of subjects while driving in real scenarios. The dataset consists of 606 samples with resolution 640 × 480 pixels, acquired by 4 drivers (2 women and 2 men) with different facial features like glasses and beards. This dataset is annotated with head pose angles and the view direction. The authors also proposed a method to estimate the attention level from the head pose angles.
The authors of paper [16] introduced MPIIGaze dataset which contains 213,659 images collected from 15 participants during natural everyday computer use over more than three months with corresponding ground-truth gaze positions. The dataset has a large variability in appearance and illumination but it was not recorded in real driving scenarios. The main purpose for the dataset is to estimate the gaze angle from monocular camera in order to determine the attention level.
The authors of paper [17] introduced DriveAHead dataset, which contains more than 10 h of infrared (IR) and depth images of drivers’ head poses taken in real driving situations. The dataset provides frame-by-frame head pose labels obtained from a motion-capture system, as well as annotations about occlusions of the driver’s face. The dataset was collected from 20 persons (4 females and 16 males) using Kinect v2.
The authors of paper [18] introduced a dataset, collected from 14 young people (11 females, 3 males) who performed three successive experiments (the duration of each experiment was 10 min) in conditions of increasing sleep deprivation induced by acute, prolonged waking. The dataset contains different types of datas (images, signals, and etc.) and aims to help the resesrchers in the field of monitoring drowsiness, but it wasn’t recorded inside the car cabin.
The authors of paper [19] introduced a dataset that consists of videos of drivers performing actions related to different driving scenarios. The dataset was acquired from 35 participants (10 females, 25 males) in different lightning conditions according to the time the session was recorded (morning or afternoon) with different speeds and both in simulations and real scenarios. The dataset was recorded using 3 of Intel RealSense Depth Camera D400-Series in different locations to capture the face, the body, and the hands of the driver.
The authors of paper [20] published a DMD dataset, consisting of videos of the drivers performing distraction actions in an automated driving scenario. The dataset contains over 9.6 million frames of people recorded using 5 near-infrared cameras in different perspectives, and 3 channels from a side camera (RGB, depth, IR).
The authors of paper [21] proposed a dataset called Multimodal Spontaneous Expression Heart Rate (MMSE-HR) dataset which is composed of videos and associated information about the heart rate and the blood pressure. The dataset was collected by 140 participants (58 males and 82 females) of different ages and ethnics. The data were acquired from different face sensors (high-resolution, 3D dynamic imaging, high-resolution 2D video, and thermal sensing), and contact sensors (electrical skin conductivity, respiration, blood pressure, and heart rate).
In contrast to our DriverMVT dataset, most of the datasets found in the literature concentrate on a particular tasks like head pose, gaze angles, action classification, drowsiness. Our dataset provides detailed and diverse information that make it useful for a wider range of tasks related to the drivers. Our dataset provides frame by frame annotation of the driver health indices like the heart rate, the mental state like fatigue, and the head pose estimation, alongside with driver activities. In addition, our dataset was recorded in real environment while subjects were driving home or to work. The dataset is diverse in terms of lightning conditions and speed. Table 1 shows a comparison between the available datasets and our dataset.
3. Dataset
In this section, an overview of the dataset is presented. Section 3.1 addresses the methodology used for collecting the proposed dataset, while Section 3.2 provides the description of the dataset and finally in Section 3.3 an exploratory analysis of the datasets is presented.
3.1. Collection Methodology
In this section, we introduce the collection methodology. In Section 3.1.1, we describe the devices used for data collection, while in Section 3.1.2, we describe the acquiring process.
3.1.1. Collection Devices
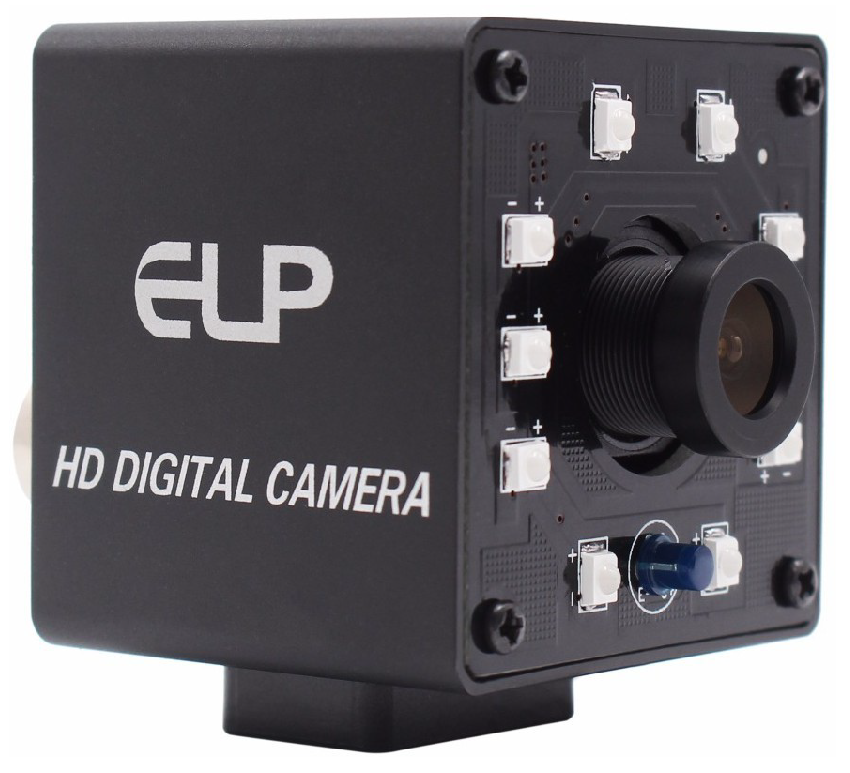
The dataset was collected using different camera types: a USB camera produced by ELP (see Figure 1), Samsung Galaxy S10 camera, and Samsung Galaxy S20 camera. The USB camera’s sensor is OV7725, a single-chip VGA camera with an image processor. The lens size is 1/4 inch with view angle 30–150 degree, the sensor incorporates a 640 × 480 image array operating at frame rate 30 fps. The USB camera also has a high speed USB 2.0 interface module. For the smartphones, videos were recorded with resolution 1080 × 1920 and frame rate 60 fps.
For the heart rate recording we used Xiaomi Mi Band 3. This is not a medical device but it provides possibilities to precisely estimate heart rate that can be used for tasks mentioned in the paper.
3.1.2. Data Collection
The dataset was acquired from 9 drivers of different ages and genders (2 females, and 7 males) with total number of frames equal 5119k and total time over 36 h using different conditions of car speed and light. We included drivers with different facial features (with/without beard, with/without mustache, long/short hair, etc.). Table 2 presents the demographic data of the participants.
The drivers are all from St. Petersburg, Russia. We chose the participants to be diverse and balanced regarding to different facial features and different ages.
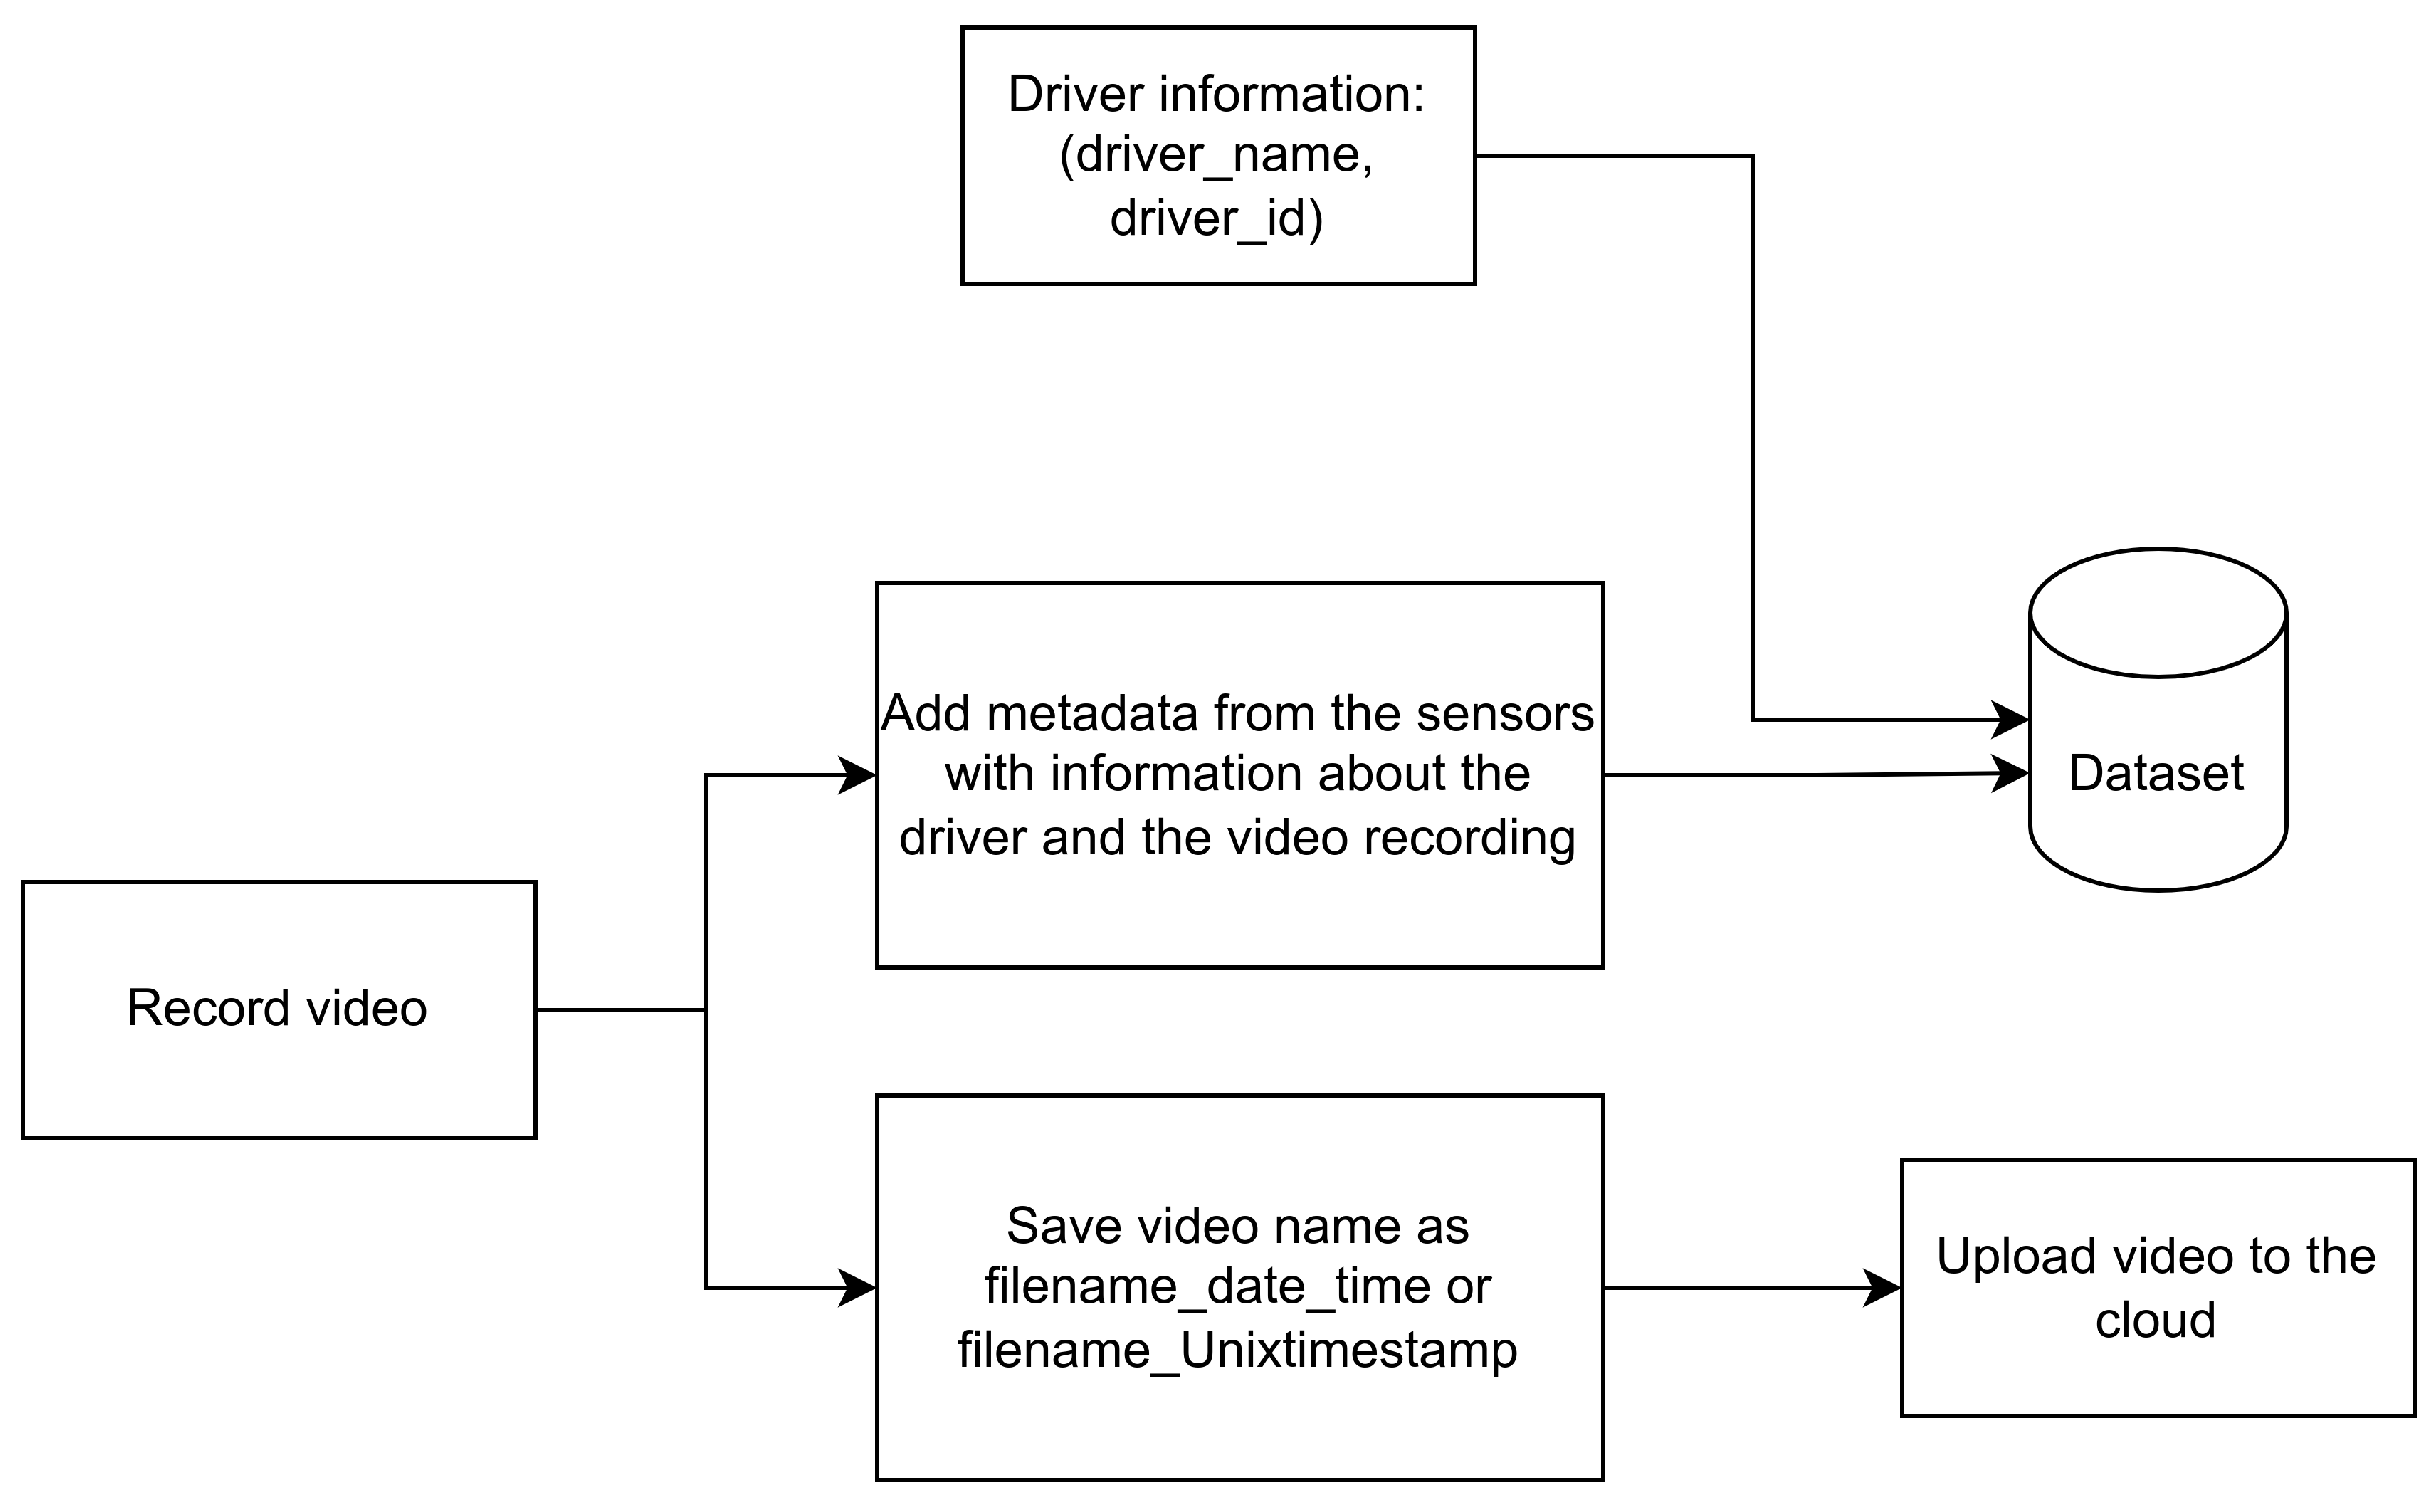
The videos were recorded and saved with the exact date and time, while the metadata was saved to the database with additional information like the user id, the measurement time and time when the ride started. These additional information is used later for synchronization as shown in Section 3.3.2. Figure 2 shows the scheme of acquiring the information.
3.2. Data Description
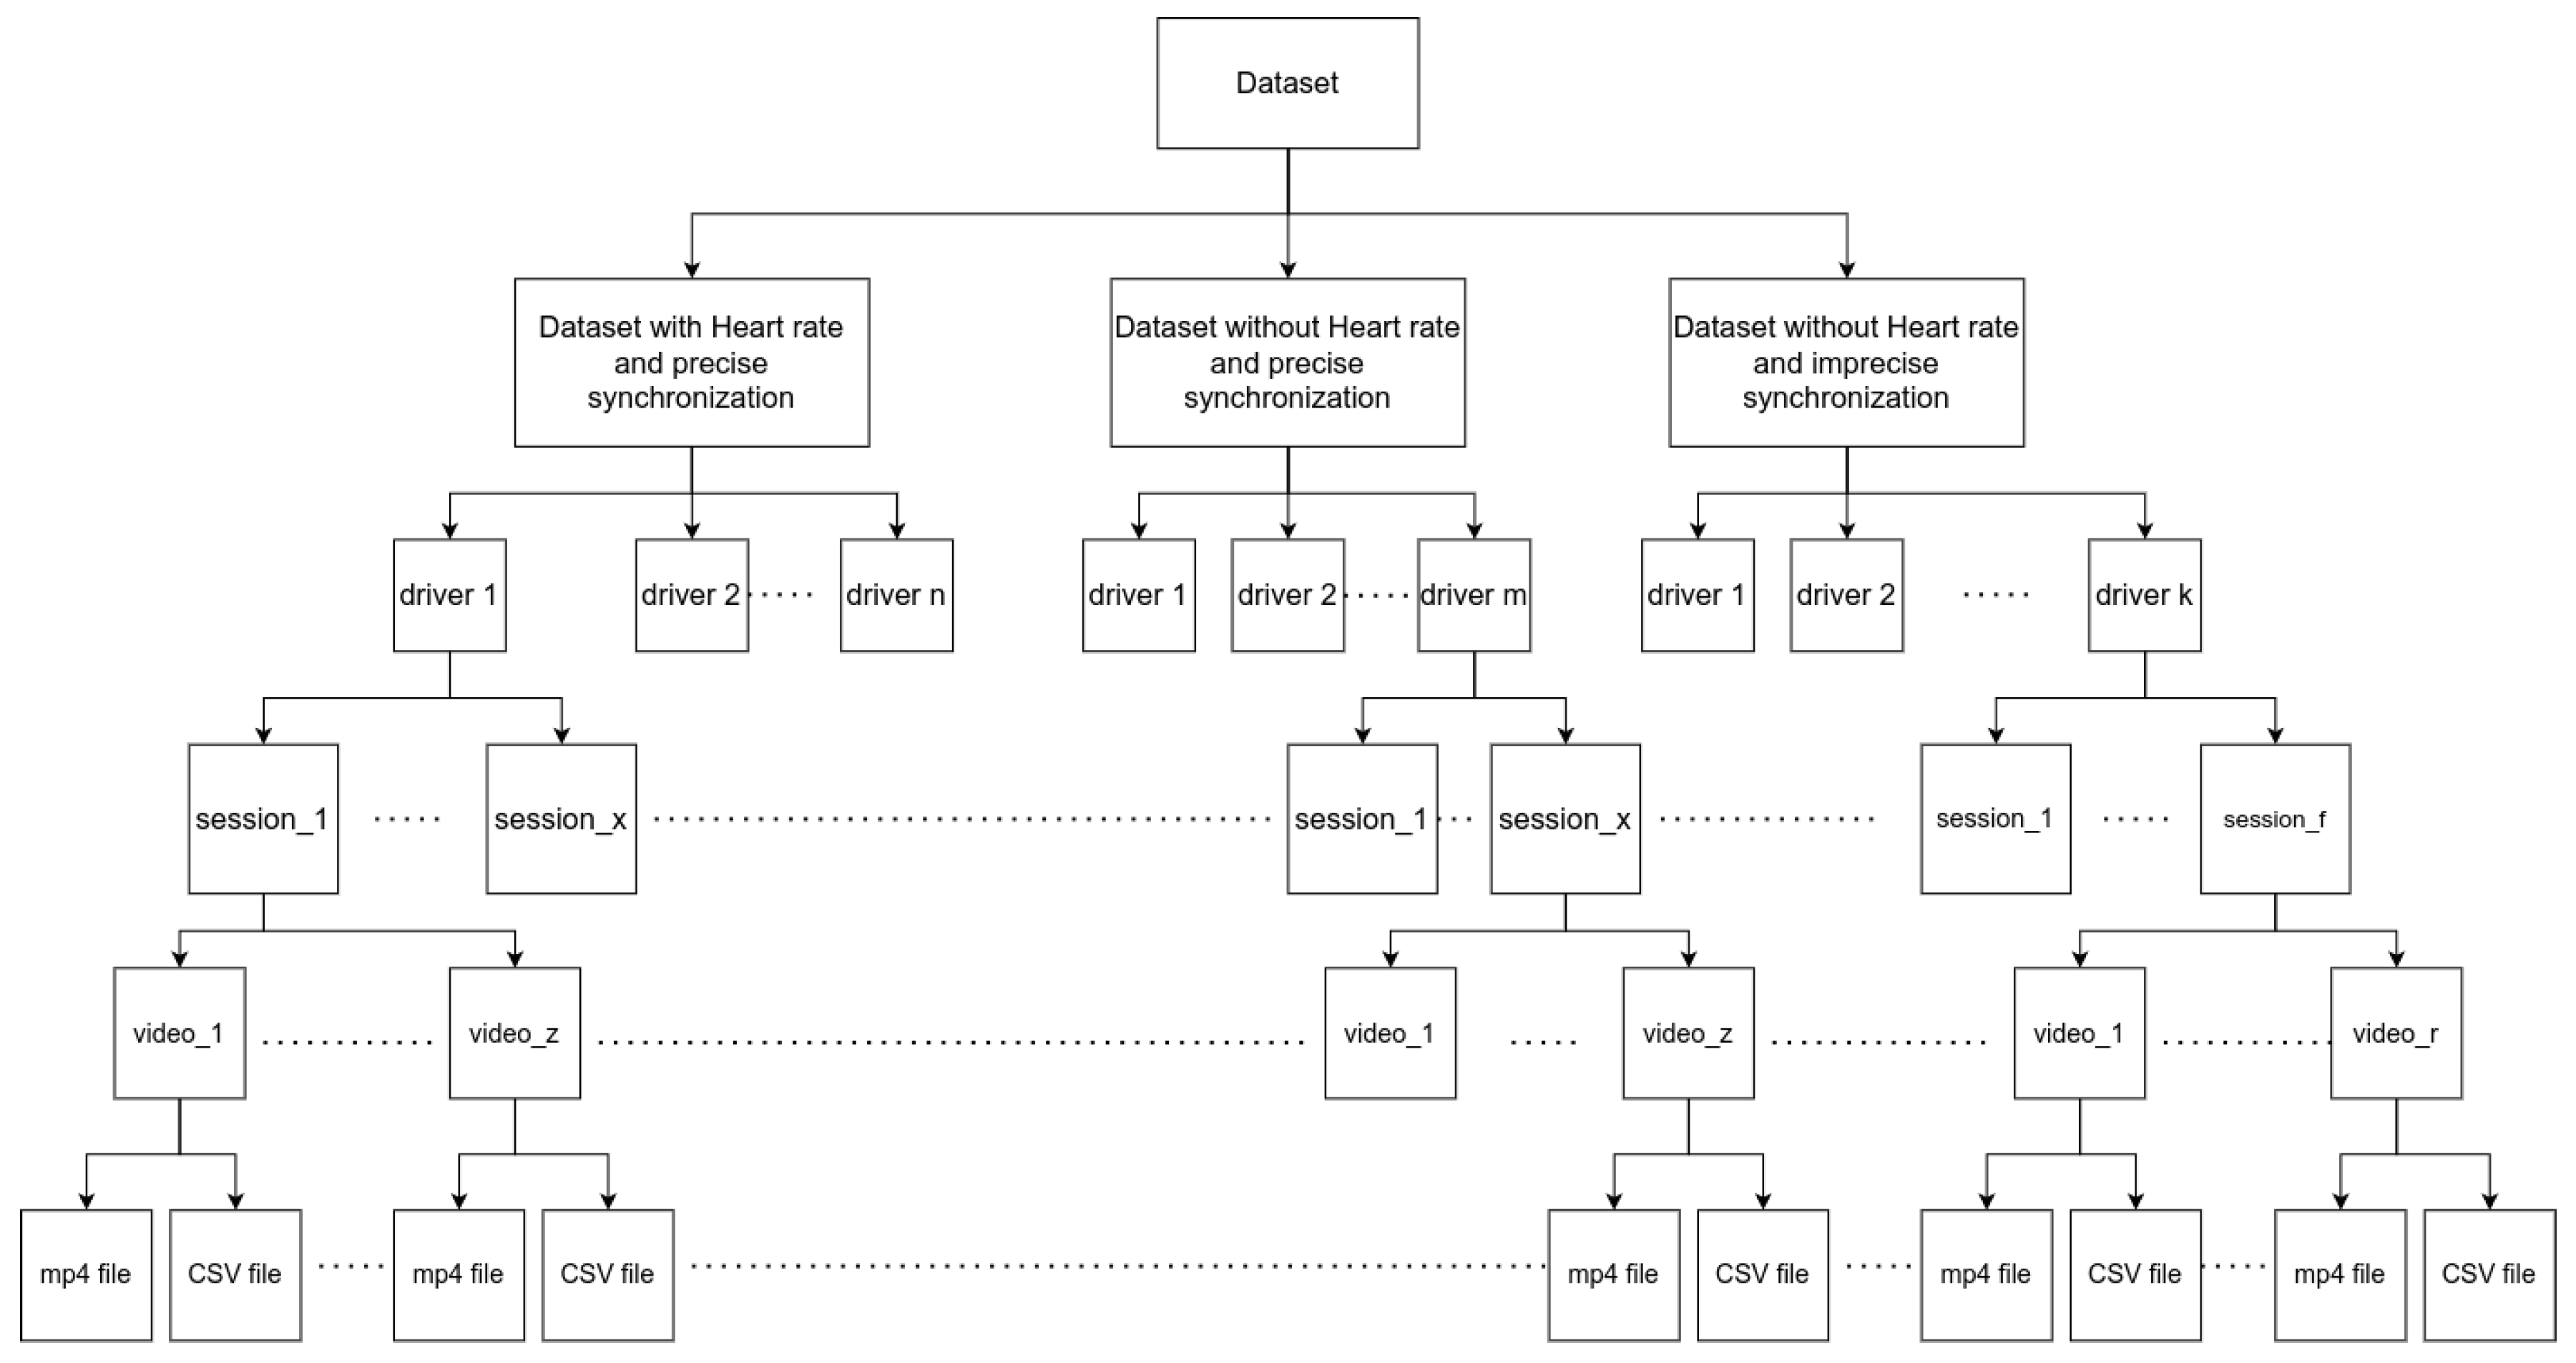
The dataset consists of 1506 videos of drivers inside the vehicle cabin and is divided into three sub-categories (see Figure 3):
- Imprecise synchronization: the category contains videos of mean length of 1 min and meta data for each video, the video is frame by frame annotated but the synchronization between the video and the metadata is not precise with maximum delay of 1 s.
- Precise synchronization and heart rate information: the category contains videos of mean length of 30 min and meta data for each video, the video is frame by frame annotated with perfect synchronization, The dataset also contains information about the driver’s heart rate.
- Precise synchronization and no heart rate information: the category contains videos of mean length of 30 min and frame by frame annotation for each video, the synchronization between the video and the information is precise.
For each video, meta data information are given in an CSV file. The file contains the general information about the video (see Table 3), like the geographic coordinates (latitude, longitude, and altitude), the driving trip starting time presented in milliseconds Unix timestamp, the date time (milliseconds Unix timestamp) which describes the time of recording the video, the car speed, the light level, and illuminance, the head pose angles (roll, pitch, and yaw) calculated using the method in paper [22], the data from the gyroscope (accelerometer data, gyroscope data, and magnetometer data), the mouth openness ratio, the seat belt state to detect whether the belt is fastened or not [23], and the heart rate measured using smart watch Xiaomi Mi Band 5.
3.3. Data Distribution
In this section, we present an exploratory analysis of the proposed dataset. Section 3.3.1 shows information about the meta data like the data type and the number of missing values in each columns columns. In addition, a visualization on the distribution of data like heart rate, and speed is presented. In Section 3.3.2 the synchronization method between the videos and the meta data is explained.
3.3.1. Data Exploration
In this section we provide a basic understanding of the dataset by showing the statistics and the distribution of the data.
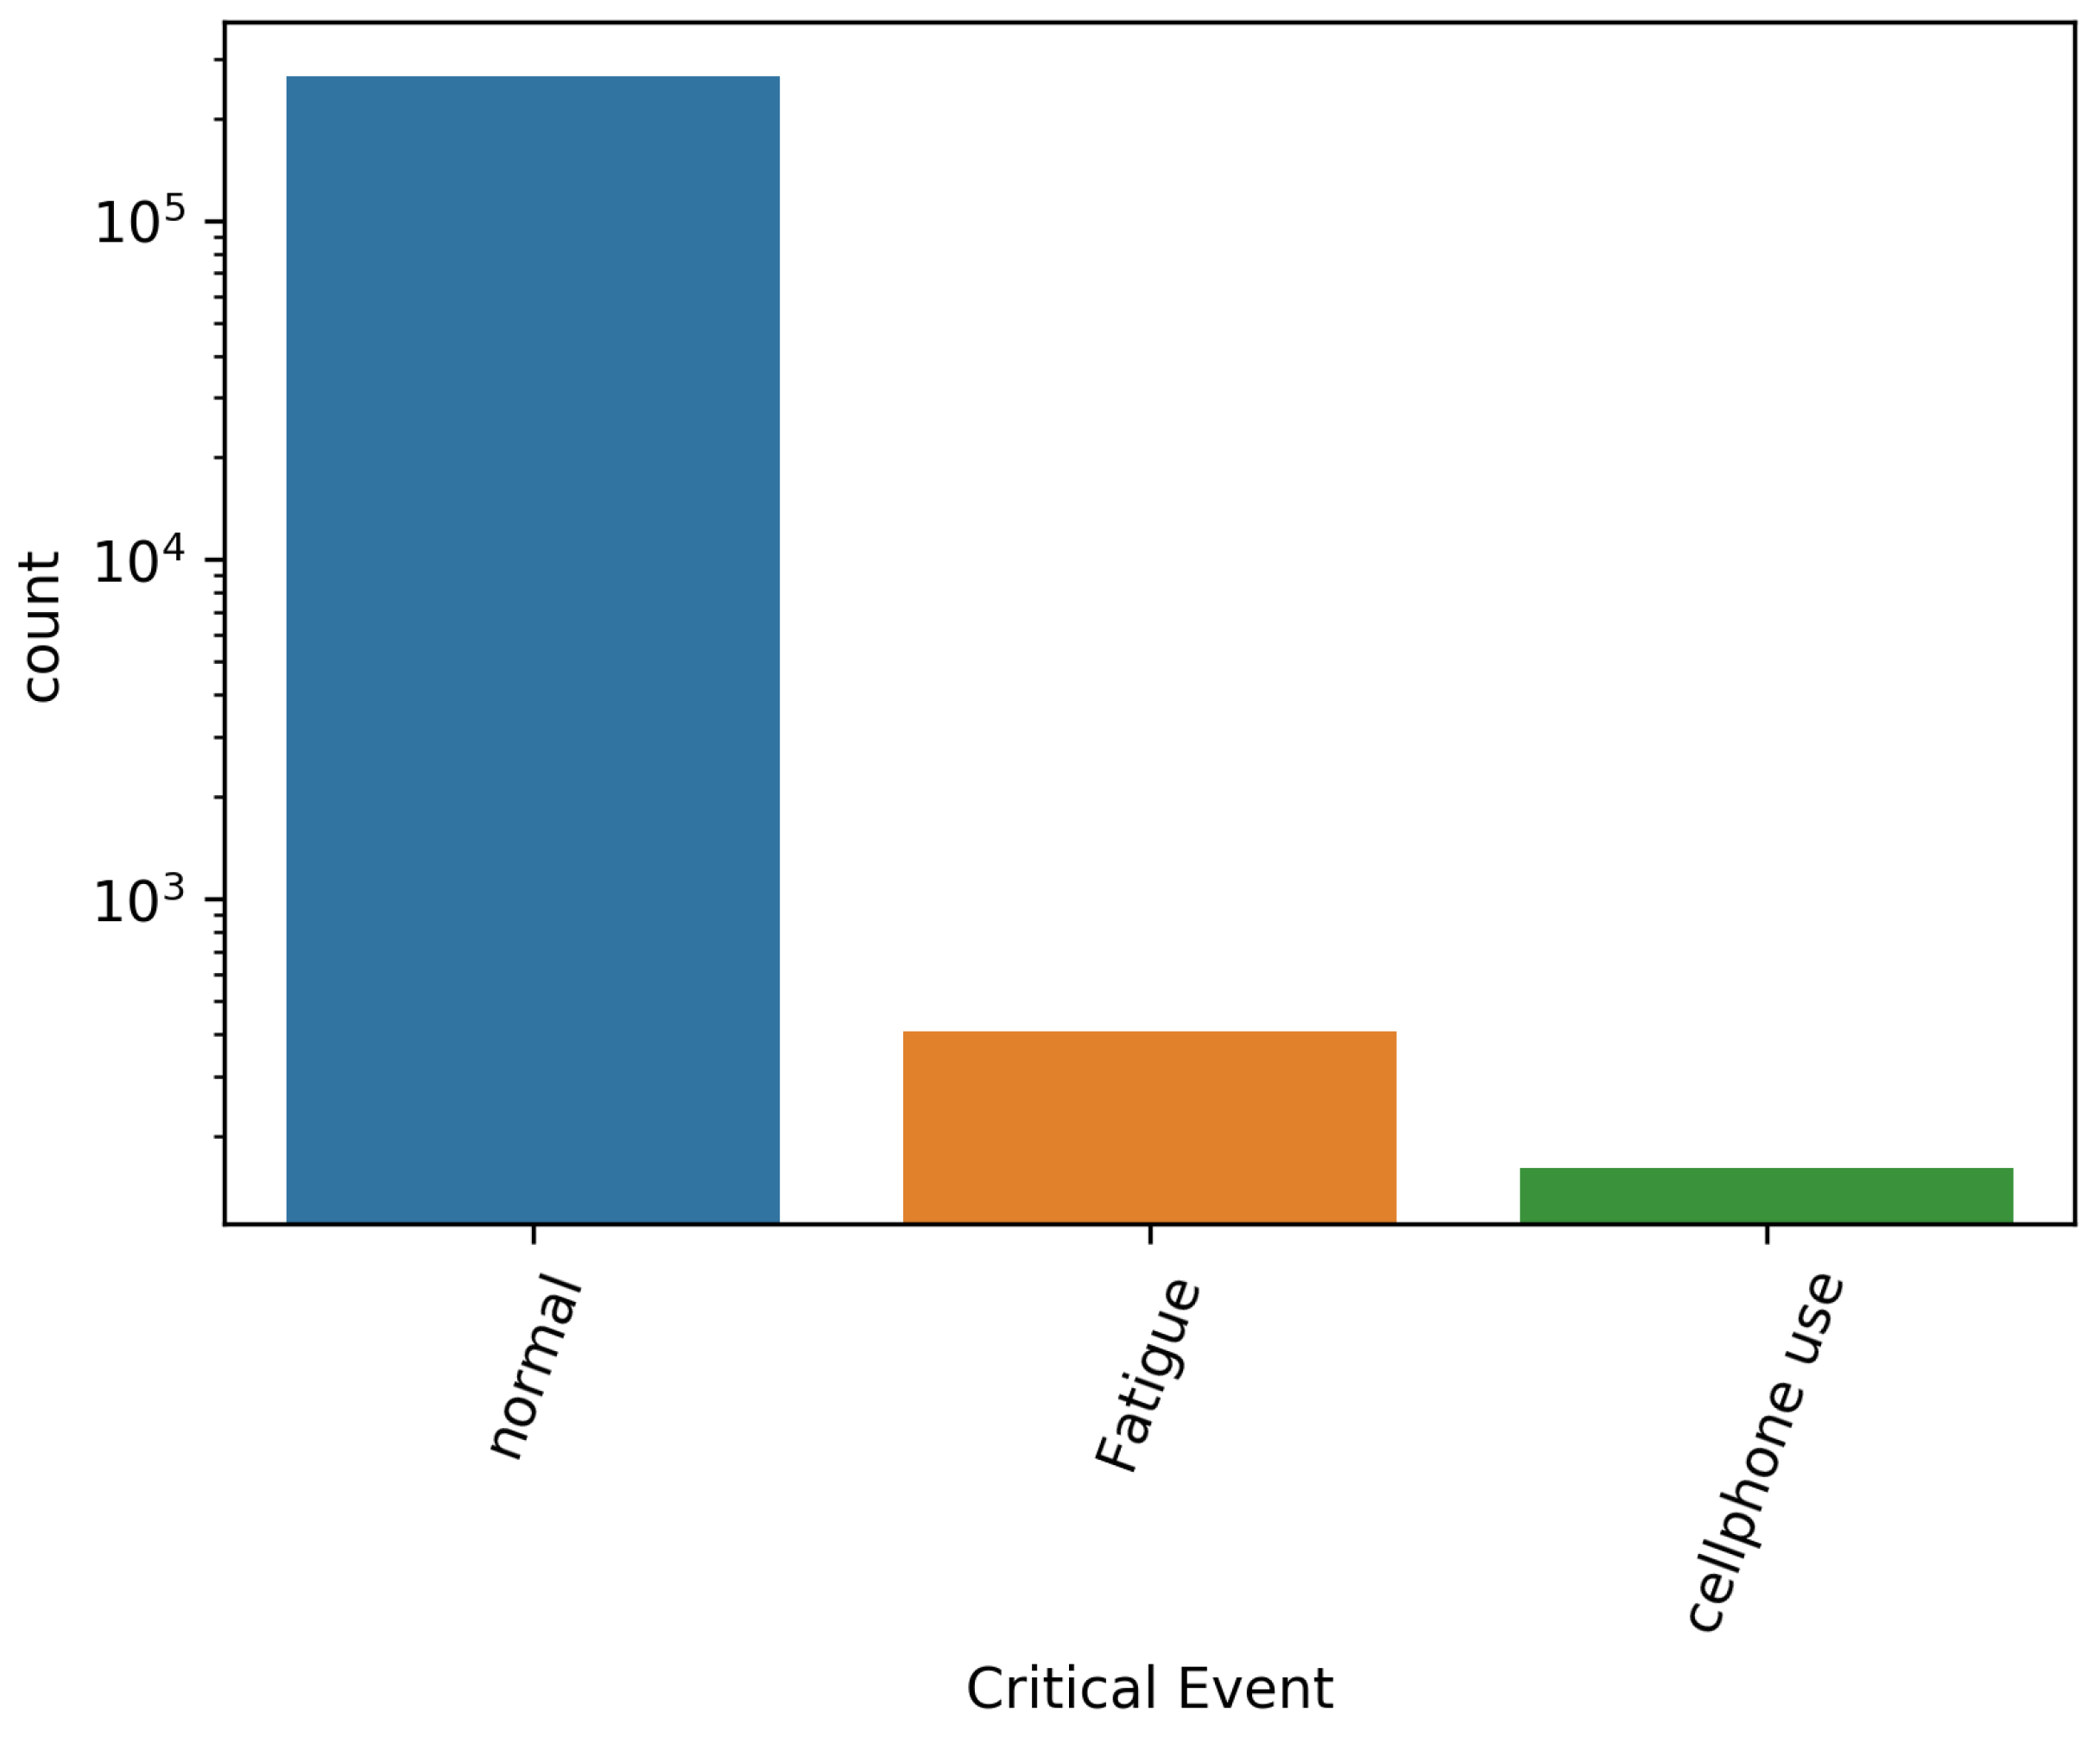
Table 4 shows information about the metadata of the driver video and HR information. The table shows that there is some missing information in the face_mouth, head_pose, and heart_rate columns. Face_mouth column is calculated based on the Faceboxes framework. Head_pose column is calculated based on the proposed image processing approach discussed in paper [22]. Some frames do not have suitable exposure and in some cases the driver head can not be determined. In this case some values from this columns can be missing. Heart_rate column contains the data from Xiaomi Mi Band 3. Since not all the driver used the device one also can see that some values are missing. For dangerous state the column has values when there is some critical events like fatigue otherwise the state is considered to be normal.
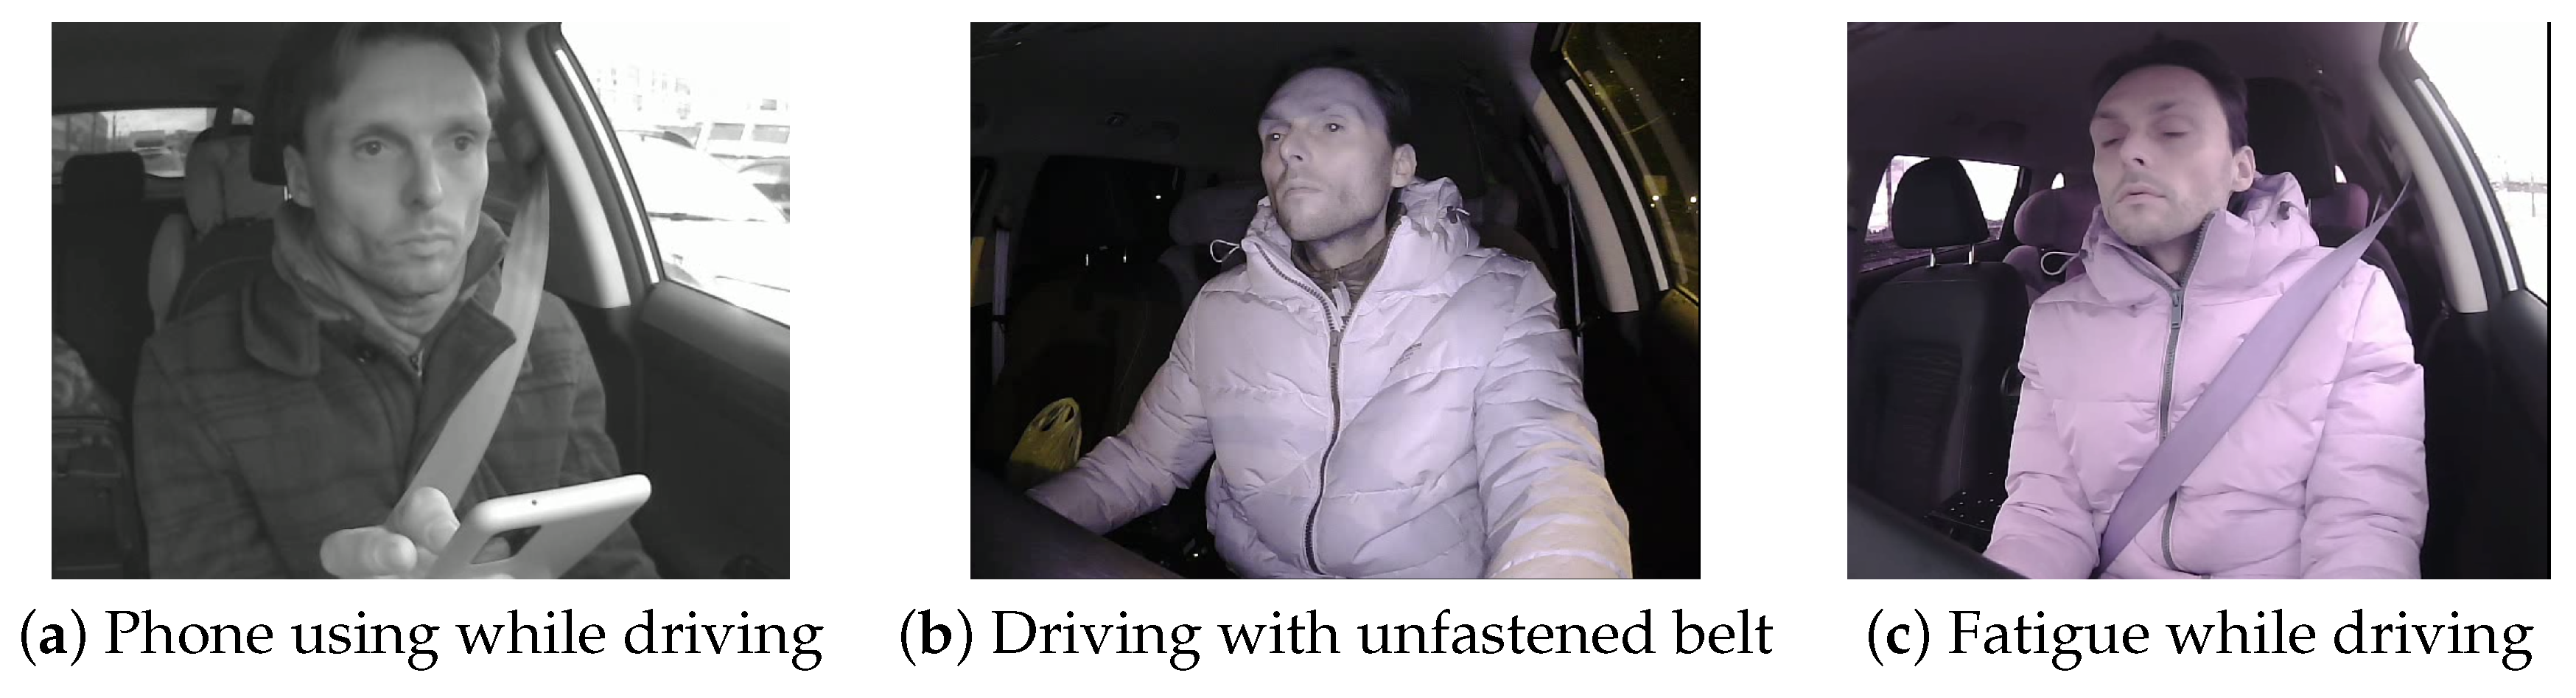
Figure 4 shows examples of different critical events from the dataset.
Figure 5 shows the the distribution of the data according to speed. Around 29% of our datasets was recorded when the car was not moving (like the case when the driver stopped on the traffic light).
Figure 6 shows the distribution of the critical events in the dataset in log scale.
Figure 7 shows the distribution of the heart rate in the dataset. The dataset contains samples in the range [75, 95], which is the normal resting heart rate for adult people.
3.3.2. Data Synchronization
As we mentioned earlier, the names of the video files represent the recording starting time of the video either in the exact Unix time stamp in milliseconds or using the date and time in seconds. The meta data were saved using the Unix time stamp on the database. To synchronize the metadata with the exact video frame, we used Equation (1):
where frame represent the frame number that is described by the metadata, represent the Unix time stamp in ms of the metadata, represent the Unix time stamp in ms of the recording video, and represent the video frame rate. This way, the videos saved by the Unix timestamp will be perfectly synchronized, while the videos that were saved by the date and time will be shifted. The maximum difference is 1 s or 10–60 frames. For efficient usage of the data, we performed the synchronization for the whole dataset. Each video is frame by frame annotated, the metadata is saved in a CSV file that contains the frame number alongside with the additional information.
4. Data Evaluation
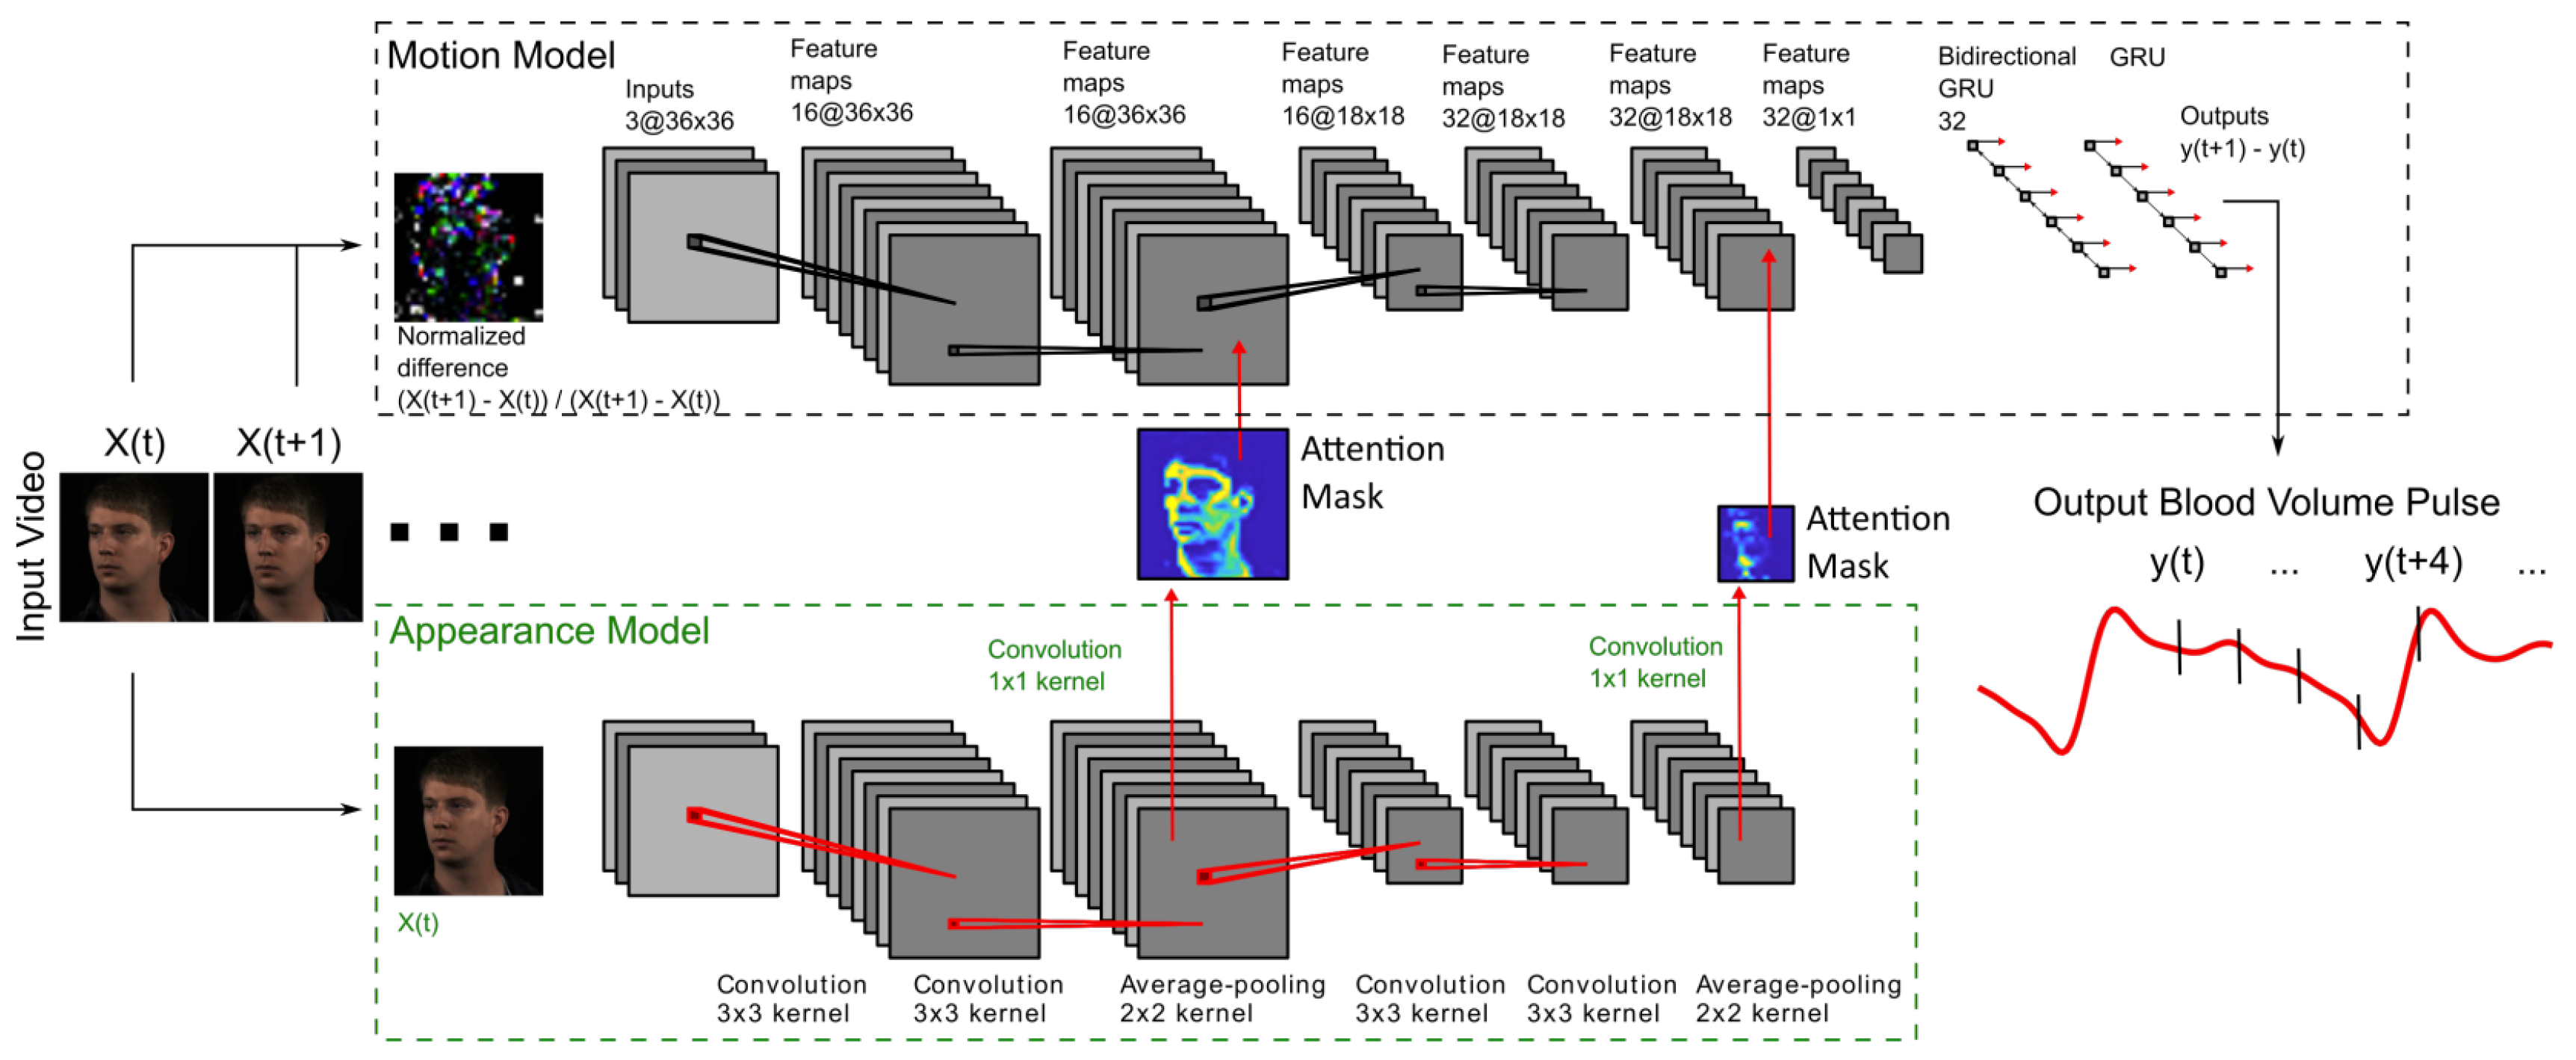
To validate our dataset, we carried out expirements with multi-task temporal shift convolutional attention network (MTTS-CAN) [24], one of the state-of-the-art algorithms in heart rate estimation. The architecture is presented in Figure 8.
We tested the algorithm on subset of our dataset that contains heart rate information. This dataset consists of 12 videos. The MTTS-CAN showed a mean average error of 16.375 heartbeats per minutes and Root mean square error equal to 19.495, which considered a high error.
In addition, we carried a separate experiment to evaluate the respiratory rate. We used our algorithm proposed by paper [25] to detect the respiratory rate when the car speed is zero or around the zero. We made experiments of the proposed method on the presented dataset and conclude that we can measure respiratory rate then the the vehicle speed is less than 3 Km/h. The algorithm can be summarized in the following steps:
- Estimate the position of the chest keypoint using Openpose human pose estimation model.
- Calculate the keypoint displacement using an optical flow-based neural network (SelFlow).
- clean the displacement signal using filtering and detrending. Then count the number of peaks/troughs in a time window of one minute.
Figure 9 shows the algorithm scheme.
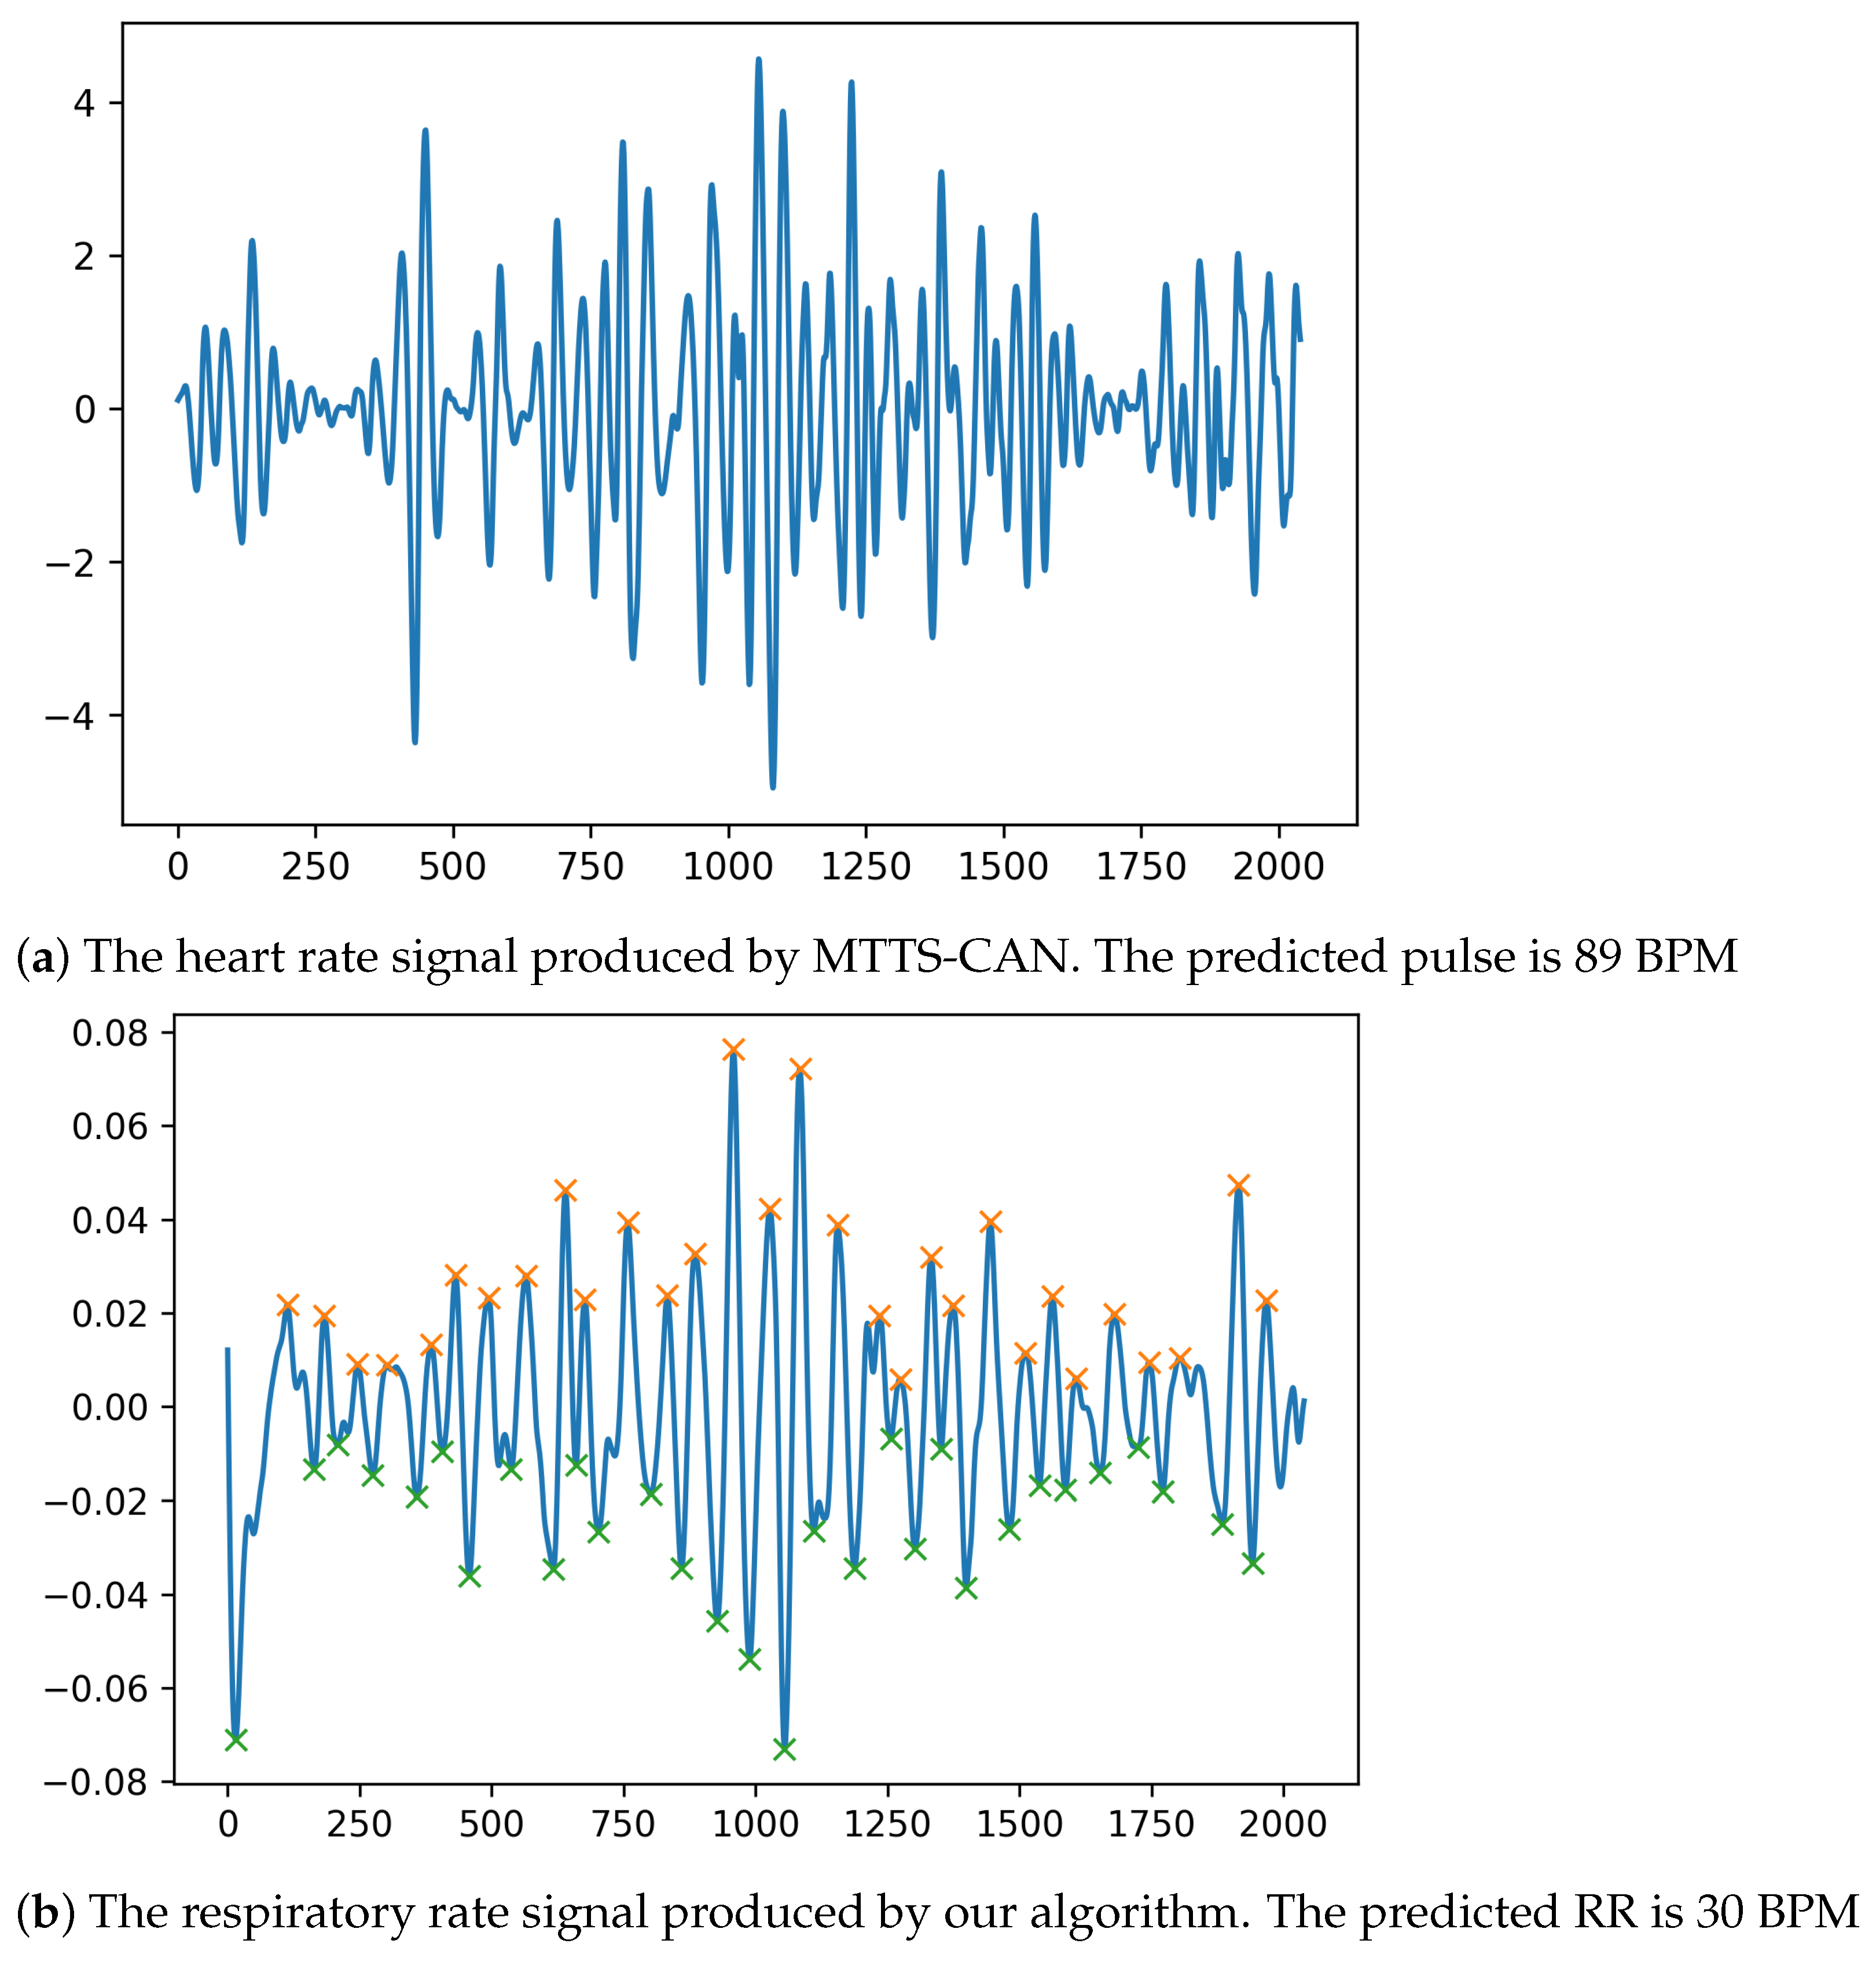
Figure 10 shows the produced heart rate signal produced by MMTS-CAN and respiratory rate signal.
In our experiment, we divide the videos into three classes depending on the heart rate, then we used our algorithm to calculate the respiratory rate of the driver.
Table 5 shows the mean respiratory rate for each class.
As we can see from the table, there is a direct relationship between the heart rate and the respiratory rate. With increasing the heart rate, the respiratory rate increases as well.
5. Conclusions
In this paper, we introduced a new extensive, diverse dataset called DriverMVT designed to allow researchers to develop a contactless real-time monitoring system. The dataset contains 1506 videos collected using monocular camera from 9 subjects in real driving scenarios with total number of frames equal 5119k and total time over 36 h. For each video, the dataset contains the following time-synchronized information: geographic coordinates, speed, acceleration, light conditions, magnetic orientation, angular velocity, Driver head pose, driver mouth openness ratio, driver heart rate and driver actions. The dataset can be used to train and evaluate models for detecting Drowsiness/Fatigue, Distraction based on the head pose information, and predicting the driver heart rate to detect the driver health state. These models can reduce the accidents and increase the safety on the road. In addition we evaluated the dataset with MTTS-CAN algorithm. The algorithm mean average error on our dataset is 16.375 heartbeats per minute. We hope that other researchers will use our dataset in other innovative ways. Of course the main goal is that the research and models based on the DriverMVT dataset will one day help save lives on the roads.
Author Contributions
W.O. is responsible for dataset preparation, formal analysis, and paper writing. A.K. is responsible for conceptualization, paper writing, and funding acquisition. A.A. is responsible for modules development. N.S. is responsible for paper writing and conceptualisation. All authors have read and agreed to the published version of the manuscript.
Funding
This work was supported by the Russian Science Foundation (project 18-71-10065). Described in the paper related research (Section 2) has been supported by the Russian State Research # FFZF-2022-0005.
Institutional Review Board Statement
The study was conducted according to the guidelines of the Declaration of Helsinki considered and approved by Reviewers’ Board (Scientific Council) of St. Petersburg Federal Research Center of the Russian Academy of Sciences (SPC RAS) (as codified in Protocol of 24 March 2022, No. 3).
Informed Consent Statement
Informed consent was obtained from all subjects involved in the study.
Data Availability Statement
Our dataset is available on the following web page: https://1drv.ms/u/s!Ar_DU2ygGWIUhPAz7dO4BUHEwshxKA?e=o9bsm4 (accessed on 5 April 2022).
Conflicts of Interest
The authors declare no conflict of interest.
References
- World Health Organization. The Top 10 Causes of Death. Available online: https://www.who.int/news-room/fact-sheets/detail/the-top-10-causes-of-death (accessed on 6 April 2022).
- Jun, J.; Ogle, J.; Guensler, R. Relationships between Crash Involvement and Temporal-Spatial Driving Behavior Activity Patterns: Use of Data for Vehicles with Global Positioning Systems. Transp. Res. Rec. 2007, 2019, 246–255. [Google Scholar] [CrossRef]
- Şimşek, B.; Pakdil, F.; Dengiz, B.; Testik, M.C. Driver performance appraisal using GPS terminal measurements: A conceptual framework. Transp. Res. Part Emerg. Technol. 2013, 26, 49–60. [Google Scholar] [CrossRef]
- Castignani, G.; Derrmann, T.; Frank, R.; Engel, T. Driver Behavior Profiling Using Smartphones: A Low-Cost Platform for Driver Monitoring. IEEE Intell. Transp. Syst. Mag. 2015, 7, 91–102. [Google Scholar] [CrossRef]
- Hong, Z.; Chen, Y.; Wu, Y. A driver behavior assessment and recommendation system for connected vehicles to produce safer driving environments through a “follow the leader” approach. Accid. Anal. Prev. 2020, 139, 105460. [Google Scholar] [CrossRef]
- Bao, Q.; Tang, H.; Shen, Y. Driving Behavior Based Relative Risk Evaluation Using a Nonparametric Optimization Method. Int. J. Environ. Res. Public Health 2021, 18, 12452. [Google Scholar] [CrossRef]
- Moslem, S.; Farooq, D.; Ghorbanzadeh, O.; Blaschke, T. Application of the AHP-BWM Model for Evaluating Driver Behavior Factors Related to Road Safety: A Case Study for Budapest. Symmetry 2020, 12, 243. [Google Scholar] [CrossRef] [Green Version]
- Moslem, S.; Gul, M.; Farooq, D.; Celik, E.; Ghorbanzadeh, O.; Blaschke, T. An Integrated Approach of Best-Worst Method (BWM) and Triangular Fuzzy Sets for Evaluating Driver Behavior Factors Related to Road Safety. Mathematics 2020, 8, 414. [Google Scholar] [CrossRef] [Green Version]
- Farooq, D.; Moslem, S. Estimating Driver Behavior Measures Related to Traffic Safety by Investigating 2-Dimensional Uncertain Linguistic Data—A Pythagorean Fuzzy Analytic Hierarchy Process Approach. Sustainability 2022, 14, 1881. [Google Scholar] [CrossRef]
- Li, G.; Chung, W.Y. Detection of Driver Drowsiness Using Wavelet Analysis of Heart Rate Variability and a Support Vector Machine Classifier. Sensors 2013, 13, 16494–16511. [Google Scholar] [CrossRef] [Green Version]
- Rundo, F.; Spampinato, C.; Conoci, S. Ad-Hoc Shallow Neural Network to Learn Hyper Filtered PhotoPlethysmoGraphic (PPG) Signal for Efficient Car-Driver Drowsiness Monitoring. Electronics 2019, 8, 890. [Google Scholar] [CrossRef] [Green Version]
- Wang, Y.; Huang, R.; Guo, L. Eye gaze pattern analysis for fatigue detection based on GP-BCNN with ESM. Pattern Recognit. Lett. 2019, 123, 61–74. [Google Scholar] [CrossRef]
- Reddy, B.; Kim, Y.H.; Yun, S.; Seo, C.; Jang, J. Real-Time Driver Drowsiness Detection for Embedded System Using Model Compression of Deep Neural Networks. In Proceedings of the 2017 IEEE Conference on Computer Vision and Pattern Recognition Workshops (CVPRW), Honolulu, HI, USA, 21–26 July 2017; pp. 438–445. [Google Scholar] [CrossRef]
- Fang, J.; Yan, D.; Qiao, J.; Xue, J. DADA: A Large-scale Benchmark and Model for Driver Attention Prediction in Accidental Scenarios. arXiv 2019, arXiv:1912.12148. [Google Scholar]
- Diaz-Chito, K.; Hernández-Sabaté, A.; López, A.M. A reduced feature set for driver head pose estimation. Appl. Soft Comput. 2016, 45, 98–107. [Google Scholar] [CrossRef]
- Zhang, X.; Sugano, Y.; Fritz, M.; Bulling, A. MPIIGaze: Real-World Dataset and Deep Appearance-Based Gaze Estimation. arXiv 2017, arXiv:1711.09017. [Google Scholar] [CrossRef] [PubMed] [Green Version]
- Schwarz, A.; Haurilet, M.; Martinez, M.; Stiefelhagen, R. DriveAHead—A Large-Scale Driver Head Pose Dataset. In Proceedings of the 2017 IEEE Conference on Computer Vision and Pattern Recognition Workshops (CVPRW), Honolulu, HI, USA, 21–26 July 2017; pp. 1165–1174. [Google Scholar] [CrossRef]
- Massoz, Q.; Langohr, T.; François, C.; Verly, J.G. The ULg multimodality drowsiness database (called DROZY) and examples of use. In Proceedings of the 2016 IEEE Winter Conference on Applications of Computer Vision (WACV), Lake Placid, NY, USA, 7–10 March 2016; pp. 1–7. [Google Scholar] [CrossRef] [Green Version]
- Ortega, J.D.; Kose, N.; Cañas, P.; Chao, M.A.; Unnervik, A.; Nieto, M.; Otaegui, O.; Salgado, L. DMD: A Large-Scale Multi-Modal Driver Monitoring Dataset for Attention and Alertness Analysis. In Proceedings of the European Conference on Computer Vision (ECCV) Workshops (Accepted), Glasgow, UK, 23–28 August 2020. [Google Scholar]
- Martin, M.; Roitberg, A.; Haurilet, M.; Horne, M.; Reiß, S.; Voit, M.; Stiefelhagen, R. Drive&Act: A Multi-Modal Dataset for Fine-Grained Driver Behavior Recognition in Autonomous Vehicles. In Proceedings of the 2019 IEEE/CVF International Conference on Computer Vision (ICCV), Seoul, Korea, 27 October–2 November 2019; pp. 2801–2810. [Google Scholar] [CrossRef]
- Zhang, Z.; Girard, J.M.; Wu, Y.; Zhang, X.; Liu, P.; Ciftci, U.; Canavan, S.; Reale, M.; Horowitz, A.; Yang, H.; et al. Multimodal Spontaneous Emotion Corpus for Human Behavior Analysis. In Proceedings of the 2016 IEEE Conference on Computer Vision and Pattern Recognition (CVPR), Las Vegas, NV, USA, 27–30 June 2016; pp. 3438–3446. [Google Scholar] [CrossRef]
- Kashevnik, A.; Ali, A.; Lashkov, I.; Zubok, D. Human Head Angle Detection Based on Image Analysis. In Proceedings of the Future Technologies Conference (FTC) 2020; Springer International Publishing: Cham, Switzerland, 2021; Volume 1, pp. 233–242. [Google Scholar]
- Kashevnik, A.; Ali, A.; Lashkov, I.; Shilov, N. Seat Belt Fastness Detection Based on Image Analysis from Vehicle In-abin Camera. In Proceedings of the 2020 26th Conference of Open Innovations Association (FRUCT), Yaroslavl, Russia, 20–24 April 2020; pp. 143–150. [Google Scholar] [CrossRef]
- Liu, X.; Fromm, J.; Patel, S.; McDuff, D. Multi-Task Temporal Shift Attention Networks for On-Device Contactless Vitals Measurement. In Proceedings of the 34th International Conference on Neural Information Processing Systems, Vancouver, BC, Canada, 6–12 December 2020; pp. 19400–19411. [Google Scholar]
- Othman, W.; Kashevnik, A.; Ryabchikov, I.; Shilov, N. Contactless Camera-Based Approach for Driver Respiratory Rate Estimation in Vehicle Cabin. In Proceedings of the Intelligent Systems Conference (IntelliSys) 2022, Amsterdam, The Netherlands, 1–2 September 2022. [Google Scholar]
Figure 1.
USB camera used for collecting the dataset.

Figure 2.
The scheme of Data collection.

Figure 3.
The hierarchy of the dataset.

Figure 4.
Examples of critical events from the dataset.

Figure 5.
Video Statics according to speed.

Figure 6.
Distribution of the critical events.

Figure 7.
Distribution of the heart rate.

Figure 8.
MTTS-CAN architecture [24].
Figure 8.
MTTS-CAN architecture [24].

Figure 9.
Respiratory rate algorithm scheme [25].
Figure 9.
Respiratory rate algorithm scheme [25].

Figure 10.
The predicted heart rate and respiratory rate signal for a video of a driver inside the car with vehicle speed is zero and heart rate 112.
Figure 10.
The predicted heart rate and respiratory rate signal for a video of a driver inside the car with vehicle speed is zero and heart rate 112.


Table 1.
Comparison between Driver monitoring public datasets.
| Dataset | Size | Drivers | Usage | Environment |
|---|---|---|---|---|
| DrivFace [15] | 606 images | 4 | Head pose | Car |
| MPIIGaze [16] | ∼214K images | 15 | Gaze position | Simulator |
| DriveAHead [17] | 10 h | 20 | Head pose | Car |
| Dataset [18] | 500k frames | 14 | Drowsiness | Simulator |
| DMD [19] | 41 h | 35 | Head pose/drowsiness/hands/action/classification | Car/simulator |
| MMSE-HR [21] | 10TB | 140 | Vital signs | Laboratory |
| DriverMVT (ours) | 1506 videos | 9 | Head pose/distraction/fatigue/action classification/heart rate | Car |
Table 2.
Demographic data of the participants.
| Demographic Data | Number of Participants | Percentage |
|---|---|---|
| Gender | ||
| male | 7 | 77.78 |
| female | 2 | 22.22 |
| Ages | ||
| <25 | 2 | 22.22 |
| 25–34 | 3 | 33.33 |
| 35–45 | 3 | 33.33 |
| >45 | 1 | 11.11 |
| Special Features | ||
| with glasses | 5 | 55.56 |
| with beard | 4 | 44.44 |
| with mustache | 3 | 33.33 |
Table 3.
Metadata information describing the recorded drivers’ videos.
| Column Name | Description | Notation/Unit | Possible Values |
|---|---|---|---|
| filename | the video name | - | - |
| framenumber | the video frame number to be descibed | - | - |
| latitude | north-south position | decimal degree | [0, 60.120796] |
| longitude | east-west position | decimal degree | [0, 37.6103415] |
| altitude | the distance above sea level | meter | [−565.5, 251.3] |
| datetime | the time the video recorded | Unix Time stamp (ms) | - |
| datetimestart | the driving trip starting time | Unix Time stamp (ms) | - |
| speed | the vehicle speed | km/h | [0, 161.208] |
| lightlevel | the light level | lux | [0, 7760] |
| illuminance | the illuminiace | - | Bright/Dark |
| head_pose | the Euler angles (pitch, yaw, roll) | degrees | - |
| accelerometer_data | changes in velocity | m/s2 | - |
| gyroscope_data | angular velocity | °/s | - |
| magnetometer_data | the magnetic field intensity | tesla | - |
| face_mouth | mouth openness ratio | - | [0, 1] |
| heart_rate | driver’s heart rate | heartbeats per minute | [51, 114] |
| dangerousstate | the critical event | - | {cellphone_use, distraction_no_attention, camera_sabotage, belt_not_fasten, drowsiness, eating, distraction_no_face} |
Table 4.
Number of missing values in the dataset.
| Column | Data Type | Number of Missing Values |
|---|---|---|
| filename | object | 0 |
| framenumber | int64 | 0 |
| latitude | float64 | 0 |
| longitude | float64 | 0 |
| altitude | float64 | 0 |
| datetime | int64 | 0 |
| datetimestart | int64 | 0 |
| speed | float64 | 0 |
| acceleration | float64 | 0 |
| lightlevel | int64 | 0 |
| illuminance | object | 0 |
| head_pose | object | 59,320 |
| accelerometer_data | object | 0 |
| gyroscope_data | object | 0 |
| magnetometer_data | object | 0 |
| face_mouth | object | 199,089 |
| heart_rate | float64 | 466,228 |
| dangerousstate | object | 0 |
Table 5.
Respiratory rate calculation for each category.
| Heart Rate Class (Heartbeats per Minute) | Respiratory Rate Mean Value (Breaths per Minute) |
|---|---|
| 51–71 | 14.5 |
| 71–91 | 19 |
| 92–114 | 27 |
Publisher’s Note: MDPI stays neutral with regard to jurisdictional claims in published maps and institutional affiliations. |
© 2022 by the authors. Licensee MDPI, Basel, Switzerland. This article is an open access article distributed under the terms and conditions of the Creative Commons Attribution (CC BY) license (https://creativecommons.org/licenses/by/4.0/).
Share and Cite
MDPI and ACS Style
Othman, W.; Kashevnik, A.; Ali, A.; Shilov, N. DriverMVT: In-Cabin Dataset for Driver Monitoring including Video and Vehicle Telemetry Information. Data 2022, 7, 62. https://0-doi-org.brum.beds.ac.uk/10.3390/data7050062
AMA Style
Othman W, Kashevnik A, Ali A, Shilov N. DriverMVT: In-Cabin Dataset for Driver Monitoring including Video and Vehicle Telemetry Information. Data. 2022; 7(5):62. https://0-doi-org.brum.beds.ac.uk/10.3390/data7050062
Chicago/Turabian StyleOthman, Walaa, Alexey Kashevnik, Ammar Ali, and Nikolay Shilov. 2022. "DriverMVT: In-Cabin Dataset for Driver Monitoring including Video and Vehicle Telemetry Information" Data 7, no. 5: 62. https://0-doi-org.brum.beds.ac.uk/10.3390/data7050062