Article

Development of a Model Using Data Mining Technique to Test, Predict and Obtain Knowledge from the Academics Results of Information Technology Students

by
Wisam Ibrahim
1,
Sanjar Abdullaev
1,
Hussein Alkattan
1,*,
Oluwaseun A. Adelaja
2,* and
Alhumaima Ali Subhi
1,3
1
Department of System Programming, South Ural State University, Chelyabinsk 454080, Russia
2
Information Communication and Technology Department, Lagos State University, Lagos 102101, Nigeria
3
Electronic and Computer Center, University of Diyala, Baqubah 32010, Iraq
*
Authors to whom correspondence should be addressed.
Submission received: 9 May 2022 / Revised: 22 May 2022 / Accepted: 22 May 2022 / Published: 23 May 2022

Abstract

:
Due to the huge amount of data obtained from students’ academic results in most tertiary institutions such as the colleges, polytechnics and universities, data mining has become one of the most effective tools for discovering vital knowledge from students’ dataset. The discovered knowledge can be productive in understanding numerous challenges in the scope of education and providing possible solutions to these challenges. The main objective of this research is to utilize the J48 decision algorithm model to test, classify and predict the students’ dataset by identifying some important attributes and instances. The analysis was conducted on the final year students’ academic results in C# programming amongst five universities which was imported in csv excel file dataset in WEKA environment. These training datasets contained the scores obtained in the examinations, grade remarks, grades, gender, and department. The knowledge extracted for the prediction model will help both the tutors and students to determine the success grade performance in the future. Flow lines, J48 decision trees, confusion matrices and a program flowchart were generated from the students’ dataset. The KAPPA value obtained from the prediction in this research ranges from 0.9070–0.9582 which perfectly agrees with the standard for an ideal analysis on datasets.

1. Introduction

The students’ academic performance is an important aspect in most tertiary educational system, particularly the higher learning institutions. The excellent records achieved amongst students’ academic performances in examinations have become one of the key factors in considering tertiary institutions on the highly ranked Q.S world university rating system [1]. In the world today, a huge amount of students’ data increases daily which makes it very critical to perform analysis on data to discover and retrieve useful information likewise knowledge from this data. There are numerous techniques that have been proposed in the evaluation (which involves testing, prediction and knowledge discovery of dataset) of students’ academic performance. Data mining is one of the most common techniques utilized to analyze the academic performance of students and it has been recently applied in a vast approach regarding the educational sectors [2]. Data mining, also known as Knowledge discovery from data (KDD), can be defined a process of discovering interesting patterns and knowledge from stored data. Data Mining has various methods for used analyzing which include classification, clustering, and association rules [3]. Data mining could also be referred to as data dredging, which is a multidisciplinary field that obtains relevant information from large amount of data at the confluence among other specializations which includes artificial intelligence, statistics, databases, and information science [4]. In the educational sectors, one of the major objectives is to provide learning processes that allow for understanding students and their learning paths, termed as Educational Data Mining and Learning Analytics (EDM/LA). Educational Data Mining (EDM) is a discipline that focuses on extraction of useful information and knowledge from huge educational database, thereby utilizing this useful information and knowledge dredged to predict students’ academic performance [5]. Apart from extracting and analyzing educational data, Educational Data Mining can enhance and develop students’ performance in the teaching and learning domain [6]. There are several works in Educational Data Mining and Learning Analytics (EDM/LA) which has been devoted to prediction methods of student performance. According to [7], the authors compared different decision trees based on the students’ academic performance for prediction. The decision trees were able to reveal the total number of students with excellent grades and those with failed grades, as this prediction effectively improved both the teaching/learning process in the institution and mitigated the failure rate amongst the students.
WEKA is a Data Mining tool used for managing the experimental analysis for data mining process such as (predictions, classification, clustering, association rule and evaluation); it also provides a flexible support for machine learning research and serves as a tool for introducing people to machine learning in the educational environment [8]. This research work focuses on using the J48 decision tree Classification model in WEKA to analyze the students’ academic performance of Information Technology (I.T) department in five universities across five countries which includes Iraq, Sudan, Nigeria, South Africa, and India. The data was obtained from the records of the undergraduate students in the final year study of the five countries in the second semester of examinations. The authors in [9] revealed the taxonomy for Data mining approaches and this was illustrated pictorially, see Figure 1.
The research conducted in [10] revealed that the authors substantiated and built methodology for an ensemble classification of individual students’ performance and collective performance quantification. According to [11], educational data mining involves four development phases which are filtering process of the students’ data: selection of attributes or variables relating to their performance; extraction of knowledge for the filtered students’ data; interpretation and evaluation. The research study by the authors in [12] was conducted by predicting successfully binary academic performance on school students who had number of passed test as 40–60% in both mathematics and computer science with the aim of obtaining correlation between the scores to investigate the student’ cognitive abilities. The J48 algorithm is one of the best machine learning algorithms which can examine educational data categorically and continuously; it has been used by most researchers for classification of students’ dataset and it usually obtains accurate results [13]. According to research study conducted in [14], the J48 algorithm was utilized for classification on students’ dataset also comparing their performances with evaluation principles such as accuracy and implementation time. It revealed that the performance of classification techniques differs with datasets. The study also showed that factors such students’ datasets, number of instances, attributes and the type of attributes enhanced the classifier’s performance. J48 came out with better results on most educational dataset [13,14]. Researchers have applied decision tree utilizing the J48 classification algorithm to predict academic performances of students in the tertiary institution by simply testing this algorithm on unseen dataset to calculate accuracy. They intend to use this algorithm build model that can be used by the university to predict student performance, evaluate the teaching skills adopted by the lecturers and improve the learning potentials of the students in the other academic specializations [15].

2. Dataset Description
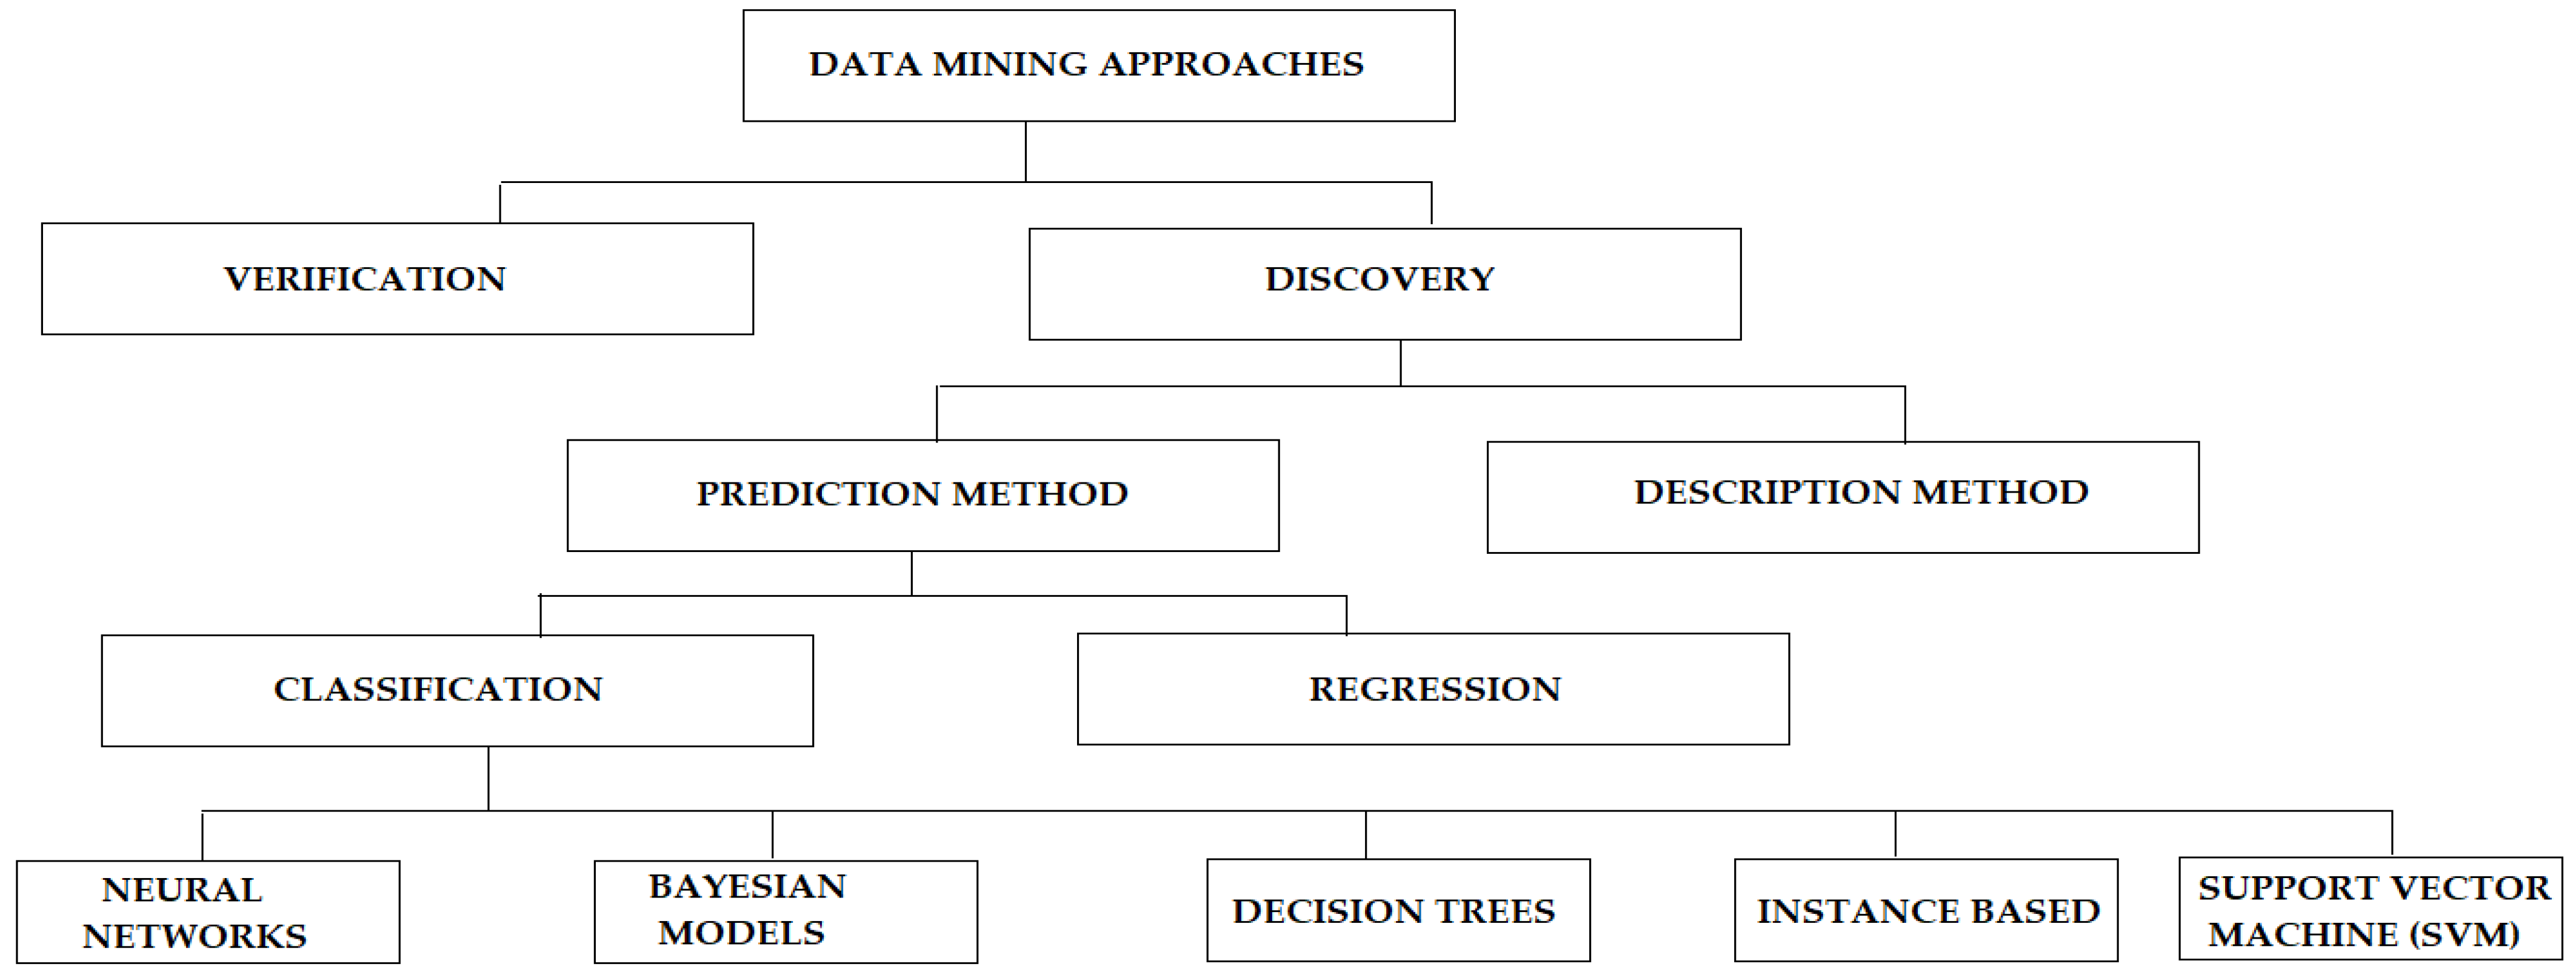
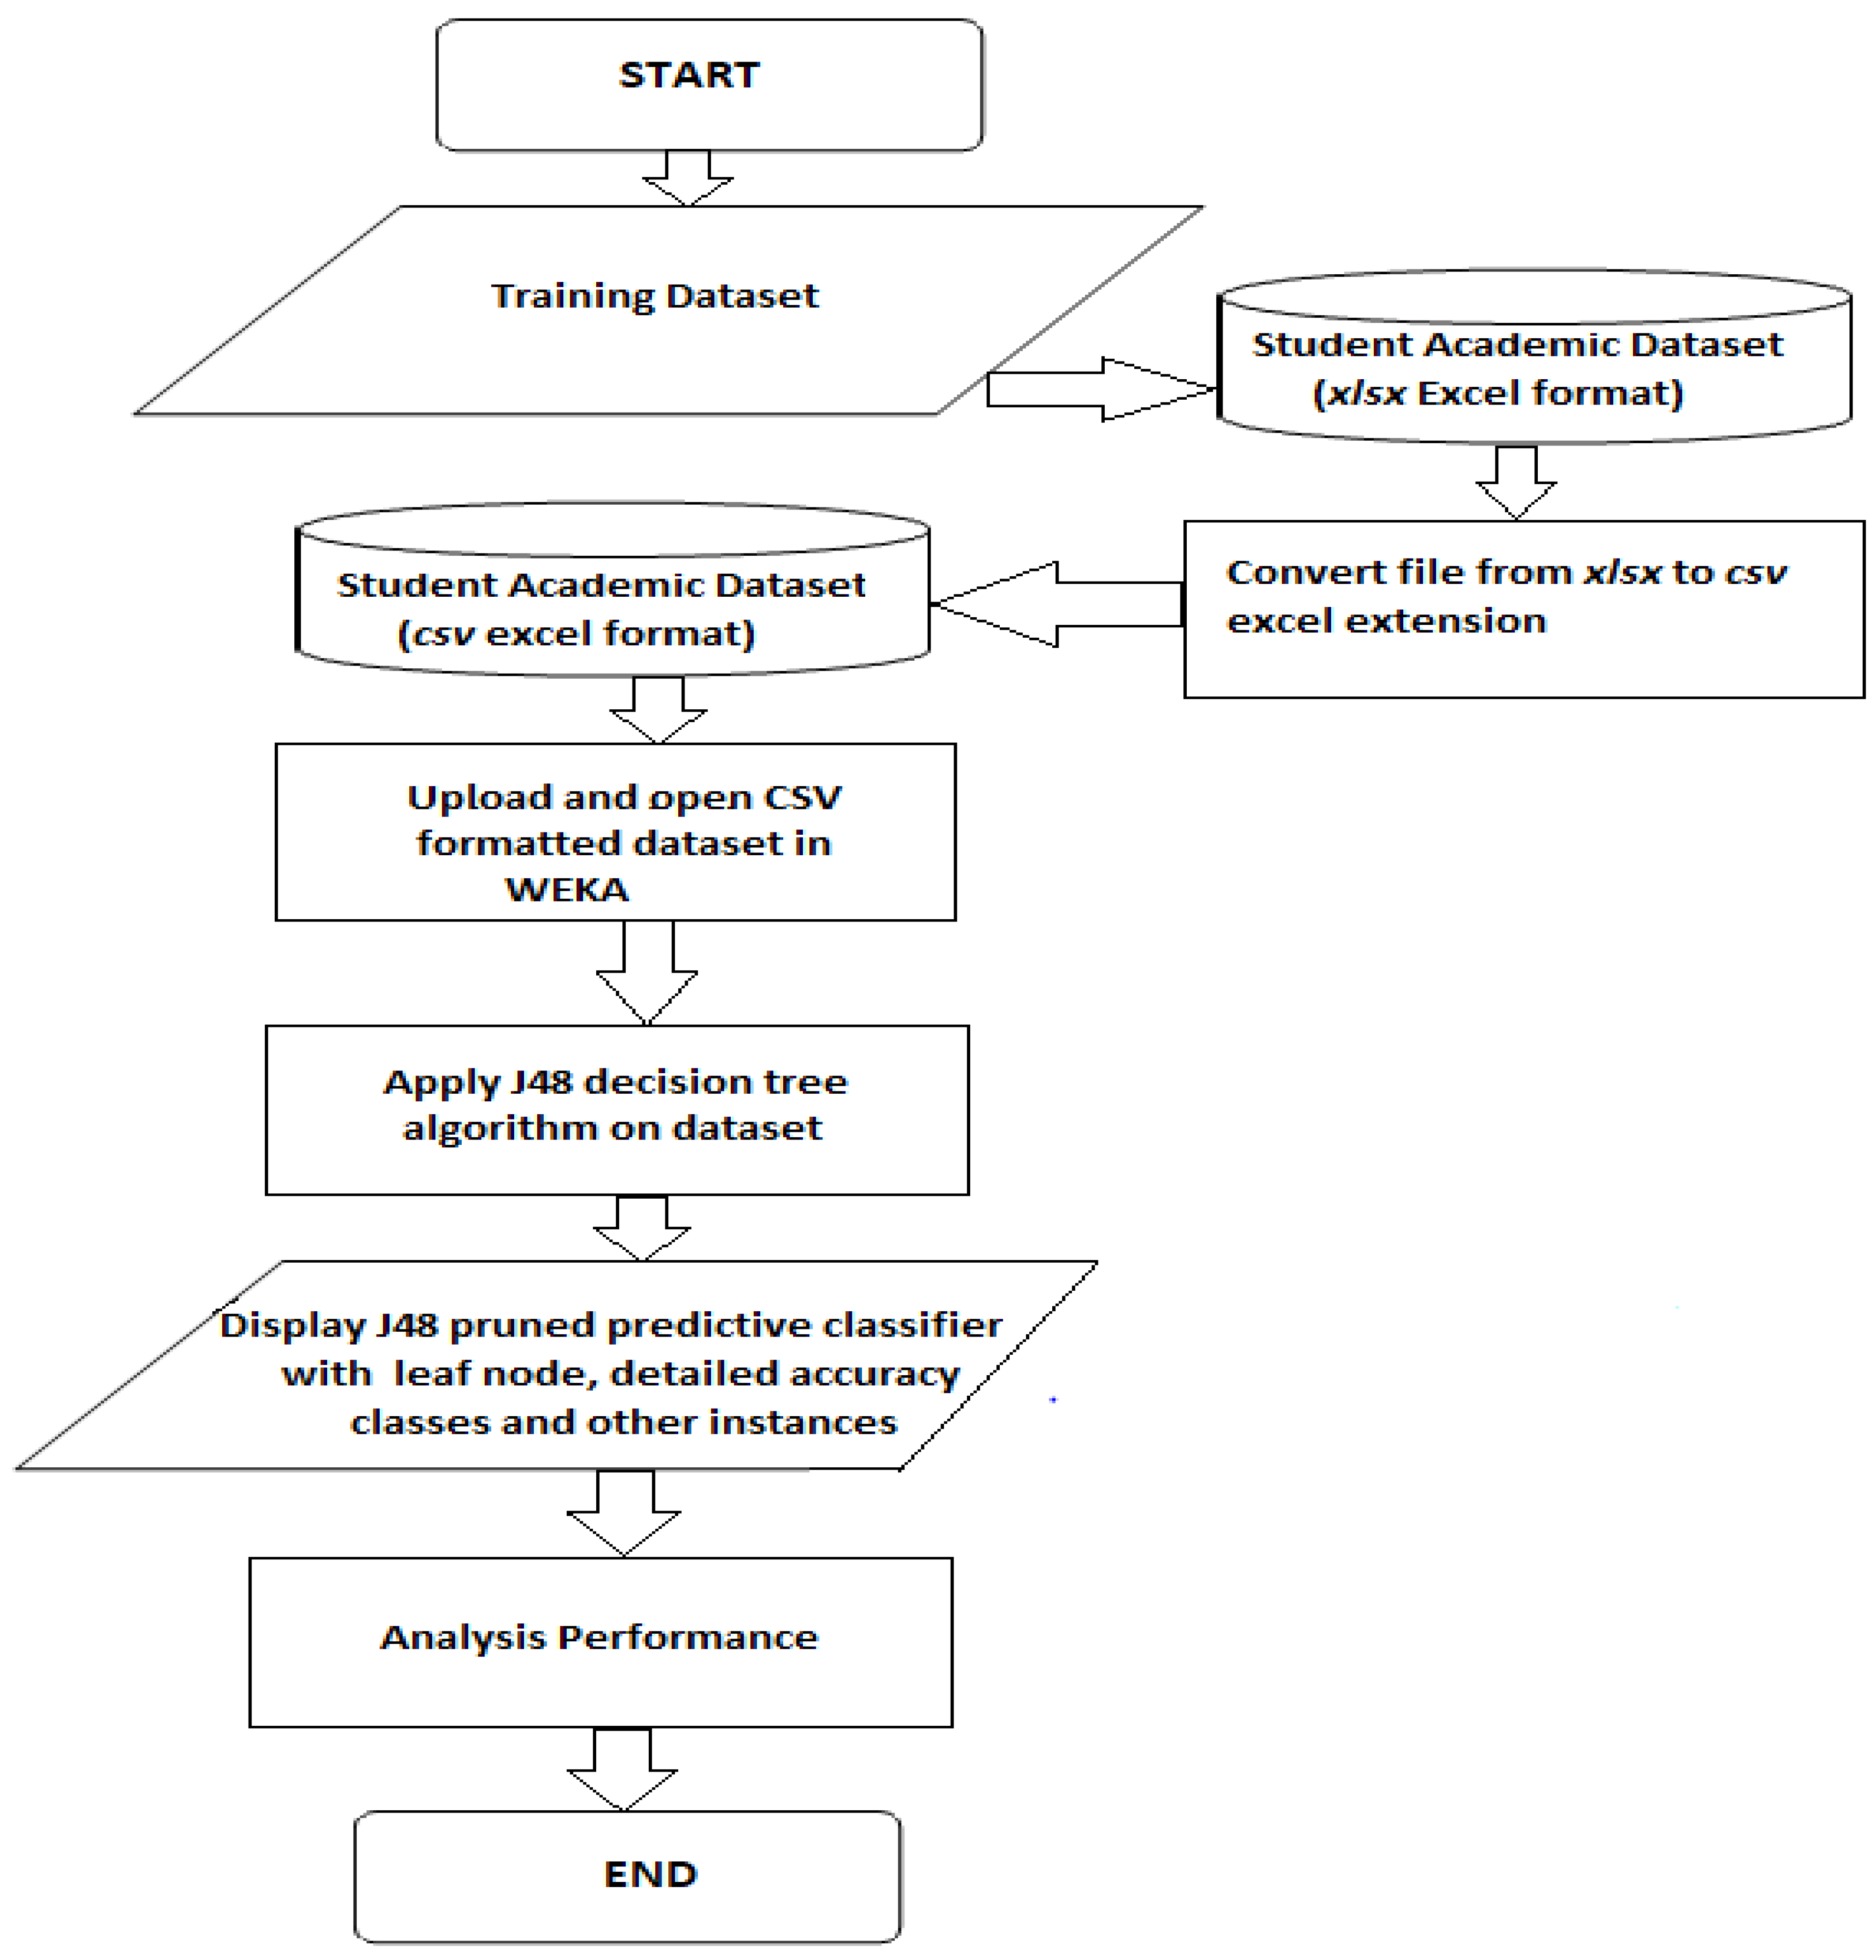
The data of the students’ academic record analyzed in WEKA utilized the J48 classification algorithm method to test and predict from the students’ future learning outcome using final year students’ dataset record from five countries. The analysis was conducted on the students’ academic results in C# programming language examinations with a total grade of 100%. The departments considered include Computer Science in Lagos State University Nigeria; Computer Science in University of Kirkuk Iraq; School of computers and systems science in Jawaharlal Nehru University New Delhi India; College of Computer Science and Information Technology in Sudan University of Science and Technology, Khartoum Sudan; and Computer Sciencein University of Cape Town South Africa. The students’ dataset obtained consist of five attributes which are “scores obtained in the C-SHARP (C#) examinations”, “grade remarks”, “grades”, “gender” and “department”. For the purpose of the J4.8 algorithm analysis in WEKA, only “grades” columns to produce a detailed accuracy class reading. The grades were classified into A (70–100) marks, B (60–69) marks, C (50–59) marks, D (40–49) marks and F (0–39) marks which depicts excellent, very good, average, poor and failed, respectively. The functional requirements for the analysis of the students’ data conducted in WEKA can be illustrated pictorial with the aid of program flowchart. Program Flow charts (Figure 2) are data flow that describes the sequence of data operations and decisions for a particular program or algorithm [16].

3. Methods

The J48 Decision Algorithm is a predictive machine learning model that the dependent variables also known as target value of a new sample based on various attribute values of the data available [17]. The node of a J48 decision tree denotes the different utilized attributes [18]. With the aid of tree classification algorithm, the essential distribution of data become easier to understand and flexible to implement. J48 is an extension of ID3 and it develops a decision node utilizing the expected estimations of the class. J48 algorithm deals with decision trees pruning, lost or missing attribute estimations of the data and varying attribute costs [19]. The J48 algorithm can be generated via the following three stages [20]:
  • Stage 1: If an instance belongs to similar class, the leaves are labeled with a similar class;
  • Stage 2: For each attribute, the potential data will be figured and the gain in this data will be attained from the test conducted on attribute;
  • Stage 3: Finally, the best attribute will be selected in regard to the current selection parameter.

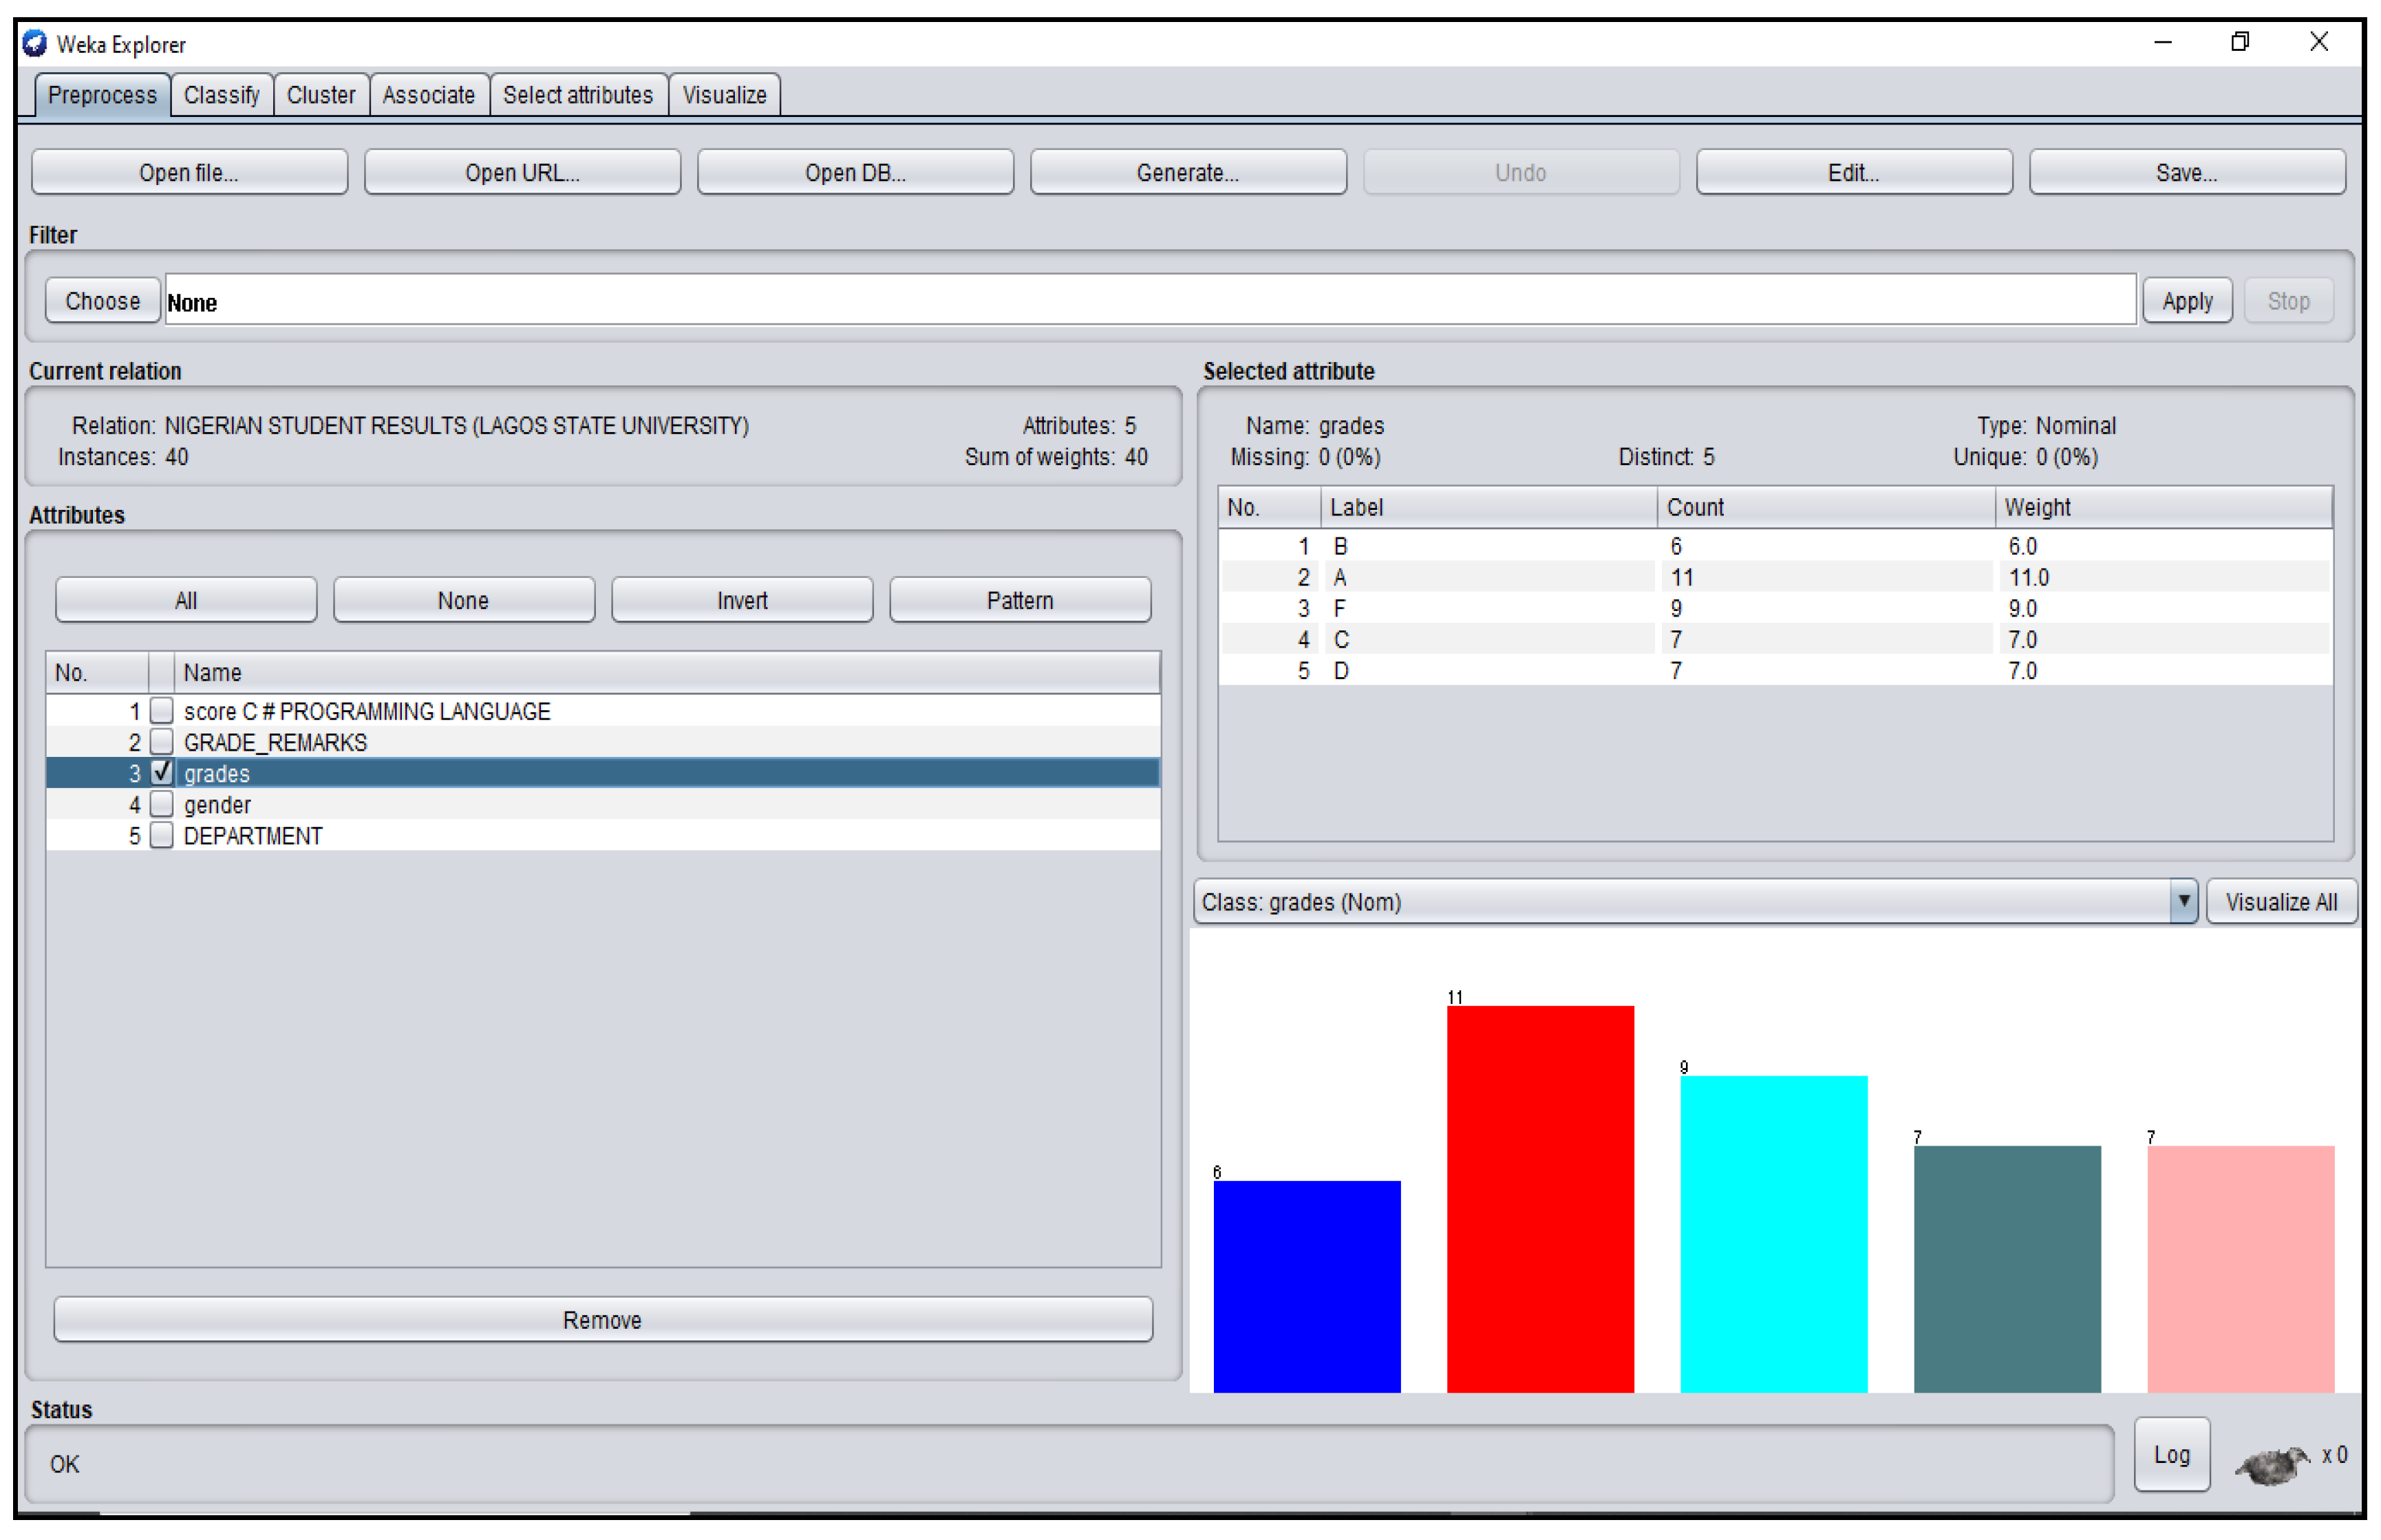
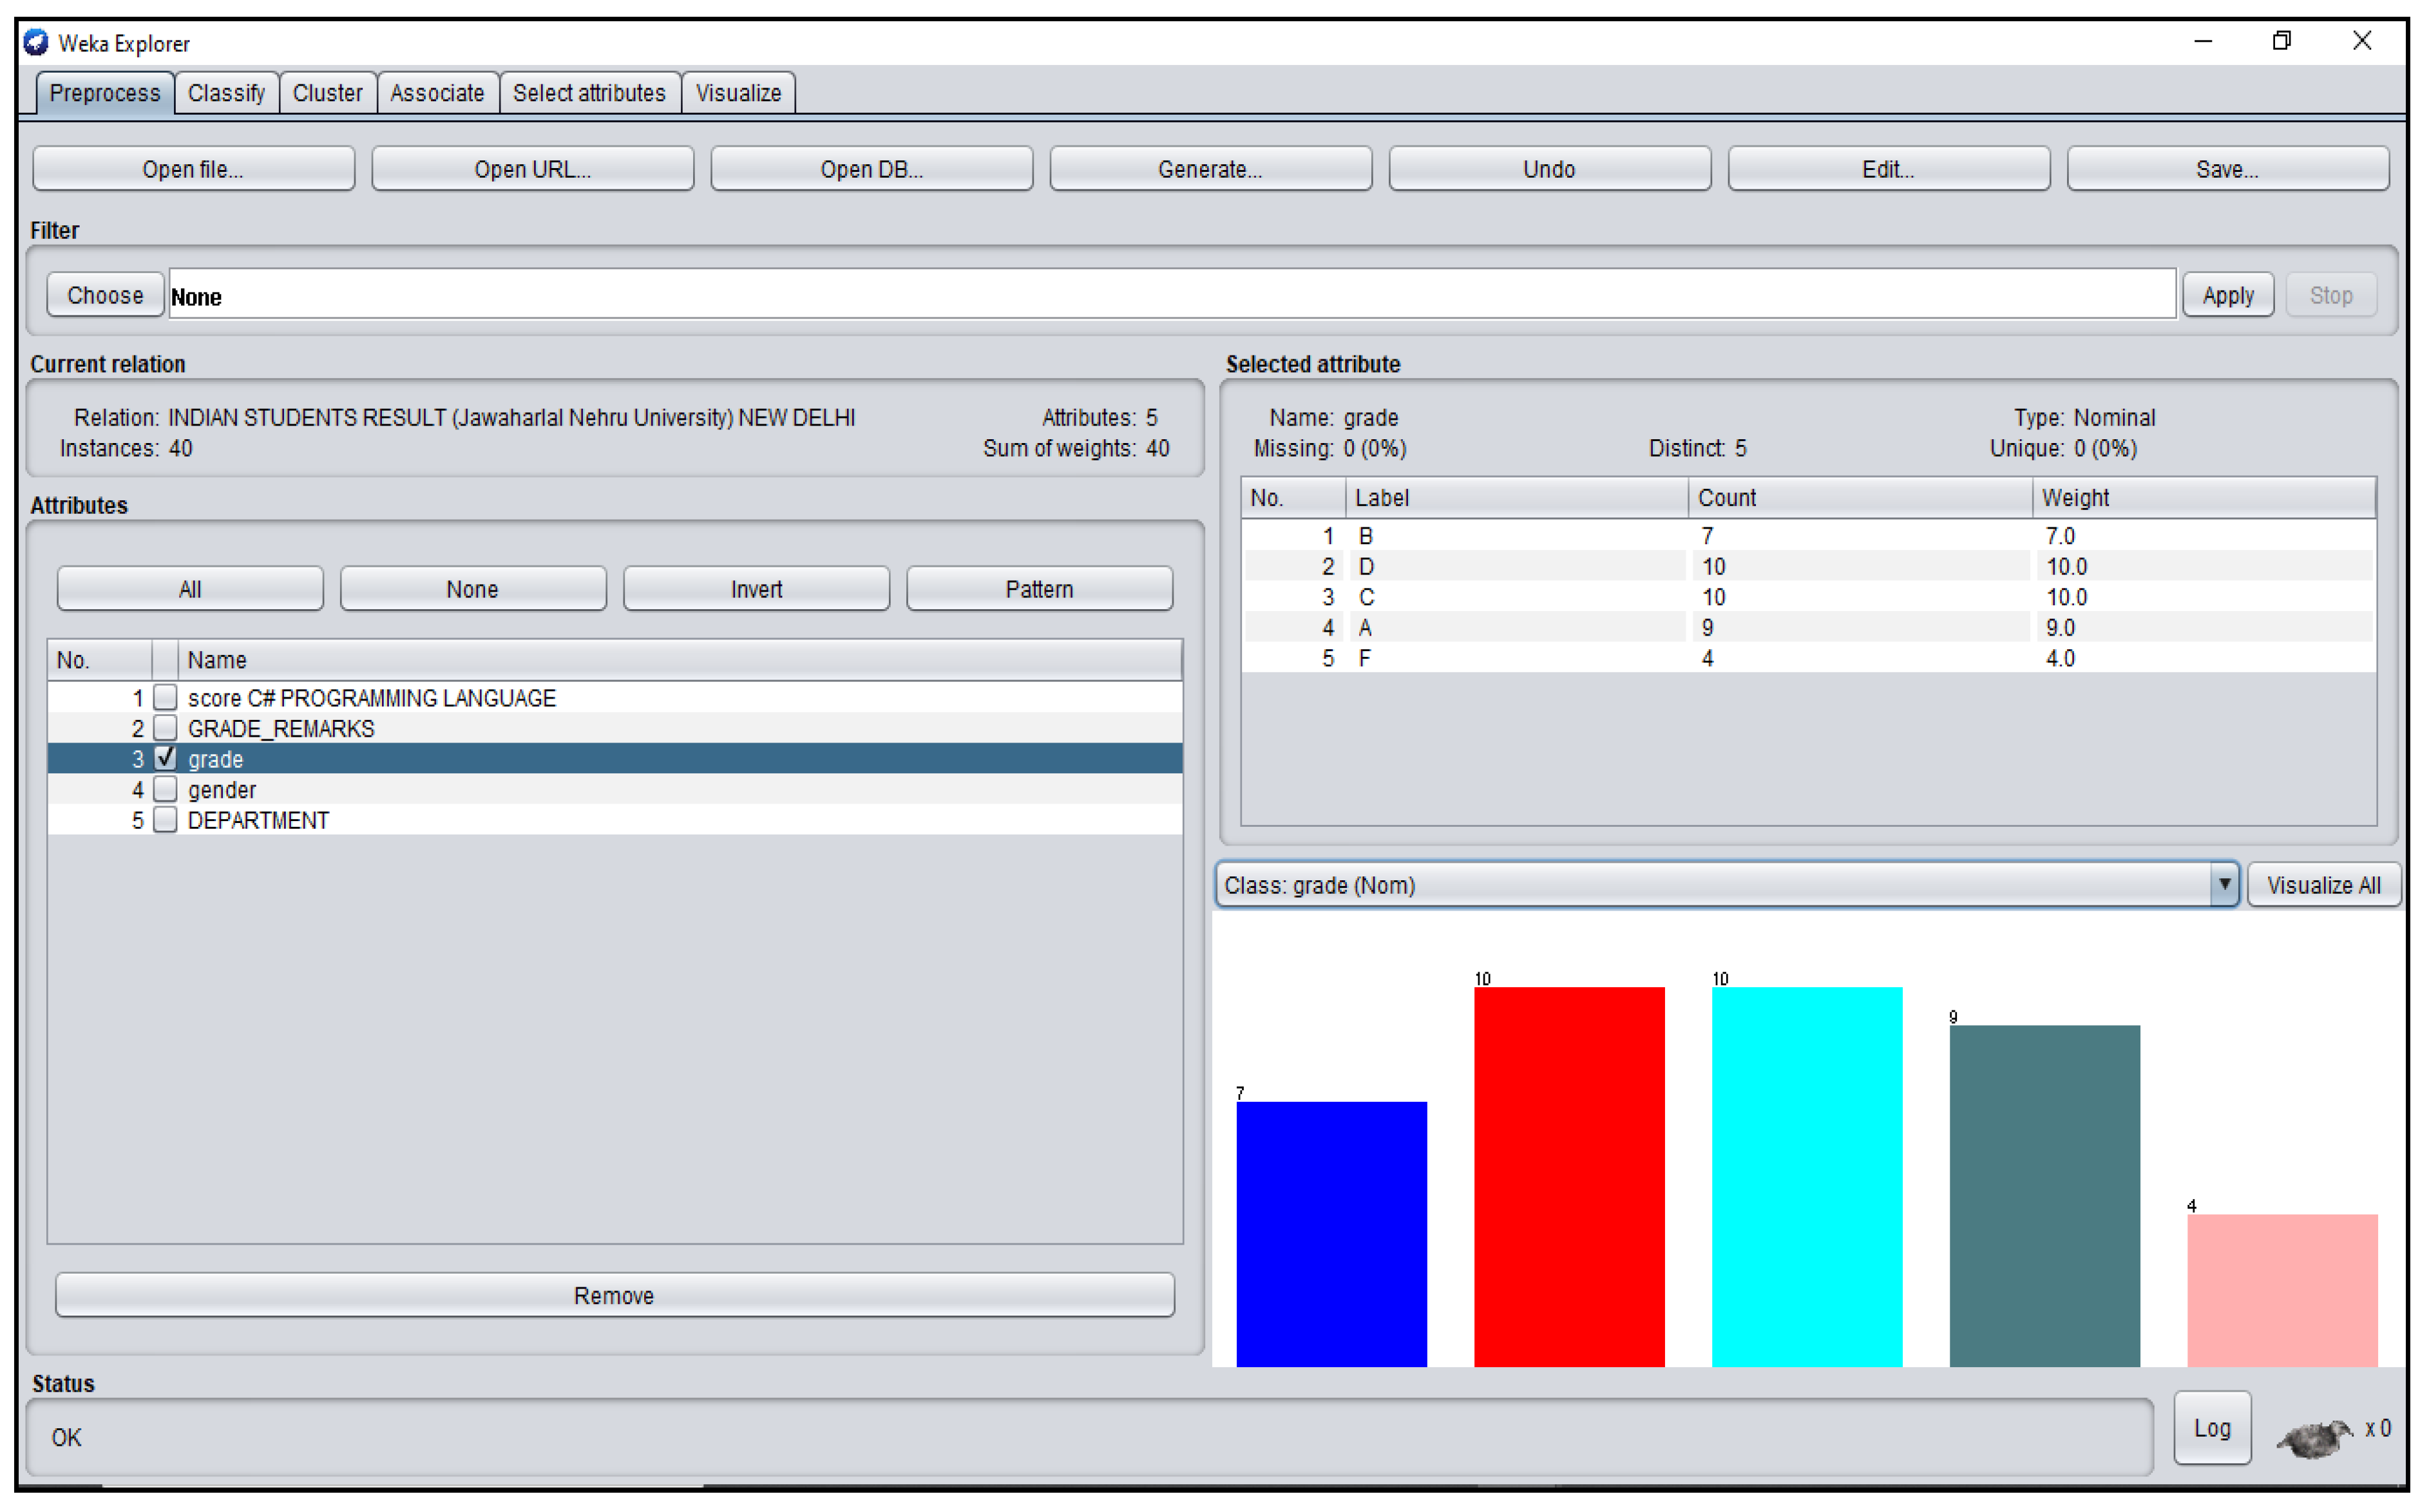
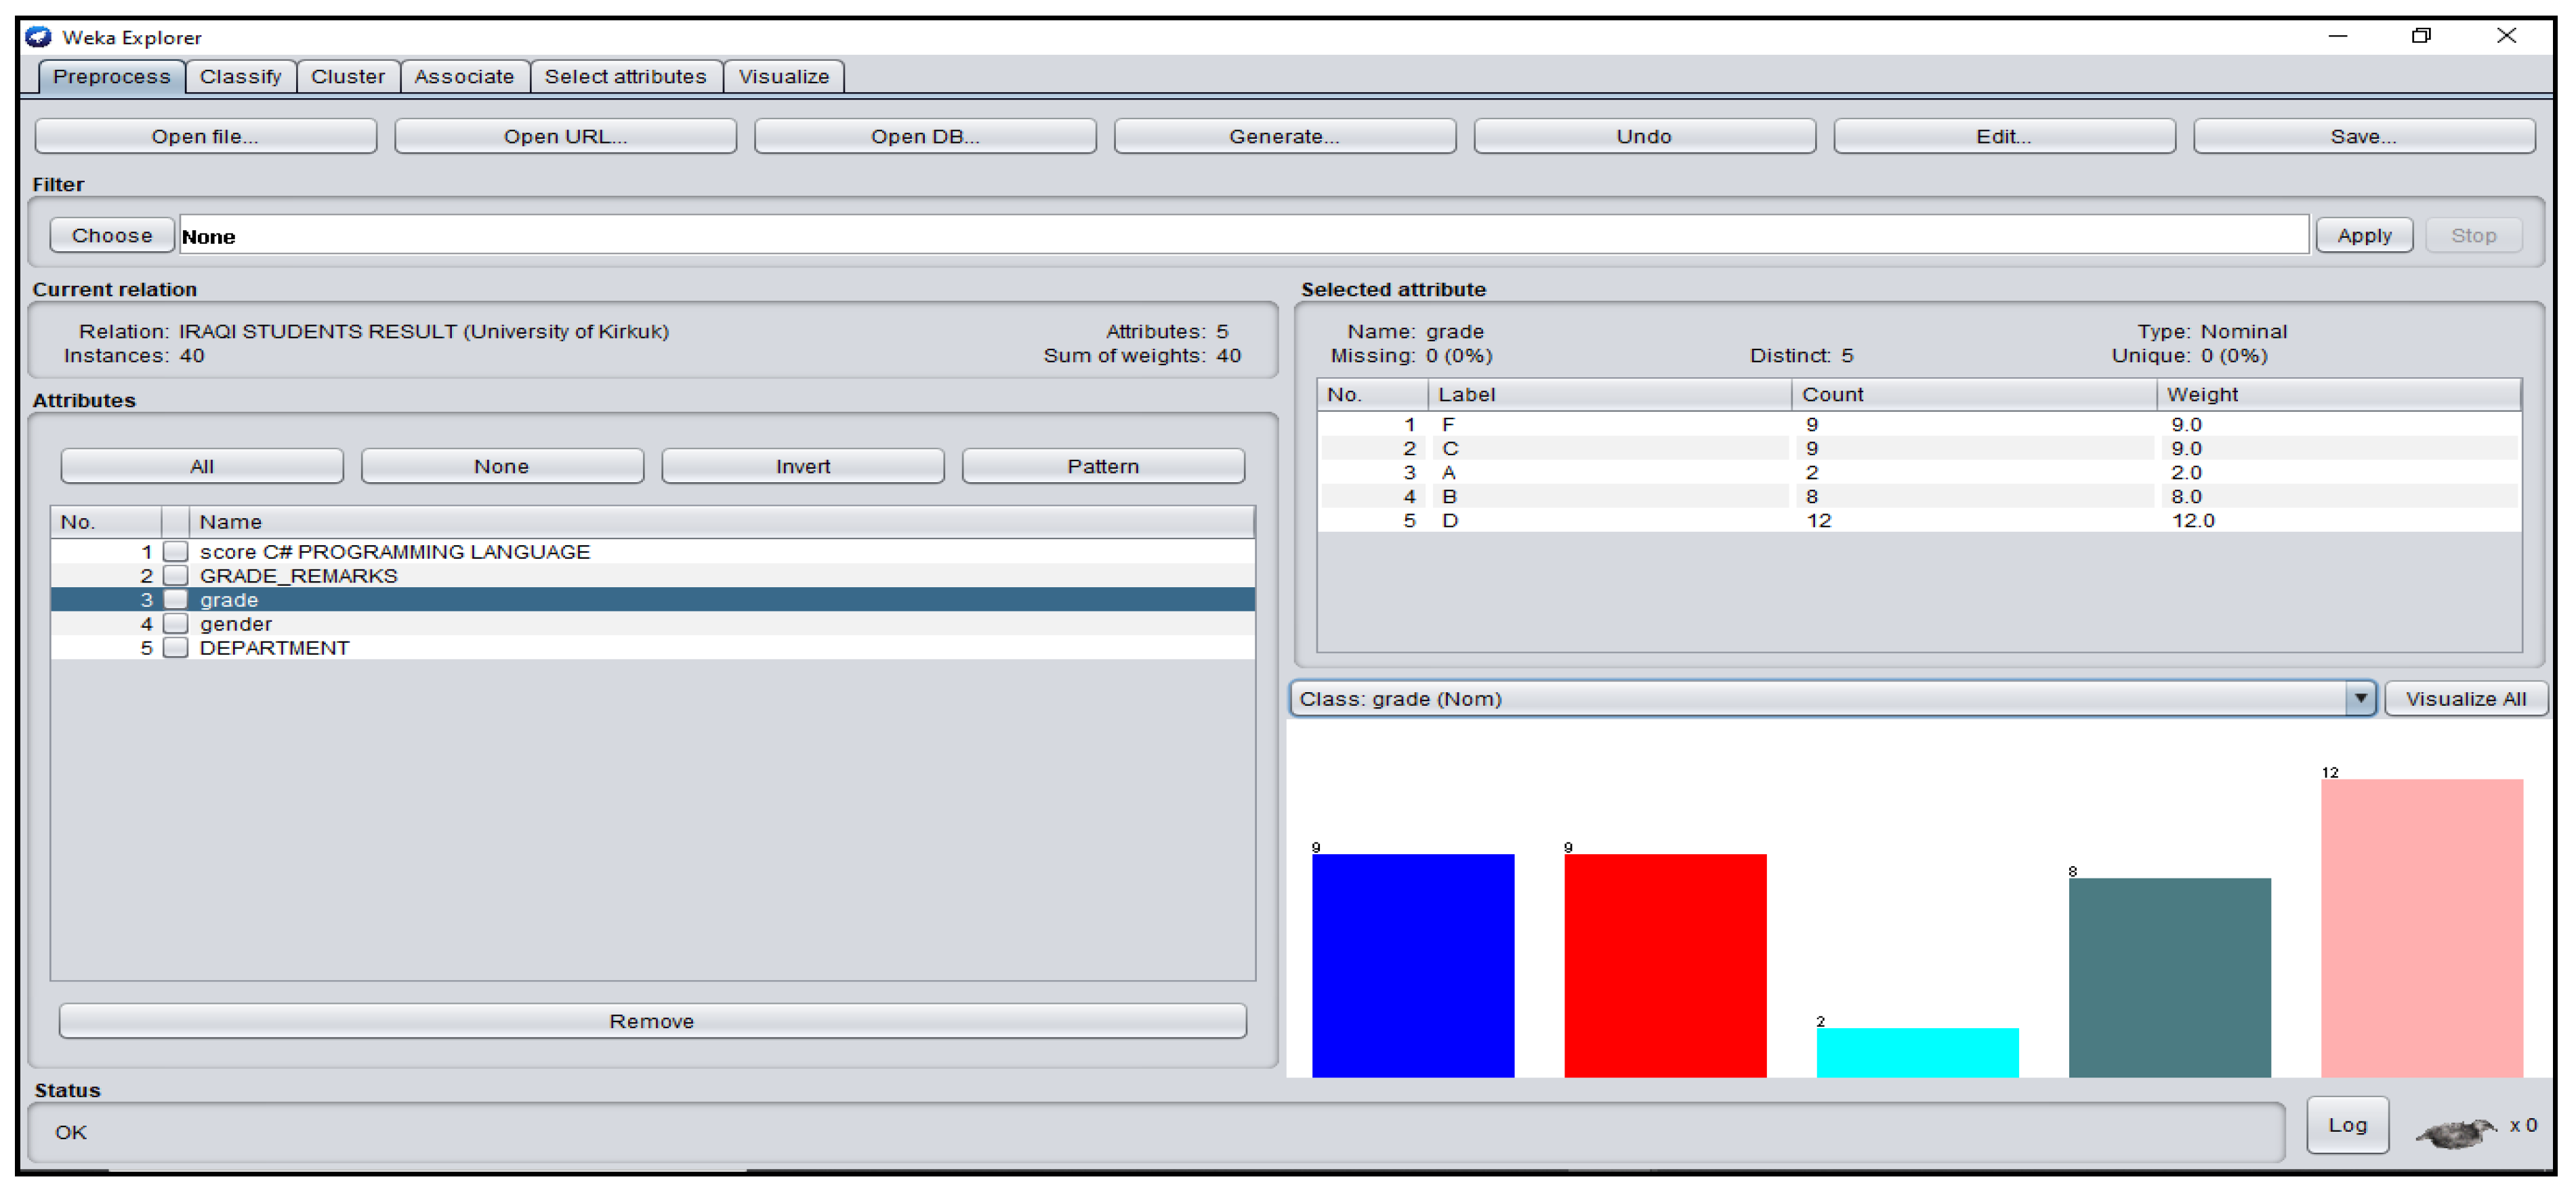
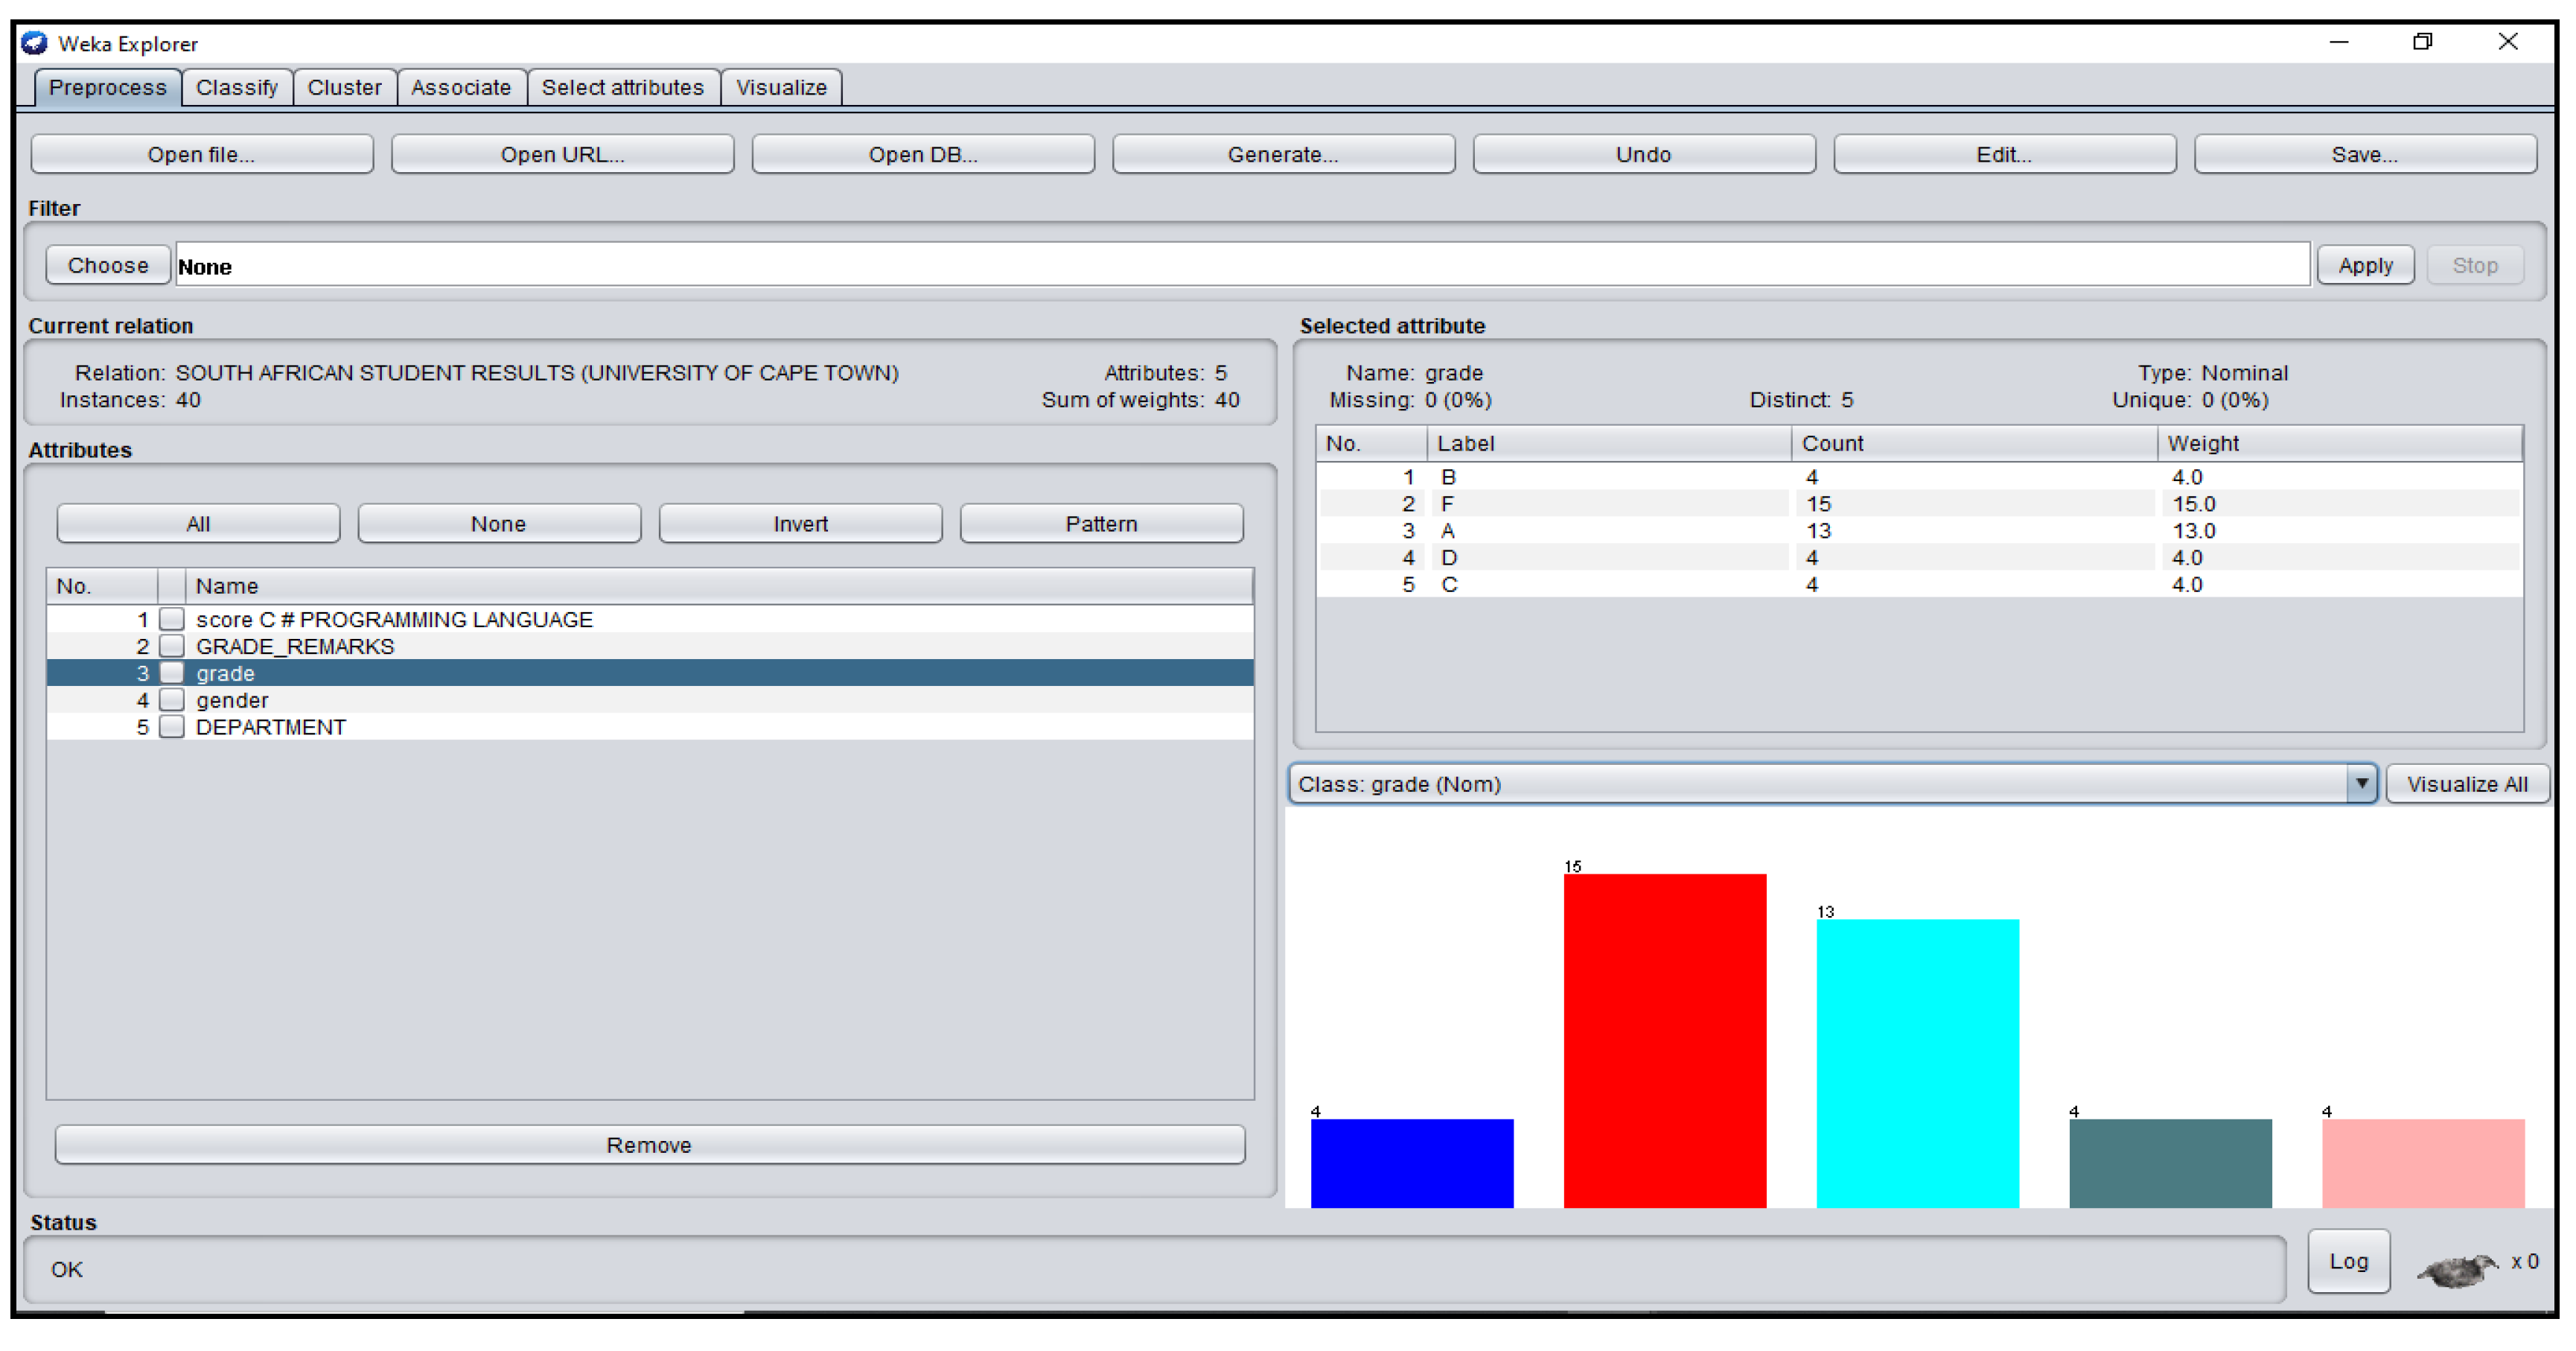
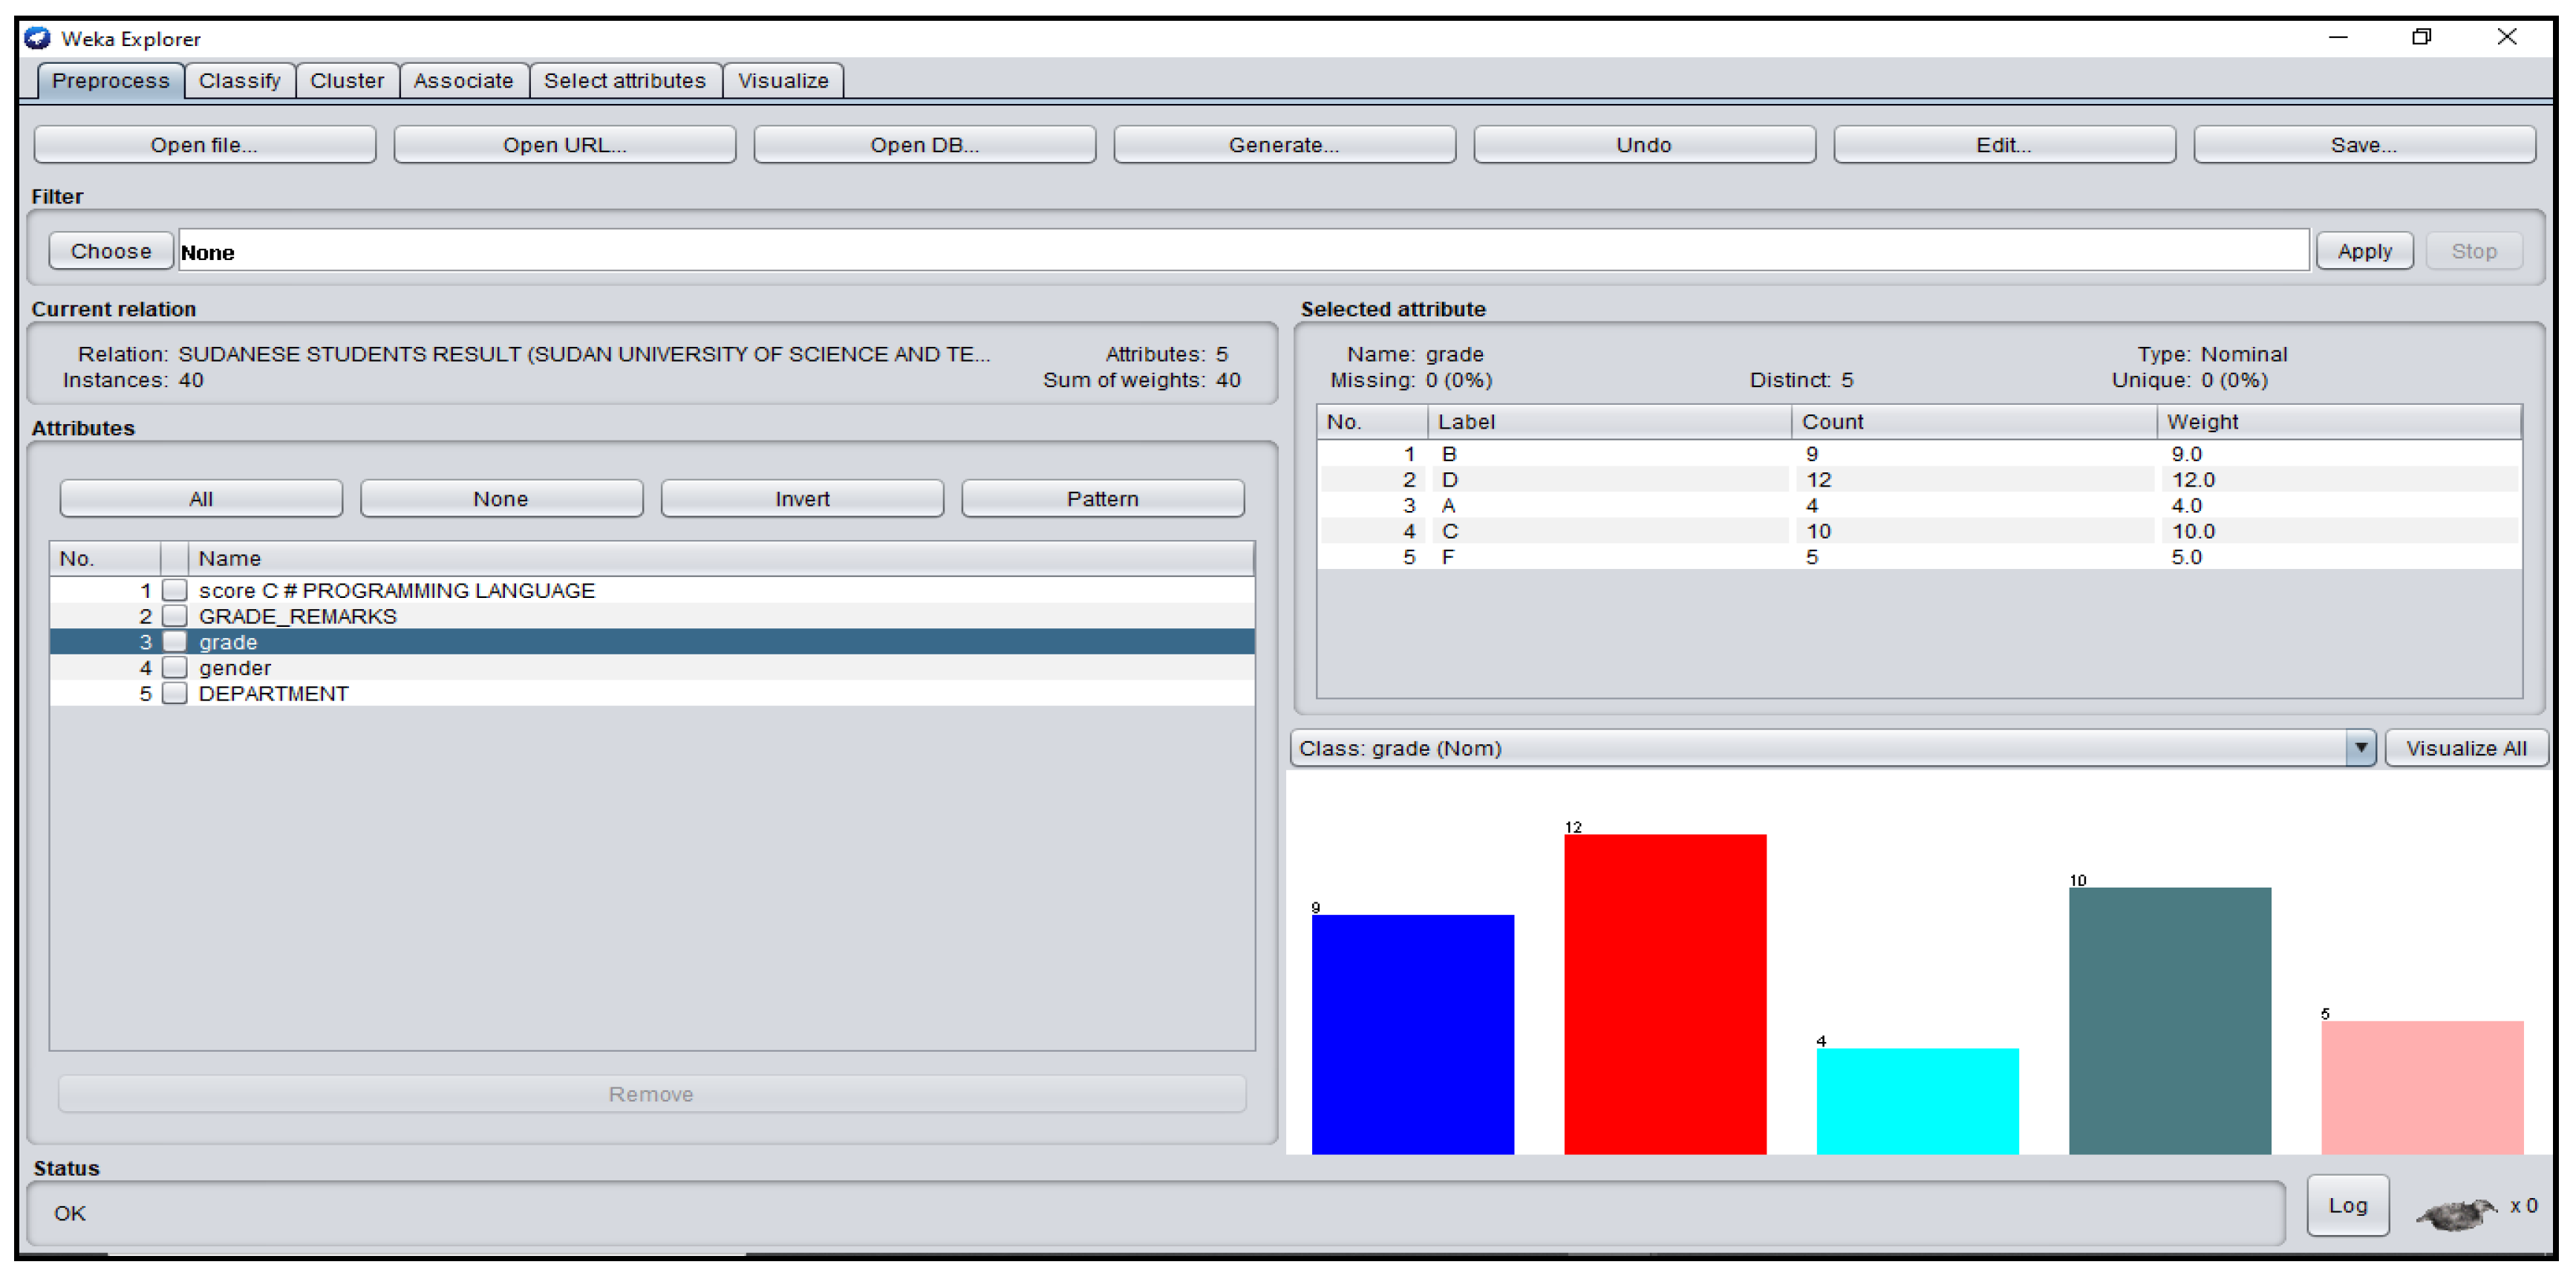
3.1. Students’ Dataset Analysis in WEKA

The J48 tree generated in WEKA for the students’ academic dataset across the 5 countries utilized 50% percentage split with training set: 25% for the test data and the remaining 25% for validate to obtain the classifier model. The J48 decision tree classifier output algorithm obtained from the students’ result for the five universities analyzed is displayed in the Appendix A section of this work.

3.2. Calculations of the Evaluation Measures of the Detailed Accuracy Class Table

In the data analysis conducted, the three standard measures used in the evaluation of the classification qualities include the Recall, Precision and F-Measure. Precision is the ratio of the correctly classified cases of total number of misclassified cases and correctly classified cases [21]. The recall is the ratio of correctly classified samples to the total number of unclassified instances and correctly classified cases. The F-measure is the aggregate of the values of recall and precision [21,22]. Other measures used in the obtaining and evaluation of results include the execution time, TP rate, FP rate, ROC area, PRC area and confusion matrix [23].
The calculations of the precision, F-measure, recall values can be obtained using the Equations (1)–(3), respectively:
Precision = TP TP + FP  
F Measure = 2 × Recall × Precision Recall + Precision
Recall = TP TP + FN
The TP represents the values of the true positive rate; the FP represents false positive rate value, and the FN represents the false negative rate. The precision, F-measure and the Recall values are some of the evaluation parameters generated in WEKA in the detailed accuracy by class table.

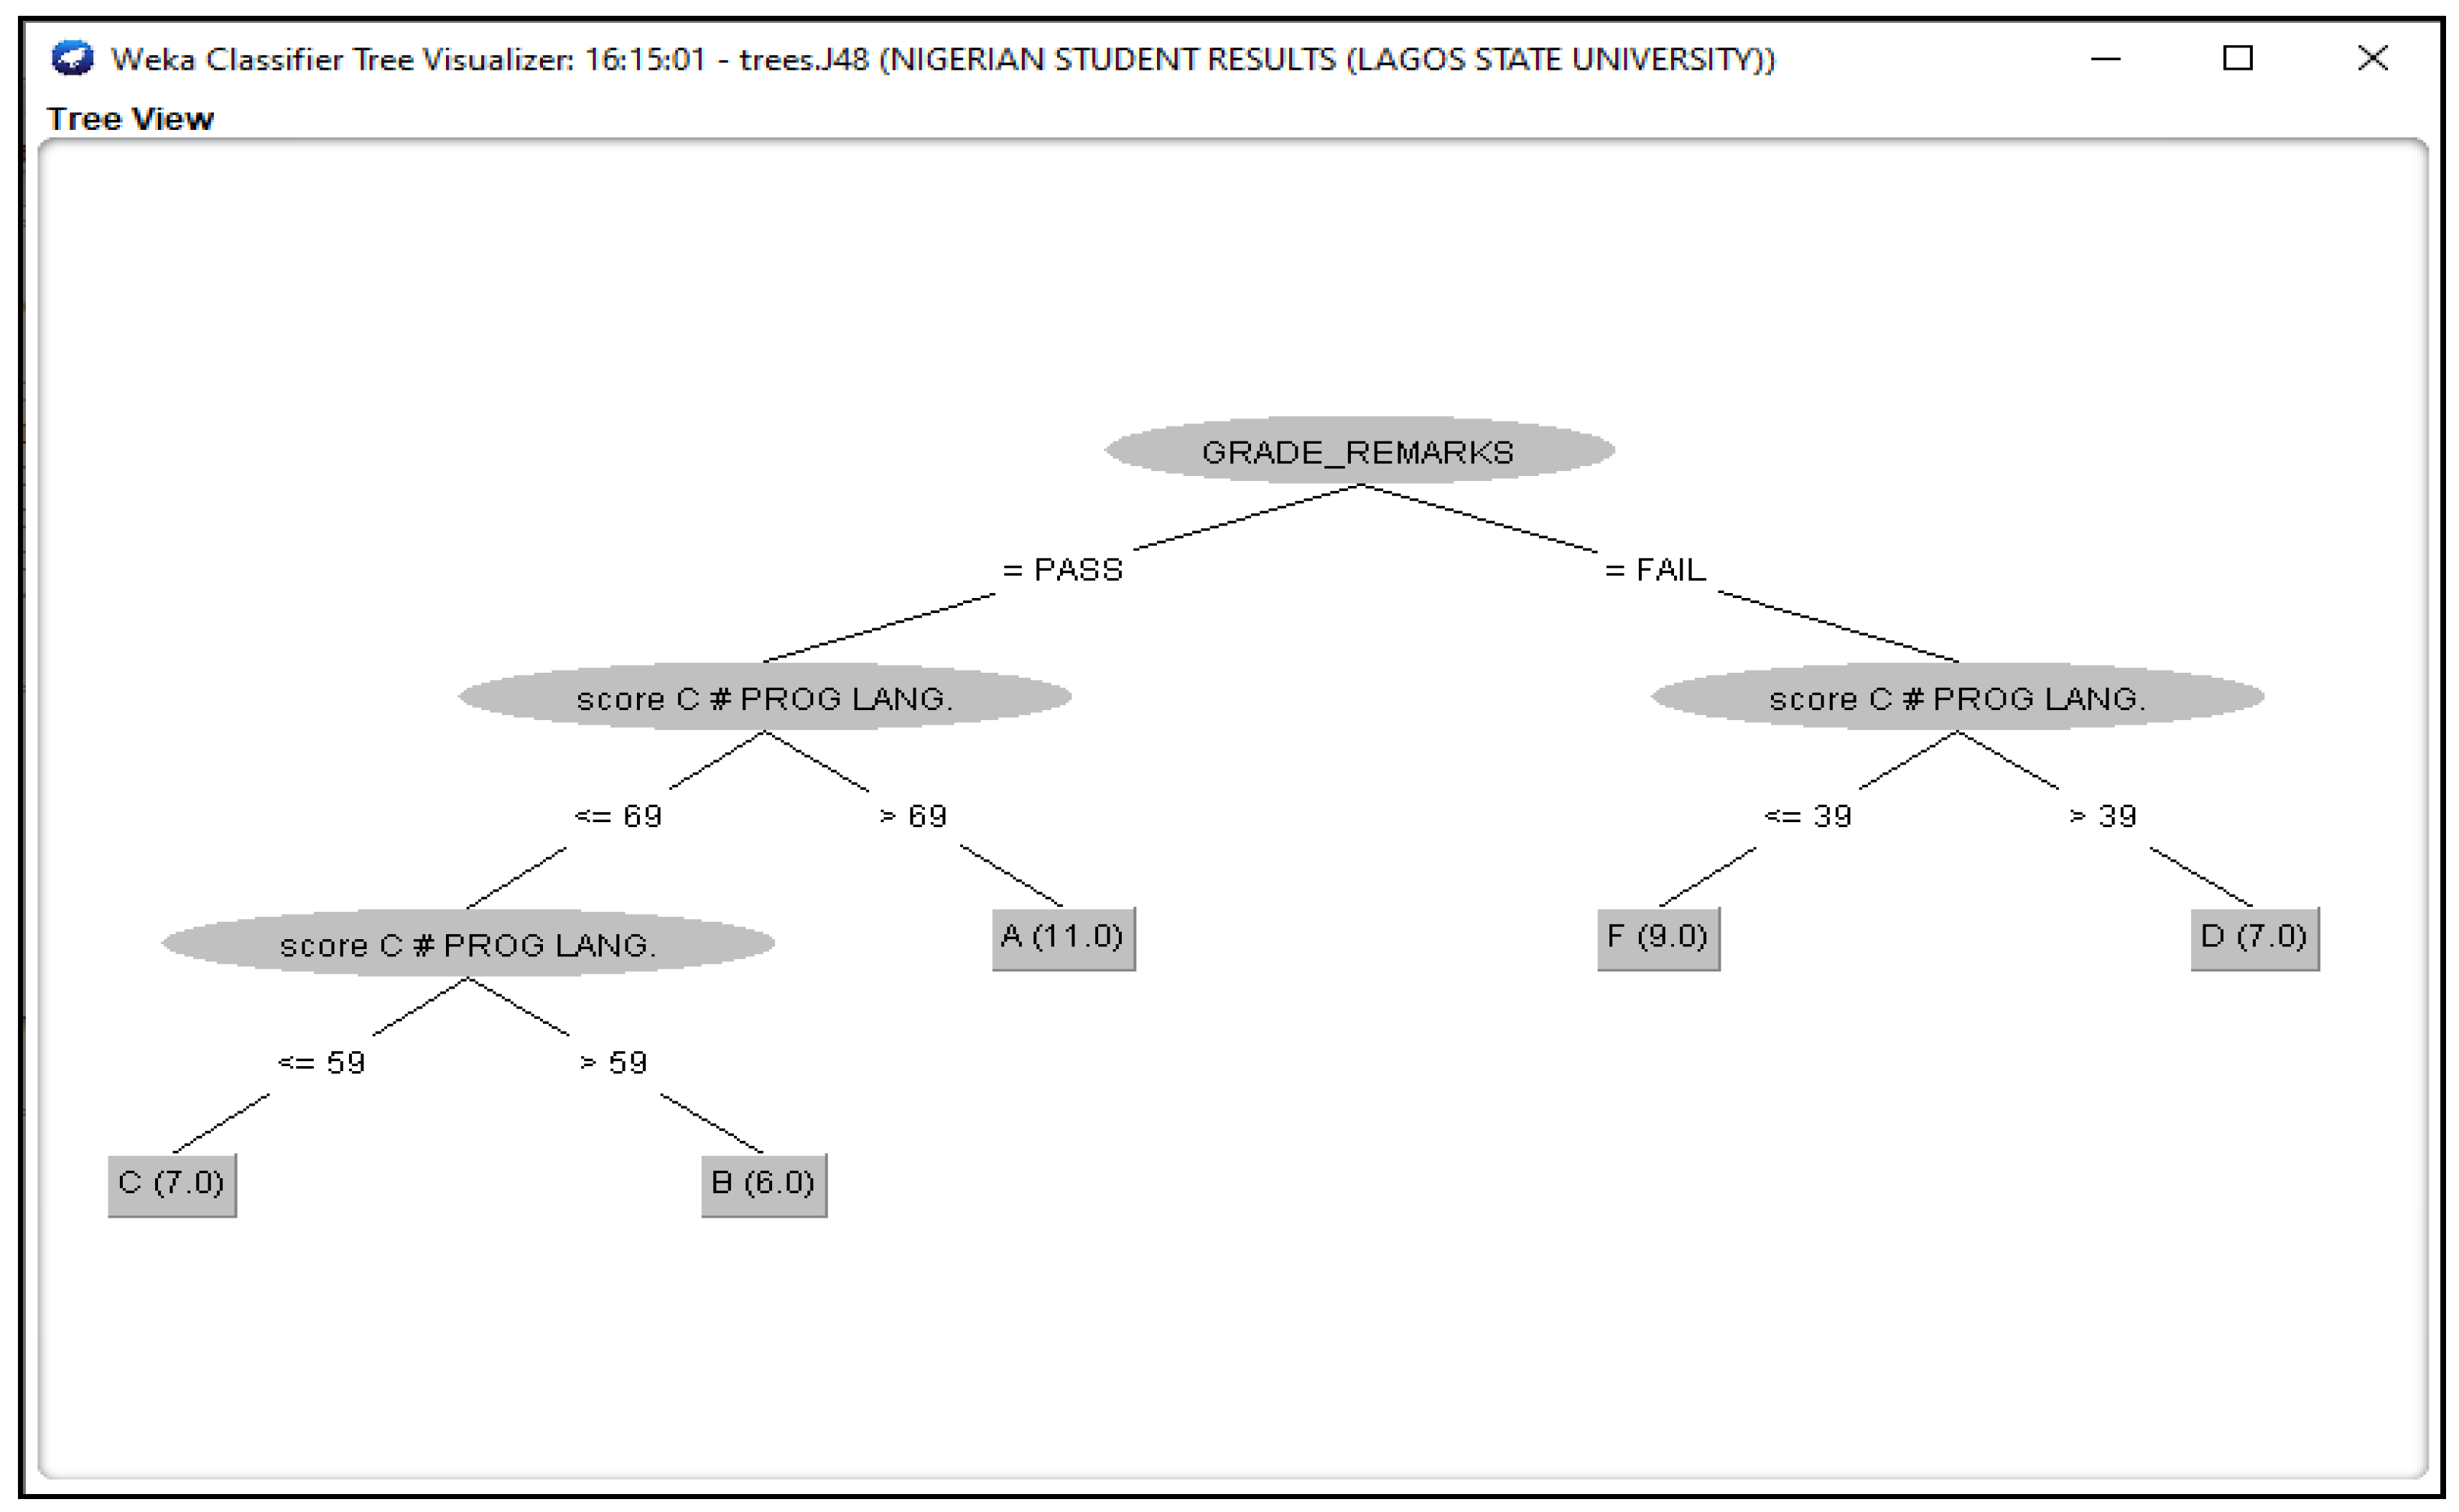
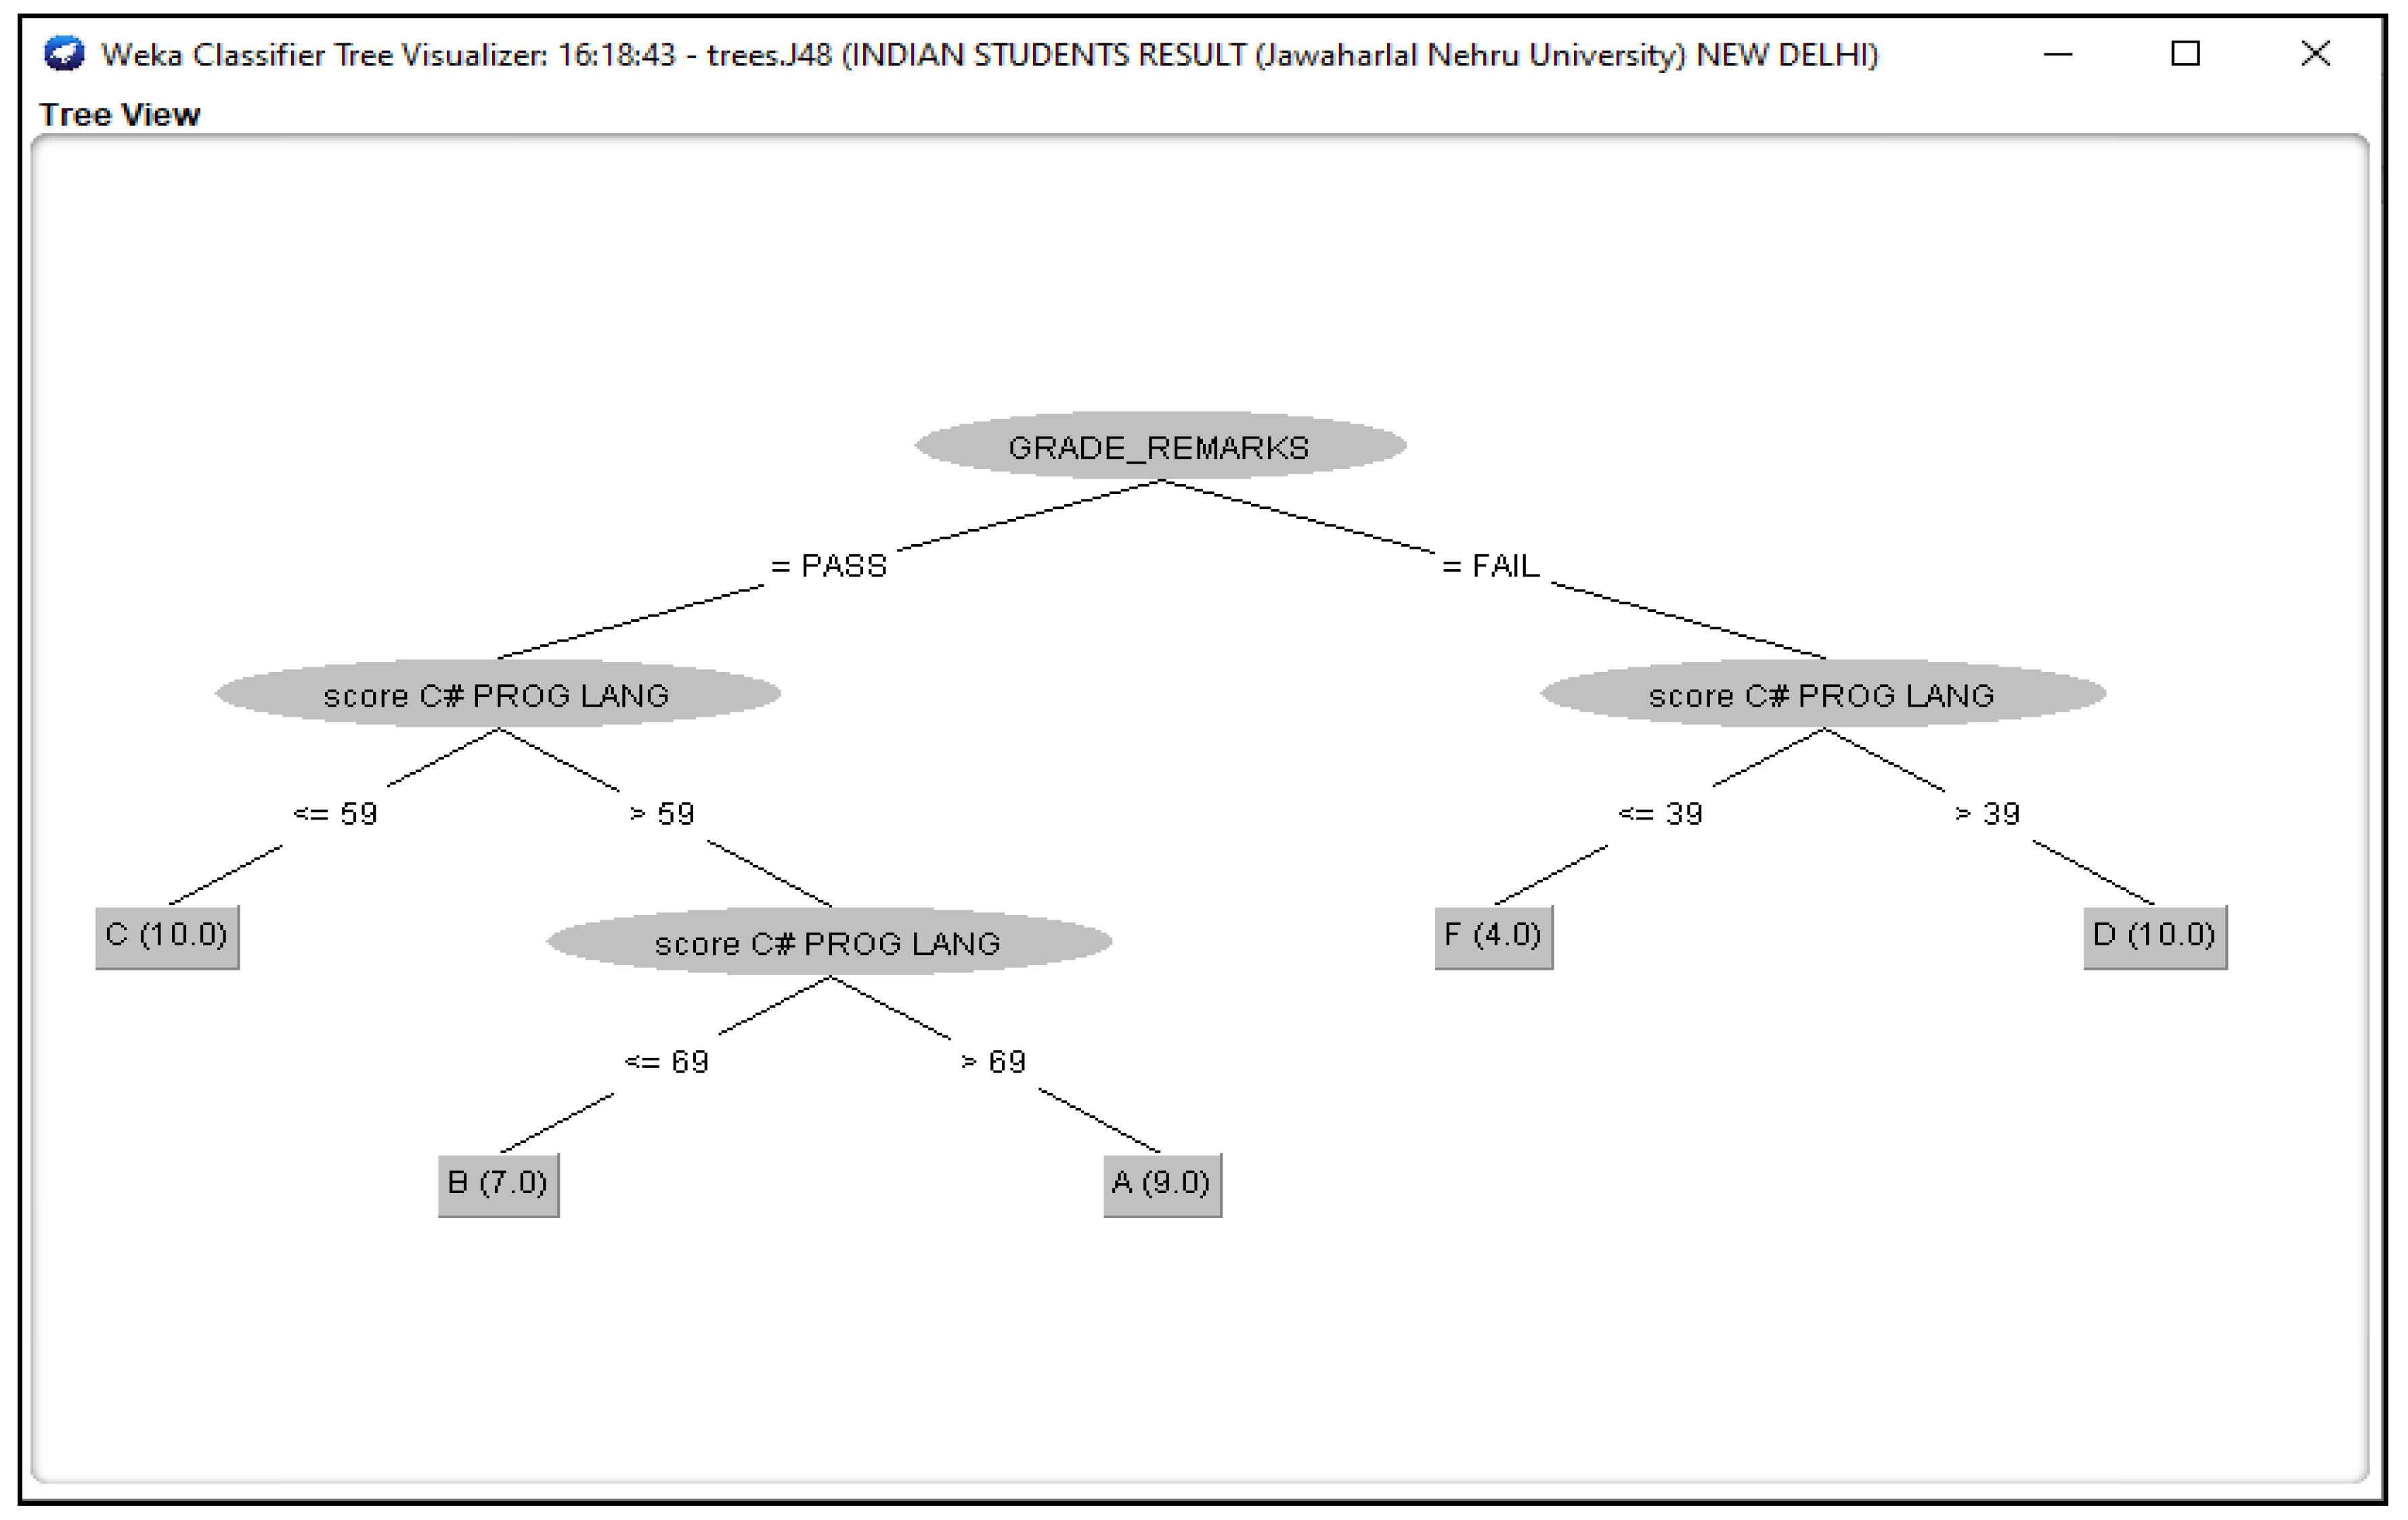
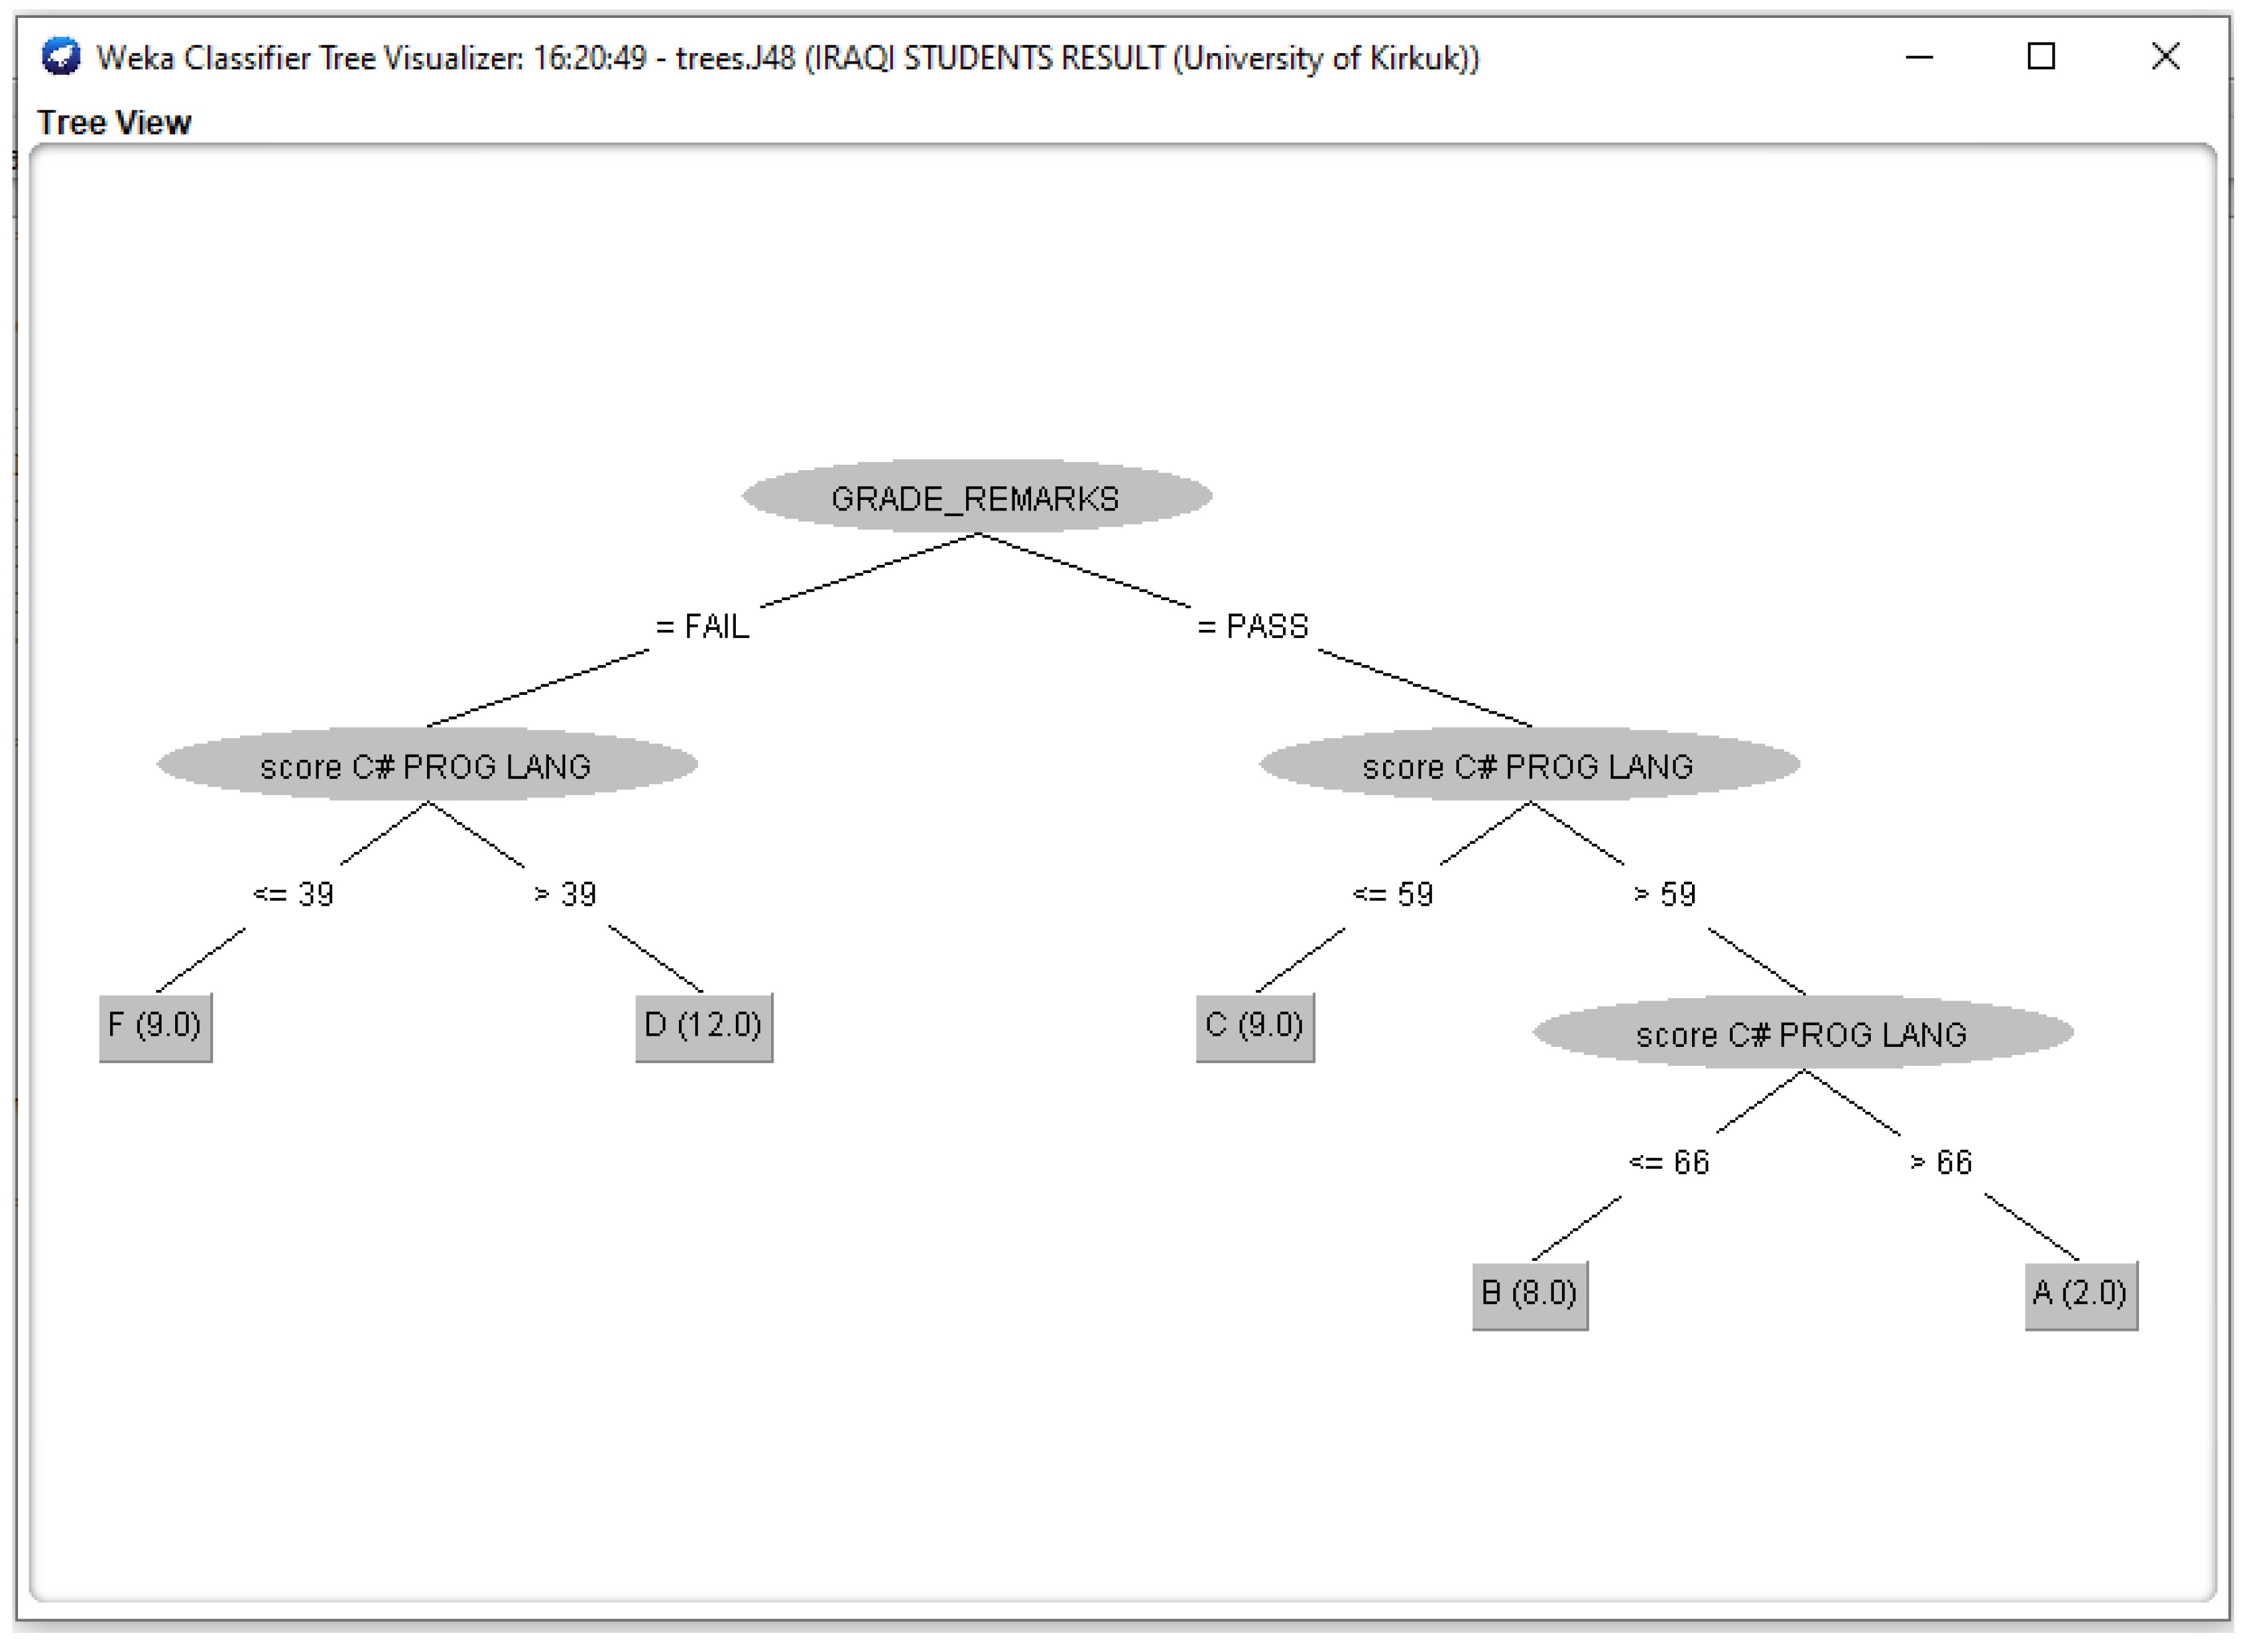
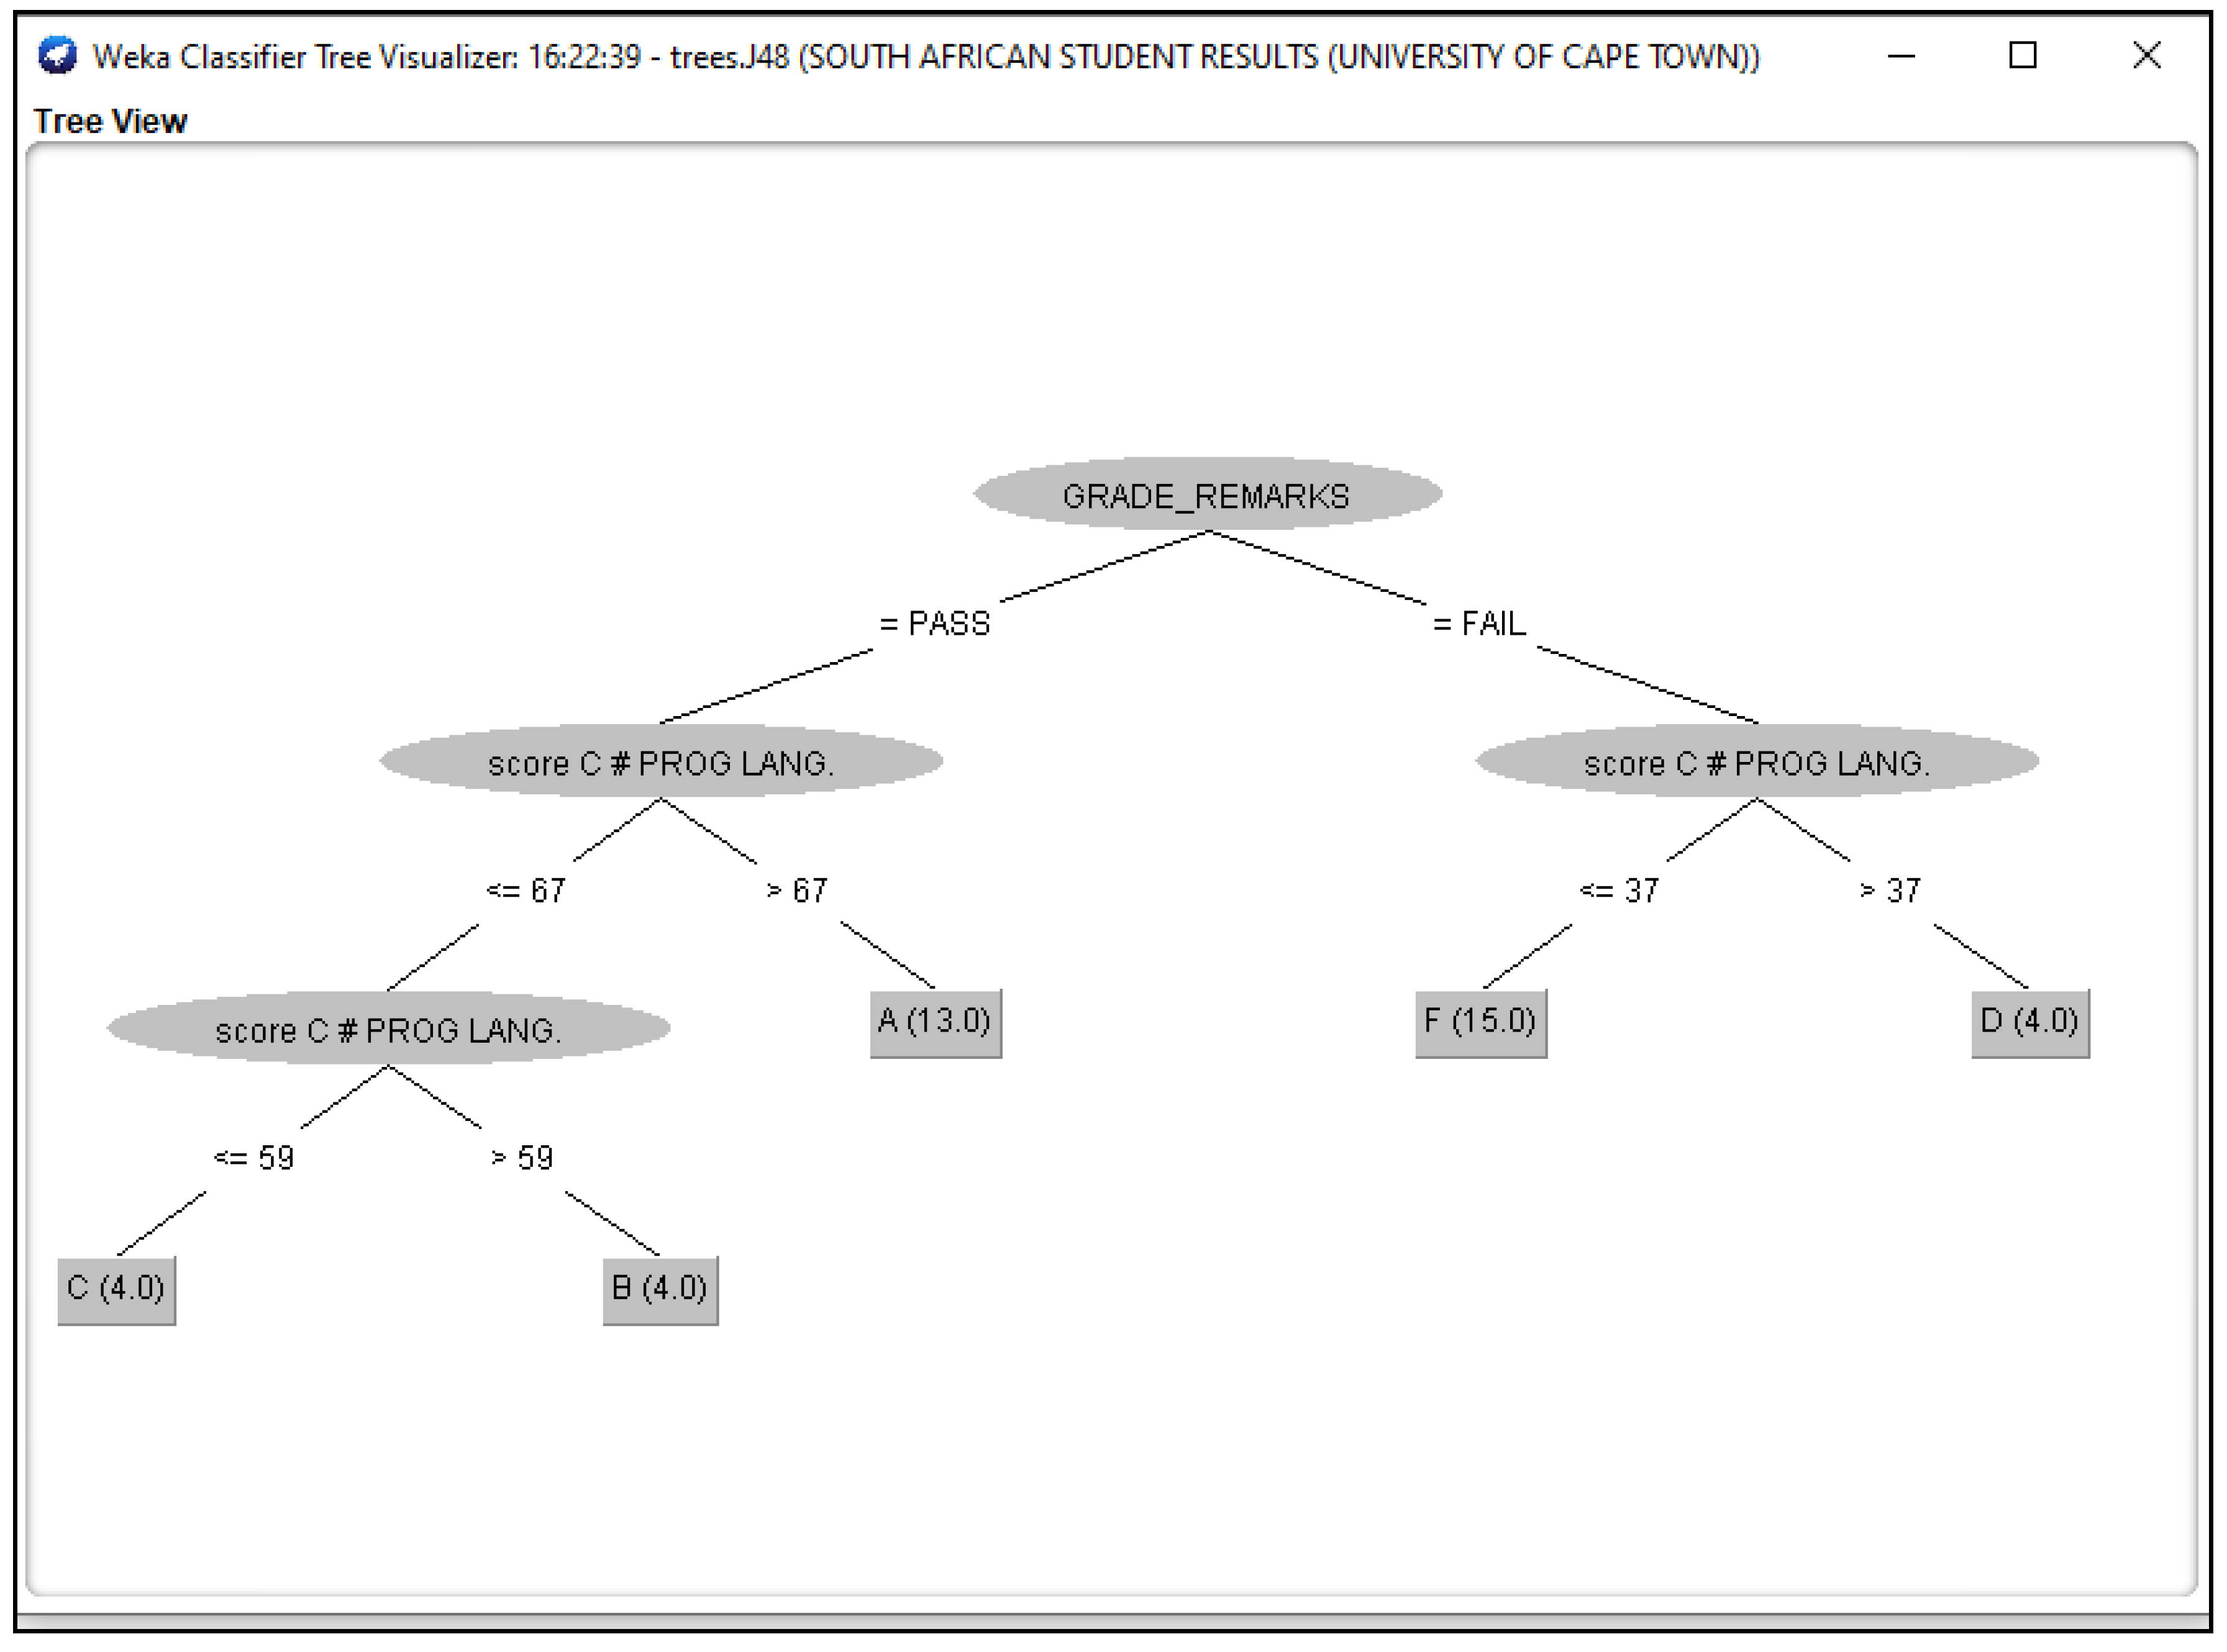
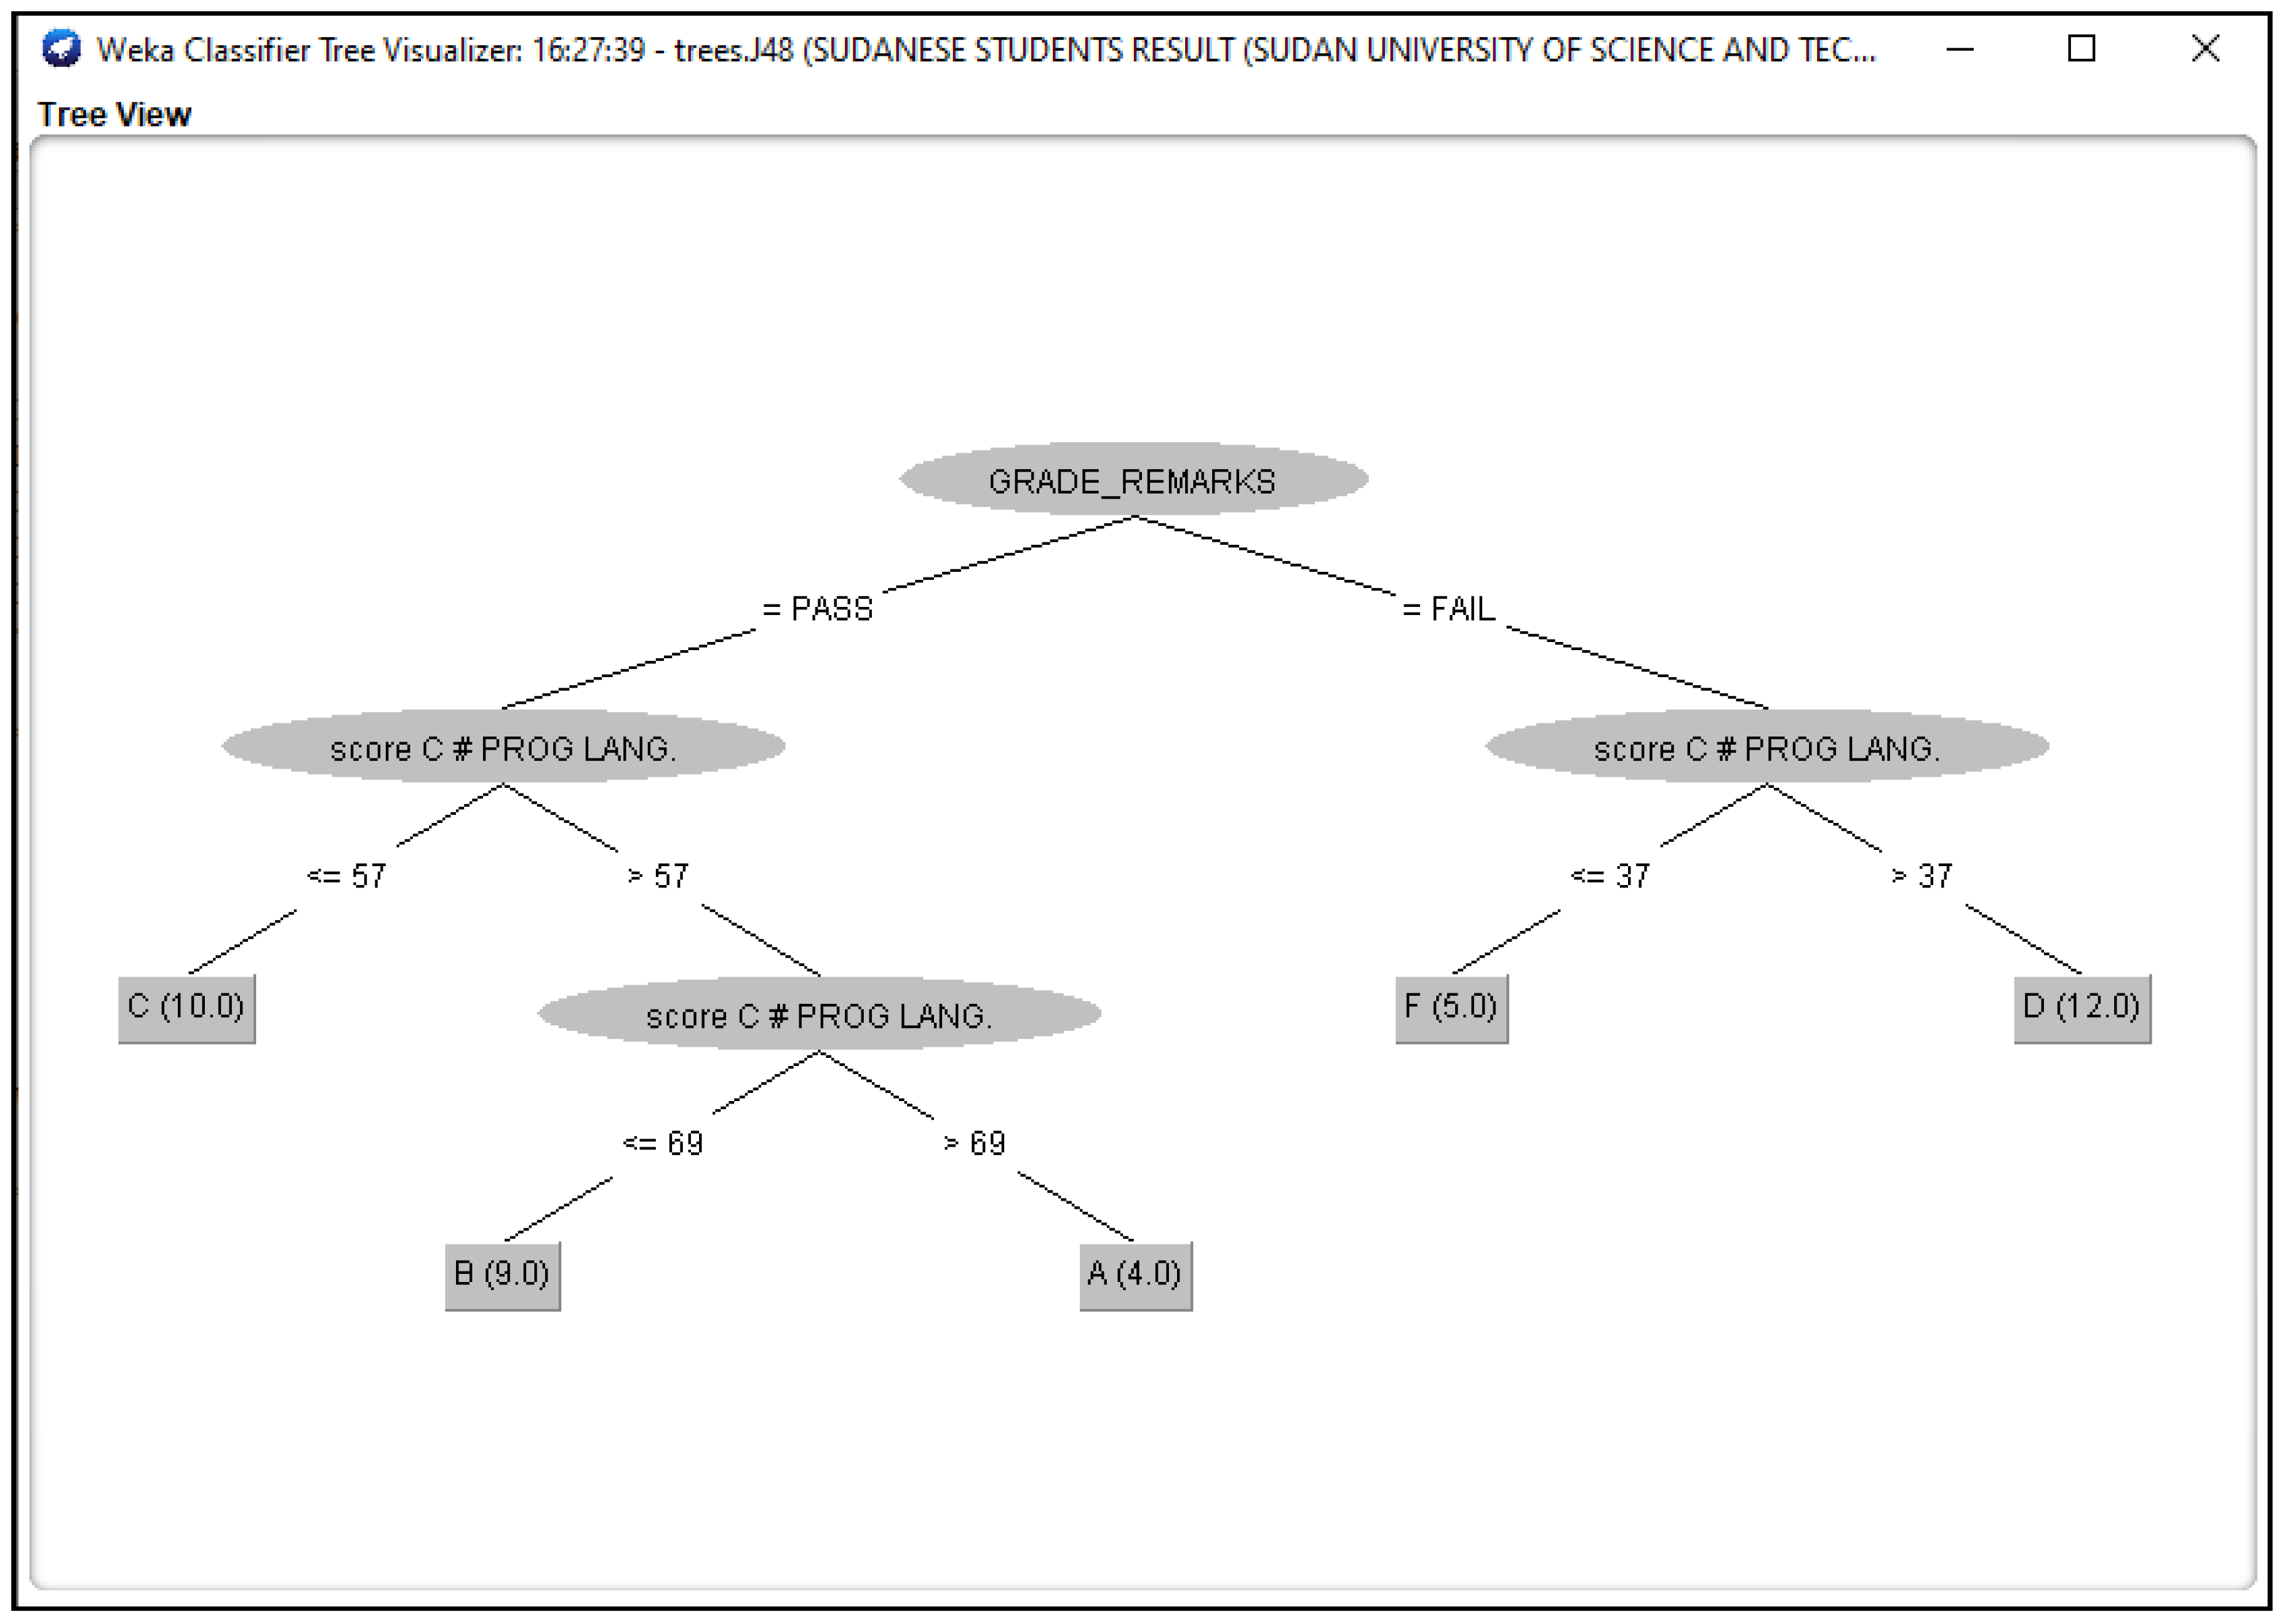
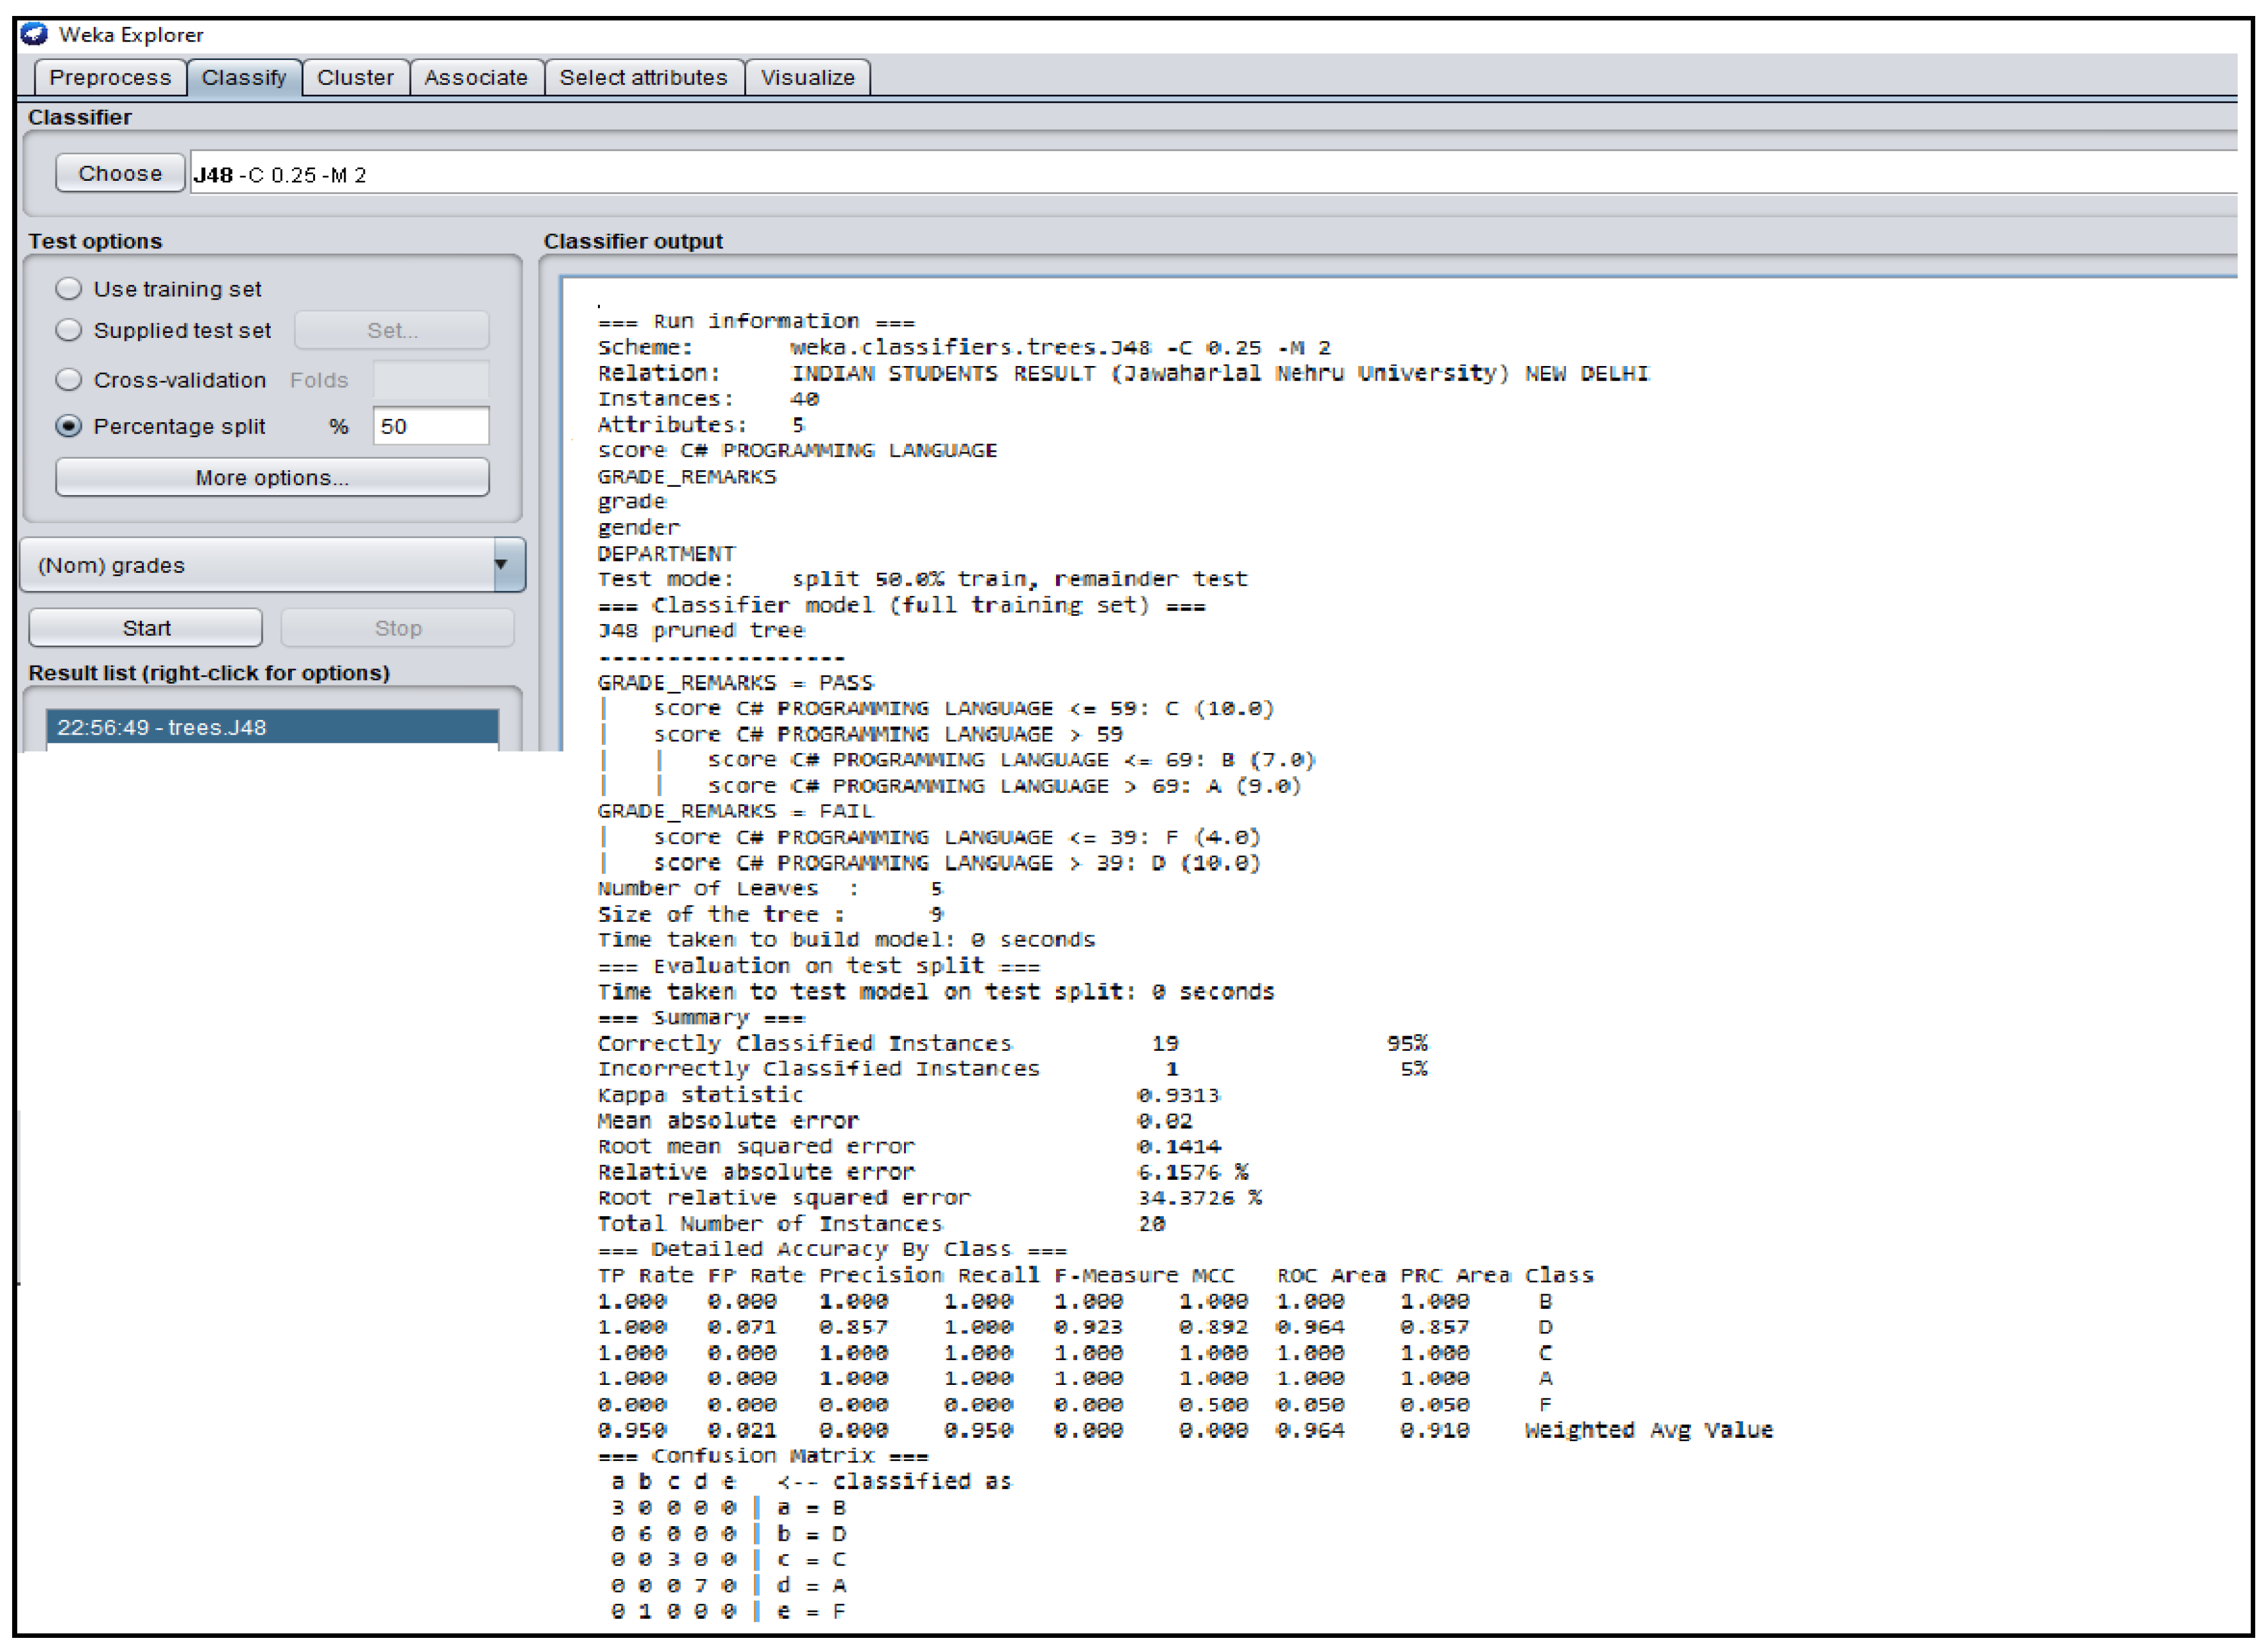
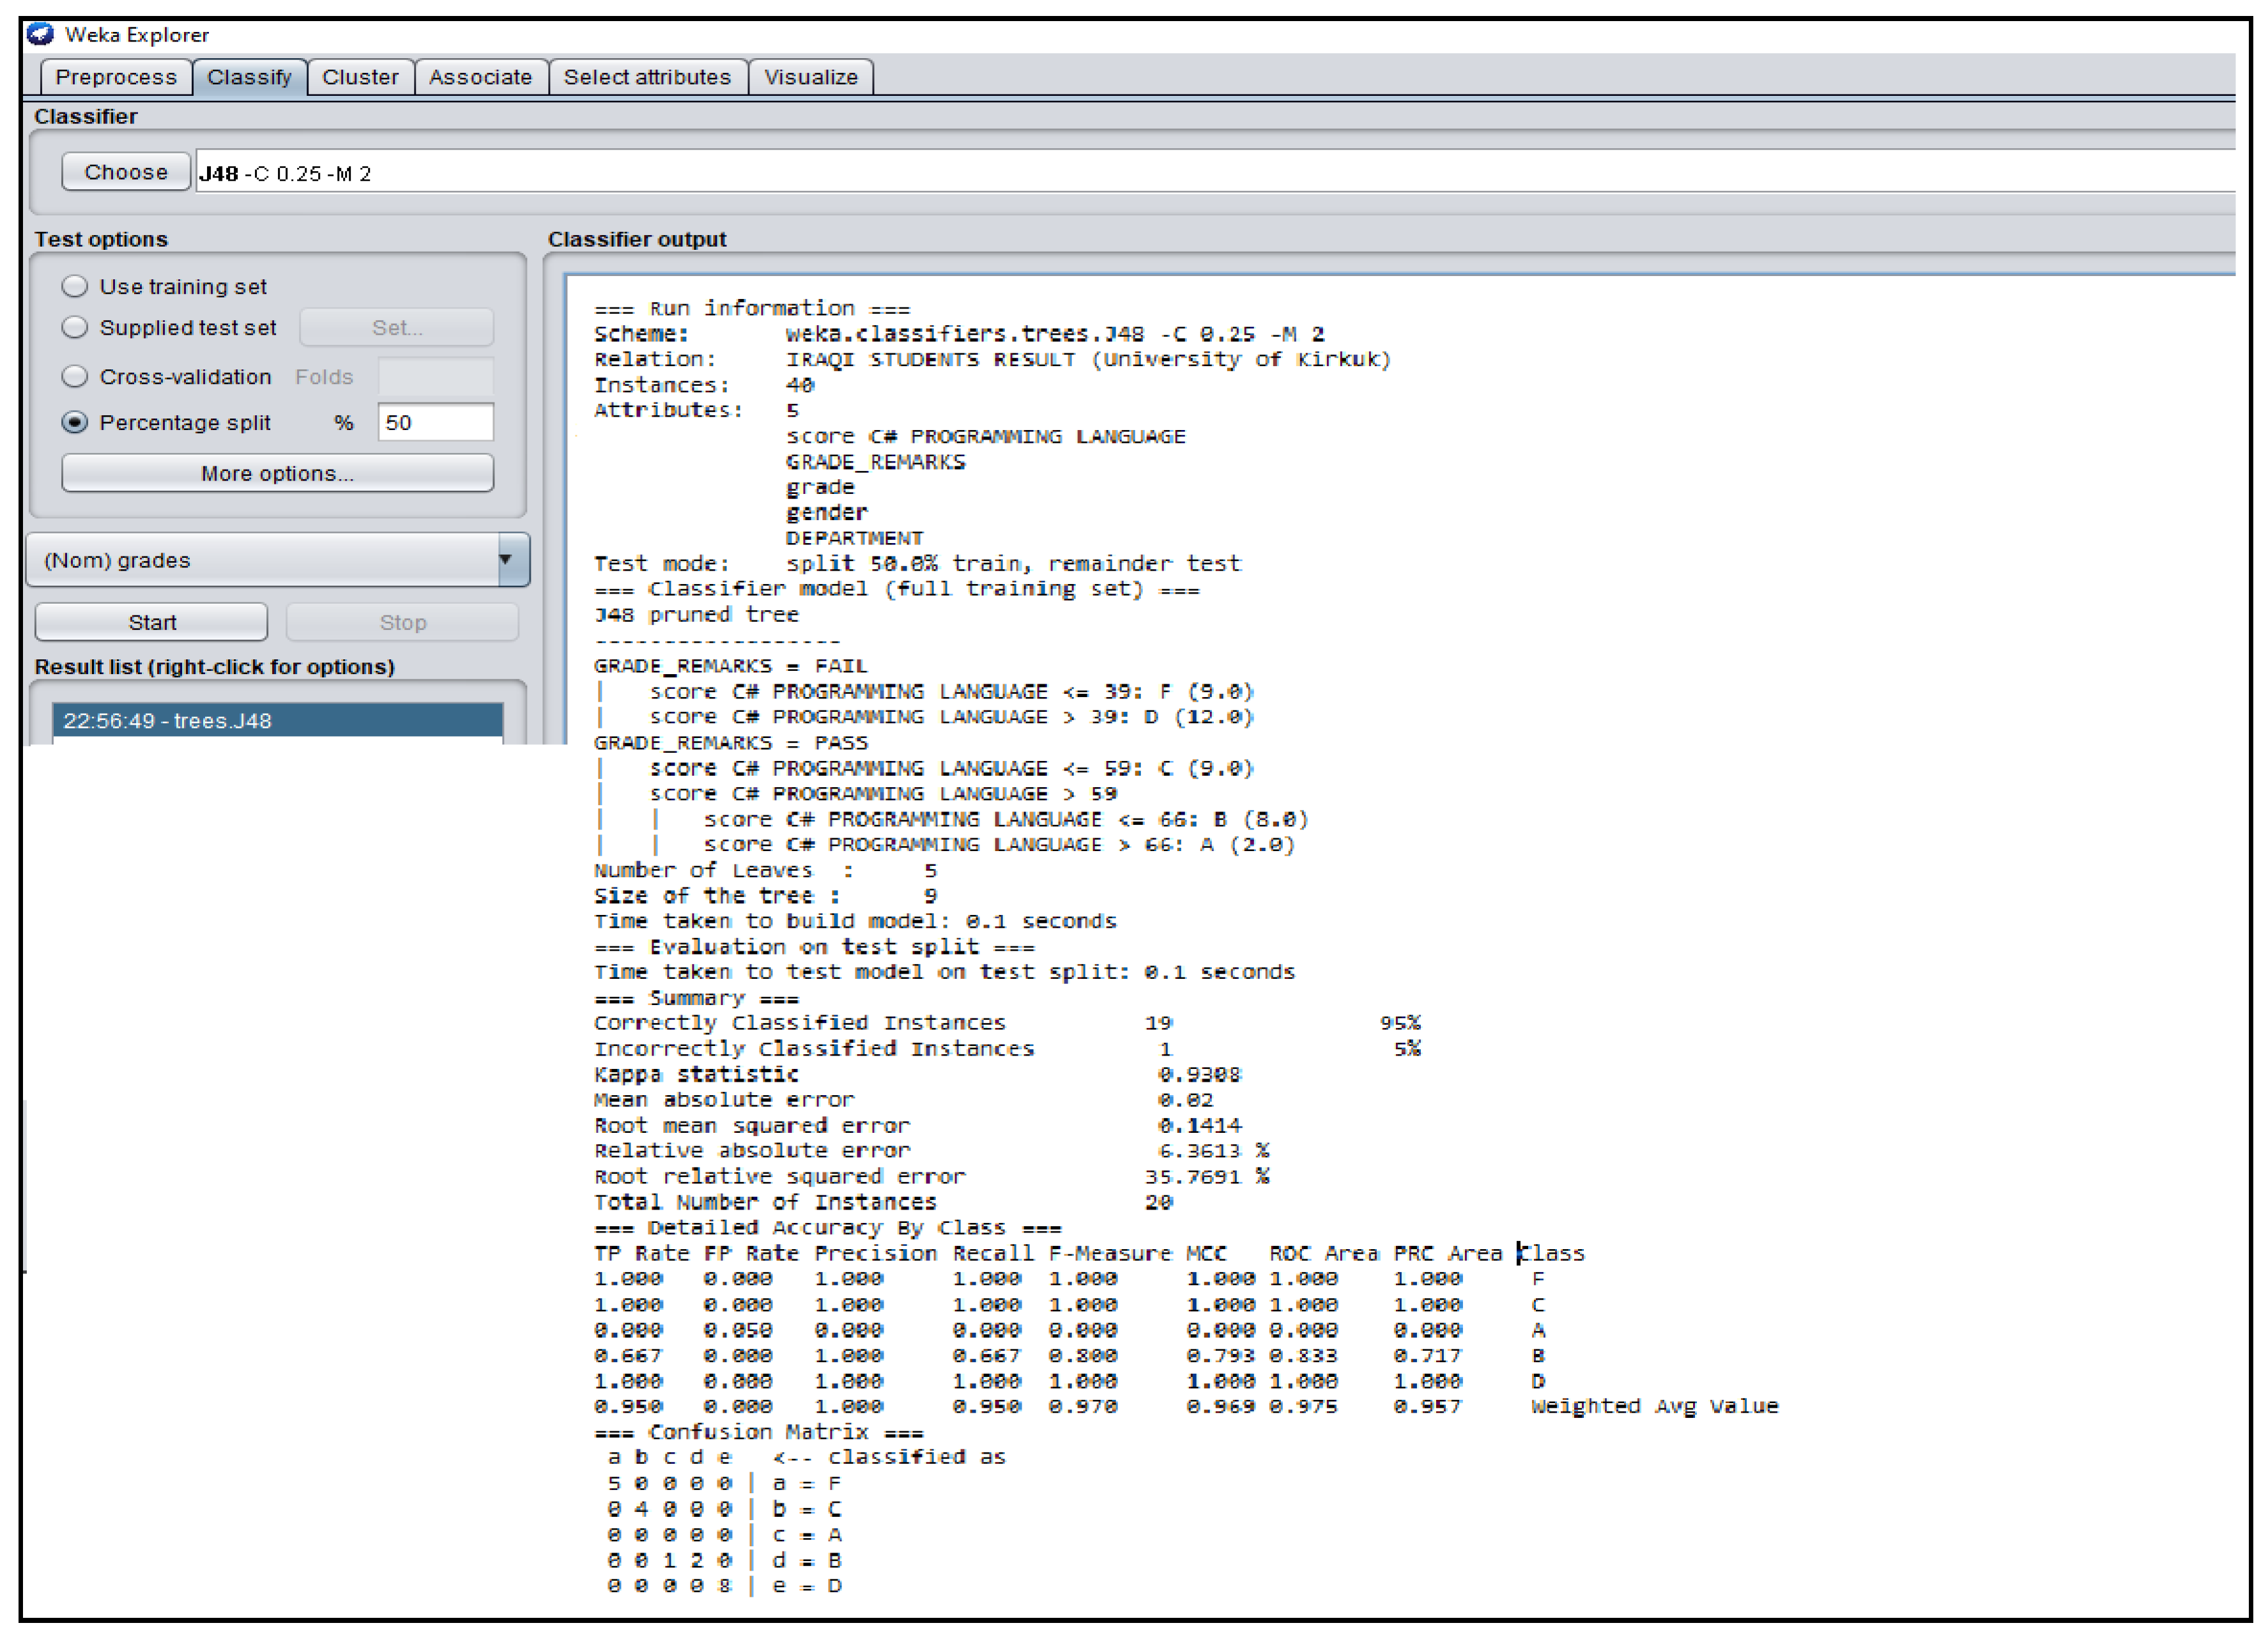
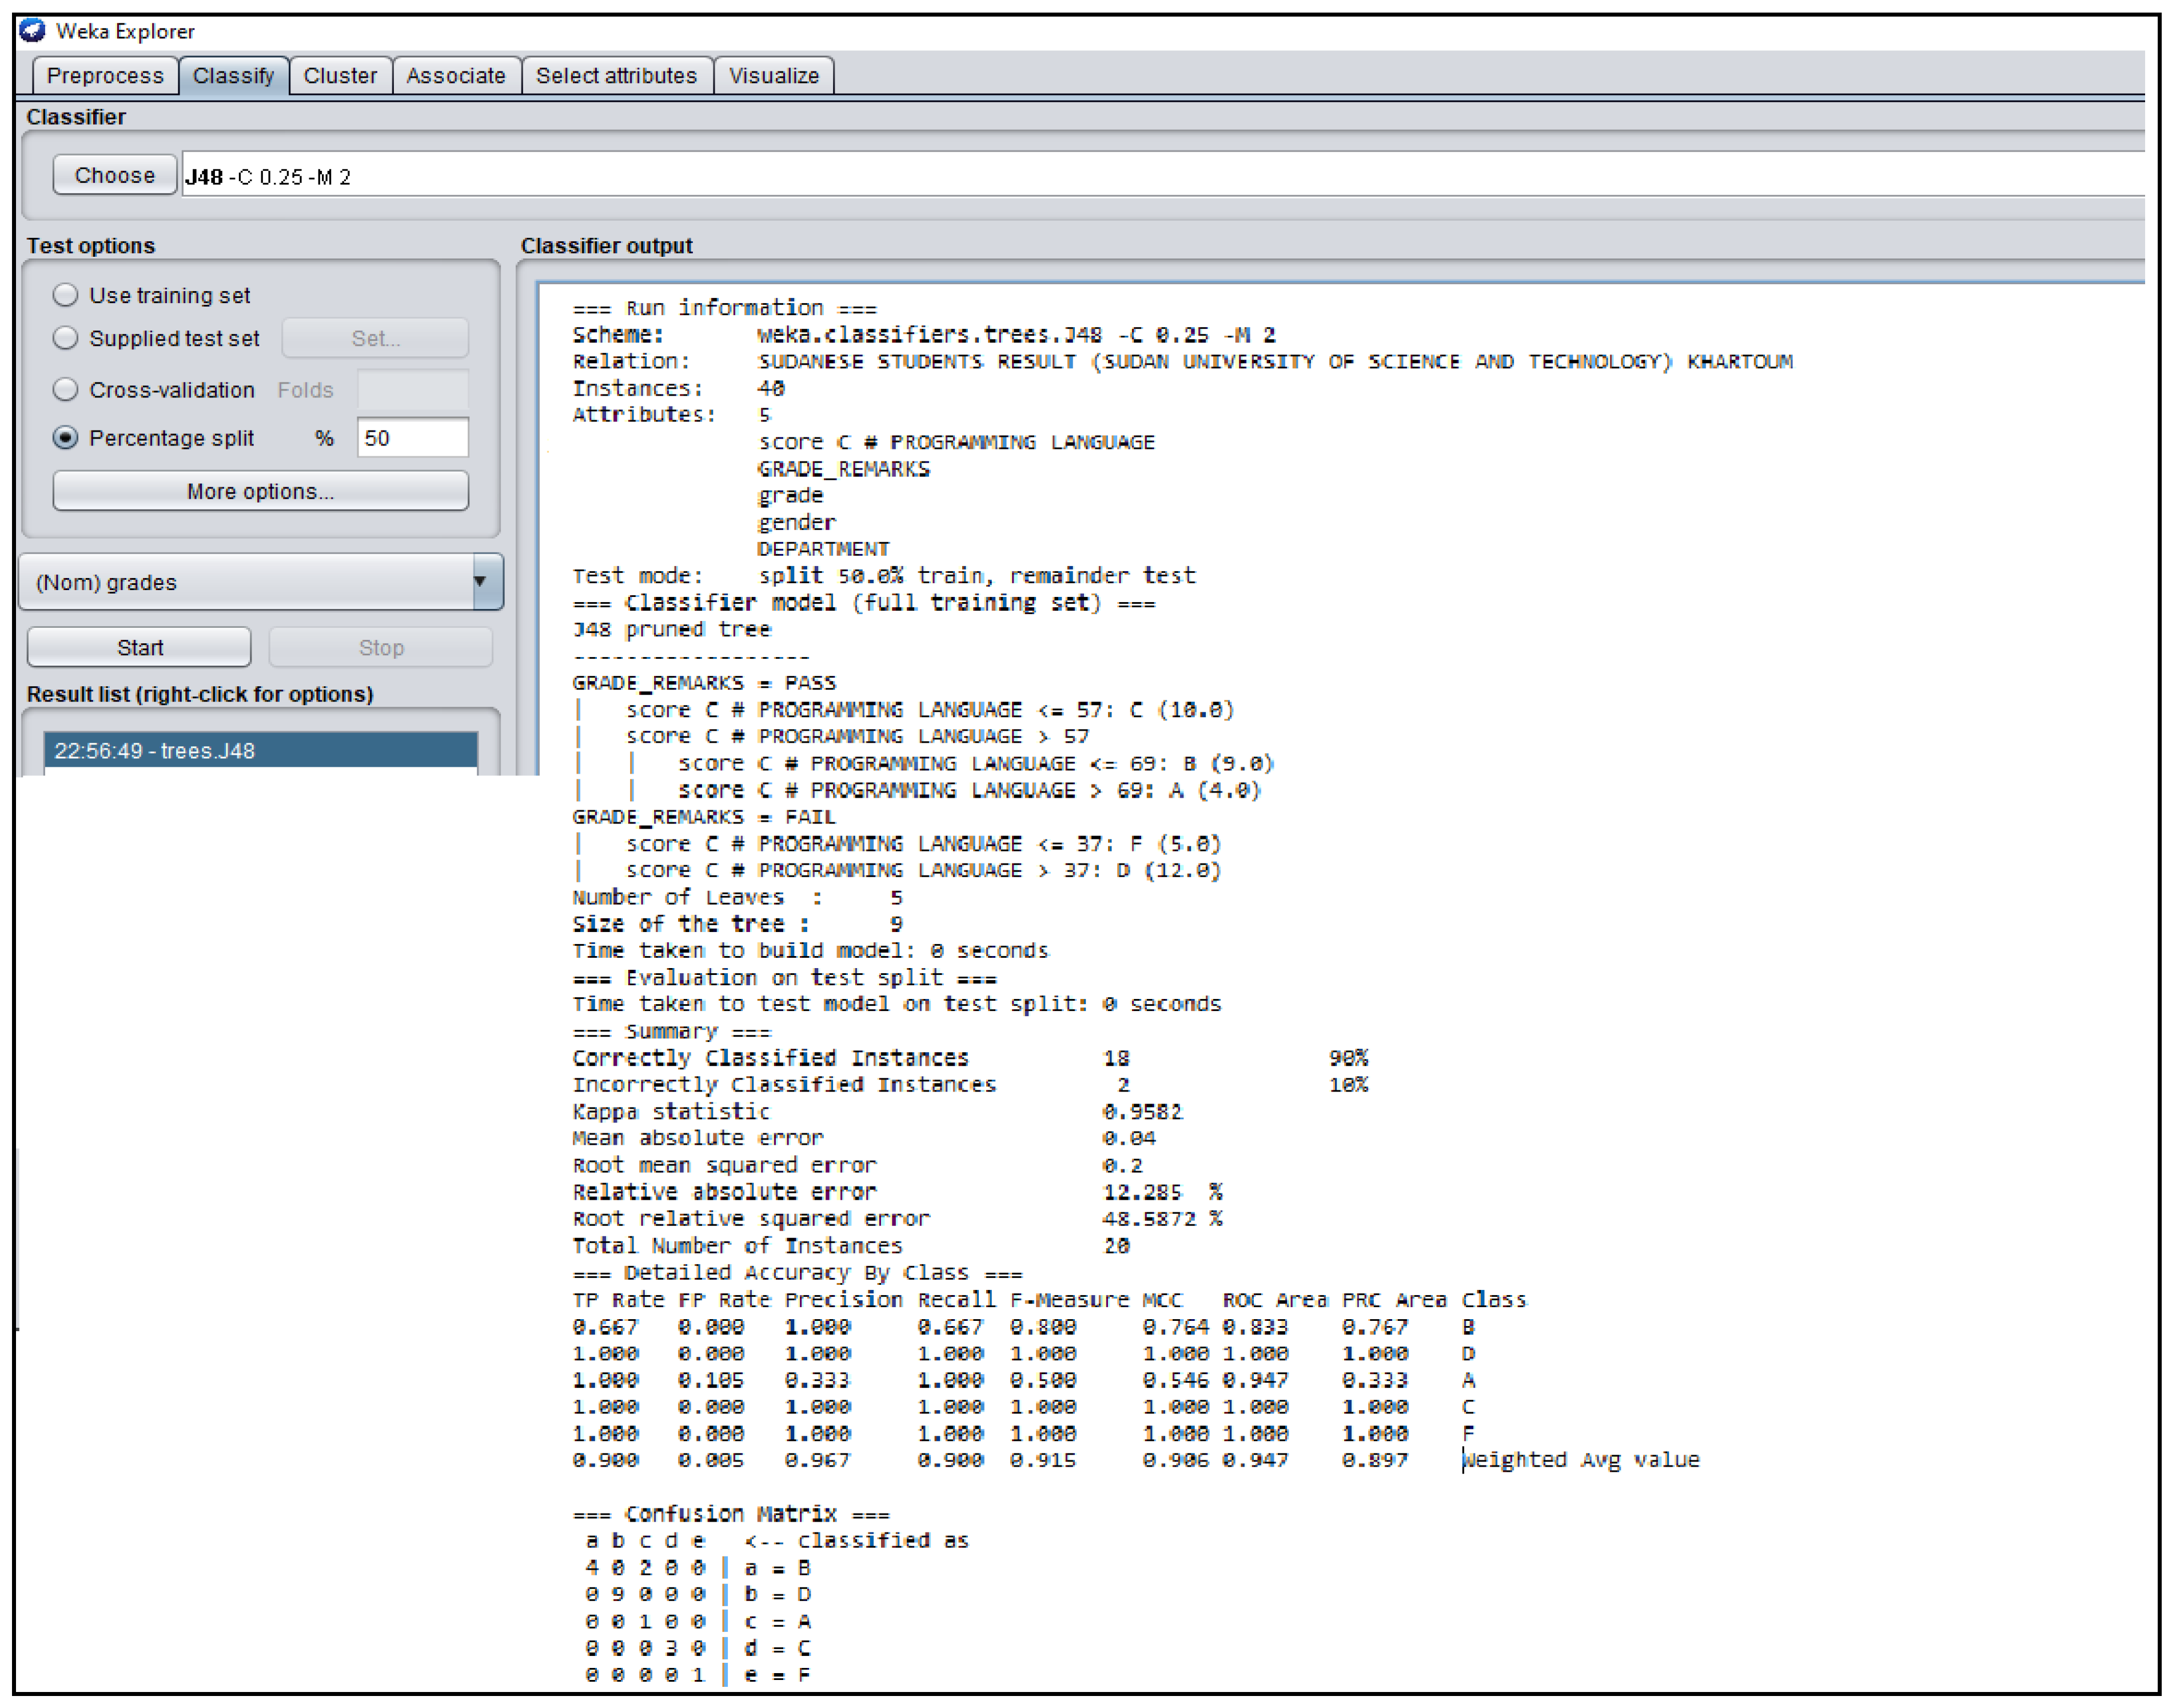
3.3. Outcomes of J48 Decision Tree Generated from Students’ Dataset Analysis

This section shows the J48 decision trees generated from the students’ academic result imported in WEKA environment platform for the analysis. See Figure 3, Figure 4, Figure 5, Figure 6 and Figure 7. The Grade_Remarks Attribute Platform for Students’ dataset is shown in Appendix A of this research.

4. Results and Discussion

The results for the analysis, based on the Kappa statistical values, mean that absolute error, recall, Precision, and F-Measure obtained from the five universities can be computed in tabular form. Table 1 shows the values obtained from the student’s dataset analysis. The Kappa interpretation obtained revealed a range of 0.9070–0.9582 which perfectly agrees with the general values for most analysis.

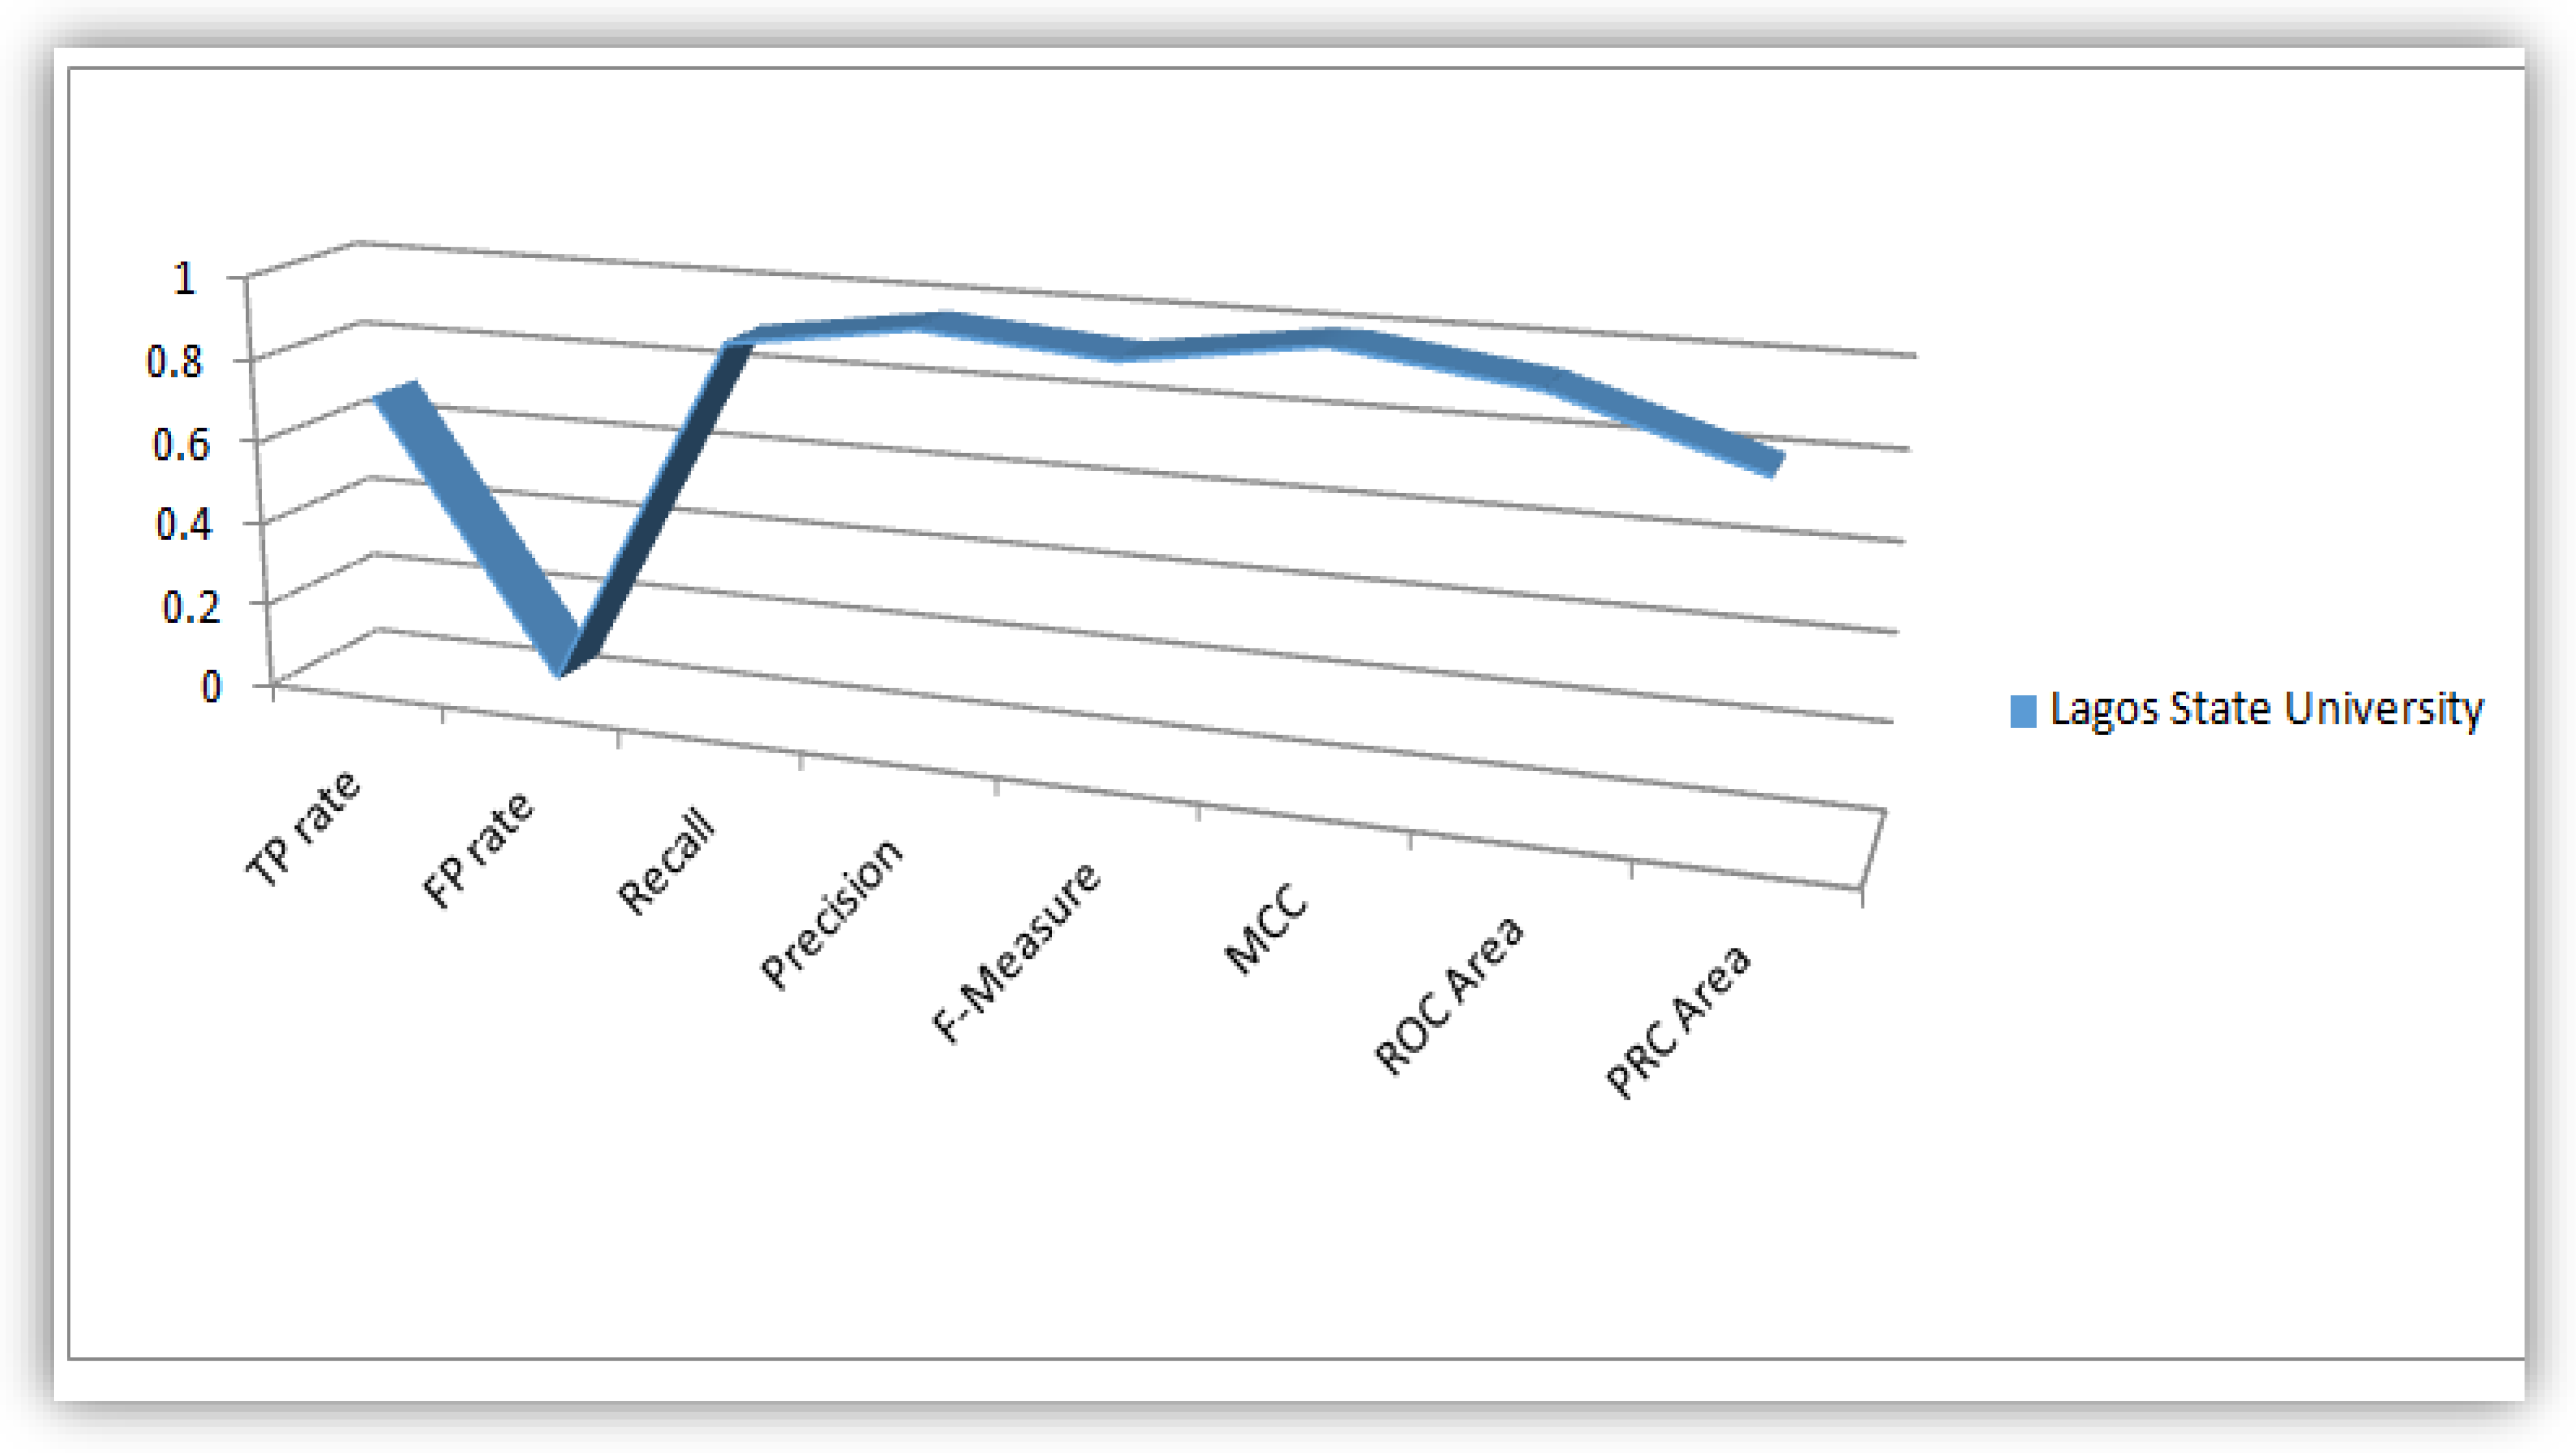
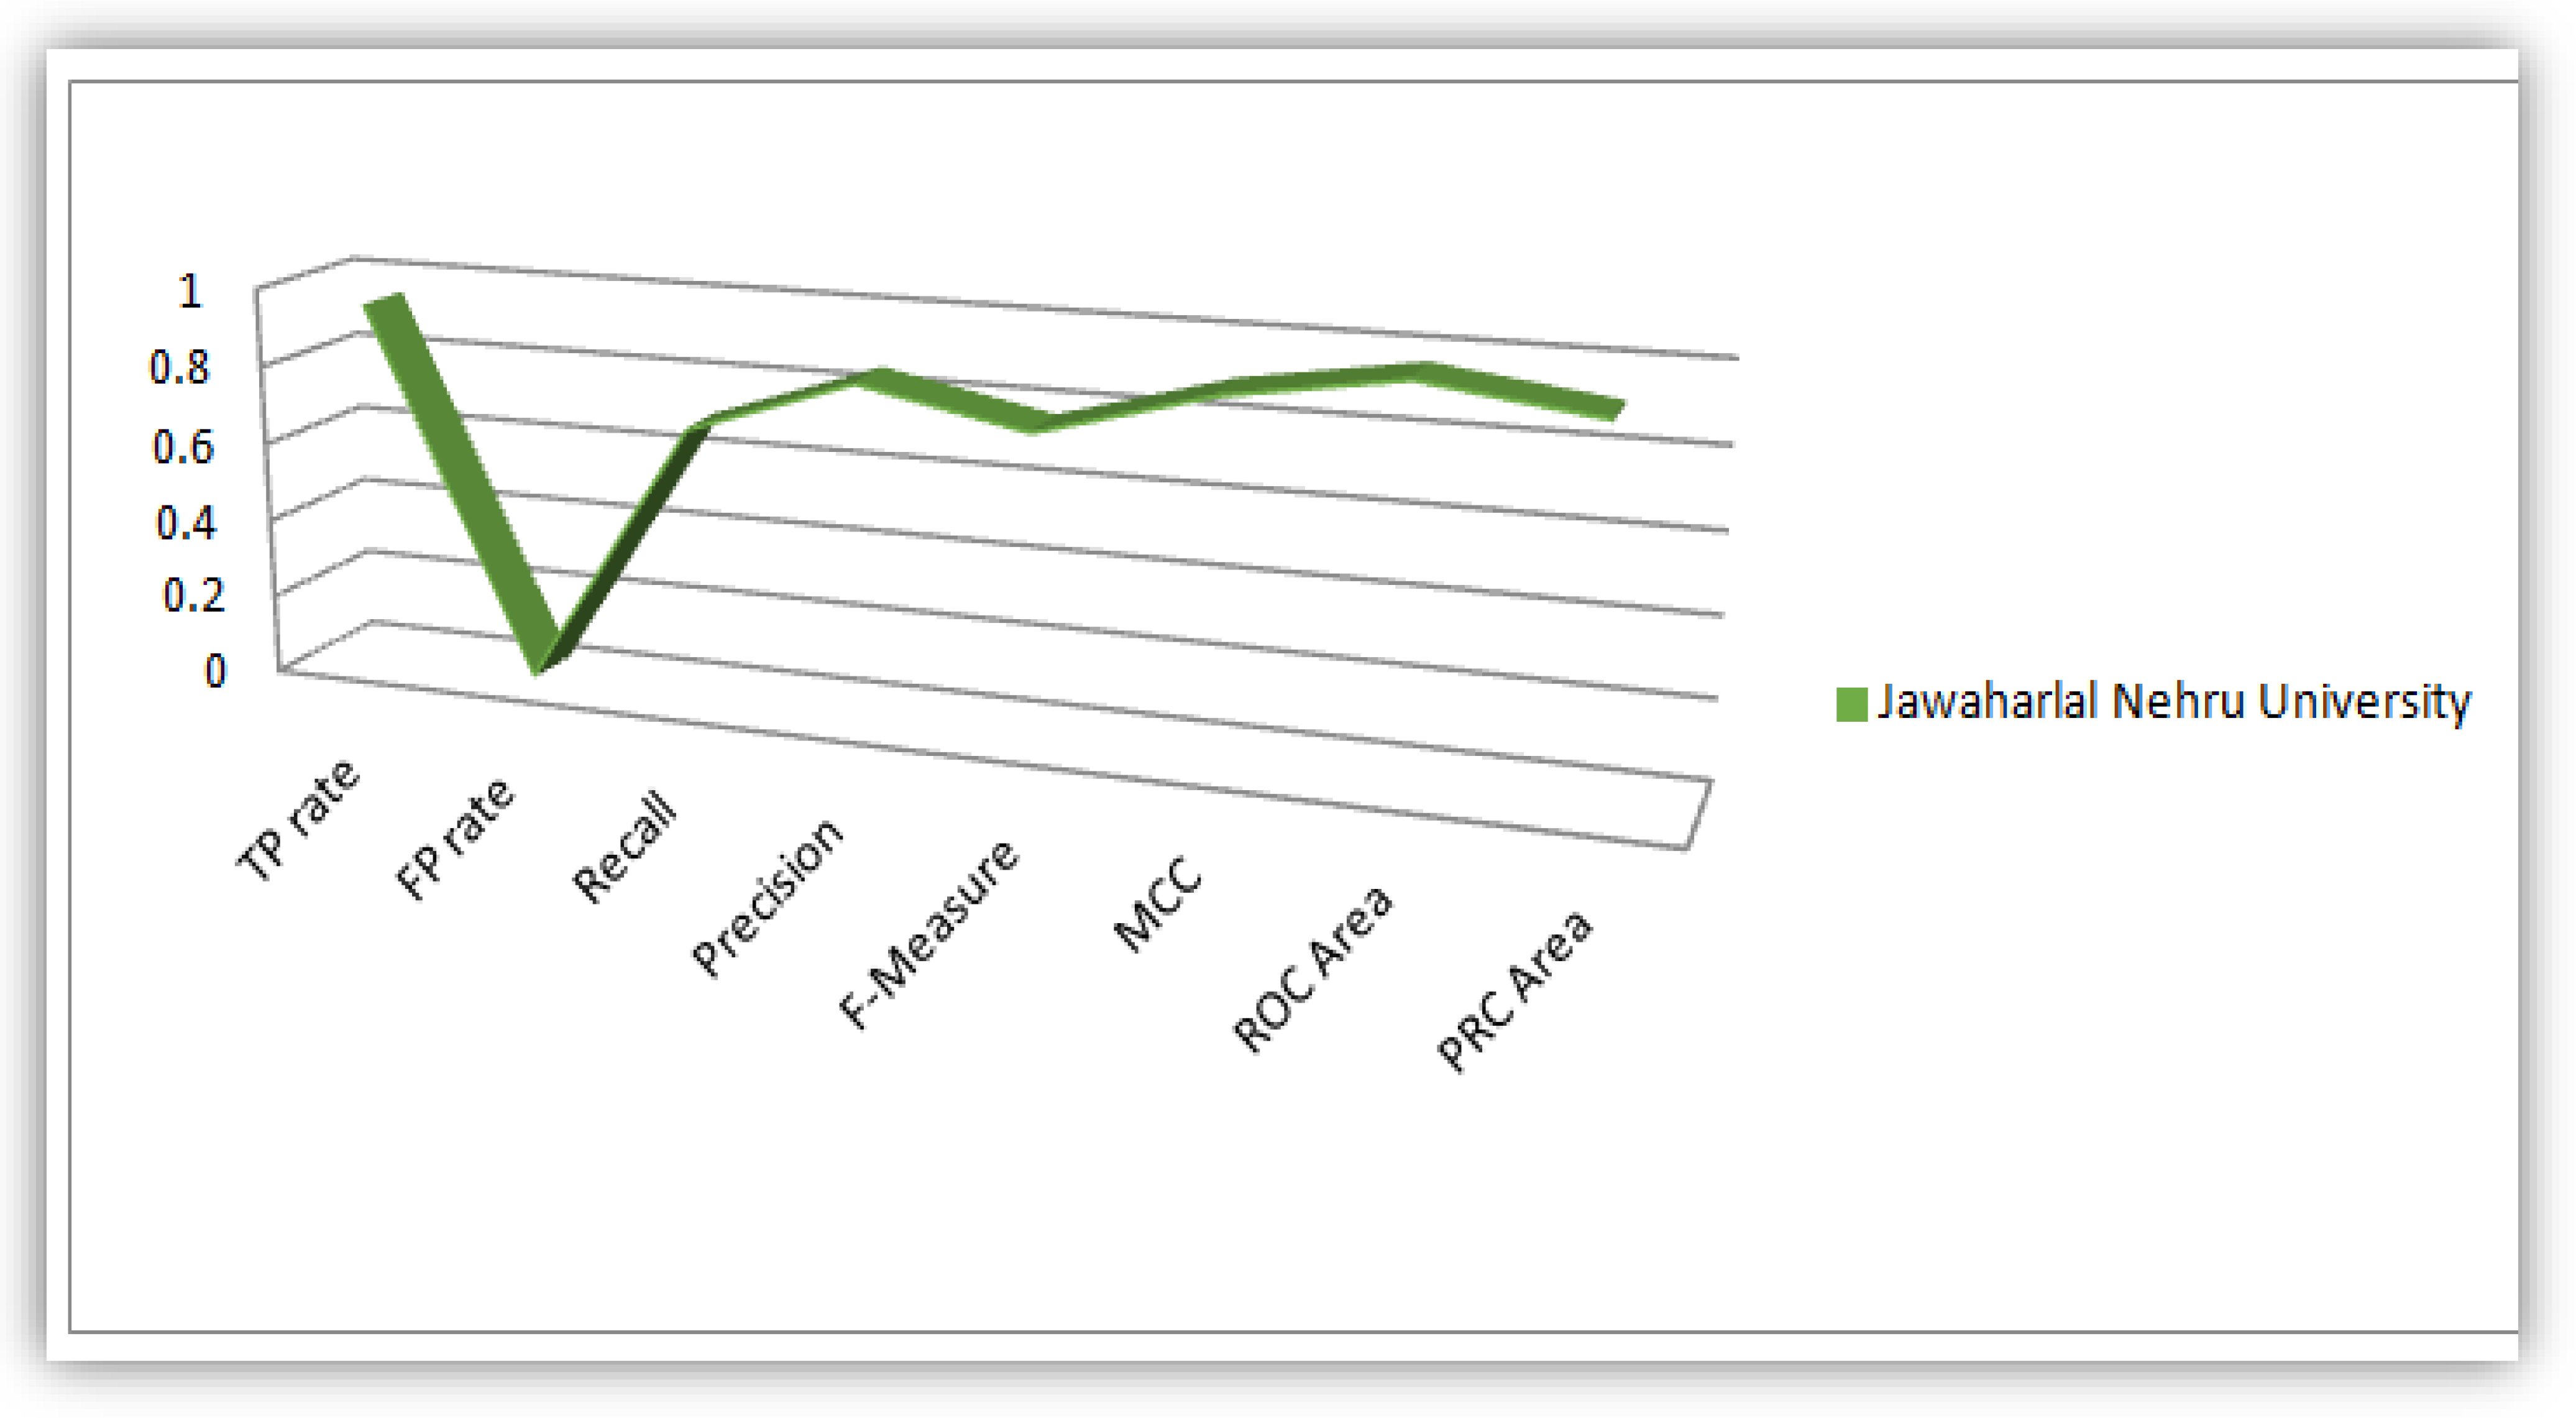
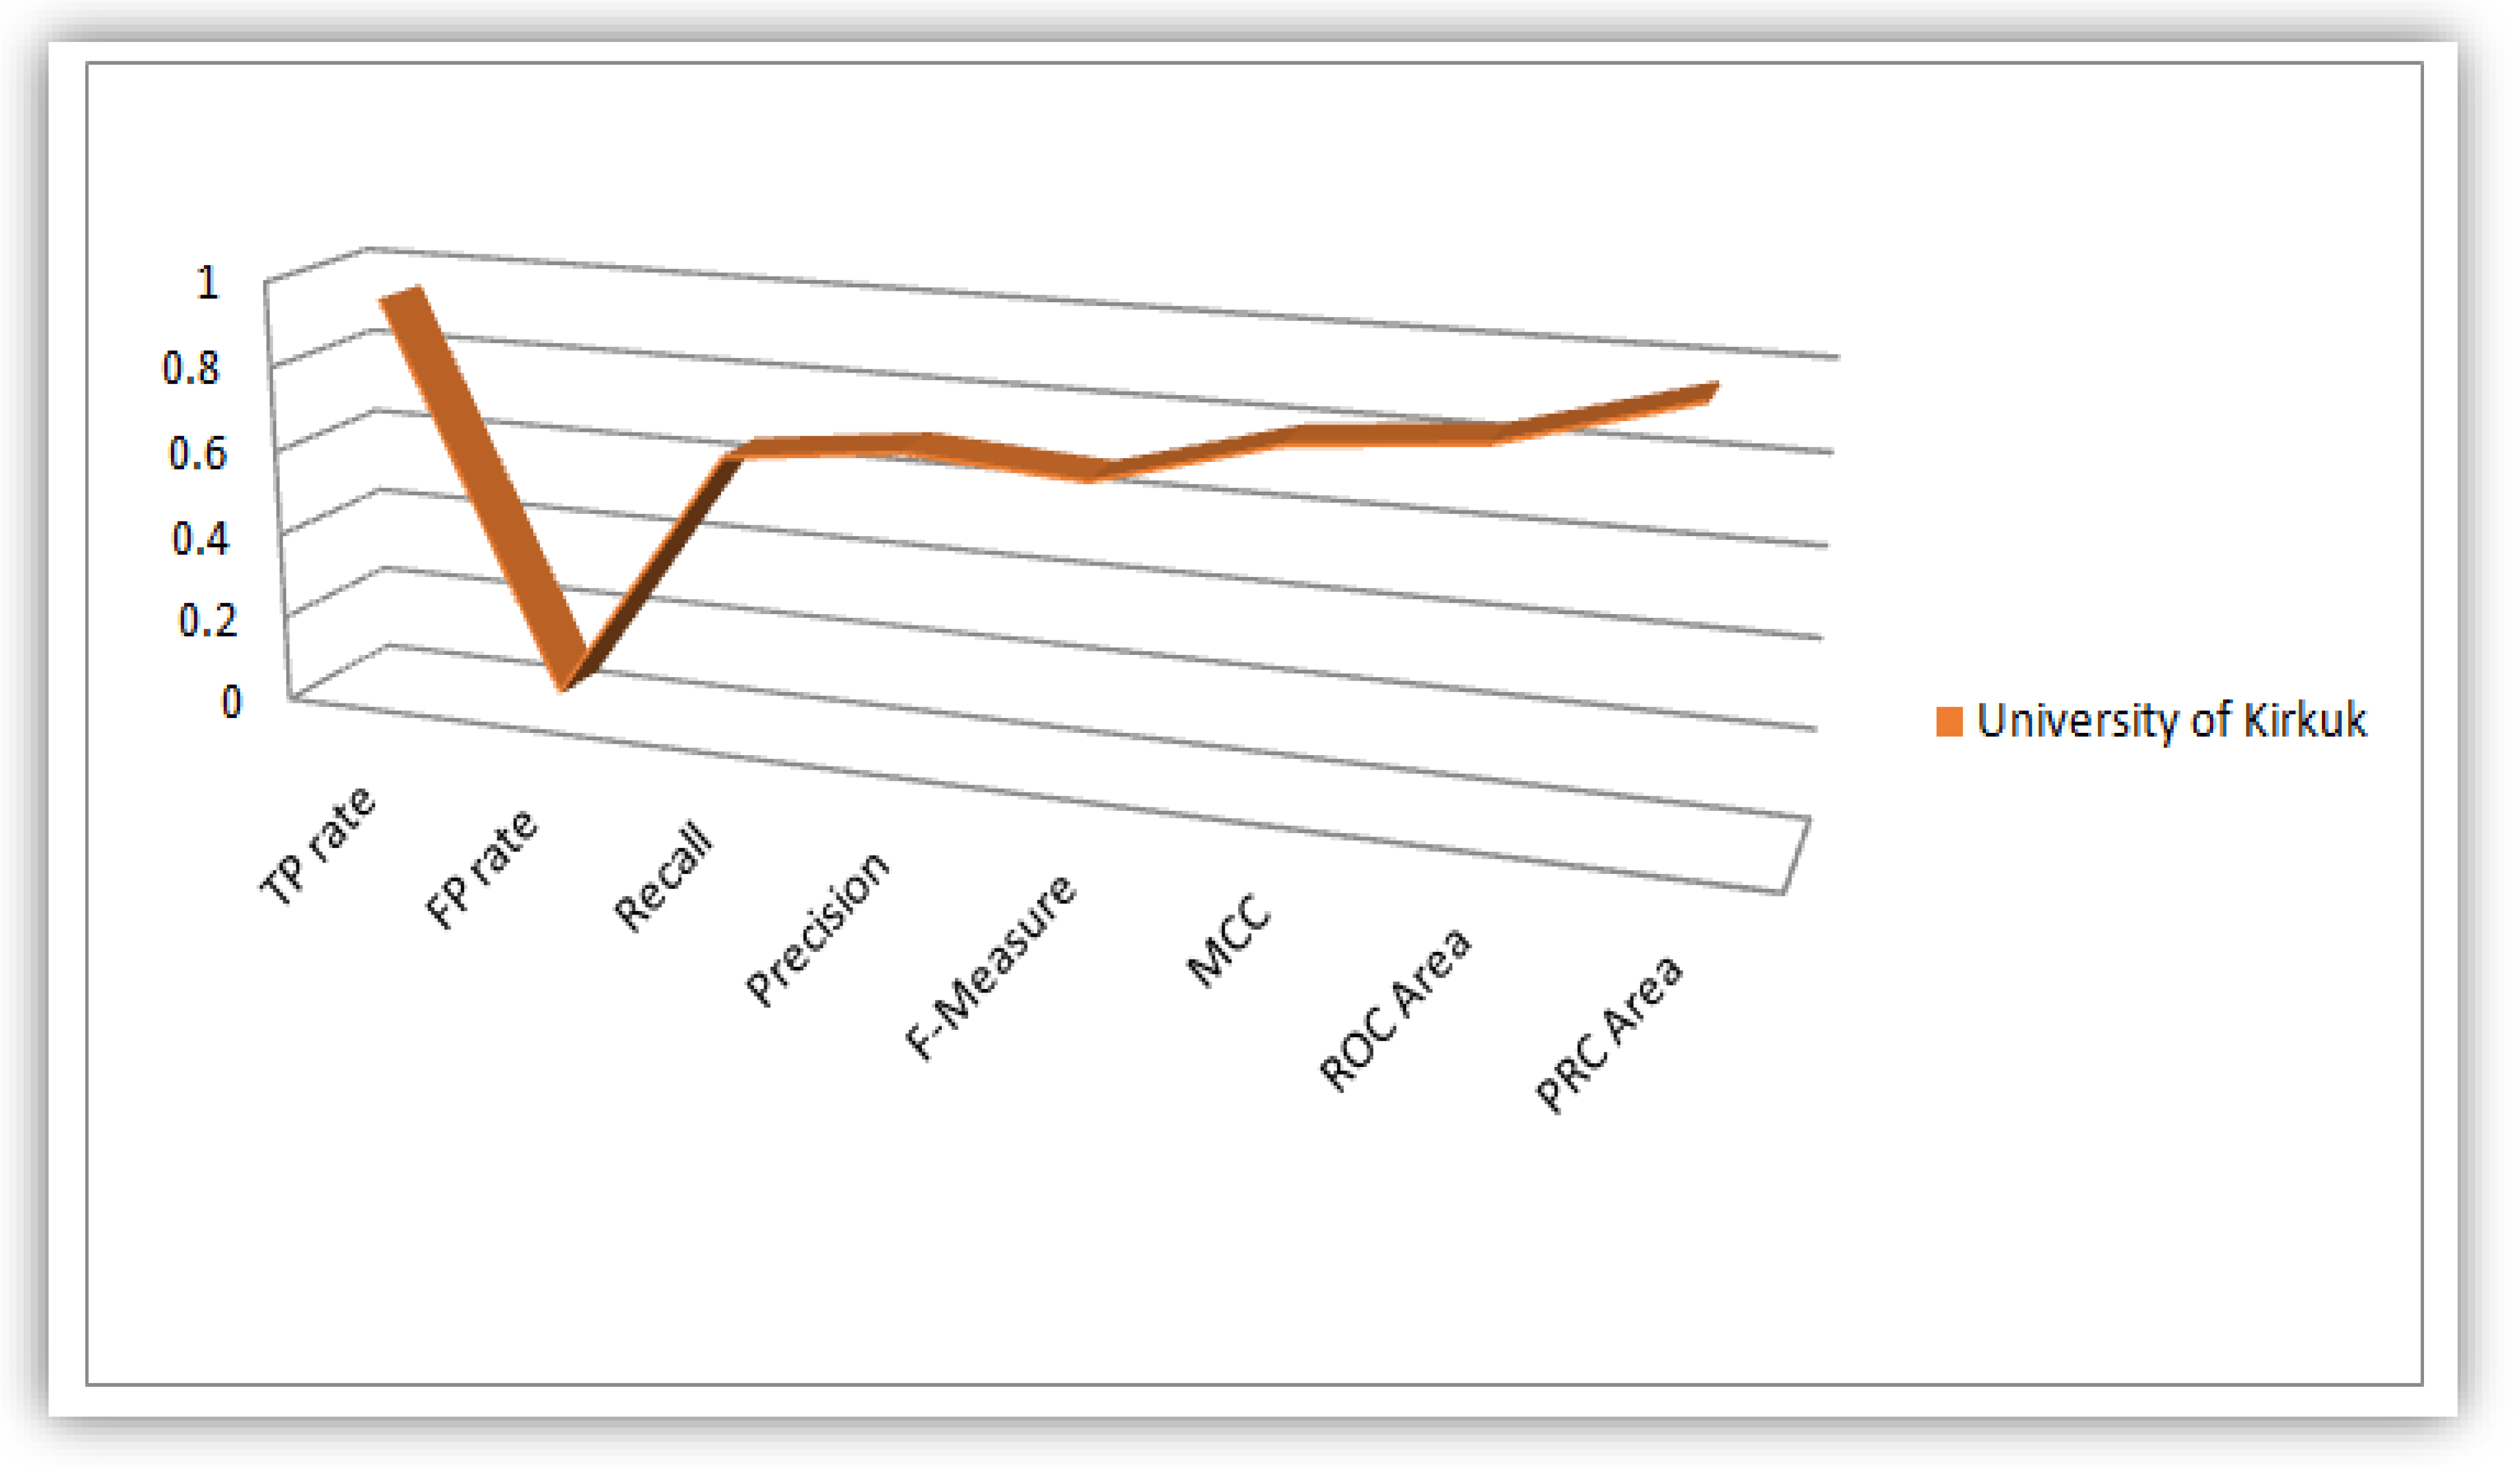
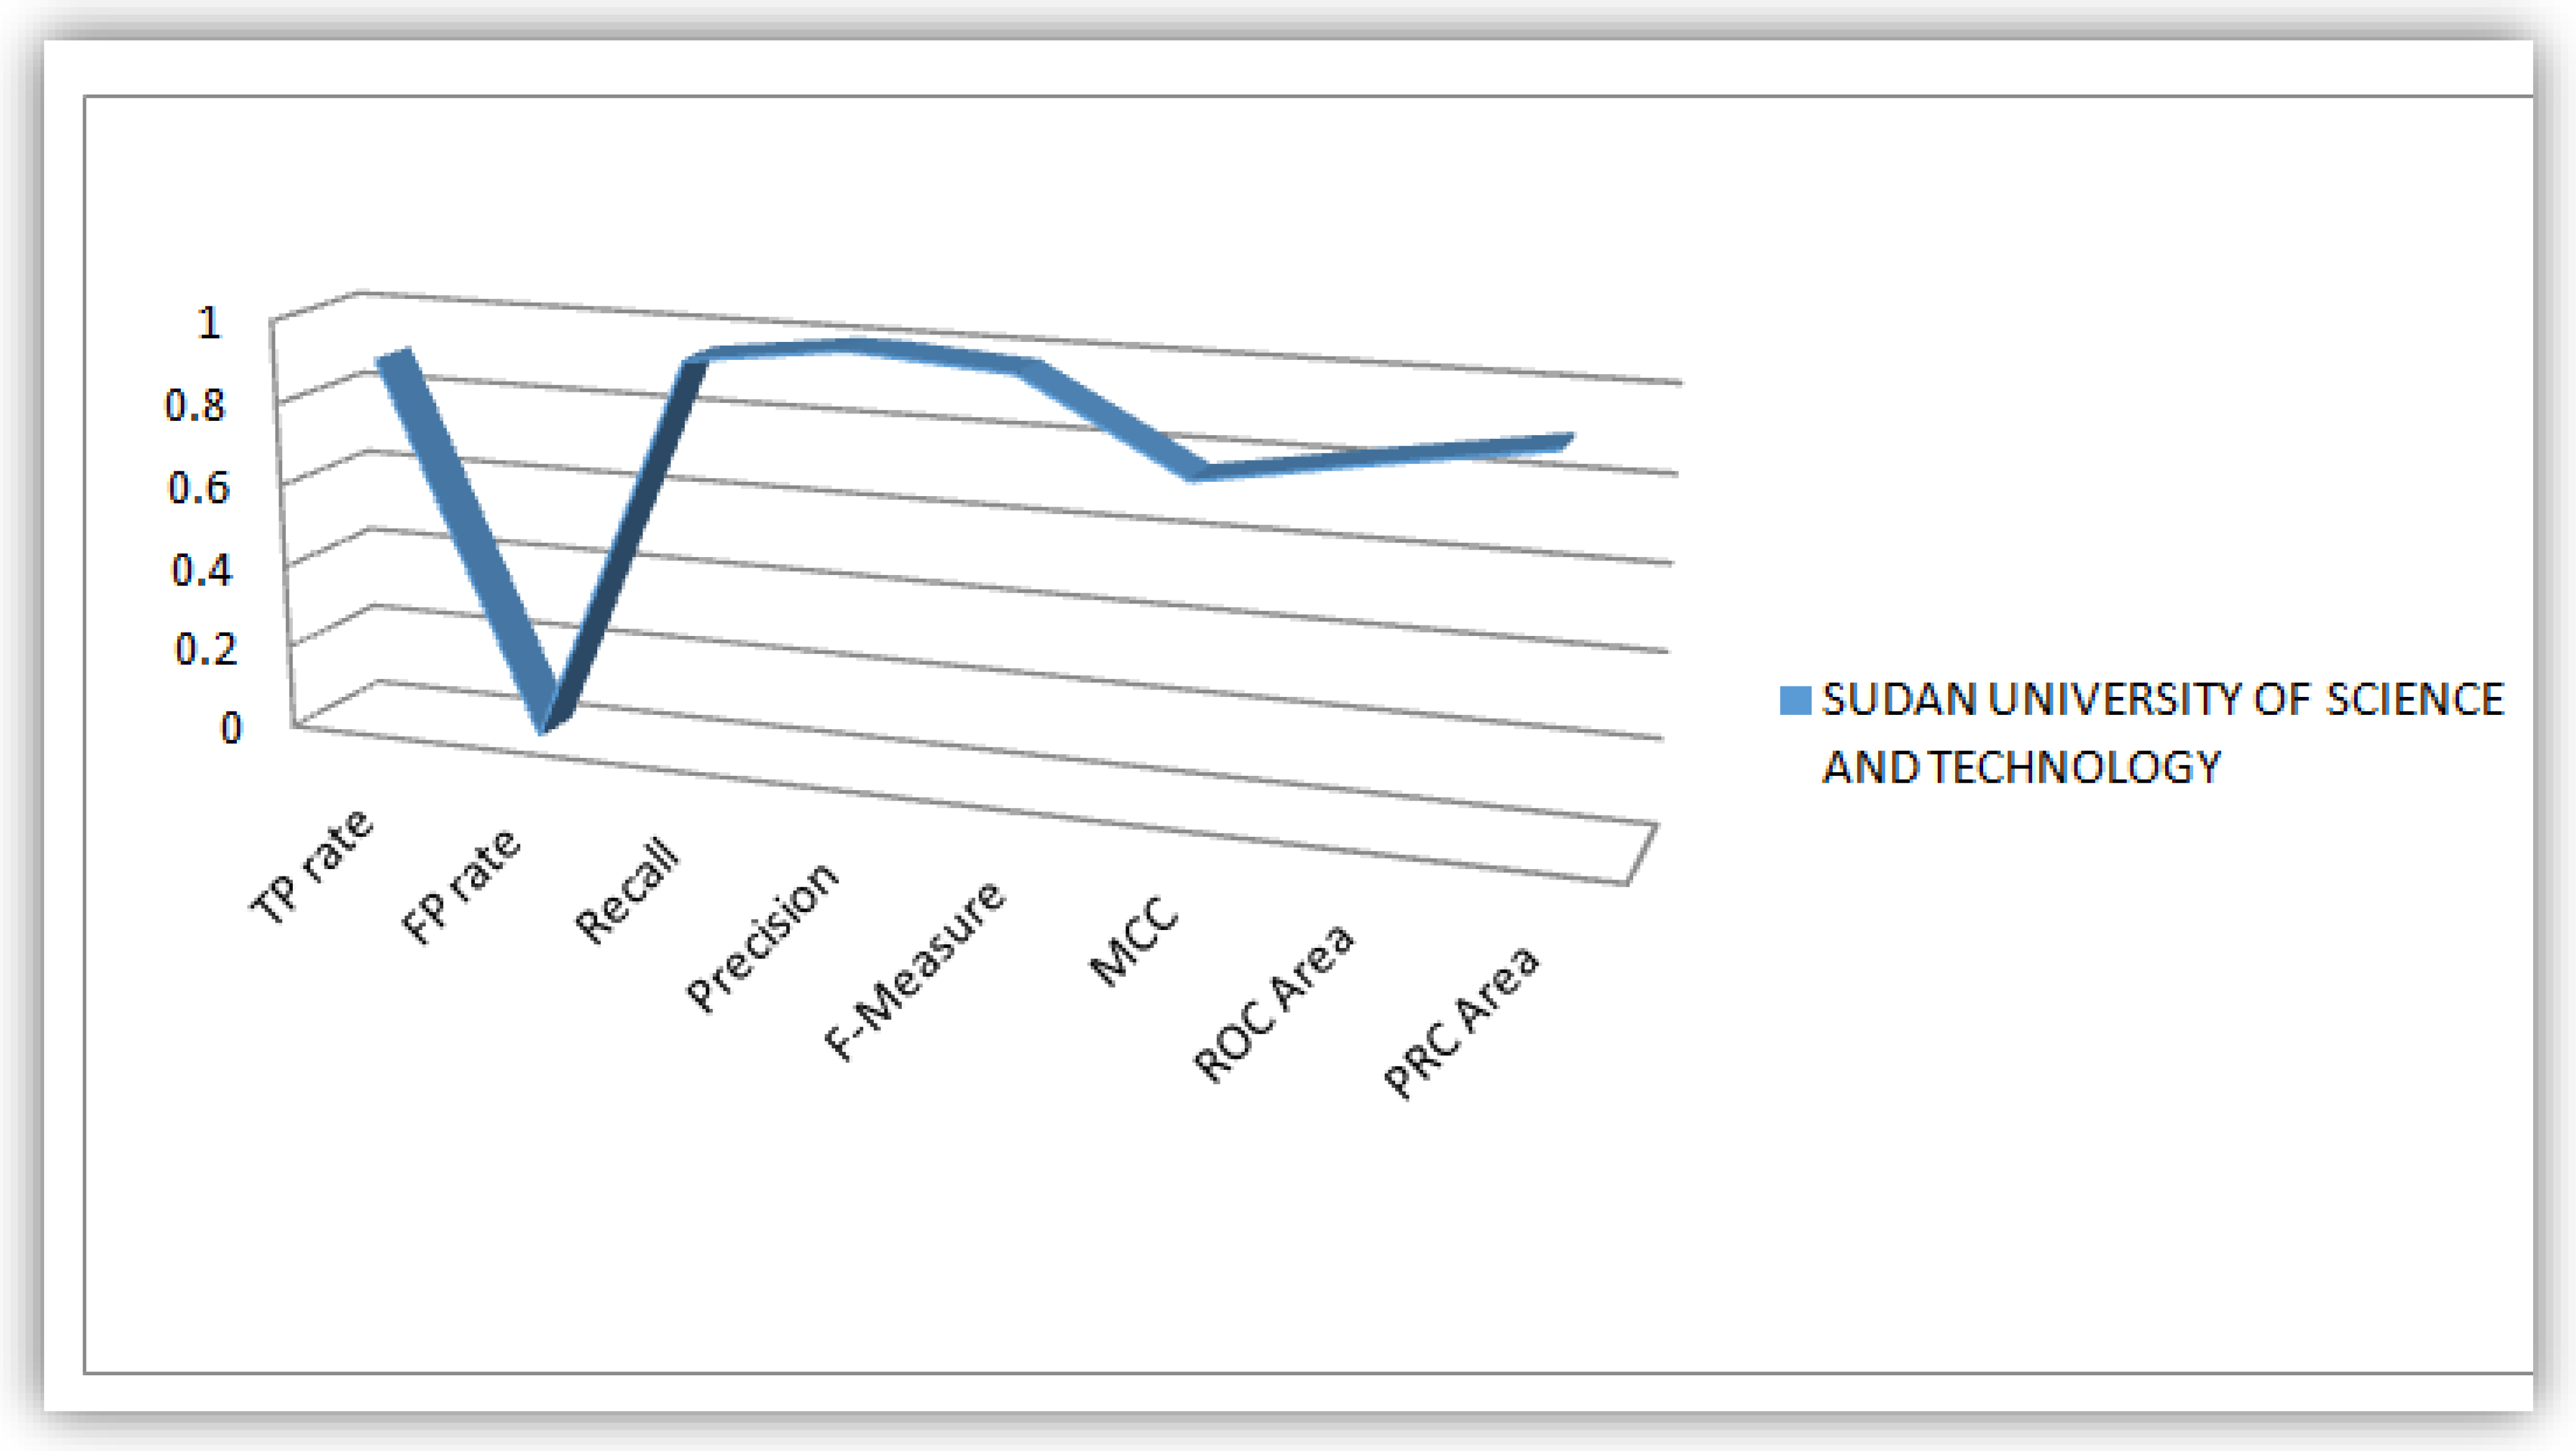
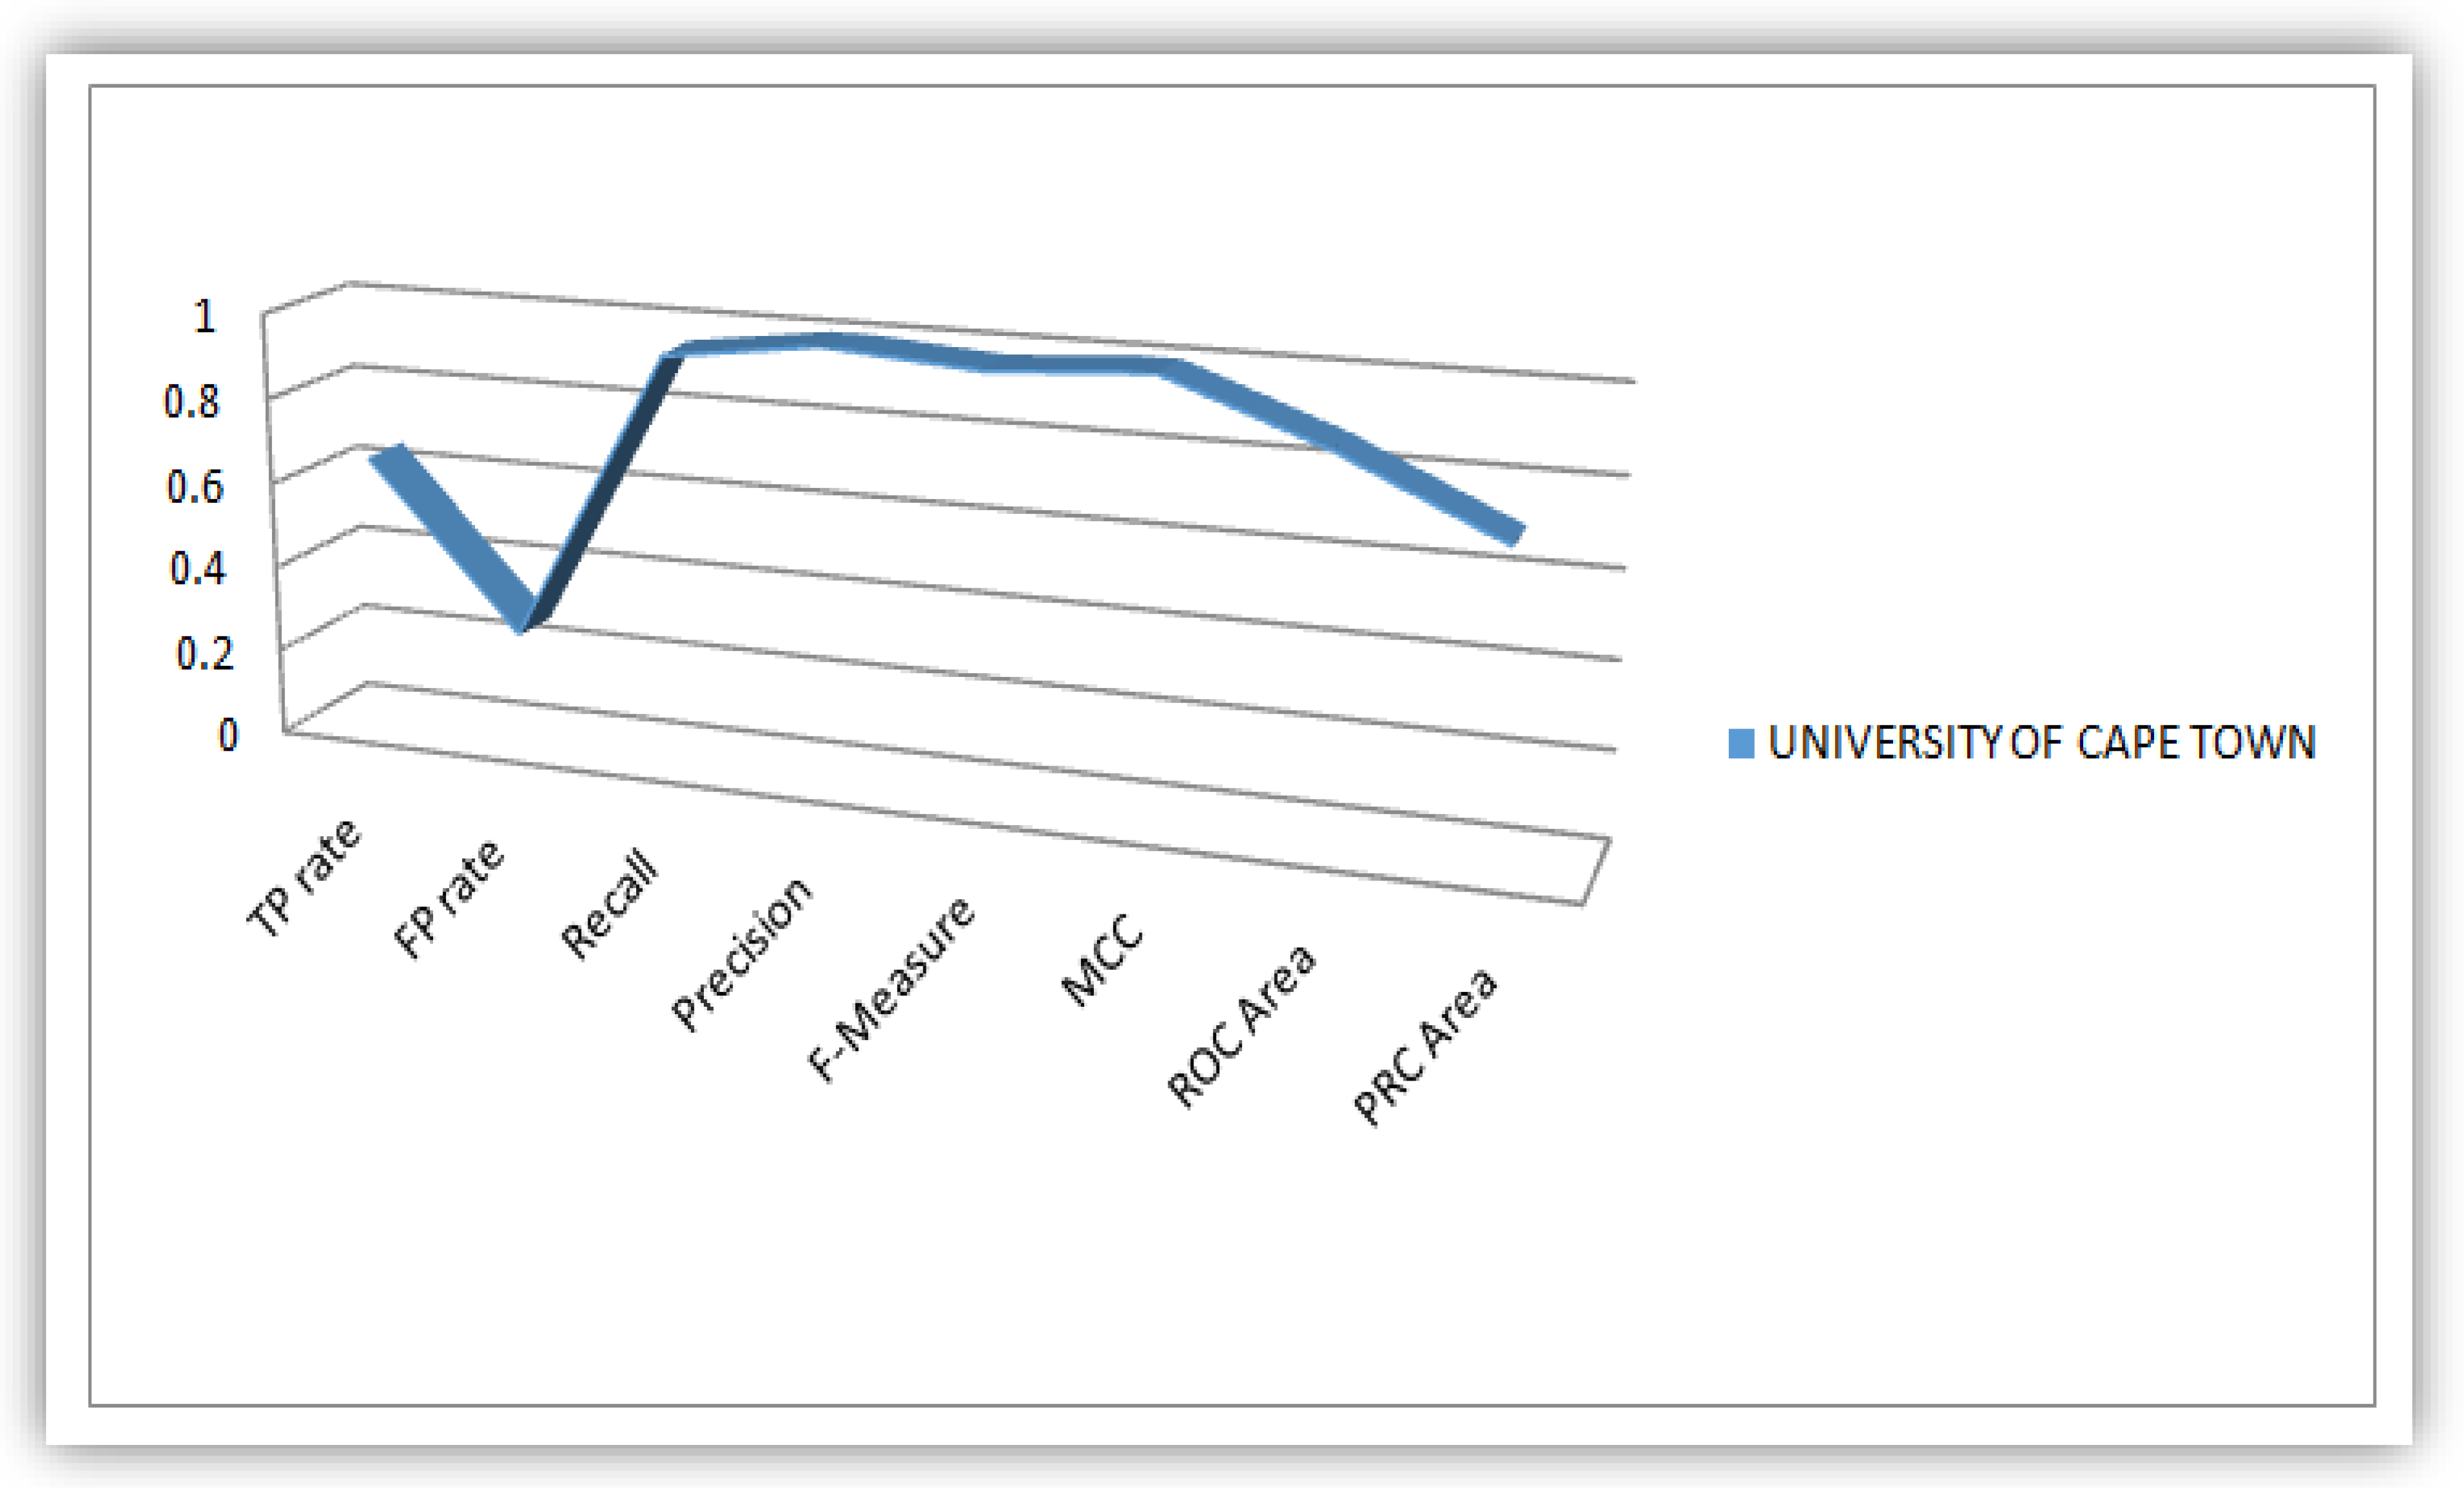
4.1. Plots of Evaluation Parameters from the Analysis Conducted on the Students’ Dataset

The parameters (TP Rate, FP Rate, Precision, Recall, F-Measure, MCC, ROC-Area and PRC-Area) obtained in this research work based on detail accuracy class analysis revealed from WEKA, we plotted flow lines that illustrate these parameters for the purpose of obtaining knowledgeable patterns to be displayed in a statistical perspective. These flow lines were illustrated based on values of the evaluation parameter derived from the WEKA analysis conducted on the five universities considered as case study in this work. Figure 8, Figure 9, Figure 10, Figure 11 and Figure 12 illustrates the plots of the parameters for the five universities.

4.2. Analysis of J48 Decision Trees Generated in WEKA for the Five Universities

The Figure 3, Figure 4, Figure 5, Figure 6 and Figure 7 shown in this research study illustrates the J48 decision trees generated in WEKA for the five universities. In this section, we provided a detailed explanation of the J48 tree generated in the Section 3.3 of this work. The J48 decision tree classifier shown in Figure 3 illustrates that 11 students had grade A and passed with scores greater than 69 marks; 6 students had grade B, passed with scores greater than 59 marks and less than equal to 69 marks; 7 students had grade C and passed with scores less than or equal to 59 marks; 7 students had grade D and failed with scores greater than 39 marks; and 9 students had grade F with scores less than or equal to 39 marks. In general, a total of twenty-four students were in the category of those who passed while total of sixteen students were in the category of those failed. The J48 decision tree classifier shown in Figure 4 illustrates that 9 students had grade A and passed with scores greater than 69 marks; 7 students had grade B, passed with scores greater than 59 marks and less than equal to 69 marks; 10 students had grade Cand passed with scores less than or equal to 59 marks; ten students had grade D and failed with scores greater than 39 marks; and 4 students had grade F with scores less than or equal to 39 marks. In general, a total of twenty-six students were in the category of those who passed while total of fourteen students were in the category of those who failed. The J48 decision tree classifier shown in Figure 5 illustrates that 2 students had grade A and passed with scores greater than 66 marks; 8 students had grade B, passed with scores greater than 59 marks and less than equal to 66 marks; 9 students had grade Cand passed with scores less than or equal to 59 marks; 12 students had grade D and failed with scores greater than 39 marks; and nine students had grade F with scores less than or equal to 39 marks. In general, a total of nineteen students were in the category of those who passed while total of 21 students were in the category of those who failed. The J48 decision tree classifier shown in Figure 6 illustrates that 13 students had grade A and passed with scores greater than 67 marks; 4 students had grade B, passed with scores greater than 59 marks and less than equal to 67 marks; 4 students had grade C and passed with scores less than or equal to 59 marks; 4 students had grade D and failed with scores greater than 37 marks; and 15 students had grade F with scores less than or equal to 37 marks. In general, a total of twenty-one students were in the category of those who passed while total of 19 students were in the category of those who failed. The J48 decision tree classifier shown in Figure 7 illustrates that 4 students had grade A and passed with scores greater than 69 marks; 9 students had grade B, passed with scores greater than 57 marks and less than equal to 69 marks; 10 students had grade Cand passed with scores less than or equal to 57 marks; 12students had grade D and failed with scores greater than 37 marks; and 5 students had grade F with scores less than or equal to 37 marks. In general, a total of twenty-three students were in the category of those who passed while total of seventeen students were in the category of those who failed.

5. Conclusions and Future Scope

As a result of the rapid increase in extraction of useful knowledge from data, data mining has significantly contributed to most educational institutions in many countries today. The test and prediction conducted on students’ academic performance has really helped both learners and educators to improve their learning and teaching skills, respectively. This research work uses the WEKA data analytics platform to perform J48 classification algorithm on the students’ result across five universities in five countries on the basis of the Execution time, TP rate, FP rate, Precision, Recall, ROC Area, PRC Area, MCC and the F-measure. WEKA took different attributes based on the stratified cross validation via the J 48 tree algorithm to obtain the correctly classified instances, the incorrectly classified instances and others (which includes the mean absolute, root mean squared, relative absolute and root relative squared) error values. Confusion matrixes were generated for the students’ dataset with A, B, C, D and F representing the class labels. The Kappa values obtained from the analysis revealed a range of 0.907–0.9582, which is the perfect reading for most analytical values. Plots such as flow lines and Bar charts were generated on both the evaluation parameters and the attributes, respectively. We discovered that the J48 algorithm provided better results and, in future, we intend to extend our research using different parameters in a different analytic environment.

Author Contributions

Conceptualization, W.I.; methodology, W.I.; software, W.I., S.A., A.A.S. and O.A.A.; validation, W.I. and S.A.; formal analysis, O.A.A.; investigation, W.I. and H.A.; resources, W.I. and O.A.A.; data curation, W.I. and O.A.A.; writing—original draft preparation, W.I.; writing—review and editing, W.I., A.A.S. and S.A.; visualization, H.A., O.A.A. and W.I.; supervision, S.A.; project administration, S.A. All authors have read and agreed to the published version of the manuscript.

Funding

This research received no external funding.

Institutional Review Board Statement

Not Applicable.

Informed Consent Statement

Not Applicable.

Data Availability Statement

Data available upon request to the corresponding authors.

Acknowledgments

The authors are indeed grateful to universities used as case study for providing their students’ academic data for the success of this research.

Conflicts of Interest

The authors declare no conflict of interest.

Nomenclatures

TP-rateTrue Positive Rate
FP-rateFalse Positive Rate
FN-rateFalse Negative Rate
ROC AreaReceiver Operating Characteristics Area
PRC AreaPrecision Recall Curve Area
MCCMatthews Correlation Coefficient
PPVPositive Predictive Value
KDDKnowledge Discovery in Database
WEKAWaikato Environment for Knowledge Analysis
EDM/LAEducational Data Mining and Learning Analytics
ID3Iterative Dichotomiser 3
J48Java 48

Appendix A

Figure A1. WEKA J48 Decision Tree Classifier Algorithm obtained from the Nigerian Students’ Result.
Data 07 00067 g0a1
Figure A2. WEKA J48 Decision Tree Classifier Algorithm obtained from the Indian Students’ Result.
Data 07 00067 g0a2
Figure A3. WEKA J48 Decision Tree Classifier Algorithm obtained from the Iraqi Students’ Result.
Data 07 00067 g0a3
Figure A4. WEKA J48 Decision Tree Classifier Algorithm obtained from the South African Students’ Result.
Data 07 00067 g0a4
Figure A5. WEKA J48 Decision Tree Classifier Algorithm obtained from the Sudanese Students’ Result.
Data 07 00067 g0a5
Figure A6. Grade_Remarks Attribute Platform for Nigerian Students’ dataset.
Data 07 00067 g0a6
Figure A7. Grade_Remarks Attribute Platform for Indian Students’ dataset.
Data 07 00067 g0a7
Figure A8. Grade_Remarks Attribute Platform for Iraqi Students’ dataset.
Data 07 00067 g0a8
Figure A9. Grade_Remarks Attribute Platform for South African Students’ dataset.
Data 07 00067 g0a9
Figure A10. Grade_Remarks Attribute Platform for Sudanese Students’ dataset.
Data 07 00067 g0a10

References

  1. Tsinidou, M.; Gerogiannis, V.; Fitsilis, P. Evaluation of the factors that determine quality in higher education: An empirical study. Qual. Assur. Educ. 2010, 18, 227–244. [Google Scholar] [CrossRef] [Green Version]
  2. Romero, C.; Ventura, S. Educational data mining: A review of the state of the art. IEEE Trans. Syst. Man Cybern. Part C 2010, 40, 601–618. [Google Scholar] [CrossRef]
  3. Han, J.; Pei, J.; Kamber, M. Data Mining: Concepts and Techniques; Elsevier: Amsterdam, The Netherlands, 2012. [Google Scholar]
  4. Jiawei, H.; Kamber, M. Data mining: Concepts and Techniques. University of Illinois at Urbana-Champaign, 2001. Available online: http://hanj.cs.illinois.edu/bk2/toc.pdf (accessed on 4 April 2022).
  5. Aziz, A.A.; Ismail, N.H.; Ahmad, F. Mining Students’ Academic Performance. J. Theor. Appl. Inf. Technol. 2013, 53, 485–495. [Google Scholar]
  6. Romero, C.; Ventura, S.; Espejo, P.G.; Hervas, C. Data mining algorithms to classify students. In Educational Data Mining; Computer Science Department, Corbora University: Andalusia, Spain, 2008. [Google Scholar]
  7. Salal, Y.K.; Abdullaev, S.M.; Kumar, M. Educational Data Mining: Student Performance Prediction in Academic. Int. J. Eng. Adv. Technol. IJEAT 2019, 8, 54–59. [Google Scholar]
  8. Garner, S.R. WEKA: The Waikato Environment for Knowledge Analysis. In Proceedings of the New Zealand Computer Science Research Students Conference, Hamilton, New Zealand, 18–21 April 1995; pp. 57–64. [Google Scholar]
  9. Maimon, O.; Rokach, L. Data Mining and Knowledge Discovery Handbook; Springer: Berlin/Heidelberg, Germany, 2005. [Google Scholar] [CrossRef]
  10. Abdullaev, S.M.; Salal, Y.K. An economic deterministic ensemble classifiers with probabilistic output using for robust quantification: Study of unbalanced educational datasets. In Proceedings of the 1st International Scientific and Practical Conference on Digital Economy (ISCDE 2019), Advances in Economics, Business and Management Research, Chelyabinsk, Russia, 7–8 November 2019; Volume 105, pp. 658–665. [Google Scholar] [CrossRef]
  11. Vranić, M.; Pintar, D.; Skočir, Z. The use of data mining in education environment. In Proceedings of the 9th International Conference on IEEE, Winchester, UK, 8–13 July 2007; pp. 243–250. [Google Scholar]
  12. Abdullaev, S.M.; Lenskaya, O.Y.; Salal, Y.K. Computer Systems of Individual Instruction: Background and Perspectives. Educ. Sci. 2018, 10, 64–71. [Google Scholar] [CrossRef]
  13. Sharma, G.M.; Bhargava, N.; Bhargava, R. Decision Tree analysis on J48 algorithm on Educational Data Mining. Proc. Int. J. Adv. Res. Comput. Sci. Softw. Eng. 2013, 3, 1114–1119. [Google Scholar]
  14. Anjali, B.; Raut, A.A. Students Performance Prediction Using Decision Tree Technique with J48 algorithm. Int. J. Comput. Intell. Res. 2017, 13, 1735–1741. [Google Scholar]
  15. Mehta,, S.H.; Ashish, A. Predicting Students’ Performance using J48 Decision Tree. Int. J. Sci. Res. Comput. Sci. Eng. Inf. Technol. 2019, 4, 122–129. [Google Scholar]
  16. Algorithm and Flow Chart. Available online: https://faradars.org/wp-content/uploads/2015/07/Algorithm-and-Flow-Chart.pdf (accessed on 4 April 2022).
  17. Farhad, A.; Sanjay, P. Comparative Study of J48, Naive Bayes and One-R Classification Technique for Credit Card Fraud Detection using WEKA. In Advances in Computational Sciences and Technology; Research India Publications: Rohini, India, 2017; Volume 10, pp. 1731–1743. ISSN 0973-6107. [Google Scholar]
  18. Ihya, R.; Namir, A.; Sanaa, E.F.; Mohammed, A.D.; Fatima, Z.G. J48 Algorithms of Machine Learning for Predicting User’s the Acceptance of an E-Orientation Systems. In Proceedings of the 4th International Conference on Smart City Applications, Casablanca, Morocco, 2–4 October 2019. [Google Scholar]
  19. Kaur, G.; Chhabra, A. Improved J48 Classification Algorithm for the Prediction of Diabetes. Int. J. Comput. Appl. 2014, 98, 13–17. [Google Scholar] [CrossRef]
  20. Adhatrao, K.; Gaykar, A.; Dhawan, A.; Jha, R.; Honrao, V. Predicting Students performance using ID3 extension and C4.5 classification algorithms. Int. J. Data Min. Knowl. Manag. Process IJDKP 2013, 3, 39–52. [Google Scholar] [CrossRef]
  21. Chen, T.Y.; Kuo, F.C.; Merkel, R. On the Statistical Properties of the F-Measure. In Proceedings of the Fourth International Conference on Quality Software, 2004. QSIC 2004, Braunschweig, Germany, 8–9 September 2004; pp. 46–153. [Google Scholar]
  22. Srivastava, S.K.; Singh, S.K. Multi-Parameter Based Performance Evaluation of Classification Algorithms. Int. J. Comput. Sci. Inf. Technol. IJCSIT 2015, 7, 115–125. [Google Scholar] [CrossRef]
  23. Hussain, S.; Dahan, N.A.; Ba-Alwib, F.M.; Ribata, N. Educational Data Mining and Analysis of Students’ Academic Performance Using WEKA. Indones. J. Electr. Eng. Comput. Sci. 2018, 9, 447–459. [Google Scholar] [CrossRef]
Figure 1. Taxonomy of Data Mining.
Data 07 00067 g001
Figure 2. Flow Chart for Students’ Dataset analysis in WEKA [16].
Data 07 00067 g002
Figure 3. J48 Decision Classifier for Nigerian Students’ dataset.
Data 07 00067 g003
Figure 4. J48 Decision Classifier for Indian Students’ dataset.
Data 07 00067 g004
Figure 5. J48 Decision Classifier for Iraqi Students’ dataset.
Data 07 00067 g005
Figure 6. J48 Decision Classifier for South African Students’ dataset.
Data 07 00067 g006
Figure 7. J48 Decision Classifier for Sudanese Students’ dataset.
Data 07 00067 g007
Figure 8. Plot of Evaluation Parameters based on Nigerian Students’ dataset analysis.
Data 07 00067 g008
Figure 9. Plot of Evaluation Parameters based on Indian Students’ dataset analysis.
Data 07 00067 g009
Figure 10. Plot of Evaluation Parameters based on Iraqi Students’ dataset analysis.
Data 07 00067 g010
Figure 11. Plot of Evaluation Parameters based on Sudanese Students’ dataset analysis.
Data 07 00067 g011
Figure 12. Plot of Evaluation Parameters based on South African Students’ dataset analysis.
Data 07 00067 g012
Table 1. Values obtained for the Students’ dataset across the five universities.
CountriesMean Absolute ErrorKappaRecallPrecisionF-Measure
India0.020.93130.7000.8500.7677
South Africa0.14890.90700.9501.0000.9744
Sudan0.040.95820.9501.0000.9744
Iraq0.020.93080.6500.7000.6741
Nigeria0.11140.92960.9000.9670.9323
Publisher’s Note: MDPI stays neutral with regard to jurisdictional claims in published maps and institutional affiliations.

