
Intraoperative Assessment of Fluid Responsiveness in Normotensive Dogs under Isoflurane Anaesthesia

 , , ,
, , ,
Abstract
:1. Introduction
2. Materials and Methods
2.1. Animals
2.2. Anaesthetic Procedures
2.3. Haemodynamic Monitoring
2.4. Study Protocol
2.5. Statistics
3. Results
4. Discussion
5. Conclusions
Author Contributions
Funding
Institutional Review Board Statement
Informed Consent Statement
Data Availability Statement
Conflicts of Interest
References
- Navarro, L.H.; Bloomstone, J.A.; Auler, J.O., Jr.; Cannesson, M.; Rocca, G.D.; Gan, T.J.; Kinsky, M.; Magder, S.; Miller, T.E.; Mythen, M.; et al. Perioperative fluid therapy: A statement from the international Fluid Optimization Group. Perioper. Med. (Lond.) 2015, 4, 3. [Google Scholar] [CrossRef] [Green Version]
- Bednarski, R.; Grimm, K.; Harvey, R.; Lukasik, V.M.; Penn, W.S.; Sargent, B.; Spelts, K.; American Animal Hospital, A. AAHA anesthesia guidelines for dogs and cats. J. Am. Anim. Hosp. Assoc. 2011, 47, 377–385. [Google Scholar] [CrossRef]
- Vincent, J.L.; Pelosi, P.; Pearse, R.; Payen, D.; Perel, A.; Hoeft, A.; Romagnoli, S.; Ranieri, V.M.; Ichai, C.; Forget, P.; et al. Perioperative cardiovascular monitoring of high-risk patients: A consensus of 12. Crit. Care 2015, 19, 224. [Google Scholar] [CrossRef] [Green Version]
- Bennett, V.A.; Cecconi, M. Perioperative fluid management: From physiology to improving clinical outcomes. Indian J. Anaesth. 2017, 61, 614–621. [Google Scholar] [CrossRef]
- Kristensen, S.D.; Knuuti, J.; Saraste, A.; Anker, S.; Botker, H.E.; De Hert, S.; Ford, I.; Gonzalez Juanatey, J.R.; Gorenek, B.; Heyndrickx, G.R.; et al. 2014 ESC/ESA Guidelines on non-cardiac surgery: Cardiovascular assessment and management: The Joint Task Force on non-cardiac surgery: Cardiovascular assessment and management of the European Society of Cardiology (ESC) and the European Society of Anaesthesiology (ESA). Eur. J. Anaesthesiol. 2014, 31, 517–573. [Google Scholar] [CrossRef] [Green Version]
- Pearse, R.M.; Harrison, D.A.; MacDonald, N.; Gillies, M.A.; Blunt, M.; Ackland, G.; Grocott, M.P.; Ahern, A.; Griggs, K.; Scott, R.; et al. Effect of a perioperative, cardiac output-guided hemodynamic therapy algorithm on outcomes following major gastrointestinal surgery: A randomized clinical trial and systematic review. JAMA 2014, 311, 2181–2190. [Google Scholar] [CrossRef] [PubMed]
- Michard, F.; Giglio, M.T.; Brienza, N. Perioperative goal-directed therapy with uncalibrated pulse contour methods: Impact on fluid management and postoperative outcome. Br. J. Anaesth. 2017, 119, 22–30. [Google Scholar] [CrossRef] [PubMed] [Green Version]
- Davis, H.; Jensen, T.; Johnson, A.; Knowles, P.; Meyer, R.; Rucinsky, R.; Shafford, H.; American Association of Feline, P.; American Animal Hospital, A. 2013 AAHA/AAFP fluid therapy guidelines for dogs and cats. J. Am. Anim. Hosp. Assoc. 2013, 49, 149–159. [Google Scholar] [CrossRef] [PubMed]
- Hamilton-Davies, C.; Mythen, M.G.; Salmon, J.B.; Jacobson, D.; Shukla, A.; Webb, A.R. Comparison of commonly used clinical indicators of hypovolaemia with gastrointestinal tonometry. Intensive Care Med. 1997, 23, 276–281. [Google Scholar] [CrossRef]
- Kumar, A.; Anel, R.; Bunnell, E.; Habet, K.; Zanotti, S.; Marshall, S.; Neumann, A.; Ali, A.; Cheang, M.; Kavinsky, C.; et al. Pulmonary artery occlusion pressure and central venous pressure fail to predict ventricular filling volume, cardiac performance, or the response to volume infusion in normal subjects. Crit. Care Med. 2004, 32, 691–699. [Google Scholar] [CrossRef] [PubMed]
- Taguchi, H.; Ichinose, K.; Tanimoto, H.; Sugita, M.; Tashiro, M.; Yamamoto, T. Stroke volume variation obtained with Vigileo/FloTrac system during bleeding and fluid overload in dogs. J. Anesth. 2011, 25, 563–568. [Google Scholar] [CrossRef]
- Sano, H.; Seo, J.; Wightman, P.; Cave, N.J.; Gieseg, M.A.; Johnson, C.B.; Chambers, P. Evaluation of pulse pressure variation and pleth variability index to predict fluid responsiveness in mechanically ventilated isoflurane-anesthetized dogs. J. Vet. Emerg. Crit. Care (San Antonio) 2018, 28, 301–309. [Google Scholar] [CrossRef]
- Fantoni, D.T.; Auler Junior, J.O.; Futema, F.; Cortopassi, S.R.; Migliati, E.R.; Faustino, M.; de Oliveira, C.M. Intravenous administration of hypertonic sodium chloride solution with dextran or isotonic sodium chloride solution for treatment of septic shock secondary to pyometra in dogs. J. Am. Vet. Med. Assoc. 1999, 215, 1283–1287. [Google Scholar] [PubMed]
- Cecconi, M.; Parsons, A.K.; Rhodes, A. What is a fluid challenge? Curr. Opin. Crit. Care 2011, 17, 290–295. [Google Scholar] [CrossRef] [PubMed]
- Aya, H.D.; Rhodes, A.; Chis Ster, I.; Fletcher, N.; Grounds, R.M.; Cecconi, M. Hemodynamic Effect of Different Doses of Fluids for a Fluid Challenge: A Quasi-Randomized Controlled Study. Crit. Care Med. 2017, 45, e161–e168. [Google Scholar] [CrossRef] [PubMed] [Green Version]
- Araos, J.; Kenny, J.S.; Rousseau-Blass, F.; Pang, D.S. Dynamic prediction of fluid responsiveness during positive pressure ventilation: A review of the physiology underlying heart-lung interactions and a critical interpretation. Vet. Anaesth. Analg. 2020, 47, 3–14. [Google Scholar] [CrossRef] [PubMed]
- Marik, P.E.; Cavallazzi, R.; Vasu, T.; Hirani, A. Dynamic changes in arterial waveform derived variables and fluid responsiveness in mechanically ventilated patients: A systematic review of the literature. Crit. Care Med. 2009, 37, 2642–2647. [Google Scholar] [CrossRef] [PubMed]
- Aditianingsih, D.; George, Y.W. Guiding principles of fluid and volume therapy. Best Pract. Res. Clin. Anaesthesiol. 2014, 28, 249–260. [Google Scholar] [CrossRef]
- Muller, L.; Toumi, M.; Bousquet, P.J.; Riu-Poulenc, B.; Louart, G.; Candela, D.; Zoric, L.; Suehs, C.; de La Coussaye, J.E.; Molinari, N.; et al. An increase in aortic blood flow after an infusion of 100 ml colloid over 1 minute can predict fluid responsiveness: The mini-fluid challenge study. Anesthesiology 2011, 115, 541–547. [Google Scholar] [CrossRef] [PubMed] [Green Version]
- Biais, M.; de Courson, H.; Lanchon, R.; Pereira, B.; Bardonneau, G.; Griton, M.; Sesay, M.; Nouette-Gaulain, K. Mini-fluid Challenge of 100 ml of Crystalloid Predicts Fluid Responsiveness in the Operating Room. Anesthesiology 2017, 127, 450–456. [Google Scholar] [CrossRef]
- Benes, J.; Giglio, M.; Brienza, N.; Michard, F. The effects of goal-directed fluid therapy based on dynamic parameters on post-surgical outcome: A meta-analysis of randomized controlled trials. Crit. Care 2014, 18, 584. [Google Scholar] [CrossRef] [Green Version]
- Ganter, M.T.; Geisen, M.; Hartnack, S.; Dzemali, O.; Hofer, C.K. Prediction of fluid responsiveness in mechanically ventilated cardiac surgical patients: The performance of seven different functional hemodynamic parameters. BMC Anesthesiol. 2018, 18, 55. [Google Scholar] [CrossRef] [PubMed]
- Cannesson, M.; Desebbe, O.; Rosamel, P.; Delannoy, B.; Robin, J.; Bastien, O.; Lehot, J.J. Pleth variability index to monitor the respiratory variations in the pulse oximeter plethysmographic waveform amplitude and predict fluid responsiveness in the operating theatre. Br. J. Anaesth. 2008, 101, 200–206. [Google Scholar] [CrossRef] [PubMed] [Green Version]
- Berkenstadt, H.; Friedman, Z.; Preisman, S.; Keidan, I.; Livingstone, D.; Perel, A. Pulse pressure and stroke volume variations during severe haemorrhage in ventilated dogs. Br. J. Anaesth. 2005, 94, 721–726. [Google Scholar] [CrossRef] [PubMed] [Green Version]
- Klein, A.V.; Teixeira-Neto, F.J.; Garofalo, N.A.; Lagos-Carvajal, A.P.; Diniz, M.S.; Becerra-Velasquez, D.R. Changes in pulse pressure variation and plethysmographic variability index caused by hypotension-inducing hemorrhage followed by volume replacement in isoflurane-anesthetized dogs. Am. J. Vet. Res. 2016, 77, 280–287. [Google Scholar] [CrossRef]
- Fantoni, D.T.; Ida, K.K.; Gimenes, A.M.; Mantovani, M.M.; Castro, J.R.; Patricio, G.C.F.; Ambrosio, A.M.; Otsuki, D.A. Pulse pressure variation as a guide for volume expansion in dogs undergoing orthopedic surgery. Vet. Anaesth. Analg. 2017, 44, 710–718. [Google Scholar] [CrossRef]
- Drozdzynska, M.J.; Chang, Y.M.; Stanzani, G.; Pelligand, L. Evaluation of the dynamic predictors of fluid responsiveness in dogs receiving goal-directed fluid therapy. Vet. Anaesth Analg 2018, 45, 22–30. [Google Scholar] [CrossRef]
- Celeita-Rodriguez, N.; Teixeira-Neto, F.J.; Garofalo, N.A.; Dalmagro, T.L.; Girotto, C.H.; Oliveira, G.C.V.; Santos, I.F. Comparison of the diagnostic accuracy of dynamic and static preload indexes to predict fluid responsiveness in mechanically ventilated, isoflurane anesthetized dogs. Vet. Anaesth. Analg. 2019, 46, 276–288. [Google Scholar] [CrossRef]
- De Monte, V.; Bufalari, A.; Grasso, S.; Ferrulli, F.; Crovace, A.M.; Lacitignola, L.; Staffieri, F. Respiratory effects of low versus high tidal volume with or without positive end-expiratory pressure in anesthetized dogs with healthy lungs. Am. J. Vet. Res. 2018, 79, 496–504. [Google Scholar] [CrossRef]
- Briganti, A.; Evangelista, F.; Centonze, P.; Rizzo, A.; Bentivegna, F.; Crovace, A.; Staffieri, F. A preliminary study evaluating cardiac output measurement using Pressure Recording Analytical Method (PRAM) in anaesthetized dogs. BMC Vet. Res. 2018, 14, 72. [Google Scholar] [CrossRef] [PubMed] [Green Version]
- Biais, M.; Cottenceau, V.; Petit, L.; Masson, F.; Cochard, J.F.; Sztark, F. Impact of norepinephrine on the relationship between pleth variability index and pulse pressure variations in ICU adult patients. Crit. Care 2011, 15, R168. [Google Scholar] [CrossRef] [Green Version]
- Aya, H.D.; Ster, I.C.; Fletcher, N.; Grounds, R.M.; Rhodes, A.; Cecconi, M. Pharmacodynamic Analysis of a Fluid Challenge. Crit. Care Med. 2016, 44, 880–891. [Google Scholar] [CrossRef]
- Faul, F.; Erdfelder, E.; Buchner, A.; Lang, A.G. Statistical power analyses using G*Power 3.1: Tests for correlation and regression analyses. Behav. Res. Methods 2009, 41, 1149–1160. [Google Scholar] [CrossRef] [Green Version]
- DeLong, E.R.; DeLong, D.M.; Clarke-Pearson, D.L. Comparing the areas under two or more correlated receiver operating characteristic curves: A nonparametric approach. Biometrics 1988, 44, 837–845. [Google Scholar] [CrossRef]
- Ray, P.; Le Manach, Y.; Riou, B.; Houle, T.T. Statistical evaluation of a biomarker. Anesthesiology 2010, 112, 1023–1040. [Google Scholar] [CrossRef] [PubMed] [Green Version]
- Coste, J.; Pouchot, J. A grey zone for quantitative diagnostic and screening tests. Int. J. Epidemiol. 2003, 32, 304–313. [Google Scholar] [CrossRef] [PubMed] [Green Version]
- Mallat, J.; Meddour, M.; Durville, E.; Lemyze, M.; Pepy, F.; Temime, J.; Vangrunderbeeck, N.; Tronchon, L.; Thevenin, D.; Tavernier, B. Decrease in pulse pressure and stroke volume variations after mini-fluid challenge accurately predicts fluid responsivenessdagger. Br. J. Anaesth. 2015, 115, 449–456. [Google Scholar] [CrossRef] [PubMed] [Green Version]
- Fantoni, D.; Shih, A.C. Perioperative Fluid Therapy. Vet. Clin. N. Am. Small Anim. Pract. 2017, 47, 423–434. [Google Scholar] [CrossRef]
- Noel-Morgan, J.; Muir, W.W. Anesthesia-Associated Relative Hypovolemia: Mechanisms, Monitoring, and Treatment Considerations. Front. Vet. Sci. 2018, 5, 53. [Google Scholar] [CrossRef]
- Bundgaard-Nielsen, M.; Jorgensen, C.C.; Secher, N.H.; Kehlet, H. Functional intravascular volume deficit in patients before surgery. Acta Anaesthesiol. Scand. 2010, 54, 464–469. [Google Scholar] [CrossRef]
- Forget, P.; Lois, F.; de Kock, M. Goal-directed fluid management based on the pulse oximeter-derived pleth variability index reduces lactate levels and improves fluid management. Anesth. Analg. 2010, 111, 910–914. [Google Scholar] [CrossRef]
- Brienza, N.; Biancofiore, G.; Cavaliere, F.; Corcione, A.; De Gasperi, A.; De Rosa, R.C.; Fumagalli, R.; Giglio, M.T.; Locatelli, A.; Lorini, F.L.; et al. Clinical guidelines for perioperative hemodynamic management of non cardiac surgical adult patients. Minerva Anestesiol. 2019. [Google Scholar] [CrossRef] [PubMed]
- Miller, T.E.; Roche, A.M.; Mythen, M. Fluid management and goal-directed therapy as an adjunct to Enhanced Recovery After Surgery (ERAS). Can. J. Anaesth. 2015, 62, 158–168. [Google Scholar] [CrossRef] [PubMed] [Green Version]
- Rabozzi, R.; Franci, P. Use of systolic pressure variation to predict the cardiovascular response to mini-fluid challenge in anaesthetised dogs. Vet. J. 2014, 202, 367–371. [Google Scholar] [CrossRef]
- Bucci, M.; Rabozzi, R.; Guglielmini, C.; Franci, P. Respiratory variation in aortic blood peak velocity and caudal vena cava diameter can predict fluid responsiveness in anaesthetised and mechanically ventilated dogs. Vet J. 2017, 227, 30–35. [Google Scholar] [CrossRef]
- Toscani, L.; Aya, H.D.; Antonakaki, D.; Bastoni, D.; Watson, X.; Arulkumaran, N.; Rhodes, A.; Cecconi, M. What is the impact of the fluid challenge technique on diagnosis of fluid responsiveness? A systematic review and meta-analysis. Crit. Care 2017, 21, 207. [Google Scholar] [CrossRef] [PubMed] [Green Version]
- Romagnoli, S.; Bevilacqua, S.; Lazzeri, C.; Ciappi, F.; Dini, D.; Pratesi, C.; Gensini, G.F.; Romano, S.M. Most Care®: A minimally invasive system for hemodynamic monitoring powered by the Pressure Recording Analytical Method (PRAM). HSR Proc. Intensive Care Cardiovasc. Anesth. 2009, 1, 20–27. [Google Scholar]
- Han, D.; Liu, Y.G.; Luo, Y.; Li, J.; Ou-Yang, C. Prediction of Fluid Responsiveness Using Pulse Pressure Variation in Infants Undergoing Ventricular Septal Defect Repair with Median Sternotomy or Minimally Invasive Right Thoracotomy. Pediatric Cardiol. 2017, 38, 184–190. [Google Scholar] [CrossRef]
- Franchi, F.; Silvestri, R.; Cubattoli, L.; Taccone, F.S.; Donadello, K.; Romano, S.M.; Giomarelli, P.; McBride, W.T.; Scolletta, S. Comparison between an uncalibrated pulse contour method and thermodilution technique for cardiac output estimation in septic patients. Br J Anaesth. 2011, 107, 202–208. [Google Scholar] [CrossRef] [Green Version]
- Biais, M.; Cottenceau, V.; Stecken, L.; Jean, M.; Ottolenghi, L.; Roullet, S.; Quinart, A.; Sztark, F. Evaluation of stroke volume variations obtained with the pressure recording analytic method. Crit Care Med. 2012, 40, 1186–1191. [Google Scholar] [CrossRef]
- Barthélémy, R.; Neuschwander, A.; Dramé, F.; Redouté, M.; Ditchi, D.; Stern, J.; Mebazaa, A.; Pirracchio, R.; Chousterman, B.G. Monitoring haemodynamic response to fluid-challenge in ICU: Comparison of pressure recording analytical method and oesophageal Doppler: A prospective observational study. Eur. J. Anaesthesiol. 2019, 36, 135–143. [Google Scholar] [CrossRef] [PubMed]
- Garofalo, N.A.; Teixeira-Neto, F.J.; Rodrigues, J.C.; Cerejo, S.A.; Aguiar, A.J.; Becerra-Velásquez, D.R. Comparison of Transpulmonary Thermodilution and Calibrated Pulse Contour Analysis with Pulmonary Artery Thermodilution Cardiac Output Measurements in Anesthetized Dogs. J. Vet. Intern Med. 2016, 30, 941–950. [Google Scholar] [CrossRef] [PubMed]
- Grensemann, J. Cardiac Output Monitoring by Pulse Contour Analysis, the Technical Basics of Less-Invasive Techniques. Front. Med. (Lausanne) 2018, 5, 64. [Google Scholar] [CrossRef]
- Endo, Y.; Tamura, J.; Ishizuka, T.; Itami, T.; Hanazono, K.; Miyoshi, K.; Sano, T.; Yamashita, K.; Muir, W.W. Stroke volume variation (SVV) and pulse pressure variation (PPV) as indicators of fluid responsiveness in sevoflurane anesthetized mechanically ventilated euvolemic dogs. J. Vet. Med. Sci. 2017, 79, 1437–1445. [Google Scholar] [CrossRef] [PubMed] [Green Version]


| Parameters | PRE | POST |
|---|---|---|
| HR (beats/min) | 89.2 (85.1–93.4) | 90.6 (86.5–94.9) |
| SAP (mmHg) | 103.3 (98.1–108.6) | 109.5 (104.2–114.7) |
| DAP (mmHg) | 64.7 (60.6–68.8) | 67.1 (63.3–71.0) |
| MAP (mmHg) | 77.1 (72.9–81.2) | 79.9 (76.1–83.6) |
| CI (L/min/m2) | 3.5 (3.1–4.0) | 4.1 (3.7–4.5) * |
| SVI (mL/beat/m2) | 41.7 (36.9–46.6) | 46.7 (42.3–51.1) * |
| PPV (%) | 20.9 (17.8–24.0) | 15.8 (13.3–18.3) * |
| PVI (%) | 18.9 (16.5–21.3) | 14.2 (12.9–15.5) * |
| SPV (%) | 7.3 (4.5–10.2) | 6.5 (4.5–8.5) |
| SVV (%) | 17.2 (15.2–19.2) | 16.7 (14.5–18.9) |
| Ppeak (cmH2O) | 10.6 (9.8–11.4) | 10.6 (10.0–11.3) |
| PEtCO2 (mmHg) | 41.8 (33.2–46.3) | 42.2 (34.3–44.3) |
| SpO2 (%) | 97.5 (95.2–98.5) | 97.2 (95.3–98.2) |
| Crs (mL/cmH2O/kg) | 1.5 ± 0.7 (1.2–1.8) | 1.6 (1.2–1.9) |
| Parameters | Time | Responders (n = 50) | Nonnresponders (n = 30) |
|---|---|---|---|
| HR (beats/min) | PRE | 89.8 ± 20.9 | 88.4 ± 13.9 |
| POST | 91.2 ± 18.7 | 90.1 ± 19.1 | |
| CI (L·min/m2) | PRE | 2.86 ± 1.09 | 4.8 ± 2.4 * |
| POST | 3.9 ± 1.4 # | 4.4 ± 2.1 | |
| SVI (L/min/m2) | PRE | 34.3 ± 16.2 | 53.6 ± 23.8 * |
| POST | 44.7 ± 18.5 # | 49.9 ± 21.1 | |
| SAP (mmHg) | PRE | 99.1 ± 20.9 | 110.3 ± 25.1 |
| POST | 109.5 ± 22.7 | 109.4 ± 24.9 | |
| DAP (mmHg) | PRE | 63.2 ± 17.1 | 67.1 ± 19.8 |
| POST | 67.9 ± 15.6 | 65.9 ± 19.2 | |
| MAP (mmHg) | PRE | 75.8 ± 18.2 | 79.1 ± 19.1 |
| POST | 80.7 ± 16.2 | 78.5 ± 17.6 | |
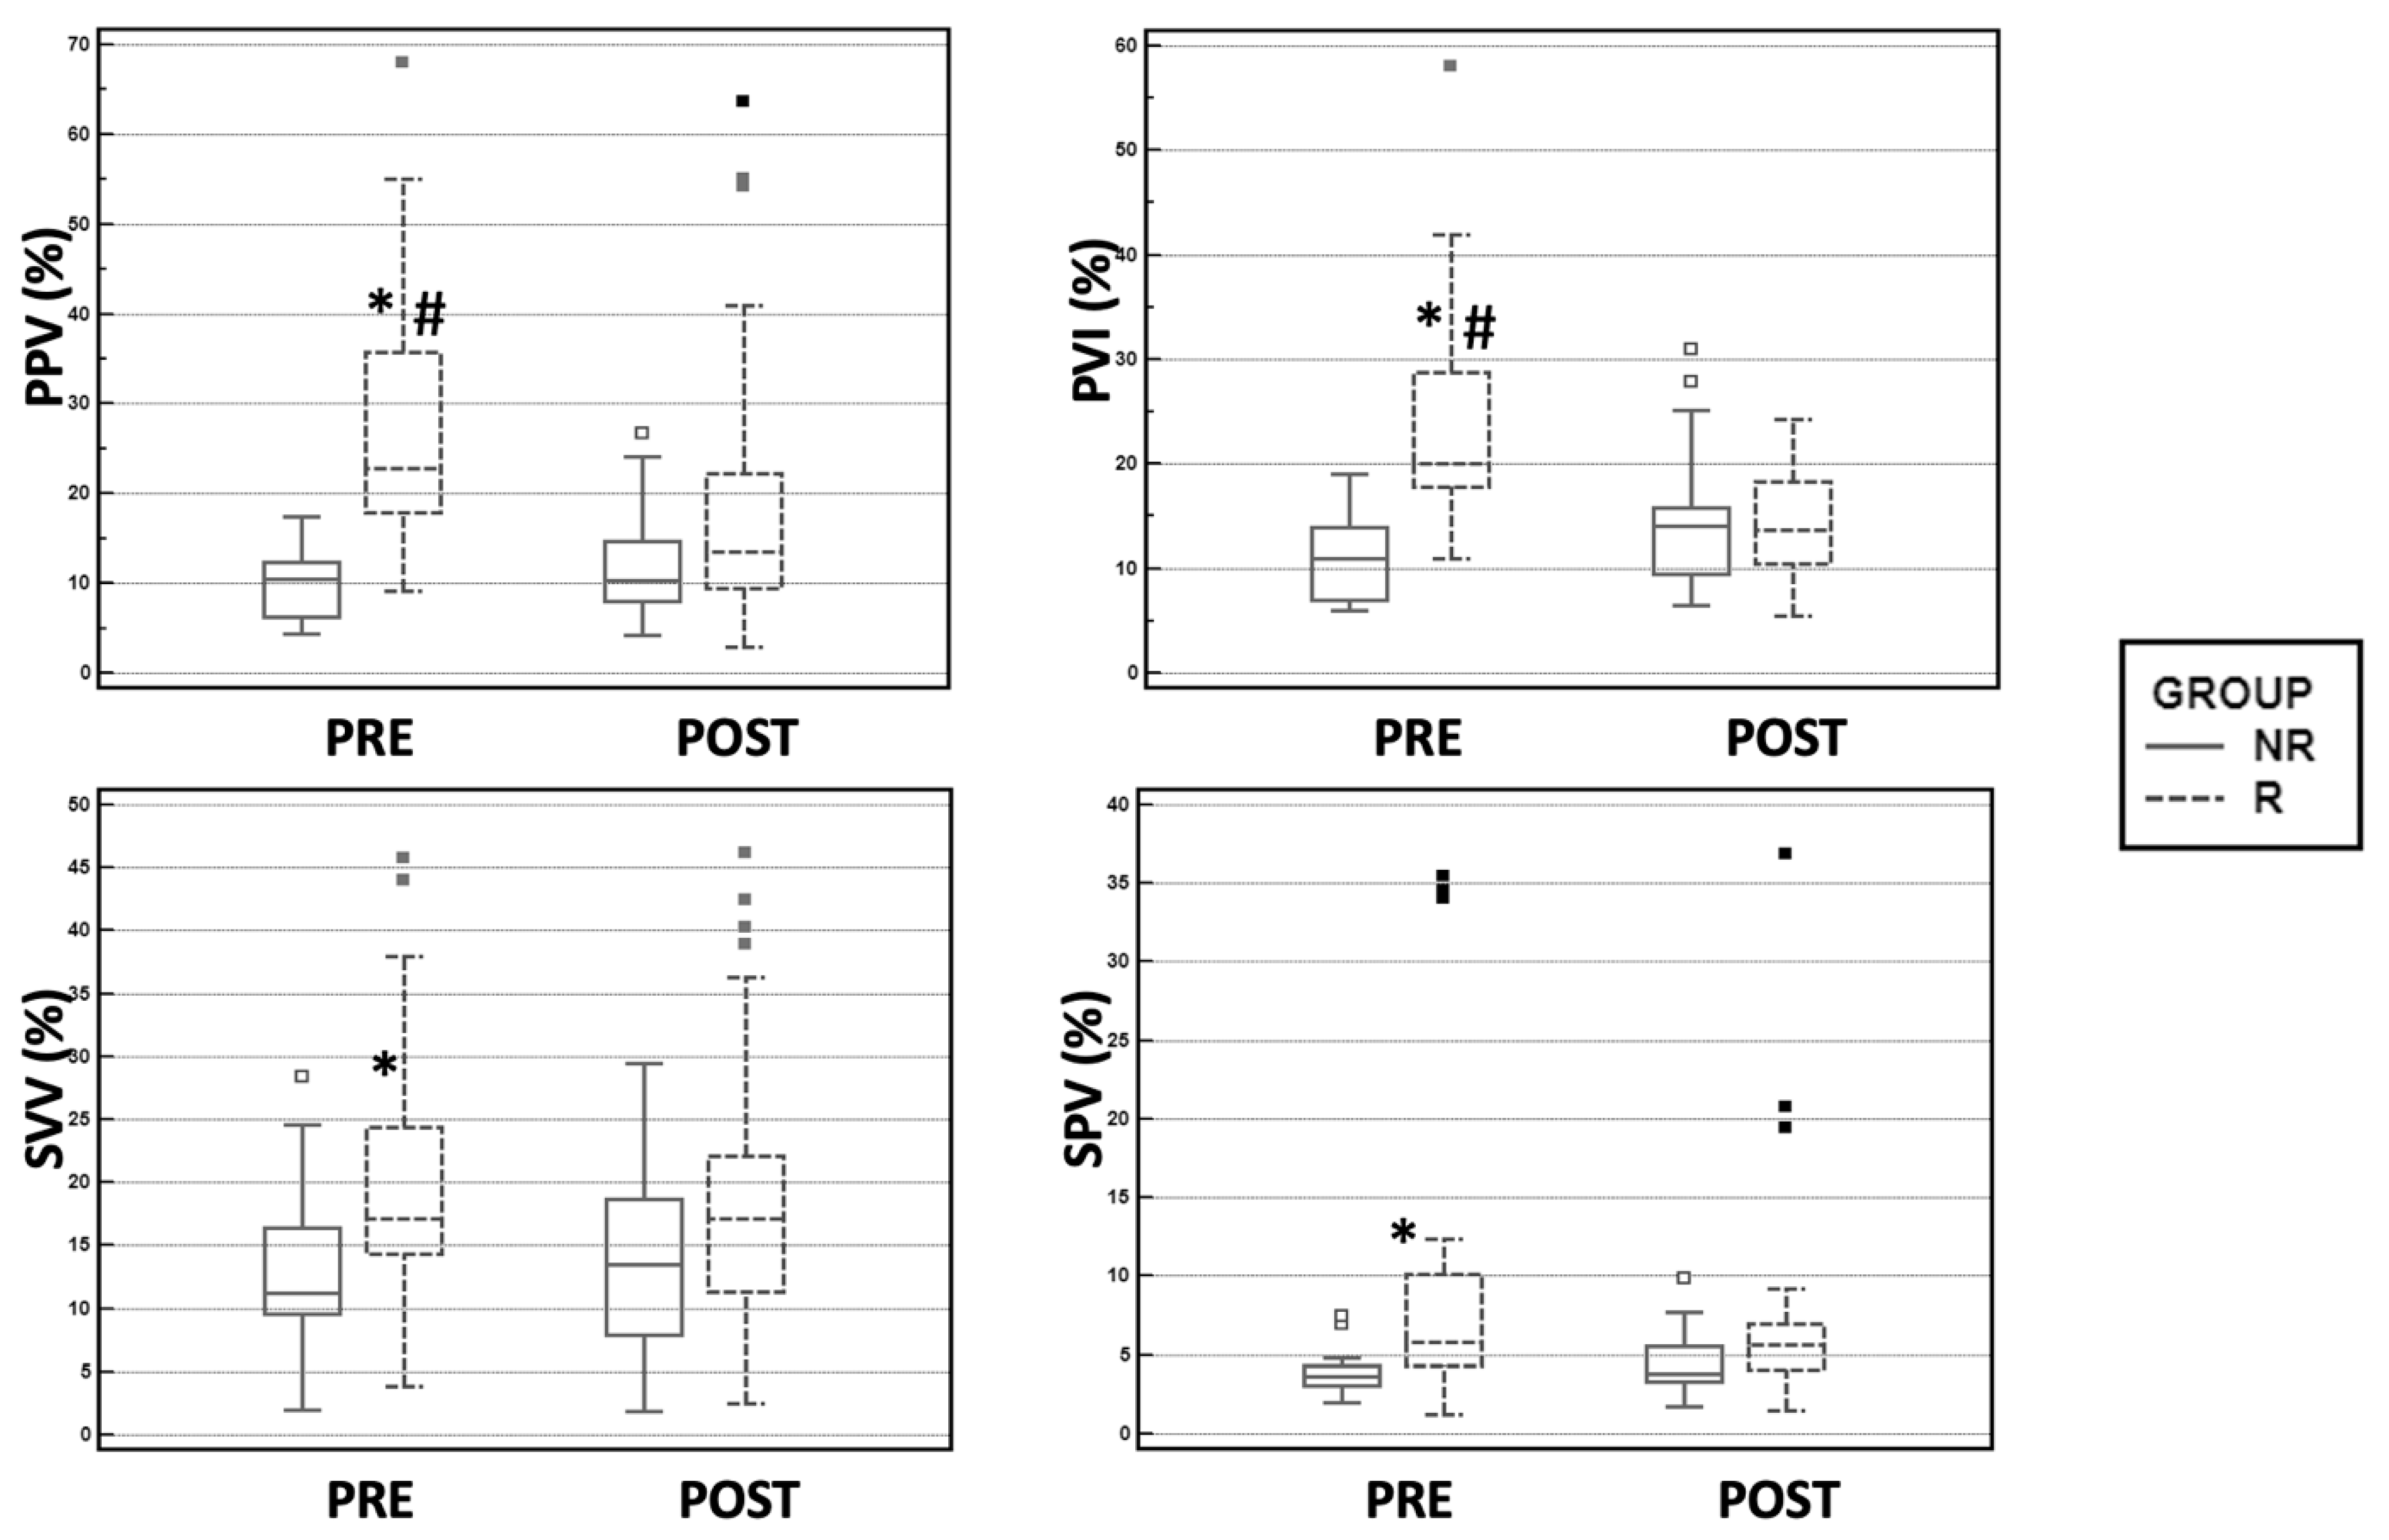
| PVI (%) | PRE | 23.6 ± 9.7 | 10.7 ± 3.5 * |
| POST | 14.3 ± 5.2 # | 14.1 ± 6.1 | |
| PPV (%) | PRE | 27.6 ± 13.5 | 9.7 ± 3.5 * |
| POST | 18.1 ± 12.8 # | 12.1 ± 5.6 | |
| SPV (%) | PRE | 10.1 ± 10.6 | 3.9 ± 1.4 * |
| POST | 7.8 ± 14.1 | 4.6 ± 2.1 | |
| SVV (%) | PRE | 19.4 ± 9.3 | 13.5 ± 6.4 * |
| POST | 18.8 ± 10.7 | 13.2 ± 6.9 |
| Dynamic Index | Cut-Off | Sensitivity (% (95% CI)) | Specificity (% (95% CI)) | AUC (95% CI) | p | Grey Zone (%) | Grey Zone Cases (No. (%)) |
|---|---|---|---|---|---|---|---|
| PPV | >13.8% | 98.0 (89.3–99.7) | 93.3 (77.9–99.0) | 0.979 (0.919–0.997) | <0.0001 | 13.5–15.5 | 6 (7.5) |
| PVI | >14% | 93.3 (81.7–98.5) | 92.3 (74.8–98.8) | 0.956 (0.878–0.990) | <0.0001 | 13–15 | 10 (12.5) |
| SPV | >4.1% | 85.7 (63.6–96.8) | 75.0 (47.6–92.6) | 0.793 (0.628–0.908) | <0.0001 | 3.1–5.1 | 23 (28.75) |
| SVV | >14.7% | 72.0 (57.5–83.8) | 73.3 (54.1–87.7) | 0.729 (0.618–0.822) | <0.0001 | 12.7–15.3 | 25 (31.2) |
| MAP | >67 mmHg | 41.67 (27.6–56.8) | 80 (61.4–92.3) | 0.560 (0.443–0.672) | 0.3788 | <98–>56 | 61 (76.2) |
Publisher’s Note: MDPI stays neutral with regard to jurisdictional claims in published maps and institutional affiliations. |
© 2021 by the authors. Licensee MDPI, Basel, Switzerland. This article is an open access article distributed under the terms and conditions of the Creative Commons Attribution (CC BY) license (http://creativecommons.org/licenses/by/4.0/).
Share and Cite
Skouropoulou, D.; Lacitignola, L.; Di Bella, C.; Stabile, M.; Acquafredda, C.; Brienza, N.; Grasso, S.; Crovace, A.; Iarussi, F.; Staffieri, F. Intraoperative Assessment of Fluid Responsiveness in Normotensive Dogs under Isoflurane Anaesthesia. Vet. Sci. 2021, 8, 26. https://0-doi-org.brum.beds.ac.uk/10.3390/vetsci8020026
Skouropoulou D, Lacitignola L, Di Bella C, Stabile M, Acquafredda C, Brienza N, Grasso S, Crovace A, Iarussi F, Staffieri F. Intraoperative Assessment of Fluid Responsiveness in Normotensive Dogs under Isoflurane Anaesthesia. Veterinary Sciences. 2021; 8(2):26. https://0-doi-org.brum.beds.ac.uk/10.3390/vetsci8020026
Chicago/Turabian StyleSkouropoulou, Despoina, Luca Lacitignola, Caterina Di Bella, Marzia Stabile, Claudia Acquafredda, Nicola Brienza, Salvatore Grasso, Antonio Crovace, Fabrizio Iarussi, and Francesco Staffieri. 2021. "Intraoperative Assessment of Fluid Responsiveness in Normotensive Dogs under Isoflurane Anaesthesia" Veterinary Sciences 8, no. 2: 26. https://0-doi-org.brum.beds.ac.uk/10.3390/vetsci8020026