
Candidate Glycoprotein Biomarkers for Canine Visceral Hemangiosarcoma and Validation Using Semi-Quantitative Lectin/Immunohistochemical Assays

 , , , and
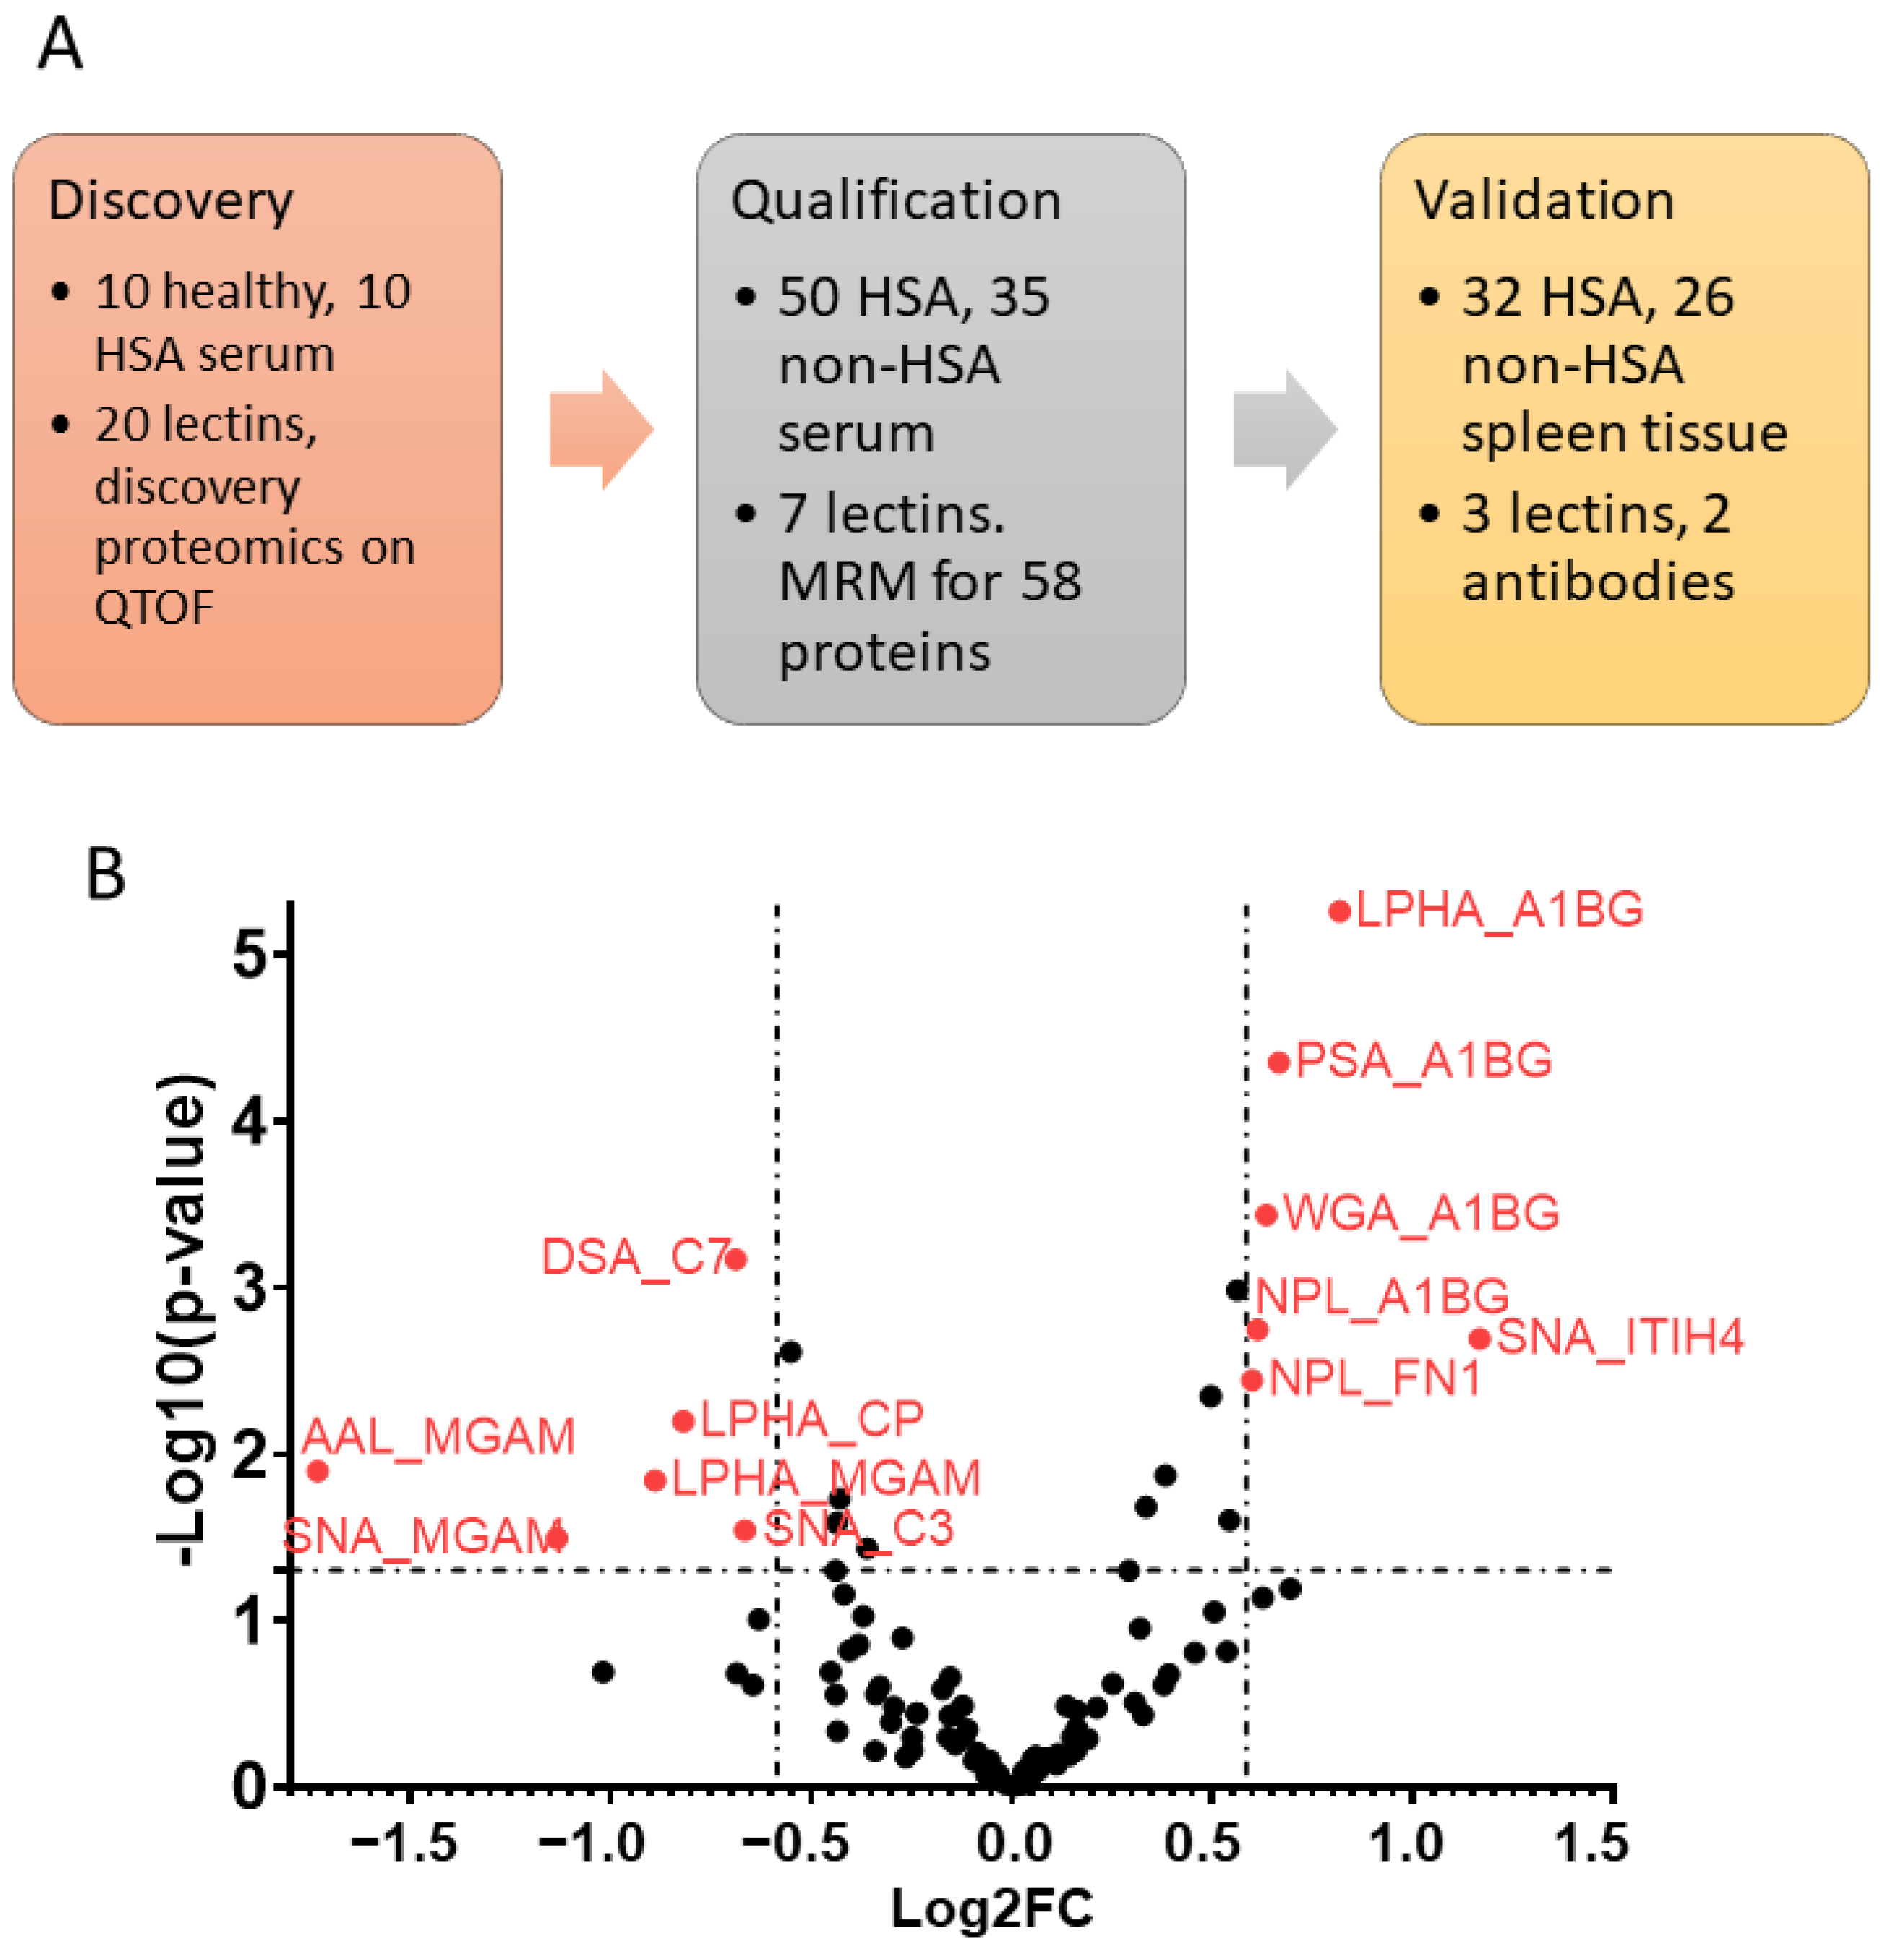
Abstract
:1. Introduction
2. Materials and Methods
2.1. Samples for Discovery Proteomics Acquisition and Analysis
2.2. Discovery Proteomics
2.3. LeMBA-Multiple Reaction Monitoring-Mass Spectrometry (MRM-MS) for Biomarker Qualification
2.4. Samples for Lectin and Immunohistochemistry
2.5. Lectin-Histochemistry (LHC)
2.6. Immunohistochemistry (IHC)
2.7. Positive and Negative Controls
2.8. Semi-Quantitative Lectin/Immunohistochemistry Scoring
2.9. Statistical Analysis
3. Results
3.1. Serum Glycoprotein Biomarker Candidates
3.2. Establishing Control Framework for LHC/IHC Analysis
3.3. Lectin Histochemistry
3.4. Immunohistochemistry for Complement C7
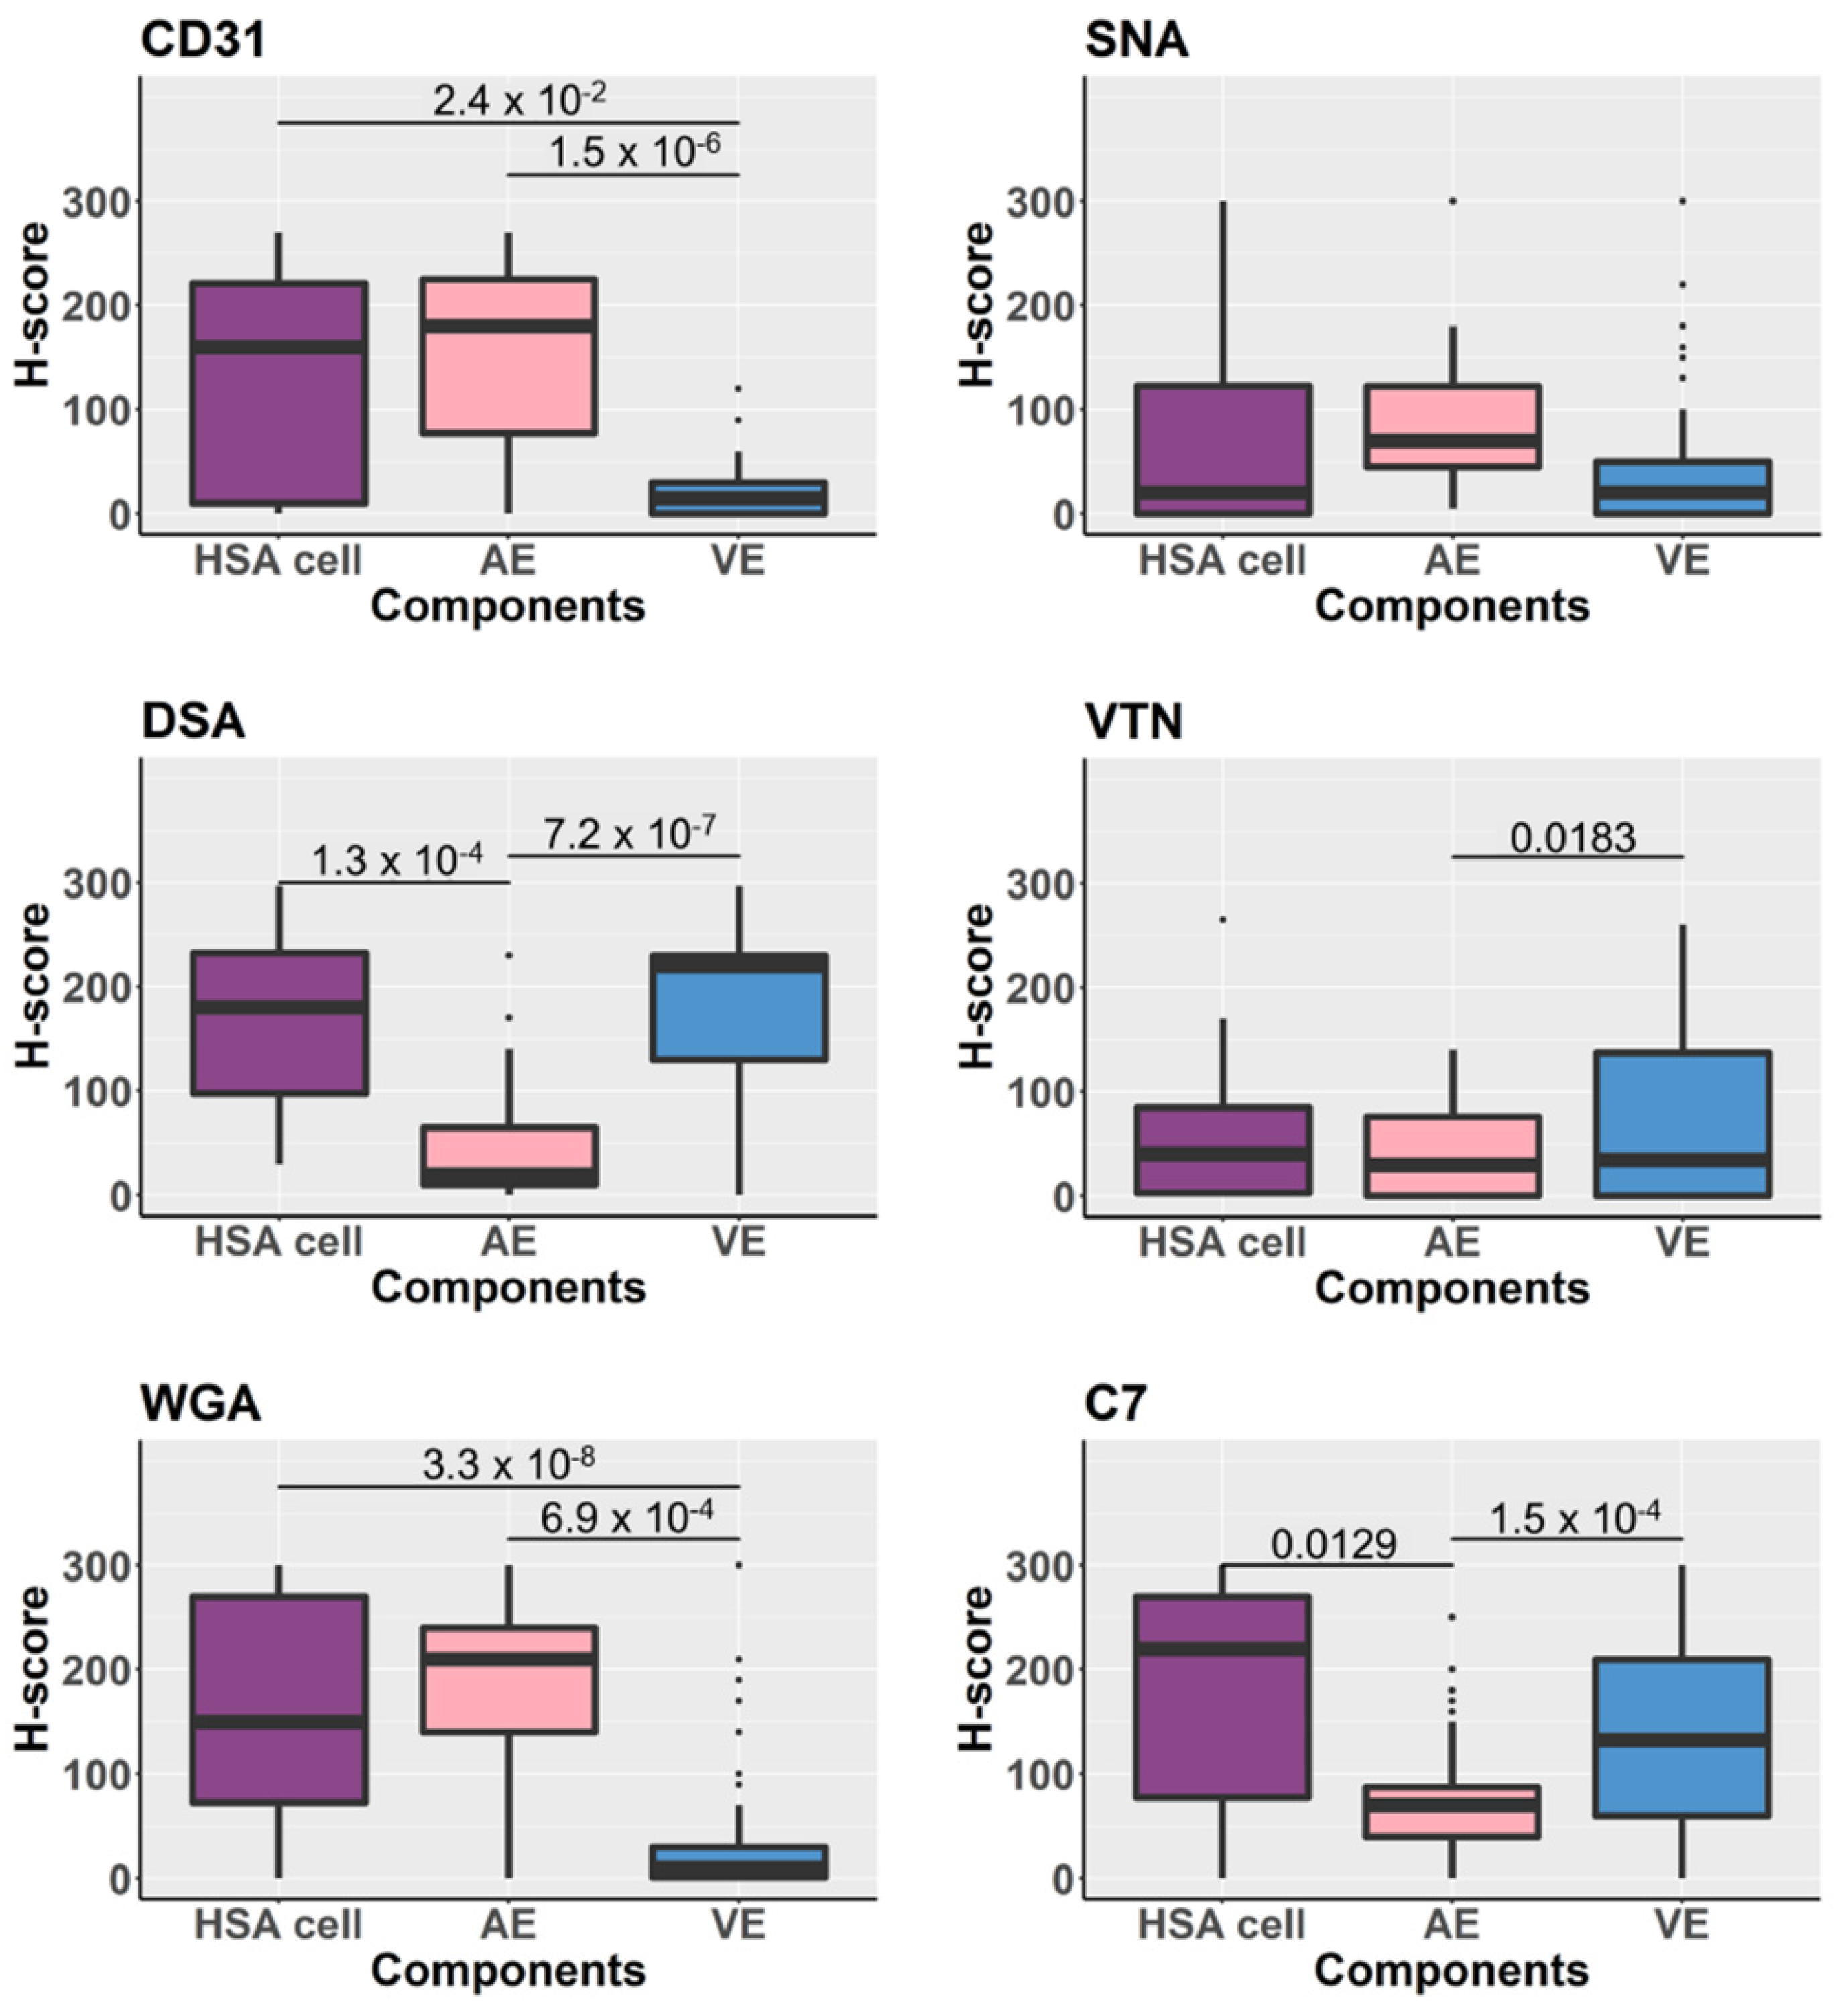
3.5. Glycoproteins Expression on the Tissue Components Assessed by H-Scores
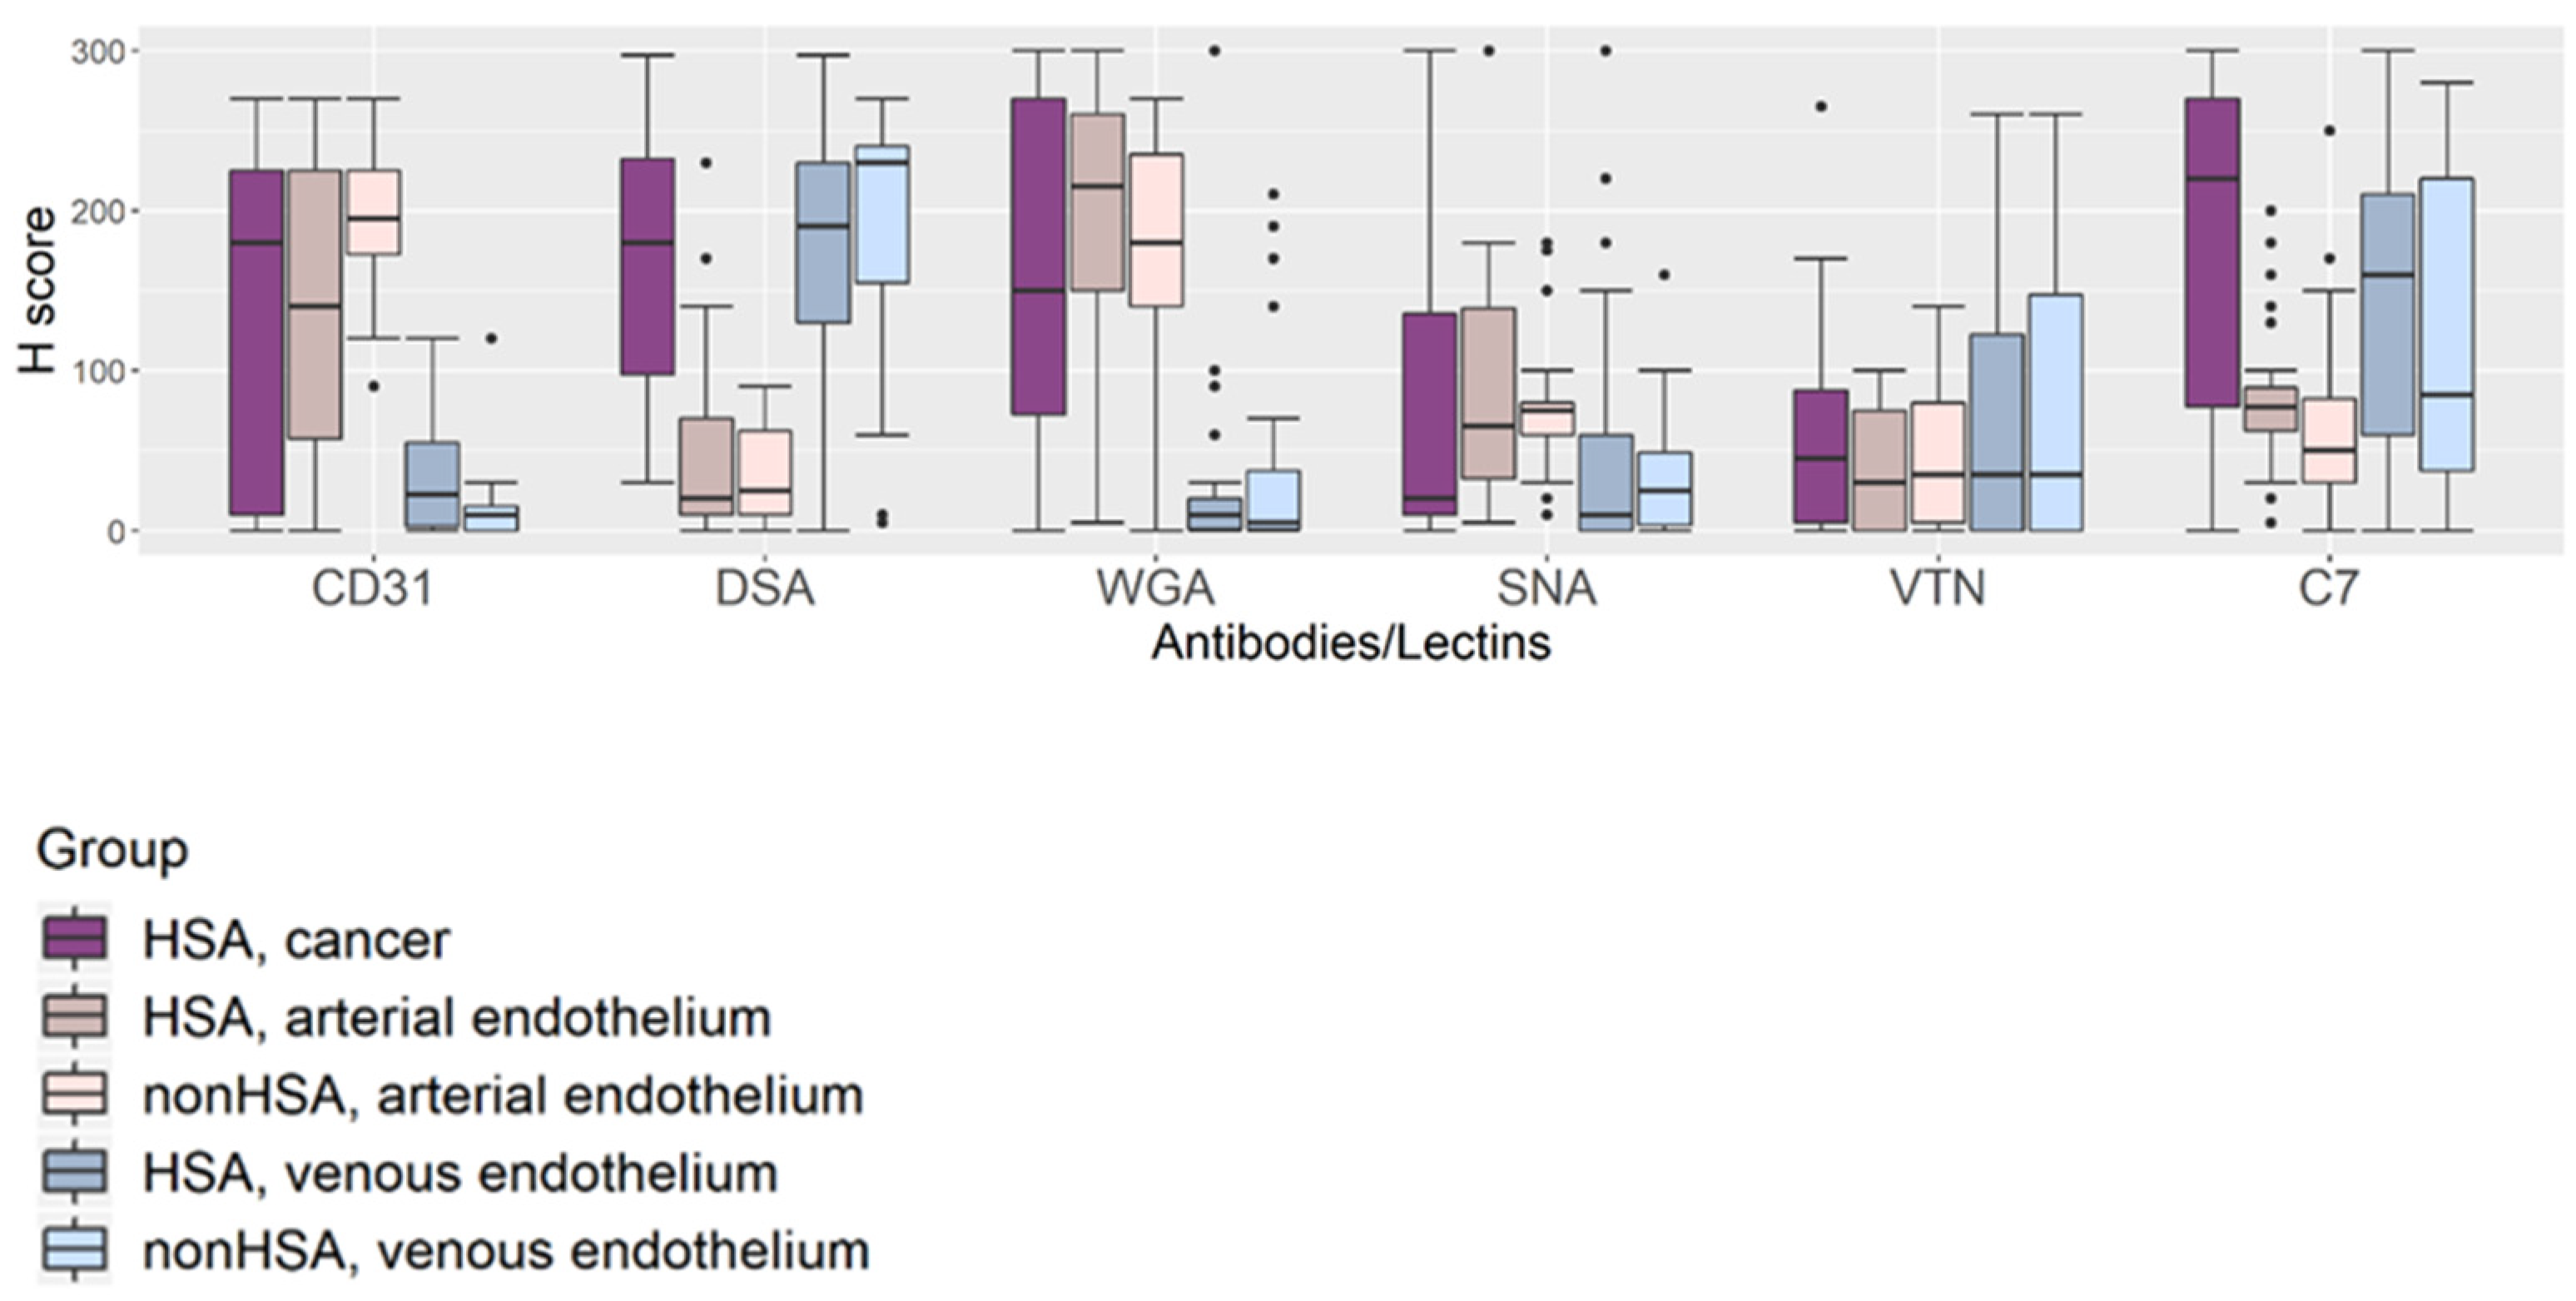
3.6. Comparison of the Tissue Glycoprotein Expression of Normal Vascular Endothelium between HSA Tissues and Non-HSA Tissues
3.7. Associations between HSA Grades and Growth Patterns and Expression of Glycans/Glycoproteins Detected by Lectin-Histochemistry and Immunohistochemistry
3.8. Potential HSA Tissue Markers Assessed by Recursive Partitioning
4. Discussion
5. Conclusions
Supplementary Materials
Author Contributions
Funding
Institutional Review Board Statement
Informed Consent Statement
Data Availability Statement
Acknowledgments
Conflicts of Interest
References
- Spangler, W.L.; Kass, P.H. Pathologic factors affecting post splenectomy survival in dogs. J. Vet. Intern. Med. 1997, 11, 166–171. [Google Scholar] [CrossRef]
- Thamm, D.H.; Kamstock, D.A.; Sharp, C.R.; Johnson, S.I.; Mazzaferro, E.; Herold, L.V.; Barnes, S.M.; Winkler, K.; Selting, K.A. Elevated serum thymidine kinase activity in canine splenic hemangiosarcoma. Vet. Comp. Oncol. 2012, 10, 292–302. [Google Scholar] [CrossRef]
- Maharani, A.; Aoshima, K.; Onishi, S.; Gulay, K.C.M.; Kobayashi, A.; Kimura, T. Cellular atypia is negatively correlated with immunohistochemical reactivity of CD31 and vWF expression levels in canine hemangiosarcoma. J. Vet. Med. Sci. 2018, 80, 213–218. [Google Scholar] [CrossRef] [PubMed] [Green Version]
- Clifford, C.A.; Hughes, D.; Beal, M.W.; Mackin, A.J.; Henry, C.J.; Shofer, F.S.; Sorenmo, K.U. Plasma vascular endothelial growth factor concentrations in healthy dogs and dogs with hemangiosarcoma. J. Vet. Intern. Med. 2001, 15, 131–135. [Google Scholar] [CrossRef] [PubMed]
- Maruyama, H.; Watari, T.; Miura, T.; Sakai, M.; Takahashi, T.; Koie, H.; Yamaya, Y.; Asano, K.; Edamura, K.; Sato, T.; et al. Plasma thrombin-antithrombin complex concentrations in dogs with malignant tumours. Vet. Rec. 2005, 156, 839–840. [Google Scholar] [CrossRef] [PubMed]
- Fukumoto, S.; Miyasho, T.; Hanazono, K.; Saida, K.; Kadosawa, T.; Iwano, H.; Uchide, T. Big endothelin-1 as a tumour marker for canine haemangiosarcoma. Vet. J. 2015, 204, 269–274. [Google Scholar] [CrossRef] [PubMed]
- Kirby, G.M.; Mackay, A.; Grant, A.; Woods, P.; McEwen, B.; Khanna, C.; Macri, J.; Hayes, M.A.; Stalker, M. Concentration of lipocalin region of collagen XXVII alpha 1 in the serum of dogs with hemangiosarcoma. J. Vet. Intern. Med. 2011, 25, 497–503. [Google Scholar] [CrossRef]
- Witter, L.E.; Gruber, E.J.; Lean, F.Z.; Stokol, T. Evaluation of procoagulant tissue factor expression in canine hemangiosarcoma cell lines. Am. J. Vet. Res. 2017, 78, 69–79. [Google Scholar] [CrossRef] [Green Version]
- Chun, R.; Kellihan, H.B.; Henik, R.A.; Stepien, R.L. Comparison of plasma cardiac troponin I concentrations among dogs with cardiac hemangiosarcoma, noncardiac hemangiosarcoma, other neoplasms, and pericardial effusion of nonhemangiosarcoma origin. J. Am. Vet. Med. Assoc. 2010, 237, 806–811. [Google Scholar] [CrossRef] [PubMed]
- Yuki, M.; Machida, N.; Sawano, T.; Itoh, H. Investigation of serum concentrations and immunohistochemical localization of α1-acid glycoprotein in tumor dogs. Vet. Res. Commun. 2011, 35, 1–11. [Google Scholar] [CrossRef]
- Chikazawa, S.; Hori, Y.; Hoshi, F.; Kanai, K.; Ito, N.; Higuchi, S. Hyperferritinemia in dogs with splenic hemangiosarcoma. J. Vet. Med. Sci. 2013, 75, 1515–1518. [Google Scholar] [CrossRef] [Green Version]
- Wang, M.; Zhu, J.; Lubman, D.M.; Gao, C. Aberrant glycosylation and cancer biomarker discovery: A promising and thorny journey. Clin. Chem. Lab. Med. 2019, 57, 407–416. [Google Scholar] [CrossRef]
- Choi, E.; Loo, D.; Dennis, J.W.; O’Leary, C.A.; Hill, M.M. High-throughput lectin magnetic bead array-coupled tandem mass spectrometry for glycoprotein biomarker discovery. Electrophoresis 2011, 32, 3564–3575. [Google Scholar] [CrossRef] [PubMed]
- Moreno-Hagelsieb, G.; Latimer, K. Choosing BLAST options for better detection of orthologs as reciprocal best hits. Bioinformatics 2008, 24, 319–324. [Google Scholar] [CrossRef] [Green Version]
- Shah, A.K.; Le Cao, K.A.; Choi, E.; Chen, D.; Gautier, B.; Nancarrow, D.; Whiteman, D.C.; Saunders, N.A.; Barbour, A.P.; Joshi, V.; et al. Serum glycoprotein biomarker discovery and qualification pipeline reveals novel diagnostic biomarker candidates for esophageal adenocarcinoma. Mol. Cell Proteom. 2015, 14, 3023–3039. [Google Scholar] [CrossRef] [Green Version]
- Goritz, M.; Muller, K.; Krastel, D.; Staudacher, G.; Schmidt, P.; Kühn, M.; Nickel, R.; Schoon, H.-A. Canine splenic haemangiosarcoma: Influence of metastases, chemotherapy and growth pattern on post-splenectomy survival and expression of angiogenic factors. J. Comp. Pathol. 2013, 149, 30–39. [Google Scholar] [CrossRef]
- Ogilvie, G.K.; Powers, B.E.; Mallinckrodt, C.H.; Withrow, S.J. Surgery and doxorubicin in dogs with hemangiosarcoma. J. Vet. Intern. Med. 1996, 10, 379–384. [Google Scholar] [CrossRef]
- Sabattini, S.; Bettini, G. An immunohistochemical analysis of canine haemangioma and haemangiosarcoma. J. Comp. Pathol. 2009, 140, 158–168. [Google Scholar] [CrossRef] [PubMed]
- Meuten, D.J.; Moore, F.M.; George, W. Appendix: Diagnostic Schemes and Algorithms. In Tumors in Domestic Animals; John Wiley & Sons, Inc.: Ames, IA, USA, 2016; pp. 942–978. [Google Scholar]
- Van Diest, P.J.; van Dam, P.; Henzen-Logmans, S.C.; Berns, E.; van der Burg, M.E.; Green, J.; Vergote, I. A scoring system for immunohistochemical staining: Consensus report of the task force for basic research of the EORTC-GCCG. European Organization for Research and Treatment of Cancer-Gynaecological Cancer Cooperative Group. J. Clin. Pathol. 1997, 50, 801–804. [Google Scholar] [CrossRef] [Green Version]
- Wickham, H. Ggplot2: Elegant Graphics for Data Analysis; Springer: New York, NY, USA, 2016; Available online: https://ggplot2.tidyverse.org (accessed on 8 October 2019).
- Therneau, T.; Atkinson, B. Rpart: Recursive Partitioning and Regression Trees. R Package Version 4.1-15. 2019. Available online: https://CRAN.R-project.org/package=rpart (accessed on 4 February 2020).
- Venkatraman, E.S. Clinfun: Clinical Trial Design and Data Analysis Functions. R Package Version 1.0.15. 2019. Available online: https://CRAN.R-project.org/package=clinfun (accessed on 5 February 2020).
- Davis, A.S.; Chang, M.Y.; Brune, J.E.; Hallstrand, T.S.; Johnson, B.; Lindhartsen, S.; Hewitt, S.M.; Frevert, C.W. The Use of Quantitative Digital Pathology to Measure Proteoglycan and Glycosaminoglycan Expression and Accumulation in Healthy and Diseased Tissues. J. Histochem. Cytochem. 2020, 16. [Google Scholar] [CrossRef]
- Jensen, K.; Krusenstjerna-Hafstrom, R.; Lohse, J.; Petersen, K.H.; Derand, H. A novel quantitative immunohistochemistry method for precise protein measurements directly in formalin-fixed, paraffin-embedded specimens: Analytical performance measuring HER2. Mod. Pathol. 2017, 30, 180–193. [Google Scholar] [CrossRef] [PubMed]
- Specht, E.; Kaemmerer, D.; Sanger, J.; Wirtz, R.M.; Schulz, S.; Lupp, A. Comparison of immunoreactive score, HER2/neu score and H score for the immunohistochemical evaluation of somatostatin receptors in bronchopulmonary neuroendocrine neoplasms. Histopathology 2015, 67, 368–377. [Google Scholar] [CrossRef] [PubMed]
- Paz, N.G.; D’Amore, P.A. Arterial versus venous endothelial cells. Cell Tissue Res. 2009, 335, 5–16. [Google Scholar]
- Wolf, K.; Hu, H.; Isaji, T.; Dardik, A. Molecular identity of arteries, veins, and lymphatics. J. Vasc. Surg. 2019, 69, 253–262. [Google Scholar] [CrossRef] [PubMed]
- Berman, J.J. Neoplasms: Principles of Development and Diversity; Jones & Bartlett Publishers: Sudbury, MA, USA, 2009. [Google Scholar]
- Kacevska, M.; Mahns, A.; Sharma, R.; Clarke, S.J.; Robertson, G.R.; Liddle, C. Extra-hepatic cancer represses hepatic drug metabolism via interleukin (IL)-6 signalling. Pharm. Res. 2013, 30, 2270–2278. [Google Scholar] [CrossRef]
- Augustin-Voss, H.G.; Smith, C.A.; Lewis, R.M. Phenotypic characterization of normal and neoplastic canine endothelial cells by lectin histochemistry. Vet. Pathol. 1990, 27, 103–109. [Google Scholar] [CrossRef] [Green Version]
- Stowell, S.R.; Ju, T.; Cummings, R.D. Protein glycosylation in cancer. Ann. Rev. Pathol. 2015, 10, 473–510. [Google Scholar] [CrossRef] [PubMed] [Green Version]
- Menny, A.; Serna, M.; Boyd, C.M.; Gardner, S.; Joseph, A.P.; Morgan, B.P.; Topf, M.; Brooks, N.J.; Bubeck, D. CryoEM reveals how the complement membrane attack complex ruptures lipid bilayers. Nat. Commun. 2018, 9, 5316. [Google Scholar] [CrossRef] [Green Version]
- NCBI Resource Coordinators. Database resources of the National Center for Biotechnology Information. Nucleic Acids Res. 2013, 42, D7–D17. [Google Scholar]
- Langeggen, H.; Pausa, M.; Johnson, E.; Casarsa, C.; Tedesco, F. The endothelium is an extrahepatic site of synthesis of the seventh component of the complement system. Clin. Exp. Immunol. 2000, 121, 69–76. [Google Scholar] [CrossRef] [PubMed]
- Bossi, F.; Rizzi, L.; Bulla, R.; Debeus, A.; Tripodo, C.; Picotti, P.; Betto, E.; Macor, P.; Pucillo, C.; Wurzner, R.; et al. C7 is expressed on endothelial cells as a trap for the assembling terminal complement complex and may exert anti-inflammatory function. Blood 2009, 113, 3640–3648. [Google Scholar] [CrossRef] [PubMed] [Green Version]
- Ying, L.; Zhang, F.; Pan, X.; Chen, K.; Zhang, N.; Jin, J.; Wu, J.; Feng, J.; Yu, H.; Jin, H.; et al. Complement component 7 (C7), a potential tumor suppressor, is correlated with tumor progression and prognosis. Oncotarget 2016, 7, 86536–86546. [Google Scholar] [CrossRef] [PubMed] [Green Version]
- Seol, H.S.; Lee, S.E.; Song, J.S.; Rhee, J.K.; Singh, S.R.; Chang, S.; Jang, S.J. Complement proteins C7 and CFH control the stemness of liver cancer cells via LSF-1. Cancer Lett. 2016, 372, 24–35. [Google Scholar] [CrossRef] [PubMed] [Green Version]


Publisher’s Note: MDPI stays neutral with regard to jurisdictional claims in published maps and institutional affiliations. |
© 2021 by the authors. Licensee MDPI, Basel, Switzerland. This article is an open access article distributed under the terms and conditions of the Creative Commons Attribution (CC BY) license (http://creativecommons.org/licenses/by/4.0/).
Share and Cite
Oungsakul, P.; Choi, E.; Shah, A.K.; Mohamed, A.; O’Leary, C.; Duffy, D.; Hill, M.M.; Bielefeldt-Ohmann, H. Candidate Glycoprotein Biomarkers for Canine Visceral Hemangiosarcoma and Validation Using Semi-Quantitative Lectin/Immunohistochemical Assays. Vet. Sci. 2021, 8, 38. https://0-doi-org.brum.beds.ac.uk/10.3390/vetsci8030038
Oungsakul P, Choi E, Shah AK, Mohamed A, O’Leary C, Duffy D, Hill MM, Bielefeldt-Ohmann H. Candidate Glycoprotein Biomarkers for Canine Visceral Hemangiosarcoma and Validation Using Semi-Quantitative Lectin/Immunohistochemical Assays. Veterinary Sciences. 2021; 8(3):38. https://0-doi-org.brum.beds.ac.uk/10.3390/vetsci8030038
Chicago/Turabian StyleOungsakul, Patharee, Eunju Choi, Alok K. Shah, Ahmed Mohamed, Caroline O’Leary, David Duffy, Michelle M. Hill, and Helle Bielefeldt-Ohmann. 2021. "Candidate Glycoprotein Biomarkers for Canine Visceral Hemangiosarcoma and Validation Using Semi-Quantitative Lectin/Immunohistochemical Assays" Veterinary Sciences 8, no. 3: 38. https://0-doi-org.brum.beds.ac.uk/10.3390/vetsci8030038