Naturalistic Driving: A Framework and Advances in Using Big Data


1
Bruyère Continuing Care, Ottawa, ON K1N 5C8, Canada
2
Bruyère Research Institute, Ottawa, ON K1N 5C8, Canada
3
Faculty of Medicine, University of Ottawa, Ottawa, ON K1H 8L6, Canada
4
Department of Systems and Computer Engineering, Faculty of Engineering and Design, Carleton University, Ottawa, ON K1S 5B6, Canada
5
AGE-WELL NIH—SAM3, Ottawa, ON K1N 5C8, Canada
6
Ottawa Health Research Institute, The Ottawa Hospital, Ottawa, ON K1Y 4E9, Canada
*
Author to whom correspondence should be addressed.
Geriatrics 2018, 3(2), 16; https://0-doi-org.brum.beds.ac.uk/10.3390/geriatrics3020016
Submission received: 2 February 2018
/
Revised: 22 March 2018
/
Accepted: 24 March 2018
/
Published: 29 March 2018
(This article belongs to the Special Issue Aging and Driving)
Abstract
:Driving is an activity that facilitates physical, cognitive, and social stimulation in older adults, ultimately leading to better physical and cognitive health. However, aging is associated with declines in vision, physical health, and cognitive health, all of which can affect driving ability. One way of assessing driving ability is with the use of sensors in the older adult’s own vehicle. This paper provides a framework for driving assessment and addresses how naturalistic driving studies can assist in such assessments. The framework includes driving characteristics (how much driving, speed, position, type of road), actions and reactions (lane changes, intersections, passing, merging, traffic lights, pedestrians, other vehicles), destinations (variety and distance, sequencing and route planning), and driving conditions (time of day and season). Data from a subset of Ottawa drivers from the Candrive study is used to illustrate the use of naturalistic driving data. Challenges in using naturalistic driving big data and the changing technology in vehicles are discussed.
1. Introduction
With the aging of the population [1,2], there is increasing attention being paid to older adult driving. On one hand, older adults remain healthier when they are physically, cognitively and socially active [3,4], all of which are facilitated when they stay driving [5]. On the other hand, aging is associated with decreases in vision, physical health and cognitive health, each of which affect driving ability [6,7,8], potentially increasing risk of crash and affecting their and other travelers’ health.
Current practice to assess older drivers’ cognitive driving ability includes neuro-psychological (NP) testing and observation of driving. A number of groups are suggesting a trichotomization model of triage, where NP testing is used to screen and hence reduce the number of observation-type tests. In the trichotomization model, poor NP testing is considered incompatible with safe driving, good NP results are considered compatible with safe driving, and intermediate NP results require driving observation [9,10].
Driving observation can be done in three forms. The gold standard is an on-road test with an observer in the automobile. The advantages of on-road driving include being able to observe how the driver plans their driving and reacts to traffic situations. The route can be standardized locally, allowing for more objective evaluation of driving skills. However, on-road tests are not as good at testing for unusual, higher risk events. Typically, on-road tests are cancelled in poor weather, and unsafe other driver events and pedestrian crossings cannot be “regularly” included in the test. Similarly, while some elements of on-road tests can be standardized, each city and town has unique geographic or population characteristics that prevent true standardization. Finally, on-road testing is human resource–intensive and hence costly to the individual driver or society, depending on who pays.
An alternative form of driving observation would be a driving simulator. The advantages of simulation include the ability to truly standardize a driving route and to safely include unusual high-risk events in the simulation. However, simulation cannot truly replicate all the elements of on-road driving, the driver needs to learn how to use the simulator, and the driver may be affected by driving simulator sickness [11,12].
The third method of driving observation involves naturalistic driving. Here, the older driver has the advantage of being tested in their own familiar vehicle and on roads they typically use. Another advantage is that choices around driving can be monitored. With the improvement and ongoing size reduction of technology, the older adult’s vehicle can be outfitted with cameras, global position systems (GPS), and sensors that can monitor vehicle data. Increasingly, to support driver assist and automation, manufacturers are adding sensors to vehicles, with some having standard interfaces. Since no observer is needed in real-time, this theoretically could reduce the costs associated with this type of monitoring. However, the more detailed the information one would like to collect about their driving, the more data is generated, leading to big data challenges. First the data needs to be moved from the vehicle to the place of analysis, and then there is the issue of analyzing the big data set.
2. Data Collection and Analysis
There are a number of driving studies that are using naturalistic driving and big data analytics [13,14,15,16,17]. The Candrive study [13,14] is one such study that included 256 drivers in Ottawa, Canada, monitored for up to five years each. On average, the Ottawa sub-group drove 20,000 km per year, amounting to a total of more than 15 M km driven. The data collected using the Persentech OttoView-CD data collection device (Persen Technologies Inc., Winnipeg, MB, Canada) attached to their car included GPS and engine computer data every second the car was driven, providing information on vehicle speed, gas pedal position, engine speed, and air temperature in addition to longitude and latitude location. In order to provide additional information about the context of the driving, this data was augmented with a Geographic Information Systems (GIS) map, weather information, and solar cycle information. To put all of this data together for analysis for the Ottawa drivers required 1 Terabyte of storage or the total amount of storage found in a typical desktop computer. The amount of processing power required to analyze each trip by each participant over the duration of the study would take all of the processing power of a typical desktop computer running continuously for about three months. However, with rapidly-evolving technology, there are continued increases in storage and computation capacity. For instance, cloud-based computing, where large-scale computation problems can be performed on shared computers from service providers, will facilitate this type of analyses.
Historically, the instrumentation of vehicles with sensors to collect driving-related data was costly, difficult, and time-consuming as the sensors and recording systems had to be retrofitted into vehicles. With the emergence of the On Board Diagnostics II interface in 1995 (for North America), many of the sensors associated with the engine became accessible through a standard interface, greatly simplifying the challenge to deploy sensors. An OBDII recorder was used in the Candrive study [13,14]. Looking forward, the number of sensors continues to increase within vehicles, and as they become accessible, they will increase the data available for study.
For illustration purposes in this paper, our group analyzed the driving data of a sub-set of 59 older Ottawa drivers that had a car crash reported to the Ontario Ministry of Transport during the period of study. The comparison of the sub-set and the full set of Ottawa drivers is shown in Table 1. As can be seen, other than gender of participant, the subset is a representative sample of the larger group.
The storage, distribution, and sharing of the collected data needs to consider the privacy of the driver [18]. Although it is relatively easy to de-identify the data by ensuring it does not include the driver name, address or other text based identity, with the inclusion of GPS information, it is relatively easy to determine the driver’s residence (where the car is overnight) and many other personal attributes that could lead quickly to the driver’s identity. Our group has proposed methods to de-identify this type of data [18].
3. Naturalistic Driving Framework
Given the variety of data available in naturalistic driving studies, it is important first to organize groups of information to be analyzed. Table 2 shows four categories that appear to work well: (1) driving characteristics, (2) actions/reactions, (3) destinations, and (4) conditions. These categories interact in the complex task of actual driving, but it is possible to separate them from the data to simplify comparisons.
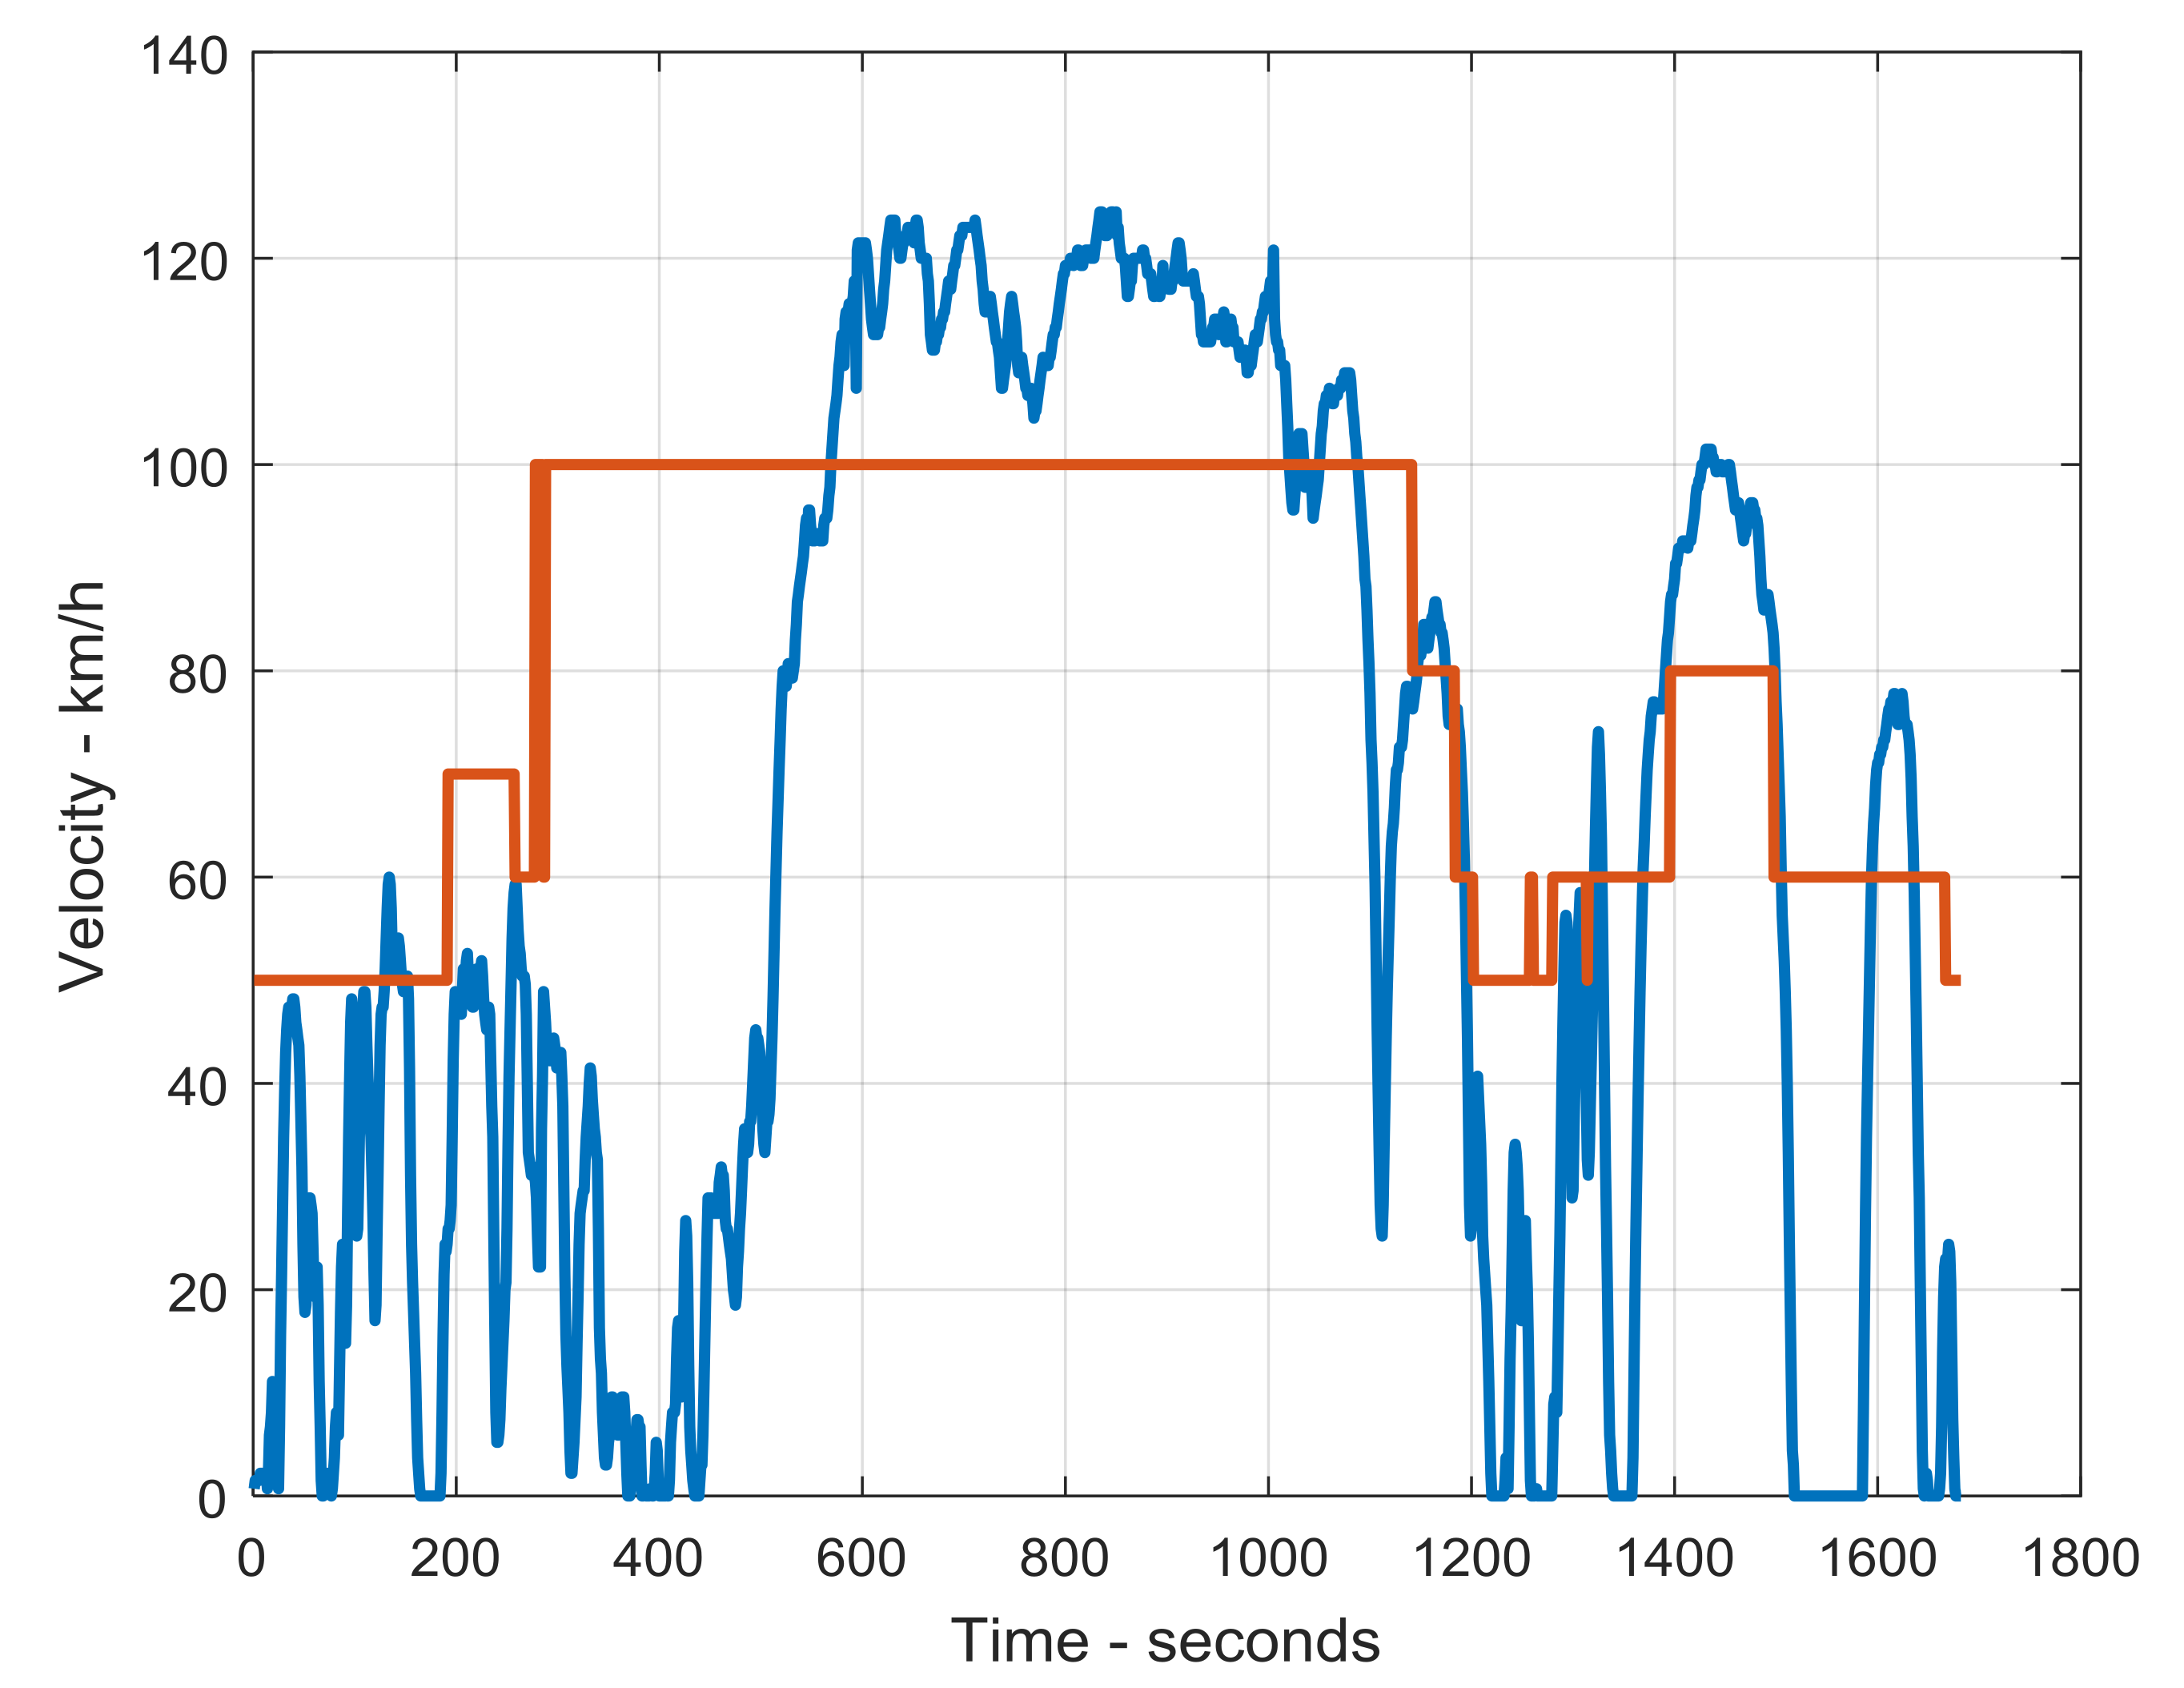
Driving characteristics that can be measured for an individual begin with quantitative measures on how much the individual drives. Two dimensions make up this measure: the number of trips taken and the length of the trip. When linked to the date and time data, distance travelled can be calculated at a trip level and on a periodic level (e.g., time of day, seasonal, yearly). The second set of characteristics relates to how the person actually drives, and this includes speed and its derivative acceleration. Speed and acceleration are relevant in both straight line travels as well as in turning situations and can be compared to the posted speed limit on a given road. Position, the third measure, includes the position in the driving lane as well as position with respect to other vehicles (e.g., following distance). Finally, the type of road used can be identified combining the GPS and GIS data. Figure 1 shows an example of a graph of actual speed travelled as compared to posted speed.
A further exploration of driving behaviors can be found through exploration of specific driving actions that are important to safe driving, including lane changes, approaches to intersections, passing vehicles, turning left into oncoming traffic and merging into traffic from a ramp. A safe driver also needs to be able to react to changes in the driving environment, such as traffic light changes, other vehicles entering their path, pedestrians crossing the road, and the rare crash or close-call event.
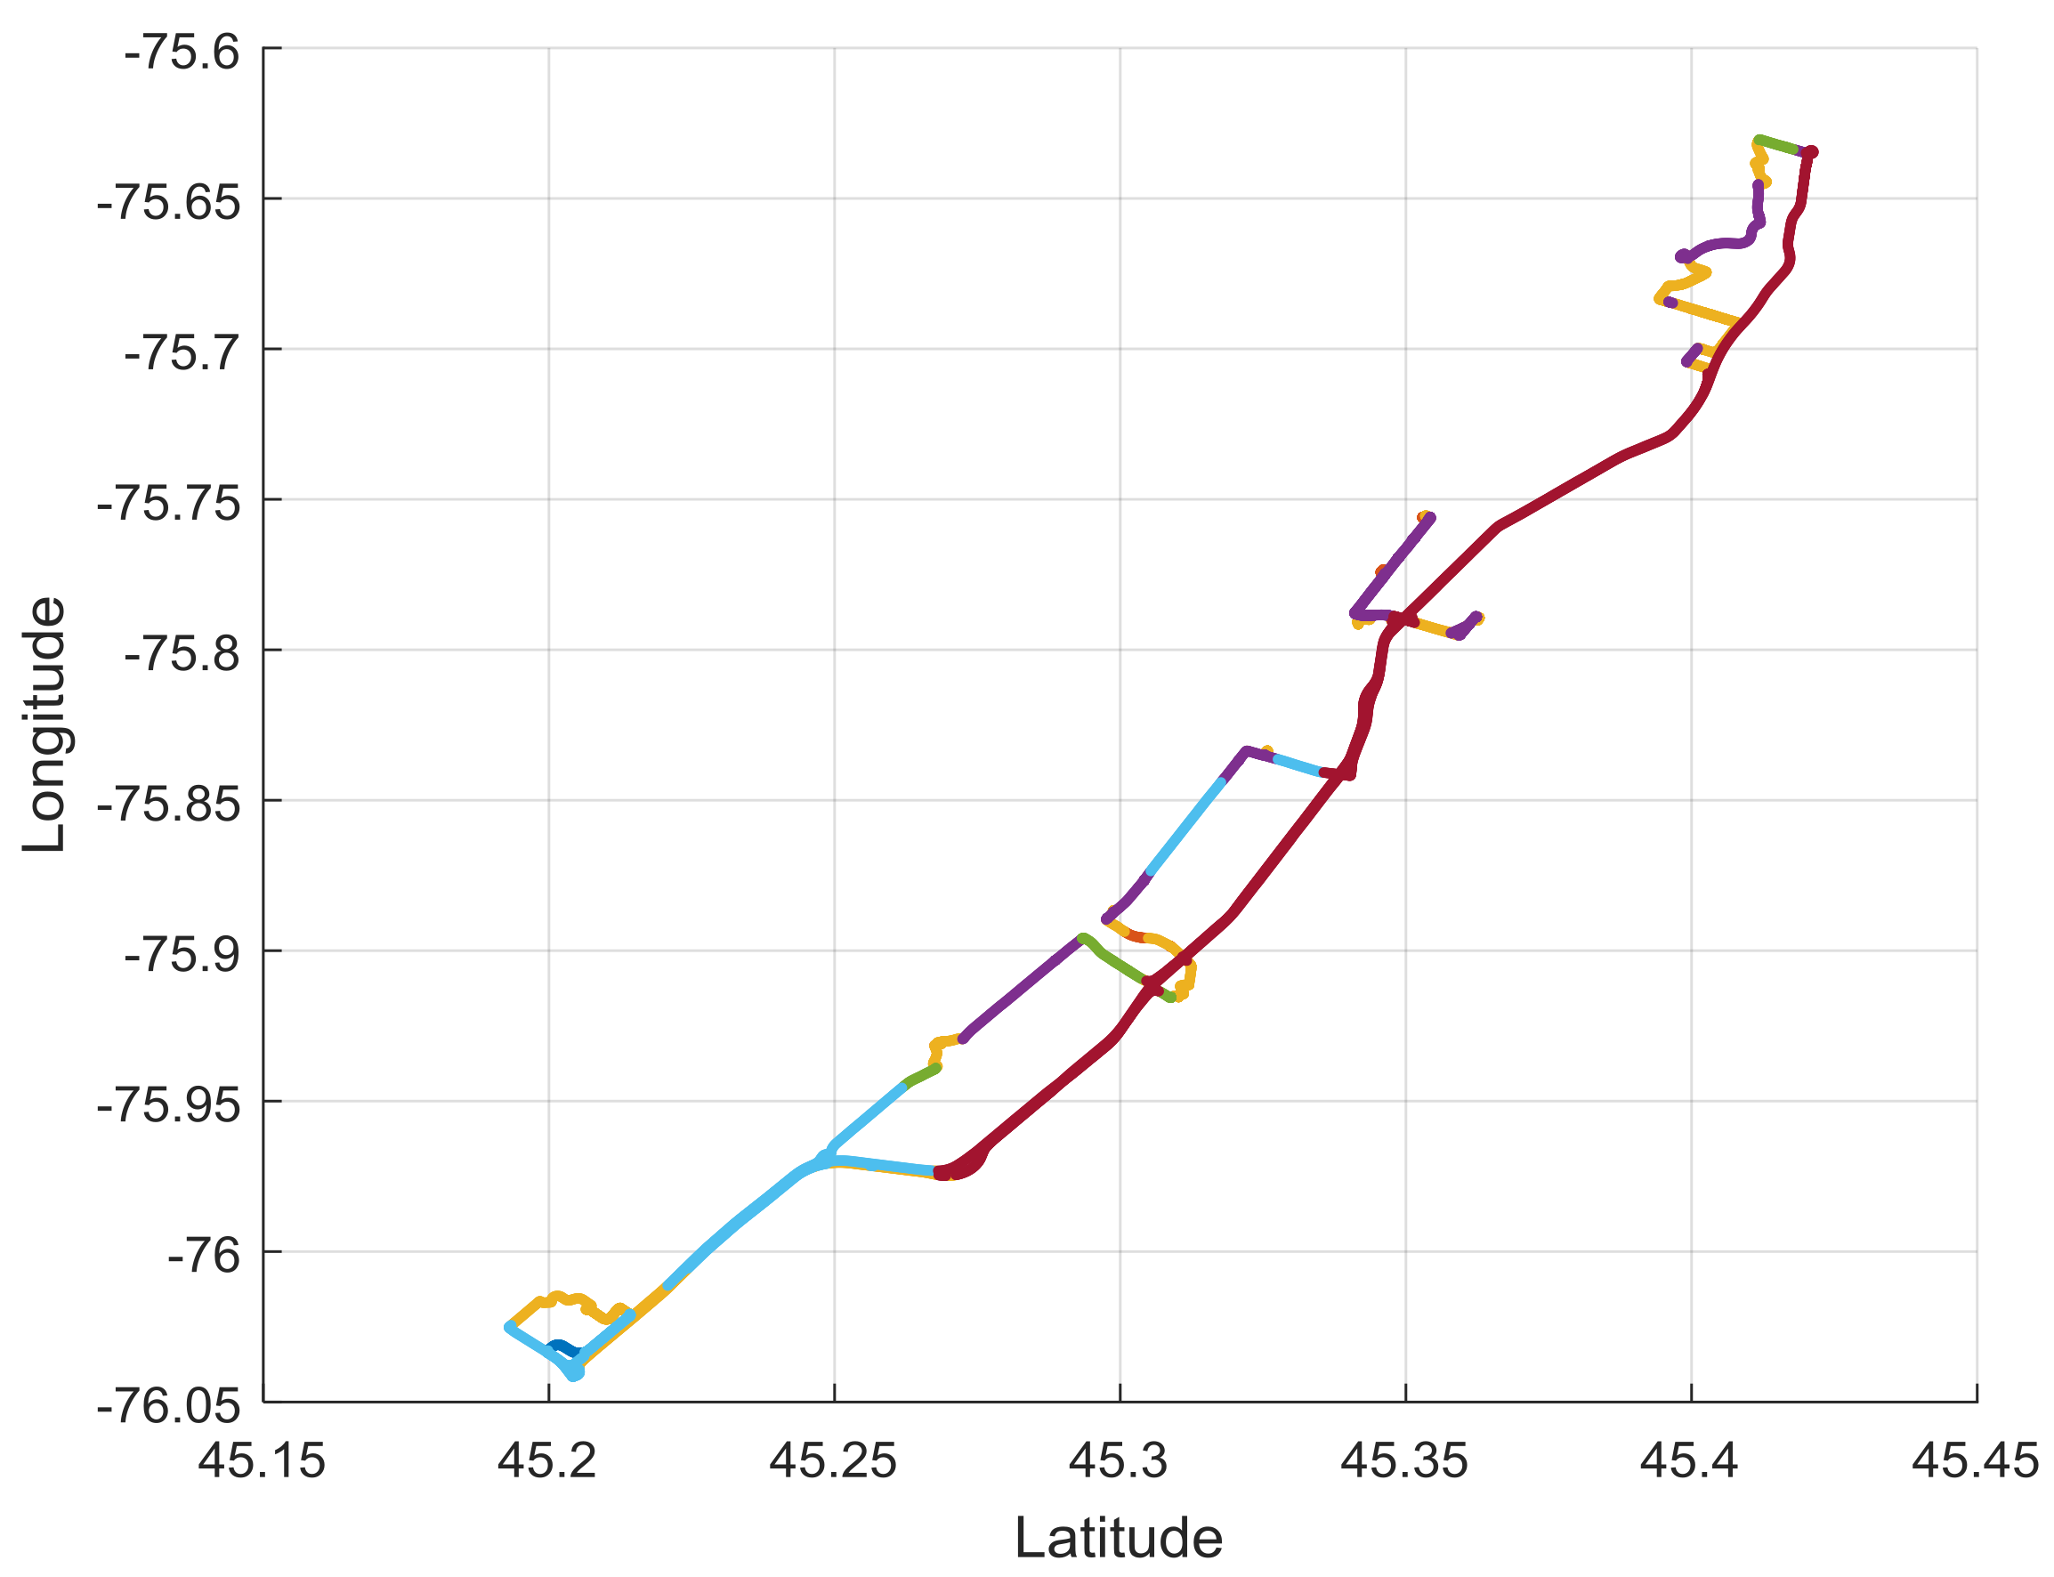
The analysis of trip level or trip sequence information leads to another category of driving measurement and decision making, as the destinations chosen by the driver can be analyzed. How many different destinations does the driver have and how far are the various destinations from each other and from home. Sequencing of destinations on a given day or within a few days can be valuable to study as well, allowing, for instance, calculations of driving efficiency. Figure 2 shows a sample day of driving with the type of road chosen superimposed.
Finally, all of these driving characteristics can be further categorized through comparison to environmental/external factors, including time of day, which allows identification of daylight and traffic density (i.e., rush hour), and weather, which includes seasons and actual road conditions (e.g., wetness, ice, snow). Time of day and weather conditions can have a dual effect on drivers: first, do they make decisions to drive or not related to these conditions, and second, do they adapt their driving characteristics accordingly?
4. Naturalistic Driving Results
4.1. Distance Travelled
The foundation measure of driving is related to the amount of driving. Prior to sensor-based measurement methods, this measure was performed using periodic odometer readings, leading to a measure of driving since the last recording. This was enhanced with the use of log-based systems to try to get an indication of frequency of driving. However, by definition, these measures are imprecise because of recall challenges, forgetting to log data, or forgetting to differentiate who was driving [19]. Through the use of sensor-based measurement methods, very detailed information on distance and duration of each trip can now be acquired [19,20]. Furthermore, this level of detail allows for precise measurements of frequency of trips (trips/day) and lengths of the individual trips (km/trip), which can be used to characterize an individual’s driving preferences and allow for their monitoring over time. Decreased driving distance in older adults could correlate to changes in physical or cognitive health, either directly or by self-regulation. Table 3 shows that the sample of convenience of Ottawa drivers with crashes showed a decline in total distance driven per year over the five years of the study.
4.2. Speed/Acceleration
Driver speed can be calculated using both the sensor attached to the engine computer and the speed calculated using the GPS. In addition, using the speed and time data allows the calculation of acceleration, which can be compared to the sensor information on the gas pedal position. Aggressive acceleration or deceleration can include hard/emergency stops [21,22,23]. The analysis of accelerations and decelerations has been shown to provide indications of behaviors that are distinctive between drivers [24,25] and changes in acceleration patterns again could reflect health changes. In addition, the speed data can be combined with Global Information Systems (GIS) data to provide information on road type, posted speed limit and other driving hazard/warnings such as school zones. The result is a rich data set that can now be analyzed to identify specific driving behaviors and measures of specific driving maneuvers. For instance, it is possible to determine if the driver typically travels above or below the posted speed limit and if they slowdown in school zones. Again, over time, a change in driving characteristics, such as increasingly driving below the speed limit, may be related to aging or changes in physical or cognitive health.
4.3. Destinations
Trips can also be analyzed to locate the destinations. Destinations include both the start and ending location and locations within a trip where the vehicle stopped for an extended period (but was left idling). Examples of destination-based analyses that are possible include measures of the frequency of occurrence of the various destinations, the distance each of the destinations are from home and the diversity of destinations [21,26]. Drivers with physical or cognitive health changes could take simpler trips by choosing destinations that are closer to home. Similarly, they may reduce destination diversity, suggesting a decreased ability to learn new destinations and maintain less frequently travelled destinations. Another measure of destination-based driving behavior that is now possible using data analysis is trip sequences within a day. Over time, drivers may reduce complexity of trips by shifting from multi-stop trips to trips where they leave home multiple times to single destinations. Drivers may also shift the actual destinations that they chose such as shopping at a single general store that is closer to home instead of more complex trips going to a wider group of specialty stores. A shift to more frequent and short trips could be an indication of a health change, such as memory decline, where they have to return to the store more frequently for forgotten items. The navigational choices made for the trips can also provide insights. Although it would not be expected that drivers would always take the fastest route between two locations, a change in the chosen route could be an indication of health concerns, such as avoidance of a highway or other higher-risk roads. The Ottawa sample in this study decreased the number of trips on freeways and the total number of trips over 50 km during the time of the study (Table 3).
4.4. Conditions
Date, time of day, and GPS location information can also be used to determine details about the specific conditions at the time of the trip. For example, the driver may avoid higher traffic periods such as morning or afternoon rush hours. The location information, along with time of day, allows for the solar cycle to be determined. This allows the categorization of trips between daylight driving and night, dawn, or dusk when reduced visibility can increase risk. Databases from local weather authorities, which provide daily or even hourly historical records of weather events, can be used to determine the drivers exposure to trips during poor weather (snow, rain, etc.) or if they are choosing to avoid driving during inclement weather events. The sample of older drivers in this paper typically showed less driving in winter months (December to March), since 27 to 28% of their driving occurred in 33% of the calendar year. In addition, there was a significant decline in winter driving over the five year study (Table 3).
4.5. Driver Identification
One of the challenges of using driving data from a vehicle is driver identification. In order to determine typical driving characteristics for a driver, or their driving signature, data from other drivers using that vehicle will interfere. Many older adults live with a spouse and may share a vehicle. Even those living alone may have others drive in certain circumstances. For instance, if traveling in their vehicle with their adult children, they may allow them to be the driver. Thus, to be able to have clean data, data from other drivers needs to be removed from the data set. Interestingly, all of the driving variables that can be used to describe driving behavior may also have an important role in removing the unwanted data. Our group has shown that the analysis of accelerations and decelerations can provide indications of behaviors that are distinctive between drivers [24,25], where 91 driver pairs were analyzed and the driver of over 90% of trips was correctly identified. With the addition of other variables, the performance was improved to over 95% for some driver pairs [27]. Ongoing work in this area will likely continue to improve the probability of correct driver identification [28].
5. Discussion
One way to measure driving ability is a naturalistic driving study. This type of study uses the person’s vehicle and usual driving patterns and routes for data collection and analysis. Naturalistic driving studies will soon allow clinicians to evaluate specific driving characteristics as well as choices around destinations and driving conditions. This unobtrusive and potentially cheaper type of observation will likely be more acceptable to older adults than formal driving tests and driving simulators. For this to occur, the clinician will have to be provided with a summary report of the knowledge from the driving study and not the raw driving data. Big data analytic techniques now have the capacity to extract clinically useful information out of big data sets. These data could be compared to norms over shorter periods of time to compare a given driver to their peers. In addition, a baseline of their driving ability and typical behaviors can be formed. Ongoing and future work needs to focus on the identification of driver behaviors that are indications of possible health changes [29]. Monitoring driving over longer periods would allow the identification of changes in driving ability for a given driver. Identification of these changes may help older drivers make changes to driving choices, e.g., rush hour driving and night driving, could lead to targeted training interventions and could eventually lead to decisions on driving cessation [30].
Interestingly, since driving is one of the more complex instrumental activities of daily living, some groups are suggesting that driving could be used as a measure to identify and monitor functional impairment associated with aging and physical and cognitive decline [31,32,33]. In the near future, analysis of driving changes may help clinicians to categorize cognitive decline as mild cognitive impairment or early dementia. It may be that changes in driving could be detected earlier than changes on some cognitive measures currently being used.
A significant number of challenges remain before naturalistic driving can be used clinically. First of all, the optimal choice of sensors to use and the frequency of measurement have not been determined. For instance, the use of cameras greatly enhances the quality of information that can be collected. However, not all drivers may be willing to give up the privacy associated with camera use and video takes up significant volumes of data. This data volume question is also relevant for the collection of the other driving data. On one hand, the more frequently data are collected, for instance every second (as in this study), the more precise the calculation of variations in speed and acceleration, and precise location. If data were collected every minute, there would be a 60-fold decrease in the volume of data collected, but calculations of speed and acceleration would be much less precise.
These data need to be stored and eventually transported to the place the data analysis happens. Data can be moved from the car manually 60 times more frequently or sent wirelessly at 60 times the unit cost. However, the continued expansion in the capacity of both storage devices and communication networks can quickly reduce the cost and other challenges associated with using higher-frequency sampling. Additionally, the increasing use of on-board computers will allow some pre-processing in-vehicle, further enabling higher sampling frequencies without needing to transport all the raw data.
Furthermore, a number of driving parameters are difficult to measure with recently used technologies. For instance, GPS and GIS data are not precise enough to determine lane position or position with respect to other vehicles. However, the proximity and lane position sensors currently being included for driver assist functions and adaptive cruise control could provide an alternative source of this information. While acute deceleration, for instance slamming on the brakes, can be determined from naturalistic driving data, the circumstances around the event would require additional information, such as video and likely information from other local vehicles. More work needs to be done to determine which sensors would be required and at what frequency they should be sampled.
The key limitations to long-term studies of a large number of drivers will include the challenge of collecting the data from the vehicles, processing the captured data, and the diversity in the sensor information that is available. The latter will continue to grow as newer vehicles continue to increase the number and types of sensors embedded in vehicles. In the short term, studies may have the challenge that there is too much variability in sensors being used affecting the quality of the data collected. This issue is also impacted by the renewal rate of the vehicles across the target population. The data collection solution can now take advantage of wireless networking including doing data uploads overnight using a residence Wi-Fi or even hot spots supported as needed by cellular-based data communications. Again, the emergence of cloud-based computing will allow the processing of the information to be run within computation that is shared, providing the scale needed while avoiding the cost of dedicated systems.
The increasing level of sensors within cars for automation will be both helpful and create additional challenges for future naturalistic driving studies. The addition of sensors that identify the location of the vehicle in the lane and measure the distance to the car in front are available in some vehicles today. The data from these sensors could easily be integrated into data sets to provide additional useful driving information. Again, this will complicate the data volume issue. Furthermore, many of these sensors are being used to improve safety. For instance, the sensors determining position in the lane will indicate drifting by shaking the steering wheel or even self-correcting the lane position. While these features will provide additional safety, they will decrease the ability of the driving data to help identify changes in true functioning of the older adults. In fact, these studies will likely not be correctly called “naturalistic” in the future if the vehicle has working “automation”.
6. Conclusions
Naturalistic driving studies are now increasingly possible given the rapid evolution of sensors and computers in vehicles. A number of driving parameters can be easily extracted from these data through the use of 1 Hz or even higher frequencies. These include driving characteristics such as number and distance of trips, speed and acceleration, position on the road, and choice of road type. Actions and reactions can also be measured from these data. When these data are combined with other readily available data, such as GIS and weather, choice of destination and driving conditions can be analyzed. Collecting these data will allow comparison of a driver with their peers and monitoring of driving change over time. Driving, as an instrumental activity of daily living, could be a measure of aging or physical and/or cognitive decline. The data extracted can also benefit the older driver by helping them choose to improve certain aspects of driving, to change their driving choices, or ultimately to decide to cease driving. Work in this area needs to continue in order to adapt to the increasing number and type of sensors and the parallel increasing amounts of data generated. Issues around data analysis and privacy will also continue to present challenges.
Acknowledgments
This work was supported by the Natural Sciences and Engineering Research Council (NSERC). This work uses data collected by the Candrive prospective study (www.candrive.ca), which is an interdisciplinary health-related research program dedicated to improving the safety of elderly drivers, funded by the Canadian Institutes of Health Research (CIHR). Additional support was provided by the Ottawa Hospital Research Institute, the Toronto Rehabilitation Institute, University Health Network, and the University of Manitoba. With thanks and appreciation to Michelle Porter for facilitating access to the data needed for this manuscript. The work was also supported by the Innovation Fund of the Alternative Funding Plan for the Academic Health Sciences Centres of Ontario.
Author Contributions
S.M. coordinated the collection of all Candrive data, in particular the Ottawa sub-set and connection to Ontario Ministry of Transport data. He provided access to the data used in this paper. B.W., R.G., F.K. and S.M. conceived and designed the analyses. B.W. connected the databases (Candrive, GIS, and weather). B.W. and R.G. wrote the algorithms for the analyses. B.W. performed the analyses. F.K. and B.W. wrote the first drafts of the paper, and R.G. and S.M. reviewed and provided valuable input to the final version.
Conflicts of Interest
The authors declare no conflict of interest. The funding sponsors had no role in the design of the study; in the collection, analyses, or interpretation of data; in the writing of the manuscript, or in the decision to publish the results.
References
- Manuel, D.; Garner, R.; Fines, P.; Bancej, C.; Flanagan, W.; Tu, K.; Reimer, K.; Chambers, L.; Bernier, J. Alzheimer’s and other dementias in Canada, 2011 to 2031: A microsimulation population health modeling (POHEM) study of projected prevalence, health burden, health services, and caregiving use. Popul. Health Metr. 2016, 14, 1–10. [Google Scholar] [CrossRef] [PubMed]
- McDowell, I. On behalf of the Canadian Study of Health and Aging Working Group. Canadian Study of Health and Aging: Study methods and prevalence of dementia. Can. Med. Assoc. J. 1994, 150, 899–913. [Google Scholar]
- Seeman, T.; Miller-Martinez, D.; Stein Merkin, S.; Lachman, M.; Tun, P.; Karlamangla, A. Histories of social engagement and adult cognition: Midlife in the U.S. study. J. Gerontol. B Psychol. Sci. Soc. Sci. 2011, 66 (Suppl. S1), i141–i152. [Google Scholar] [CrossRef] [PubMed]
- Zunzunegui, M.; Alvarado, B.; Del Ser, T.; Otero, A. Social networks, social integration, and social engagement determine cognitive decline in community-dwelling Spanish older adults. J. Gerontol. B Psychol. Sci. Soc. Sci. 2003, 58, S93–S100. [Google Scholar] [CrossRef] [PubMed]
- Marottoli, R.; Mendes de Leon, C.; Glass, T.; Williams, C.; Cooney, L., Jr.; Berkman, L. Consequences of Driving Cessation: Decreased Out-of-Home Activity Levels. J. Gerontol. B Psychol. Sci. Soc. Sci. 2000, 55, S334–S340. [Google Scholar] [CrossRef] [PubMed]
- Petersen, R.; Stevens, J.; Ganguli, M.; Tangalos, E.; Cummings, J.; DeKosky, S. Practice parameter: Early detection of dementia: Mild cognitive impairment (an evidence-based review): Report of the Quality Standards Subcommittee of the American Academy of Neurology. Neurology 2001, 56, 1133–1142. [Google Scholar] [CrossRef] [PubMed]
- Petersen, R. Mild Cognitive Impairment. N. Engl. J. Med. 2011, 364, 2227–2234. [Google Scholar] [CrossRef] [PubMed]
- Doraiswamy, P.; Kaiser, L.; Bieber, F.; Garman, R. The Alzheimer’s Disease Assessment Scale: Evaluation of Psychometric Properties and Patterns of Cognitive Decline in Multicenter Clinical Trials of Mild to Moderate Alzheimer’s Disease. Alzheimer Dis. Assoc. Disord. 2001, 15, 174–184. [Google Scholar] [CrossRef] [PubMed]
- Molnar, F.J.; Byszewski, A.M.; Rapoport, M.; Dalziel, W.B. Practical experience-based approaches to assessing fitness to drive in dementia. Geriatr. Aging 2009, 12, 83–92. [Google Scholar]
- Gibbons, C.; Smith, N.; Middleton, R.; Clack, J.; Weaver, B.; Dubois, S.; Bédard, M. Using serial trichotomization with common cognitive tests to screen for fitness to drive. Am. J. Occup. Ther. 2017, 71, 1–8. [Google Scholar] [CrossRef]
- Brooks, J.O.; Goodenough, R.R.; Crisler, M.C.; Klein, N.D.; Alley, R.L.; Koon, B.L.; Wills, R.F. Simulator sickness during driving simulation studies. Accid. Anal. Prev. 2010, 42, 788–796. [Google Scholar] [CrossRef] [PubMed]
- Classen, S.; Bewernitz, M.; Shechtman, O. Driving simulator sickness: An evidence-based review of the literature. Am. J. Occup. Ther. 2011, 65, 179–188. [Google Scholar] [CrossRef] [PubMed]
- Marshall, S.C.; Man-Son-Hing, M.; Bedard, M.; Charlton, J.; Gagnon, S.; Gelinas, I.; Myers, A. Protocol for Candrive II/Ozcandrive, a multicentre prospective older driver cohort study. Accid. Anal. Prev. 2013, 61, 245–252. [Google Scholar] [CrossRef] [PubMed]
- Marshall, S.C.; Wilson, K.G.; Man-Son-Hing, M.; Stiell, I.; Smith, A.; Weegar, K.; Molnar, F.J. The Canadian Safe Driving Study—Phase I pilot: Examining potential logistical barriers to the full cohort study. Accid. Anal. Prev. 2013, 61, 236–244. [Google Scholar] [CrossRef] [PubMed]
- Hallmark, S.; McGehee, D.; Bauer, K.M.; Hutton, J.M.; Davis, G.A.; Hourdos, J.; Rootzén, H. Initial Analyses from the SHRP 2 Naturalistic Driving Study: Addressing Driver Performance and Behavior in Traffic Safety. Transportation Research Board, No. SHRP 2 Safety Project S08; National Academy of Science: Washington, DC, USA, 2013. [Google Scholar]
- Campbell, K.L. The SHRP 2 naturalistic driving study: Addressing driver performance and behavior in traffic safety. TR News 2012, 282, 30–35. [Google Scholar]
- Dingus, T.A.; Klauer, S.G.; Neale, V.L.; Petersen, A.; Lee, S.E.; Sudweeks, J.D.; Bucher, C. The 100-Car Naturalistic Driving Study, Phase II-Results of the 100-Car Field Experiment; No. HS-810 593; Transportation Research Board: Washington, DC, USA, 2006. [Google Scholar]
- Wallace, B.; Goubran, R.; Knoefel, F.; Marshall, S.; Porter, M.; Smith, A. Automation of the Validation, Anonymization and Augmentation of Big Data from a Multi-year Driving Study. In Proceedings of the 2015 IEEE Big Data Congress, New York, NY, USA, 27 June–2 July 2015; pp. 608–614. [Google Scholar]
- Marshall, S.C.; Wilson, K.G.; Molnar, F.J.; Man-Son-Hing, M.; Stiell, I.; Porter, M.M. Measurement of driving patterns of older adults using data logging devices with and without global positioning system capability. Traffic Inj. Prev. 2007, 8, 260–266. [Google Scholar] [CrossRef] [PubMed]
- Smith, G. Seasonal Variation in Older Adults’ Driving Trip Distances. Master’s Thesis, University of Manitoba, Winnipeg, MB, Canada, 2014. Available online: http://hdl.handle.net/1993/23427 (accessed on 17 February 2015).
- Wallace, B.; Goubran, R.; Knoefel, F.; Marshall, S.; Porter, M. Measuring variation in driving habits between drivers. In Proceedings of the IEEE International Symposium on Medical Measurements and Applications (MeMeA), Lisboa, Portugal, 11–12 June 2014; pp. 1–6. [Google Scholar]
- Wallace, B.; Rockwood, M.; Goubran, R.; Knoefel, F.; Marshall, S.; Porter, M. Measurement of vehicle acceleration in studies of older drivers from GPS position and OBDII velocity sensors. In Proceedings of the IEEE International Symposium on Medical Measurements and Applications (MeMeA), Turin, Italy, 7–9 May 2015; pp. 391–396. [Google Scholar]
- Wallace, B.; Puli, A.; Goubran, R.; Knoefel, F.; Marshall, S.; Porter, M.; Smith, A. Big data analytics to identify deceleration characteristics of an older driver. In Proceedings of the IEEE International Symposium on Medical Measurements and Applications (MeMeA), Turin, Italy, 7–9 May 2015; pp. 89–94. [Google Scholar]
- Wallace, B.; Puli, A.; Goubran, R.; Knoefel, F.; Marshall, S.; Porter, M.; Smith, A. Measurement of distinguishing features of stable cognitive and physical health of older drivers. IEEE Trans. Instrum. Meas. 2016, 65, 1990–2001. [Google Scholar] [CrossRef]
- Wallace, B.; Goubran, R.; Knoefel, F.; Marshall, S.; Porter, M.; Smith, A. Driver Unique Acceleration Behaviours and Stability over Two Years. In Proceedings of the IEEE International Congress on Big Data, San Francisco, CA, USA, 12–14 June 2016; pp. 230–235. [Google Scholar]
- Wallace, B.; Knoefel, F.; Goubran, R. Measurement of driving routes and correlation to optimal navigation paths. In Proceedings of the IEEE International Congress on Instrumentation and Measurement Technology Conference (I2MTC), Minneapolis, MN, USA, 6–9 May 2013; pp. 1465–1470. [Google Scholar]
- Wallace, B.; Knoefel, F.; Goubran, R.; Porter, M.; Smith, A.; Marshall, S. Features that Distinguish Drivers in Longitudinal Driving Studies. Serv. Trans. Big Data (STBD) 2017, 4, 20–32. [Google Scholar]
- Fung, N.; Wallace, B.; Chan, A.; Goubran, R.; Marshall, S.; Porter, M.; Knoefel, F. Driver Identification Using Vehicle Acceleration and Deceleration Events from Naturalistic Driving of Older Drivers. In Proceedings of the IEEE International Symposium on Medical Measurements and Applications (MeMeA), Rochester, MN, USA, 7–10 May 2017; pp. 33–38. [Google Scholar]
- Howcroft, J.; Wallace, B.; Goubran, R.; Marshall, M.; Porter, M.; Knoefel, F. Changes in Driving Acceleration Pattern Variability Related to Cognitive and Physical Health. In Proceedings of the IEEE Conference on Biomedical and Health Informatics (BHI), Las Vegas, NV, USA, 4–7 March 2018. [Google Scholar]
- Man-Son-Hing, M.; Marshall, S.C.; Molnar, F.J.; Wilson, K.G. Systematic review of driving risk and the efficacy of compensatory strategies in persons with dementia. J. Am. Geriatr. Soc. 2007, 55, 878–884. [Google Scholar] [CrossRef] [PubMed]
- Sherman, F.T. Driving the ultimate IADL. Geriatrics 2006, 61, 9–10. [Google Scholar] [PubMed]
- Lindstrom-Forneri, W.; Tuokko, H.A.; Garrett, D.; Molnar, F. Driving as an everyday competence: A model of driving competence and behavior. Clin. Gerontol. 2010, 33, 283–297. [Google Scholar] [CrossRef]
- Dickerson, A.E.; Reistetter, T.; Davis, E.S.; Monahan, M. Evaluating driving as a valued instrumental activity of daily living. Am. J. Occup. Ther. 2011, 65, 64–75. [Google Scholar] [CrossRef] [PubMed]
Figure 1.
Driving speed (blue) as compared to posted speed (orange) of a trial trip by one of the authors (B.W.).
Figure 1.
Driving speed (blue) as compared to posted speed (orange) of a trial trip by one of the authors (B.W.).

Figure 2.
Single day of driving by one of the authors (B.W.) showing the choice of roads through the posted speed limits. (Dark Blue: not road, orange: 40 km/h, yellow: 50 km/h, purple: 60 km/h, green: 70 km/h, light blue: 80 km/h, red: 100 km/h).
Figure 2.
Single day of driving by one of the authors (B.W.) showing the choice of roads through the posted speed limits. (Dark Blue: not road, orange: 40 km/h, yellow: 50 km/h, purple: 60 km/h, green: 70 km/h, light blue: 80 km/h, red: 100 km/h).


Table 1.
Demographics of convenience sample of older drivers.
| Characteristic | Drivers with Crash (n = 59) | Total Ottawa Set (n = 256) |
|---|---|---|
| % Female | 44.1 | 35.9 |
| Average Age | 76.3 (4.13) | 76.3 (4.49) 1 |
| Av. Age licensed | 18.7 (4.12) | 19.4 (5.83) |
| Av. # Yrs driven | 57.7 (5.99) | 56.8 (6.92) |
1 All numbers expressed as Mean (Standard Deviation).
Table 2.
Driving parameters.
| Characteristics | How much do they drive? | Number of trips |
| Distance per trip | ||
| Distance per time of day | ||
| Distance per season | ||
| Distance per year | ||
| How they drive: Speed/acceleration? | Straight/turning | |
| Vs. posted speed | ||
| Vs. initial/final velocity | ||
| How they drive: Position on road? | Position in the lane | |
| Distance to other cars | ||
| Where do they drive? | Residential roads | |
| Local roads (50–70 km/h) | ||
| Undivided highway (80–90 km/h) | ||
| Divided Freeway (100 km/h+) | ||
| Actions/Reactions | Actions | Lane changing |
| Approaching intersections | ||
| Passing | ||
| Turning left into traffic | ||
| Merging | ||
| Reactions | Traffic light changes | |
| Other vehicles | ||
| Pedestrians | ||
| Crash risk | ||
| Destinations | Variety and distance | |
| Sequencing | ||
| Route planning at trip sequence level | ||
| Navigation within a trip | ||
| Conditions | Time of day (e.g., rush hour, daylight) | |
| Season/Weather | ||
Table 3.
Driving characteristics of older drivers over five years.
| Characteristic | Year 1 (n = 59) | Year 3 (n = 47) | Year 5 (n = 35) | p (Years 1–5) |
|---|---|---|---|---|
| # Trips | 1510 (150) | 1390 (518) | 1210 (463) | ** |
| Dist/trip (km) | 9.44 (3.46) | 8.81 (2.95) | 8.83 (2.91) | |
| Dist/year (km) | 14,000 (6660) | 11,800 (5240) | 10,500 (4630) 1 | ** |
| # Trips Freeway | 1810 (1380) | 1690 (1470) | 1470 (1180) | |
| # Trips 50+ km | 38.4 (48.0) | 24.5 (23.3) | 21.9 (12.2) | * |
| # Trips Night | 110 (89.2) | 90.0 (85.9) | 75.6 (59.2) | * |
| Night Dist (km) | 1100 (846) | 925 (791) | 791 (577) | * |
| Winter Dist (km) | 4060 (2950) | 3360 (2380) | 2840 (1780) | * |
| Winter % | 28.0 (10.8) | 27.2 (7.5) | 27.0 (12.2) |
1 All numbers expressed as Mean (Standard Deviation). * p < 0.05, ** p < 0.01.
© 2018 by the authors. Licensee MDPI, Basel, Switzerland. This article is an open access article distributed under the terms and conditions of the Creative Commons Attribution (CC BY) license (http://creativecommons.org/licenses/by/4.0/).
Share and Cite
MDPI and ACS Style
Knoefel, F.; Wallace, B.; Goubran, R.; Marshall, S. Naturalistic Driving: A Framework and Advances in Using Big Data. Geriatrics 2018, 3, 16. https://0-doi-org.brum.beds.ac.uk/10.3390/geriatrics3020016
AMA Style
Knoefel F, Wallace B, Goubran R, Marshall S. Naturalistic Driving: A Framework and Advances in Using Big Data. Geriatrics. 2018; 3(2):16. https://0-doi-org.brum.beds.ac.uk/10.3390/geriatrics3020016
Chicago/Turabian StyleKnoefel, Frank, Bruce Wallace, Rafik Goubran, and Shawn Marshall. 2018. "Naturalistic Driving: A Framework and Advances in Using Big Data" Geriatrics 3, no. 2: 16. https://0-doi-org.brum.beds.ac.uk/10.3390/geriatrics3020016