Article

Using Naturalistic Driving Data to Predict Mild Cognitive Impairment and Dementia: Preliminary Findings from the Longitudinal Research on Aging Drivers (LongROAD) Study

1
Department of Civil Engineering and Engineering Mechanics, Columbia University, New York, NY 10027, USA
2
Department of Epidemiology, Colorado School of Public Health, University of Colorado Anschutz Medical Campus, Aurora, CO 80045, USA
3
Transportation Research Institute, University of Michigan, Ann Arbor, MI 48109, USA
4
Center for Advancing Transportation Leadership and Safety (ATLAS Center), Ann Arbor, MI 48109, USA
5
School of Public Health, University of California San Diego, La Jolla, CA 92093, USA
6
Department of Epidemiology, Columbia University Mailman School of Public Health, New York, NY 10032, USA
7
Center for Injury Science and Prevention, Columbia University Irving Medical Center, New York, NY 10032, USA
8
Bassett Research Institute, Cooperstown, NY 13326, USA
9
Department of Psychiatry, Columbia University Vagelos College of Physicians and Surgeons, New York, NY 10032, USA
10
Department of Anesthesiology, Columbia University Vagelos College of Physicians and Surgeons, New York, NY 10032, USA
*
Author to whom correspondence should be addressed.
Submission received: 22 March 2021 / Revised: 13 April 2021 / Accepted: 21 April 2021 / Published: 23 April 2021
(This article belongs to the Special Issue Driving, Aging, Safety and Health)

Abstract

:
Emerging evidence suggests that atypical changes in driving behaviors may be early signals of mild cognitive impairment (MCI) and dementia. This study aims to assess the utility of naturalistic driving data and machine learning techniques in predicting incident MCI and dementia in older adults. Monthly driving data captured by in-vehicle recording devices for up to 45 months from 2977 participants of the Longitudinal Research on Aging Drivers study were processed to generate 29 variables measuring driving behaviors, space and performance. Incident MCI and dementia cases (n = 64) were ascertained from medical record reviews and annual interviews. Random forests were used to classify the participant MCI/dementia status during the follow-up. The F1 score of random forests in discriminating MCI/dementia status was 29% based on demographic characteristics (age, sex, race/ethnicity and education) only, 66% based on driving variables only, and 88% based on demographic characteristics and driving variables. Feature importance analysis revealed that age was most predictive of MCI and dementia, followed by the percentage of trips traveled within 15 miles of home, race/ethnicity, minutes per trip chain (i.e., length of trips starting and ending at home), minutes per trip, and number of hard braking events with deceleration rates ≥ 0.35 g. If validated, the algorithms developed in this study could provide a novel tool for early detection and management of MCI and dementia in older drivers.

1. Introduction

As aging of the US population accelerates, the number of older drivers continues to rise. According to the US Census Bureau, there were over 49 million older adults (aged 65 years and older) in the United States in 2016, accounting for 15% of the population [1]. The number of older adults with a driver’s license in the United States is expected to increase from 42 million (or 85% of the older adult population) in 2016 to 63 million in 2030 [2]. While driving allows older adults to meet their mobility needs and to stay independent, age-related functional declines, medical conditions, and side effects of medications can compromise driving abilities and lead to heightened crash risk. In addition, atypical changes in driving behaviors may be early signals of cognitive function declines and dementia. To determine whether a recent history of unsafe driving was associated with cognitive impairment, Ott et al. [3] recorded traffic violations and crashes in the previous 3 years for middle-aged and older patients of an outpatient memory clinic who were cognitively normal or diagnosed with mild cognitive impairment (MCI) or Alzheimer’s disease (AD). In addition to the diagnostic categories, all study participants were classified according to levels of brain amyloid deposits. A significant positive association between the history of crashes and violations with amyloid brain burden was observed at levels below the usual threshold corresponding with moderate to frequent amyloid plaques. In a series of studies based on driving data, Roe and colleagues [4,5,6,7] assessed associations between driving difficulties and AD biomarkers in older adults rated as cognitively normal based on a Clinical Dementia Rating score of 0. Their initial data indicated that levels of brain amyloid burden and cerebrospinal fluid (CSF) biomarkers of neurofibrillary tangles were positively correlated with the number of driving errors during a 12-mile parking lot and road test [5,6]. By repeating the road test annually over a 3.5-year period for the same cohort, Roe et al. [4] and Babulal et al. [8,9,10] showed that the CSF biomarkers predicted time to the participant’s driving test being rated as marginal or a failure. It is worth noting that amyloid biomarkers appear to be associated with driving performance but not with global cognitive test scores, implying that the assessment of driving may be a useful strategy for the early detection of cognitive declines.
Several studies have demonstrated that atypical changes in driving performance and driving behaviors could be detected in older drivers with preclinical AD [4,5,6] and early-stage dementia [11], and that these changes may progress throughout the trajectory of AD [4,5,6,7,12]. In recent years, naturalistic driving study designs have been used for understanding driving behaviors in older adults with preclinical AD [7] and early-stage dementia [11]. Reported changes in older drivers with preclinical AD or early-stage dementia include declines in driving performance, such as increased incidence of getting lost in traffic [11], increased risk of failing a driving test [5,6] and reduced spatial navigation ability [13], and atypical driving behaviors, such as decreased driving exposure (e.g., fewer driving trips, driving days, driving destinations, nighttime driving and rush-hour driving) [7], restricted driving space (e.g., less freeway driving and more driving within 5–10 miles of home) [7,11], and reduced unsafe driving behaviors (e.g., fewer hard braking events and speeding events) [10].
While these naturalistic driving studies help to link driving behavior changes to the risk of MCI/dementia, they are largely limited to piloting data with small sample sizes and short follow-up durations. The AAA Longitudinal Research on Aging Drivers (LongROAD) project is the largest naturalistic driving study of older drivers in the United States [14]. Using preliminary data from the LongROAD project and machine learning techniques, we assessed the utility of objectively measured driving variables in predicting MCI and dementia in older adults. If confirmed, our findings may help to improve early detection and management of MCI and dementia.

2. Materials and Methods

2.1. LongROAD Study

The LongROAD study is a multisite prospective cohort study of 2990 active drivers aged 65 to 79 years at the time of enrollment. The LongROAD study includes five data collection sites: Ann Arbor, MI; Baltimore, MD; Cooperstown, NY; Denver, CO; and San Diego, CA. Eligibility criteria were established to ensure that study participants were relatively healthy, active drivers aged 65–79 years at the time of enrollment, who would likely be available to be assessed annually through the duration of the study. Among those excluded from the LongROAD study were drivers with Six-Item Screener score < 4, having significant cognitive impairment or being diagnosed with degenerative medical conditions, such as AD, Huntington’s disease, and Parkinson’s disease [14].
The data used in this study spanned the time period from August 2015 through March 2019. Naturalistic driving data were available for 2977 participants, among whom 33 were newly diagnosed with MCI and 31 with dementia up to April 2019. These incident MCI and dementia cases were ascertained from the review of participants’ medical records and the annual interviews [14]. As dementia is a progressive disease and follow-up interviews were conducted annually, it was not possible to delineate the month when the conversion from MCI to dementia occurred. Thus, we classified the MCI/dementia status as a binary variable (yes/no).
The driving behavior profile contains 29 variables that were aggregated monthly and derived from the in-vehicle recording device “DataLogger” (Danlaw, Inc., Novi, MI, USA). Their definitions and the statistics are detailed in Table 1.

2.2. Monthly Record Classification

To fully utilize all time-dependent driving data, we treated each monthly record as an independent data point. The data point sizes of health and MCI/dementia were 89,380 and 1063, respectively, with a total of 90,443 data points. Each data point, x, included 33 covariates (i.e., 4 demographic variables and 29 driving variables). The disease status, y, was defined as 0 if healthy or 1 if MCI/dementia. We aimed to develop a classifier to predict the disease status y using data point x.

2.3. Five Classification Models

A robust classification technique that involves building multiple decision trees, random forests (RFs) were used to classify the disease status for a given data point. All the analyses were performed in the R environment with Version 1.3.1056.
For each model, we tried five groups of covariates, one with age only, one with demographic characteristics (i.e., age, sex, race/ethnicity, and education) only, one with driving variables only, one with age and driving variables, and one with demographic characteristics and driving variables. Building upon these groups of covariates, we quantitatively assessed the relative contributions of age and other demographics and driving variables to the RF model performance in classifying disease status.

2.4. Random Forests

We used RFs for 3 reasons: (1) RF is a versatile and powerful ensemble learning classifier capable of fitting complex datasets; (2) RF is more computationally efficient than other classification models, such as artificial neural networks; and (3) RF provides highly interpretable results through importance rankings of covariates.

2.4.1. Performance Metrics

To evaluate the performance of the classification models on test datasets, we focused on 3 metrics: precision, recall, and F1 score. These metrics measure different aspects of the performance of the classifier and are better suited to different outcomes. For example, if our goal is to train a classifier to detect those with potential dementia symptoms in order to intervene at an early stage and allow them to be treated in time, then a classifier that captures almost all participants exhibiting early signs of dementia (i.e., high recall or sensitivity) at the expense of some false positives is preferable. If the goal is to train a classifier to inform those who are likely to develop dementia without misidentifying too many of those who are likely not, then a classifier that minimizes the false positives (i.e., a healthy participant is identified for dementia) and has high precision (i.e., positive predictive value) is preferable. If the goal is to demonstrate the feasibility of using driving variables to detect MCI and dementia, then recall and precision should be balanced. The F1 score, which is the harmonic mean of recall and precision, was used to measure the overall performance of the classifier. A classifier with a high F1 score could be valuable for early detection of MCI/dementia as well as for improving driving safety. In addition, we calculated the area under the receiver operating characteristic curve (AUC) as a measure of validity for model discrimination.
To train RF classifiers, we needed to first divide the dataset into a test dataset and a training dataset.

2.4.2. Test Data Selection

We randomly selected 77 healthy and 102 MCI/dementia data points as the test or validation data, which were used to evaluate RF classifiers with performance metrics. We deliberately selected more MCI/dementia points than healthy points to ensure adequate data for assessing the accuracy of the RF classifiers.

2.4.3. Training Data Rebalance

The training data were the remaining data points after the selected test data were removed from the total dataset. As the total dataset was highly imbalanced (with many more healthy data points than MCI/dementia points) and could cause training bias, we needed to first rebalance the training data.
The data were highly skewed from both the perspective of drivers and monthly records. Of the 2977 participants included in this study, only 64 (2.1%) developed MCI/dementia during the follow-up. Of the 90,443 monthly data records, 89,380 were healthy points (labeled as 0) and 1063 were MCI/dementia points (labeled as 1). The monthly data had a healthy versus MCI/dementia class ratio of 84:1. In other words, the MCI/dementia monthly data accounted for only 1.2% of the entire dataset.
To mitigate the imbalance issue, we applied the synthetic minority oversampling technique (SMOTE) to oversample the dementia data points such that the amount of dementia class was comparable to that of the healthy class without compromising the total sample size too much. We oversampled the dementia data points and generated synthetic MCI/dementia samples using existing MCI/dementia data while undersampling the healthy points to make the healthy–MCI/dementia class ratio close to 0.95:1. This was carried out using the R function “SMOTE” in the package “DMwR”. After rebalancing, the training dataset contained 39,401 records with 19,220 healthy and 20,181 MCI/dementia records.

2.4.4. Parameter Tuning

Parameter tuning helps to control the training process and improve the result. The tuned parameters were divided into 2 types: RF parameters and prediction cutoff threshold. In RF training, the key parameter was “mtry” (i.e., number of variables randomly collected to be sampled at each split node). In the prediction stage, RF could predict a crisp class label or a continuous probability score. In the latter case, an optimal “decision threshold” would be crucial to convert from a probability score to a crisp class label. For a balanced dataset, 0.5 is often used as the optimal threshold. However, for imbalanced classification, the optimal threshold needs to be tuned.
To tune these parameters, 10-fold cross-validation was employed. In other words, the training set was split into 10 folds where a RF model was trained with nine folds and evaluated on the remaining fold. A grid search was performed on a combination of parameter values and the optimal ones were selected based on the highest F1 score.

3. Results

3.1. Model Comparison

Table 2 displays the performance metrics and confusion matrix of the five RF models evaluated on the test dataset. Each row represents one classification model with one particular group of covariates. Models 1, 2, 3, 4, and 5 refer to the ones with the covariate of age only, demographic characteristics (i.e., age, sex, race, and education) only, driving variables only, both age and driving variables, and both demographic characteristics and driving variables, respectively.
Model 5 with combined demographic characteristics and driving variables achieved the highest F1 score of 0.88, followed by Model 4, with a F1 score of 0.81. Contrasting Model 4 with Model 1 revealed that adding driving variables increased the validity of the MCI/dementia prediction from 0.11 based on age only to 0.81. Model 1 (with age only) achieved a perfect precision (1.00) but a poor recall (0.06), while Model 3 (with driving variables only) achieved a fair recall (0.56) and a moderate precision (0.79). Combining age and driving variables, Model 4 demonstrated both a high precision (0.89) and a moderate recall (0.74). Likewise, contrasting Model 5 to Model 2 revealed that adding driving variables increased the validity in predicting MCI/dementia from 0.29 to 0.88.

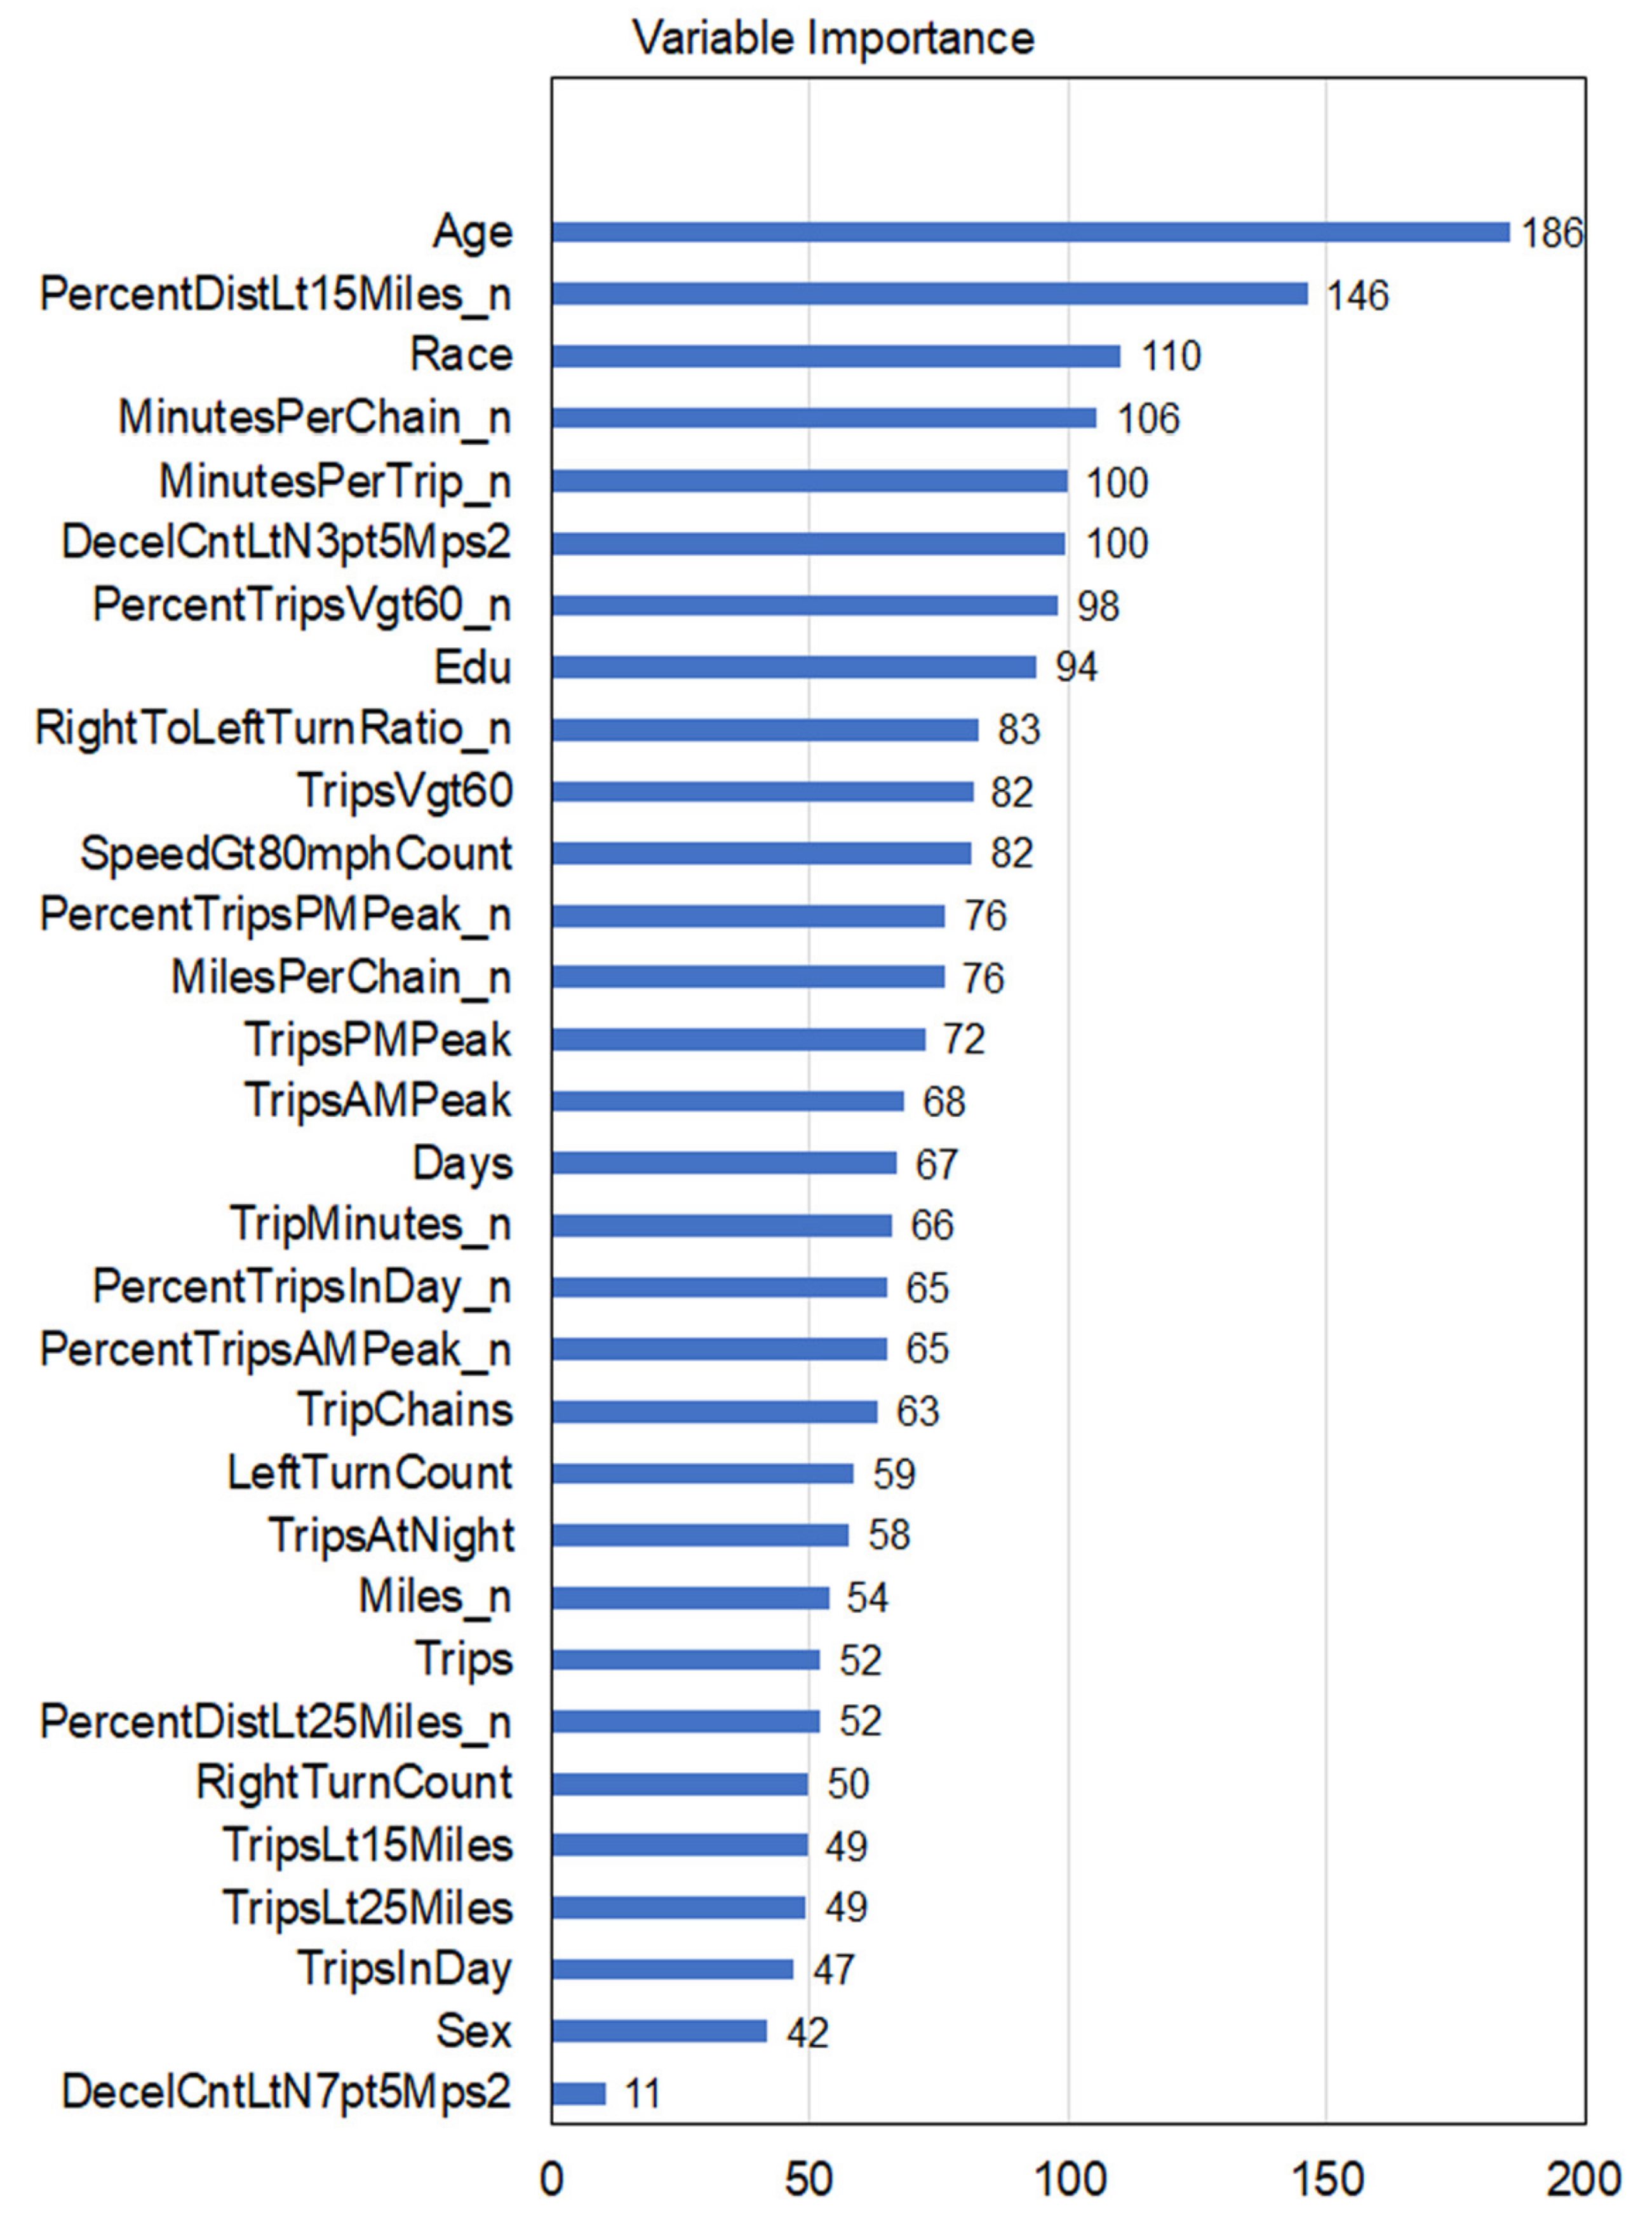
3.2. Feature Importance Ranking

To assess the relative importance of each covariate in building RF classifiers, we plotted the feature importance ranking in terms of “mean decrease accuracy”, shown in Figure 1. Mean decrease accuracy measures a covariate’s importance by quantifying how much the tree nodes that use the covariate at a split reduce predicted accuracy on average. Age was the most important feature in developing the classifiers. Among driving variables and other demographics, the top five covariates were: percent of driving distance less than 15 miles from home (PercentDistLt15Miles_n), race/ethnicity (Race), minutes per trip chain (MinutesPerChain_n), minutes per trip (MinutesPerTrip_n), and number of hard braking events with deceleration rates ≥ 0.35 g (DecelCntLtN3pt5Mps2). These covariates were related to different aspects of driving: “PercentDistLt15Miles_n” reflecting the driving space, “MinutesPerChain_n” and “MinutesPerTrip_n) representing driving time duration, and “DecelCntLtN3pt5Mps2” indicating unsafe driving maneuver.

4. Discussion

We trained five RF classifiers with two groups of covariates, demographic characteristics (i.e., age, sex, race/ethnicity and education) and driving variables. The one with both demographic characteristics and driving variables showed an overall predictive validity of 88%, implying that using both the knowledge of basic demographics and driving behavior could accurately predict if one has MCI/dementia. However, even using driving variables only achieved a reasonably good predictive performance, especially if our goal is to identify those exhibiting early signs of MCI/dementia.
This study is among the first to assess the feasibility of using a large amount of naturalistic driving data and machine learning techniques to detect MCI/dementia. The usefulness of driving data in MCI/dementia classification could have important implications for the screening and early treatment of MCI and dementia. Early detection of MCI and dementia may also help improve driving safety for older adults. It is worth noting that this study assessed the value of driving behavior in predicting MCI/dementia rather than the influence of MCI/dementia on driving behavior as shown in previous studies [3,4,5,6,7,8,9,10,11,12,13].
The novelty of this study also lies in the application of machine learning techniques (i.e., random forests models) in a series of experiments based on naturalistic driving data to investigate the relationship between changes in driving behaviors, space and performance and the risk of MCI/dementia. The classifiers with driving variables produce much higher F1 scores than those with age and other demographic characteristics. Safe driving requires essential cognitive and physical functions and perceptual motor skills. As a complex task involving dynamic cognitive processes, naturalistic driving behavior features can be used as comprehensive and reliable phenotypic markers to detect preclinical AD, MCI and dementia [15].
A notable limitation of this study is the modest number of incident MCI and dementia cases. As a result, we included driving behavior features across all the study participants in the classification algorithms without specifying which records belong to whom, or considering time-series sequences of those driving features. It is also noteworthy that MCI is not necessarily a prodromal stage of dementia, although many MCI cases do progress to dementia, with an annual conversion rate of about 12% in the general population [16]. As the LongROAD project was designed to study aging and driving safety, the research protocol did not include collecting detailed diagnostic data related to MCI and dementia, such as neurological tests and imaging biomarkers. Future research should develop prediction models for MCI and dementia separately and for progression from MCI to dementia. Another limitation of the study is that the random forests models were trained and tested with oversampled MCI/dementia data points. Although rebalancing the dataset is necessary for avoiding training bias, results from the random forest models may not be entirely generalizable to the real-world setting as the actual dataset is highly imbalanced.
Nevertheless, the preliminary findings indicate that the performance of the random forest model based on basic demographic characteristics and driving behavior features is excellent, with a F1 score of 0.88 and an area under the receiver operating characteristic curve of 0.90. When additional follow-up data become available, we will use individual-level longitudinal driving data to develop a personalized time-dependent classifier to predict the risk of MCI/dementia for each study participant. If the high accuracy of the classifier is confirmed, the algorithm based on driving behavior features along with basic demographic characteristics could be incorporated into a smartphone app and other devices for early detection of MCI and dementia in older adult drivers.

Author Contributions

Conceptualization, G.L. and X.D.; methodology, X.D., R.S., C.D., D.W.E., T.J.M., L.J.M., D.S., T.E.G. and G.L.; validation, X.D., R.S. and G.L.; formal analysis, X.D. and R.S.; investigation, G.L., D.W.E., L.J.M., C.D., T.J.M., D.S., H.F.A. and L.L.H.; resources, B.H.L. and G.L.; writing—original draft preparation, X.D., R.S. and G.L.; writing—review and editing, C.D., D.W.E., L.L.H., T.J.M., L.J.M., D.S., H.F.A., T.E.G., B.H.L., M.K. and G.L.; visualization, X.D., R.S. and G.L.; supervision, X.D. and G.L.; project administration, B.H.L., G.L. and D.W.E.; funding acquisition, G.L., D.W.E., L.J.M., T.J.M., D.S., C.D. and L.L.H.; All authors have read and agreed to the published version of the manuscript.

Funding

This research was funded in part by the AAA Foundation for Traffic Safety and the APC was funded by the Department of Anesthesiology, Columbia University Vagelos College of Physicians and Surgeons. The contents of this work are the authors’ sole responsibility and do not necessarily represent official views of the AAA Foundation for Traffic Safety.

Institutional Review Board Statement

The study was conducted according to the guidelines of the Declaration of Helsinki, and approved by the Institutional Review Boards at Columbia University and each of the five study sites [Columbia University (New York, NY): protocol #AAAN9950 approved 9/18/2014; The Mary Imogene Bassett Hospital (Cooperstown, NY): protocol #1092 approved 7/7/2015; University of Colorado Anschutz Medical Campus (COMIRB, Aurora, CO): protocol # 14-0528 approved 11/25/2014; Johns Hopkins Bloomberg School of Public Health (Baltimore, MD): protocol #00006200 approved 4/8/2015; University of California, San Diego: protocol #141800 approved 1/8/2015; University of Michigan (Ann Arbor, MI): protocol # HUM00094031 approved 07/05/2015].

Informed Consent Statement

Informed consent was obtained from all subjects involved in the study.

Data Availability Statement

Restrictions apply to the availability of these data. Data are available from the author with permission from the AAA Foundation for Traffic Safety and upon execution of a data use agreement.

Conflicts of Interest

The authors declare no conflict of interest. The funding agency had no role in the design of the study; in the collection, analyses, or interpretation of data; in the writing of the manuscript, or in the decision to publish the results.

References

  1. Roberts, A.W.; Ogunwole, S.U.; Blakeslee, L.; Rabe, M.A. The Population 65 Years and Older in the United States: 2016. US Census Bureau: Washington, DC, USA, 2018; American Community Survey Reports, ACS-38. Available online: https://www.census.gov/content/dam/Census/library/publications/2018/acs/ACS-38.pdf (accessed on 20 March 2021).
  2. Federal Highway Administration (FHWA). Distribution of Licensed Drivers—2016, by Sex and Percentage in each Age Group and Relation to Population; US Department of Transportation, Federal Highway Administration: Washington, DC, USA, 2017. Available online: https://www.fhwa.dot.gov/policyinformation/statistics/2016/dl20.cfm (accessed on 20 March 2021).
  3. Ott, B.R.; Jones, R.N.; Noto, R.B.; Yoo, D.C.; Snyder, P.J.; Bernier, J.N.; Carr, D.B.; Roe, C.M. Brain Amyloid in Preclinical Alzheimer’s Disease Is Associated with Increased Driving Risk. Alzheimers Dement. 2017, 6, 136–142. [Google Scholar] [CrossRef] [PubMed]
  4. Roe, C.M.; Babulal, G.M.; Head, D.M.; Stout, S.H.; Vernon, E.K.; Ghoshal, N.; Garland, B.; Barco, P.P.; Williams, M.M.; Johnson, A.; et al. Preclinical Alzheimer’s Disease and Longitudinal Driving Decline. Alzheimers Dement. 2017, 3, 74–82. [Google Scholar] [CrossRef] [PubMed]
  5. Roe, C.M.; Barco, P.P.; Head, D.M.; Ghoshal, N.; Selsor, N.; Babulal, G.M.; Fierberg, R.; Vernon, E.K.; Shulman, N.; Johnson, A.; et al. Amyloid Imaging, Cerebrospinal Fluid Biomarkers Predict Driving Performance Among Cognitively Normal Individuals. Alzheimer Dis. Assoc. Disord. 2017, 31, 69–72. [Google Scholar] [CrossRef] [PubMed]
  6. Roe, C.M.; Babulal, G.M.; Mishra, S.; Gordon, B.A.; Stout, S.H.; Ott, B.R.; Carr, D.B.; Ances, B.M.; Morris, J.C.; Benzinger, T.L.S. Tau and Amyloid Positron Emission Tomography Imaging Predict Driving Performance Among Older Adults with and without Preclinical Alzheimer’s Disease. J. Alzheimers Dis. 2018, 61, 509–513. [Google Scholar] [CrossRef] [PubMed]
  7. Roe, C.M.; Stout, S.H.; Rajasekar, G.; Ances, B.M.; Jones, J.M.; Head, D.; Benzinger, T.L.S.; Williams, M.M.; Davis, J.D.; Ott, B.R.; et al. A 2.5-Year Longitudinal Assessment of Naturalistic Driving in Preclinical Alzheimer’s Disease. J. Alzheimers Dis. 2019, 68, 1625–1633. [Google Scholar] [CrossRef] [PubMed]
  8. Babulal, G.M.; Stout, S.H.; Head, D.; Holtzman, D.M.; Fagan, A.M.; Morris, J.C.; Roe, C.M. Neuropsychiatric Symptoms and Alzheimer’s Disease Biomarkers Predict Driving Decline: Brief Report. J. Alzheimers Dis. 2017, 58, 675–680. [Google Scholar] [CrossRef] [PubMed] [Green Version]
  9. Babulal, G.M.; Chen, S.; Williams, M.M.; Trani, J.-F.; Bakhshi, P.; Chao, G.L.; Stout, S.H.; Fagan, A.M.; Benzinger, T.L.S.; Holtzman, D.M.; et al. Depression and Alzheimer’s Disease Biomarkers Predict Driving Decline. J. Alzheimers Dis. 2018, 66, 1213–1221. [Google Scholar] [CrossRef] [PubMed]
  10. Babulal, G.M.; Stout, S.H.; Benzinger, T.L.S.; Ott, B.R.; Carr, D.B.; Webb, M.; Traub, C.M.; Addison, A.; Morris, J.C.; Warren, D.K.; et al. A Naturalistic Study of Driving Behavior in Older Adults and Preclinical Alzheimer Disease: A Pilot Study. J. Appl. Gerontol. 2019, 38, 277–289. [Google Scholar] [CrossRef] [PubMed]
  11. Eby, D.W.; Silverstein, N.M.; Molnar, L.J.; LeBlanc, D.; Adler, G. Driving Behaviors in Early Stage Dementia: A Study Using in-Vehicle Technology. Accid. Anal. Prev. 2012, 49, 330–337. [Google Scholar] [CrossRef] [PubMed]
  12. Davis, R.L.; Ohman, J.M. Driving in Early-Stage Alzheimer’s Disease: An Integrative Review of the Literature. Res. Gerontol. Nurs. 2017, 10, 86–100. [Google Scholar] [CrossRef] [PubMed] [Green Version]
  13. Allison, S.; Babulal, G.M.; Stout, S.H.; Barco, P.P.; Carr, D.B.; Fagan, A.M.; Morris, J.C.; Roe, C.M.; Head, D. Alzheimer Disease Biomarkers and Driving in Clinically Normal Older Adults: Role of Spatial Navigation Abilities. Alzheimer Dis. Assoc. Disord. 2018, 32, 101–106. [Google Scholar] [CrossRef] [PubMed]
  14. Li, G.; Eby, D.W.; Santos, R.; Mielenz, T.J.; Molnar, L.J.; Strogatz, D.; Betz, M.E.; DiGuiseppi, C.; Ryan, L.H.; Jones, V.; et al. Longitudinal Research on Aging Drivers (LongROAD): Study design and methods. Inj. Epidemiol. 2017, 4, 22. [Google Scholar] [CrossRef] [PubMed] [Green Version]
  15. Babulal, G.M.; Johnson, A.; Fagan, A.M.; Morris, J.C.; Roe, C.M. Identifying Preclinical Alzheimer’s Disease Using Everyday Driving Behavior: Proof of Concept. J. Alzheimers Dis. 2021, 79, 1009–1014. [Google Scholar] [CrossRef] [PubMed]
  16. Campbell, N.L.; Unverzagt, F.; LaMantia, M.A.; Khan, B.A.; Boustani, M.A. Risk Factors for the Progression of Mild Cognitive Impairment to Dementia. Clin. Geriatr. Med. 2013, 29, 873–893. [Google Scholar] [CrossRef] [PubMed] [Green Version]
Figure 1. Feature importance ranking.
Geriatrics 06 00045 g001
Table 1. Variable definitions and statistics.
VariableNameDefinitionStatistics
MinMaxMeanSD
Diagnosis_labelsMCI/Dementia One’s disease level in a month (0-Healthy; 1-Mild Cognitive Impairment (MCI)/Dementia/Alzheimer’s01--
Demographic characteristics
Age in yearsAgeAge at enrollment657971.14.1
SexSexMale; FemaleNANANANA
Race/EthnicityRaceAlaska Native, Native Hawaiian, Pacific Islander; American Indian, Asian; Black (non-Hispanic); White (non-Hispanic); Hispanic; OtherNANANANA
EducationEducationAssociate degree; Bachelor degree; Master, professional, or doctoral degree; Some college but no degree; Vocational, technical, business, or trade school (beyond high school level); OtherNANANANA
Driving variables
1Miles_nMilesTotal number of miles driven in month015,783762.2587.8
2TripsTripsTotal number of trips in month12341115.864.6
3TripsLt15MilesNo. trips < 15 miles of homeNumber of trips traveled in month within 15 miles of home0195395.558.4
4PercentDistLt15Miles_n% trip < 15 miles of homePercent of trips traveled in month within 15 miles of home0.0100.064.928.9
5TripsLt25MilesNo. trips < 25 miles of homeNumber of trips traveled in month within 25 miles of home01953101.759.7
6PercentDistLt25Miles_n% trip < 25 miles of homePercent of trips traveled in month within 25 miles of home0.0100.076.526.4
7MilesPerTrip_nMiles per tripTotal number of miles driven in month divided by total number of trips in month0.074.56.74.1
8MinutesPerTrip_nMinutes per tripTotal driving minutes in month divided by total number of trips in month0.1137.714.95.9
9TripMinutes_nTotal trip minutesTotal minutes of driving in month0.116,645.01633.41083.6
10TripsInDayNo. trips during dayNumber of trips in month not classified as nighttime01279107.257.4
11PercentTripsInDay_n% trips during dayPercent of trips in month not classified as nighttime0.0100.093.18.0
12TripsAMPeakNo. trips in AM peakNumber of trips in month during 7–9 AM on weekdays01678.69.4
13PercentTripsAMPeak_n% trips in AM peakPercent of trips in month during 7–9 AM on weekdays0.0100.07.36.9
14TripsAtNightNo. trips at nightNumber of trips during which at least 80% of a trip was during nightime in month (Nightime was defined as civil twilight or a solar angle greater than 96 deg)011438.716.6
15PercentTripsAtNight_n% trips at nightPercent of trips during which at least 80% of a trip was during nightime in month (Nightime was defined as civil twilight or a solar angle greater than 96 deg)0.0100.06.98.0
16TripsPMPeakNo. trips in PM peakNumber of trips in month during 4–6PM on weekdays015010.99.5
17PercentTripsPMPeak_n% trips in PM peakPercent of trips in month during 4–6PM on weekdays0.0100.09.36.7
18LeftTurnCountNo. left turnsNumber of left turns made in month02592261.6159.9
19RightTurnCountNo.right turnsNumber of right turns made in month02751242.6150.1
20RightToLeftTurnRatio_nRight to left turn ratioRatio of all right-hand to left-hand turning events for a driver in a month0.07.00.90.2
21TripsVgt60No. trips on high speed roadsNumber of trips in month where 20% of distance travelled was at a speed of 60 MPH or greater022613.915.0
22PercentTripsVgt60_n% trip on high speed roadsPercent of trips in month where 20% of distance travelled was at a speed of 60 MPH or greater0.012.6100.012.3
23SpeedGt80mphCountNo. speeding eventsNumber speeding events in month (speed > 80 MPH sustained for at least 8 s)033007.331.3
24DecelCntLtN3pt5Mps2No. hard braking events with deceleration rates ≥ 0.35 gNumber of events with a deceleration rate ≥ 0.35 g in a month011123.88.2
25DecelCntLtN4pt0Mps2No. hard braking events with deceleration rates ≥ 0.40 gNumber of events with a deceleration rate ≥ 0.4 g in a month 07340.94.2
26DecelCntLtN7pt5Mps2No. hard braking events ≥ 0.75 gNumber of events with a deceleration rate ≥ 0.75 g in a month0240.0050.2
27TripChainsTrip chainsNumber of trip chains in month (Note: chain is a series of trips starting and ending at home)01808.27.8
28MilesPerChain_nMiles per chainTotal miles of chains in month divided by total number of trip chains in month0.004273.3100.7121.1
29MinutesPerChain_nMinutes per chainTotal driving minutes for chains divided by total number of trip chains in month0.06606.3222.0219.8
NA, not applicable.
Table 2. Performance of random forests models with different covariates in predicting incident mild cognitive impairment or dementia.
ModelCovariatesAccuracyPrecision or PPV Recall or SensitivitySpecificityNPVF1 ScoreAUCOut-of-Bag Error RateConfusion Matrix
PredictedObserved
%SD01
1Age only 0.461.000.061.000.450.110.566.000.0107796
106
2Age, sex, race/ethnicity, and education0.531.000.171.000.480.290.64 07785
4.270.011017
3Driving variables only0.660.790.560.810.580.660.762.600.7506245
11257
4Age and driving variables0.800.890.740.880.720.810.912.140.5006827
1975
5Age, sex, race/ethnicity, education and driving variables0.860.860.900.810.860.880.902.070.5706210
11592
PPV, positive predictive value; NPV, negative predictive value; AUC, area under the receiver operating characteristic curve.
Publisher’s Note: MDPI stays neutral with regard to jurisdictional claims in published maps and institutional affiliations.

