
Effect of Demographic and Health Dynamics on Cognitive Status in Mexico between 2001 and 2015: Evidence from the Mexican Health and Aging Study


 ,
,
Abstract
:
1. Introduction
2. Materials and Methods
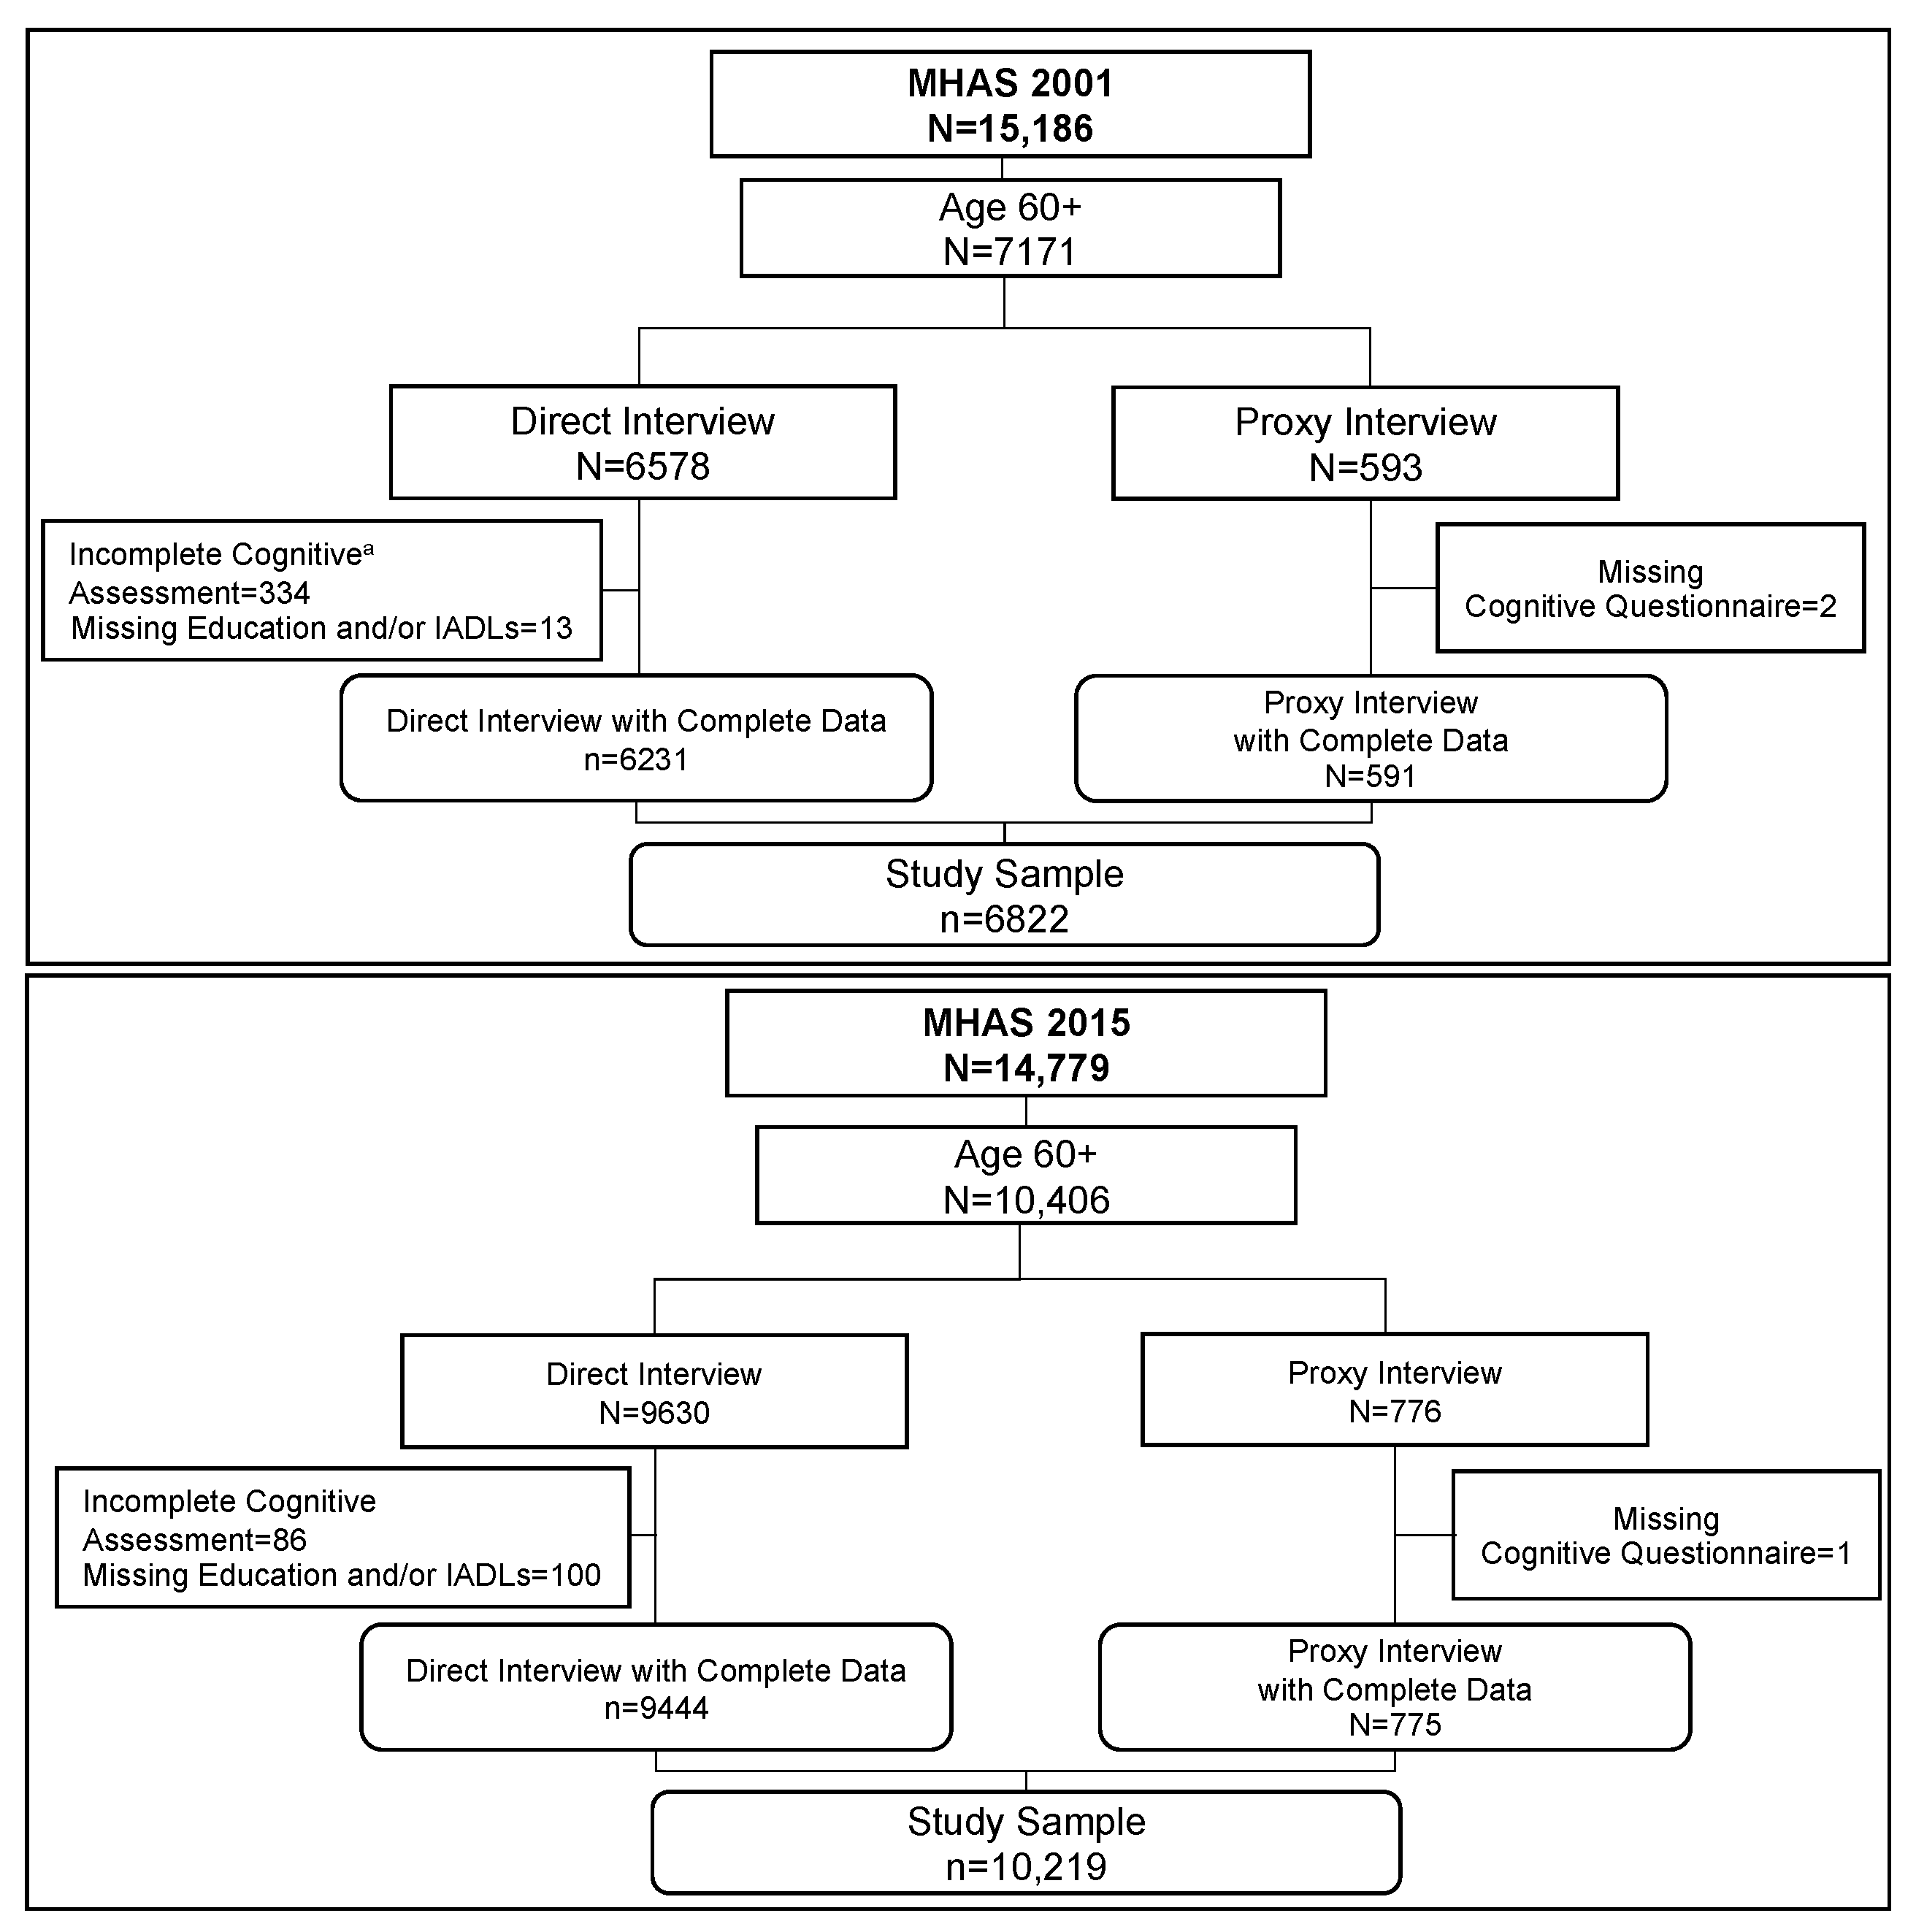
2.1. Participants
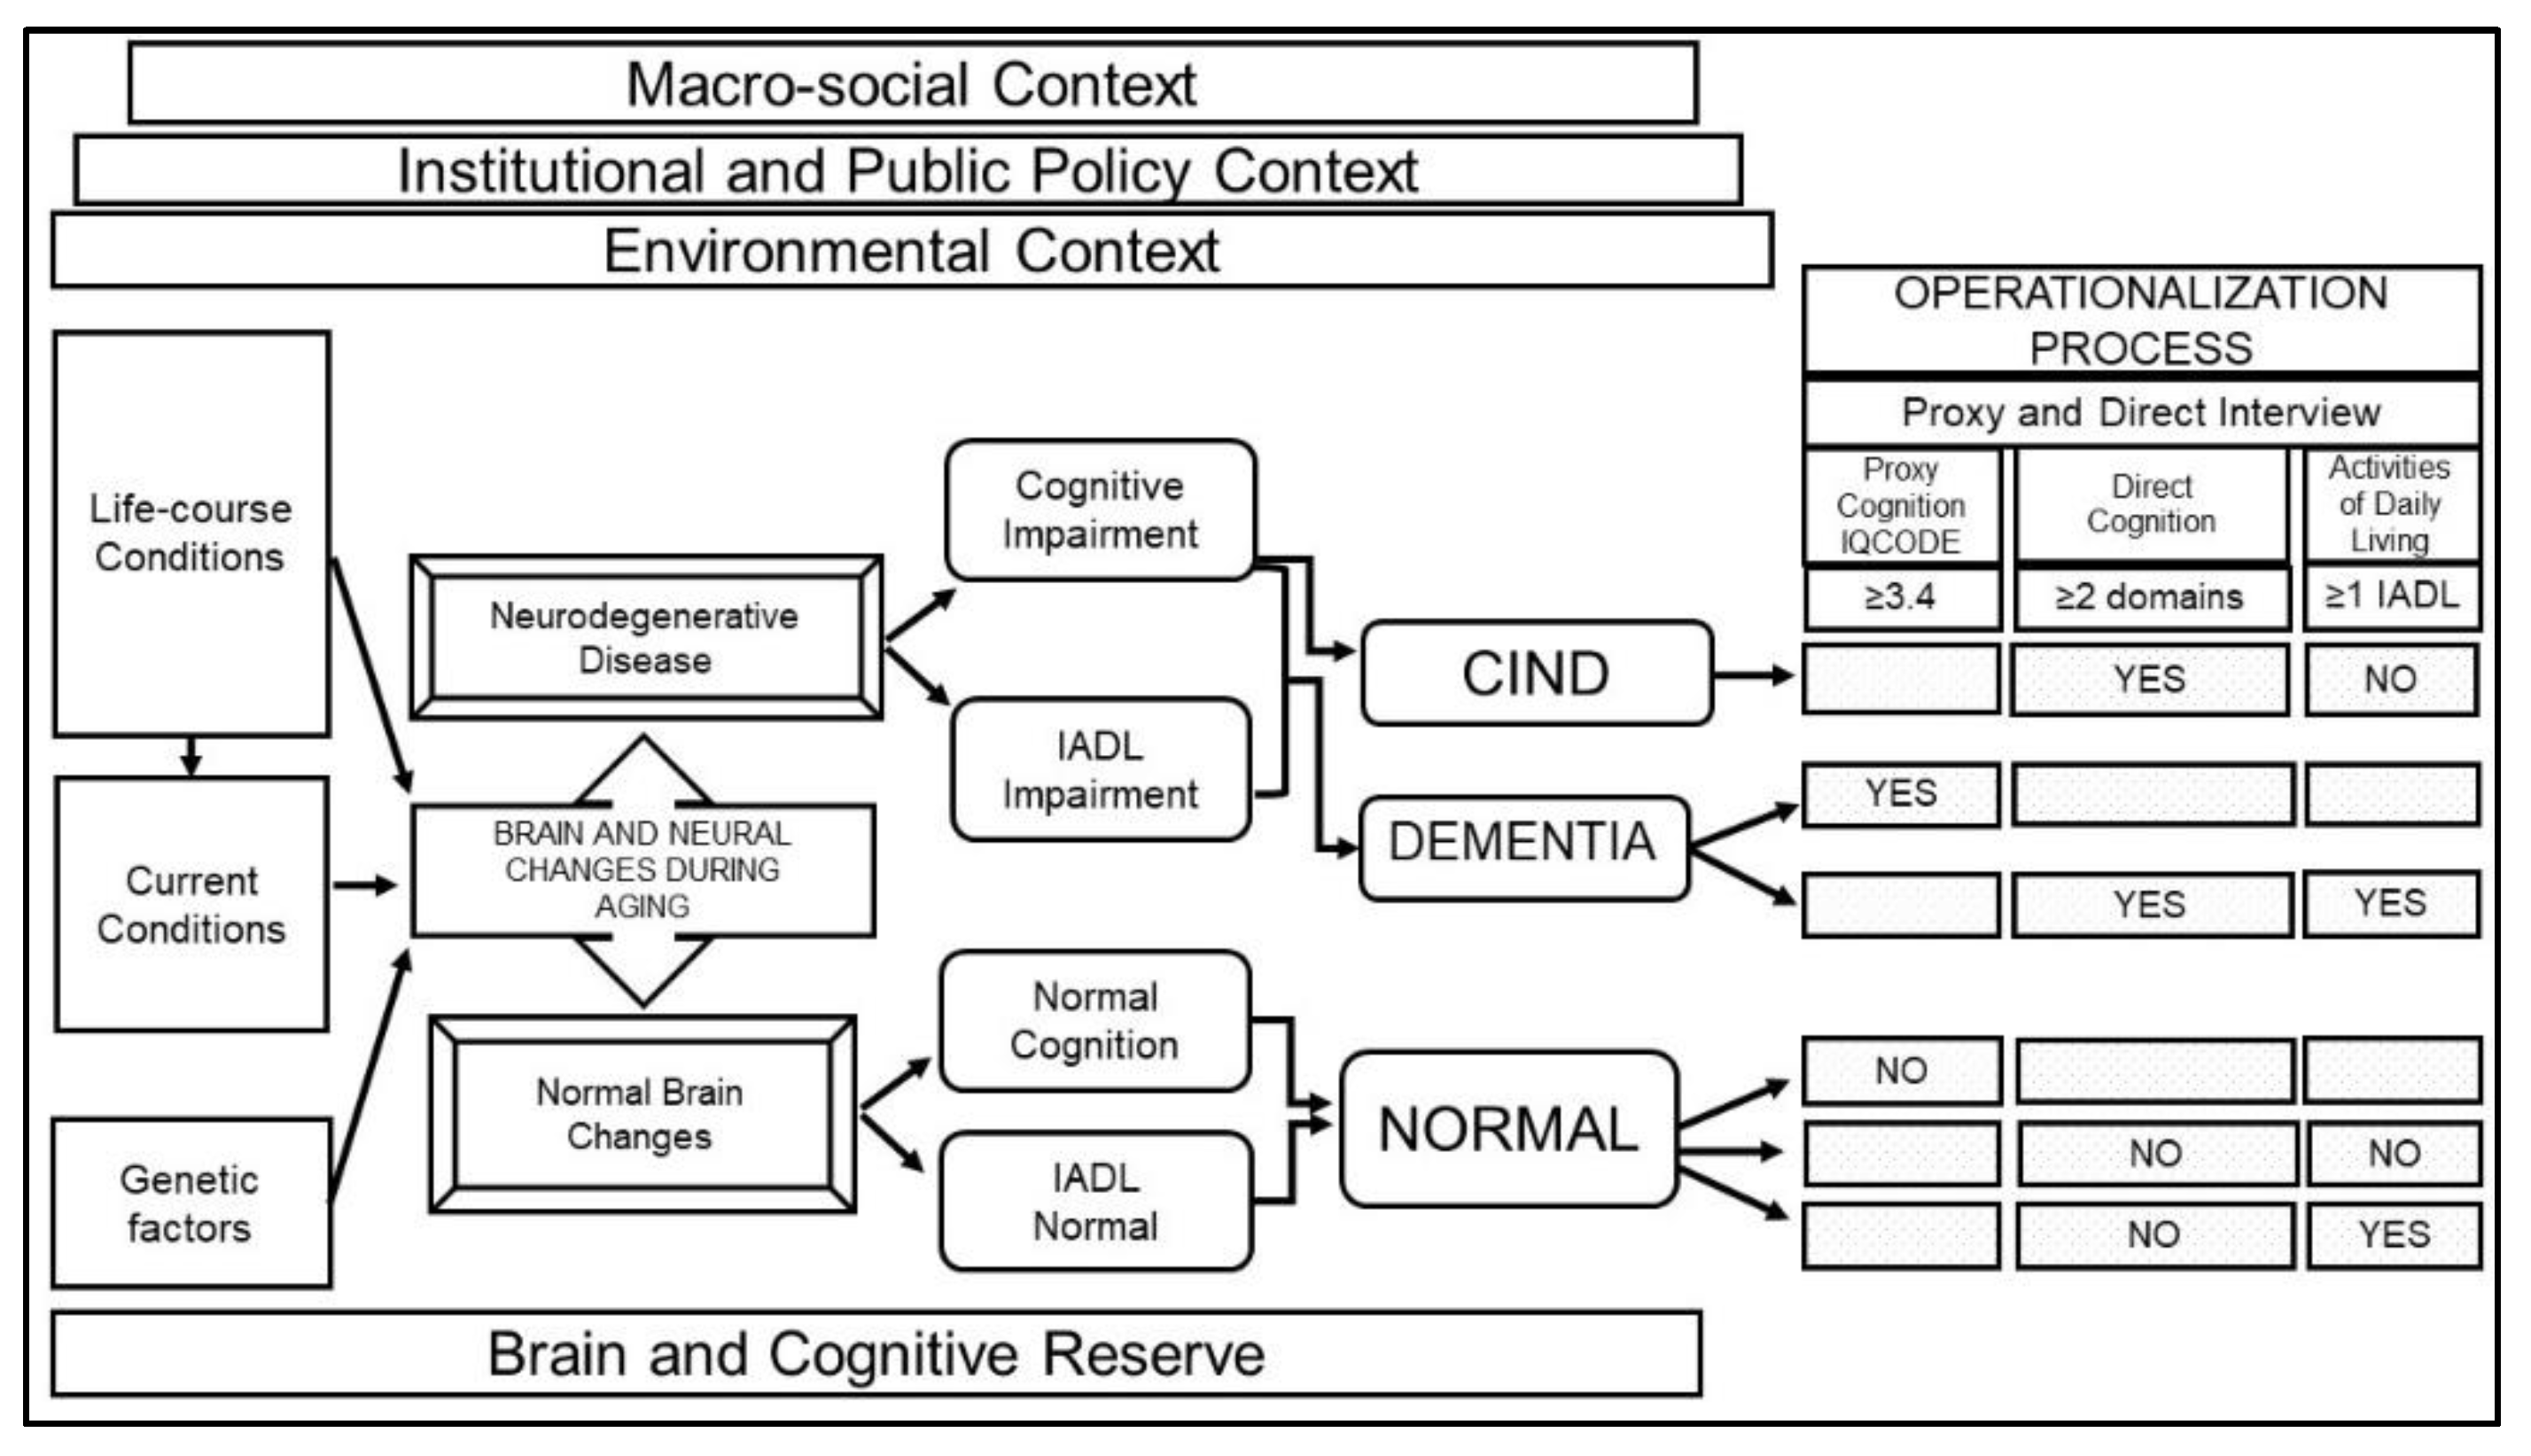
2.2. Definition of Cognitive Categories
2.3. Cognitive Measures
2.4. Covariates
2.5. Statistical Analysis
3. Results
3.1. Trends in Cognitive Status
3.2. Trends in Sociodemographic Characteristics
3.3. Trends in Cardiovascular Risks and Treatment
3.4. Regression Results
4. Discussion
5. Conclusions
Supplementary Materials
Author Contributions
Funding
Institutional Review Board Statement
Informed Consent Statement
Data Availability Statement
Acknowledgments
Conflicts of Interest
References
- Maestre, G.E. Assessing dementia in resource-poor regions. Curr. Neurol. Neurosci. Rep. 2012, 12, 511–519. [Google Scholar] [CrossRef] [PubMed] [Green Version]
- Downer, B.; Veeranki, S.P.; Wong, R. A Late Life Risk Index for Severe Cognitive Impairment in Mexico. J. Alzheimers Dis. 2016, 52, 191–203. [Google Scholar] [CrossRef] [Green Version]
- Saenz, J.L.; Downer, B.; Garcia, M.A.; Wong, R. Cognition and Context: Rural-Urban Differences in Cognitive Aging Among Older Mexican Adults. J. Aging Health 2018, 30, 965–986. [Google Scholar] [CrossRef] [PubMed]
- Rojas-Martinez, R.; Basto-Abreu, A.; Aguilar-Salinas, C.A.; Zarate-Rojas, E.; Villalpando, S.; Barrientos-Gutierrez, T. Prevalence of previously diagnosed diabetes mellitus in Mexico. Salud Publica Mex. 2018, 60, 224–232. [Google Scholar] [CrossRef] [PubMed]
- Campos-Nonato, I.; Hernández-Barrera, L.; Flores-Coria, A.; Gómez-Álvarez, E.; Barquera, S. Prevalencia, diagnóstico y control de hipertensión arterial en adultos mexicanos en condición de vulnerabilidad. Resultados de la Ensanut 100k. Salud Publica Mex. 2019, 61, 888–897. [Google Scholar] [CrossRef] [Green Version]
- Diaz-Venegas, C.; Samper-Ternent, R.; Michaels-Obregon, A.; Wong, R. The effect of educational attainment on cognition of older adults: Results from the Mexican Health and Aging Study 2001 and 2012. Aging Ment. Health 2019, 23, 1586–1594. [Google Scholar] [CrossRef] [PubMed]
- Veeranki, S.P.; Downer, B.; Jupiter, D.; Kuo, Y.F.; Raji, M.; Calhoun, W.; Wong, R. Chronic Respiratory Disease and Cognitive Impairment in Older Mexican Adults. Neurol. India 2019, 67, 1539. [Google Scholar] [CrossRef]
- Avila, J.C.; Mejia Arango, S.; Jupiter, D.; Downer, B.; Wong, R. The effect of diabetes on the cognitive trajectory of older adults in Mexico and the U.S. J. Gerontol. B Psychol. Sci. Soc. Sci. 2020. [Google Scholar] [CrossRef]
- Payne, C.F.; Wong, R. Expansion of disability across successive Mexican birth cohorts: A longitudinal modelling analysis of birth cohorts born 10 years apart. J. Epidemiol. Community Health 2019, 73, 900–905. [Google Scholar] [CrossRef] [Green Version]
- Beltrán-Sánchez, H.; Drumond-Andrade, F.C.; Riosmena, F. Contribution of socioeconomic factors and health care access to the awareness and treatment of diabetes and hypertension among older Mexican adults. Salud Publica Mex. 2015, 57, s6–s14. [Google Scholar] [CrossRef] [Green Version]
- Pinto, G.; Beltrán-Sánchez, H. Prospective study of the link between overweight/obesity and diabetes incidence among Mexican older adults: 2001–2012. Salud Publica Mex. 2015, 57, 15–21. [Google Scholar] [CrossRef] [Green Version]
- Parker, S.W.; Pederzini, C. Gender differences in education in Mexico. In The Economics of Gender in Mexico: Work, Family, State, and Market; Katz, E., Correia, M.C., Eds.; World Bank: Washington, DC, USA, 2001; pp. 9–45. [Google Scholar]
- Wong, R.; Michaels-Obregón, A.; Palloni, A.; Gutiérrez-Robledo, L.M.; González-González, C.; López-Ortega, M.; Téllez-Rojo, M.M.; Mendoza-Alvarado, L.R. Progression of aging in Mexico: The Mexican Health and Aging Study (MHAS) 2012. Salud Publica Mex. 2015, 57 (Suppl. 1), S79–S89. [Google Scholar] [CrossRef] [PubMed] [Green Version]
- Wong, R.; Díaz, J.J. Health care utilization among older Mexicans: Health and socioeconomic inequalities. Salud Publica Mex. 2007, 49, s505–s514. [Google Scholar] [CrossRef] [PubMed]
- Satizabal, C.L.; Beiser, A.S.; Chouraki, V.; Chêne, G.; Dufouil, C.; Seshadri, S. Incidence of dementia over three decades in the Framingham Heart Study. N. Engl. J. Med. 2016, 374, 523–532. [Google Scholar] [CrossRef] [PubMed]
- Matthews, F.E.; Arthur, A.; Barnes, L.E.; Bond, J.; Jagger, C.; Robinson, L.; Brayne, C.; Medical Research Council Cognitive Function and Ageing Collaboration. A two-decade comparison of prevalence of dementia in individuals aged 65 years and older from three geographical areas of England: Results of the Cognitive Function and Ageing Study I and II. Lancet 2013, 382, 1405–1412. [Google Scholar] [CrossRef]
- Langa, K.M.; Larson, E.B.; Crimmins, E.M.; Faul, J.D.; Levine, D.A.; Kabeto, M.U.; Weir, D.R. A Comparison of the Prevalence of Dementia in the United States in 2000 and 2012. JAMA Intern. Med. 2017, 177, 51–58. [Google Scholar] [CrossRef] [PubMed]
- Parker, S.W.; Saenz, J.; Wong, R. Health Insurance and the Aging: Evidence From the Seguro Popular Program in Mexico. Demography 2018, 55, 361–386. [Google Scholar] [CrossRef] [PubMed]
- Wong, R.; Michaels-Obregon, A.; Palloni, A. Cohort Profile: The Mexican Health and Aging Study (MHAS). Int. J. Epidemiol. 2017, 46, e2. [Google Scholar] [CrossRef] [PubMed]
- Mexican Health and Aging Study (MHAS). Data Files and Documentation (Public Use): Mexican Health and Aging Study, 2001 & 2015. Available online: www.MHASweb.org (accessed on 4 December 2020).
- National Research Council. New Directions in the Sociology of Aging; The National Academies Press: Washington, DC, USA, 2013. [Google Scholar] [CrossRef]
- Baumgart, M.; Snyder, H.M.; Carrillo, M.C.; Fazio, S.; Kim, H.; Johns, H. Summary of the evidence on modifiable risk factors for cognitive decline and dementia: A population-based perspective. Alzheimers Dement. 2015, 11, 718–726. [Google Scholar] [CrossRef] [Green Version]
- Stern, Y. Cognitive reserve in ageing and Alzheimer’s disease. Lancet Neurol. 2012, 11, 1006–1012. [Google Scholar] [CrossRef] [Green Version]
- McKhann, G.M.; Knopman, D.S.; Chertkow, H.; Hyman, B.T.; Jack, C.R., Jr.; Kawas, C.H.; Klunk, W.E.; Koroshetz, W.J.; Manly, J.J.; Mayeux, R.; et al. The diagnosis of dementia due to Alzheimer’s disease: Recommendations from the National Institute on Aging-Alzheimer’s Association workgroups on diagnostic guidelines for Alzheimer’s disease. Alzheimers Dement. 2011, 7, 263–269. [Google Scholar] [CrossRef] [Green Version]
- Sperling, R.A.; Aisen, P.S.; Beckett, L.A.; Bennett, D.A.; Craft, S.; Fagan, A.M.; Iwatsubo, T.; Jack, C.R., Jr.; Kaye, J.; Montine, T.J.; et al. Toward defining the preclinical stages of Alzheimer’s disease: Recommendations from the National Institute on Aging-Alzheimer’s Association workgroups on diagnostic guidelines for Alzheimer’s disease. Alzheimers Dement. 2011, 7, 280–292. [Google Scholar] [CrossRef] [PubMed] [Green Version]
- Crimmins, E.M.; Kim, J.K.; Langa, K.M.; Weir, D.R. Assessment of cognition using surveys and neuropsychological assessment: The Health and Retirement Study and the Aging, Demographics, and Memory Study. J. Gerontol. B Psychol. Sci. Soc. Sci. 2011, 66 (Suppl. 1), i162–i171. [Google Scholar] [CrossRef] [PubMed] [Green Version]
- Jorm, A.F. The Informant Questionnaire on cognitive decline in the elderly (IQCODE): A review. Int. Psychogeriatr. 2004, 16, 275–293. [Google Scholar] [CrossRef]
- Glosser, G.; Wolfe, N.; Albert, M.L.; Lavine, L.; Steele, J.C.; Calne, D.B.; Schoenberg, B.S. Cross-cultural cognitive examination: Validation of a dementia screening instrument for neuroepidemiological research. J. Am. Geriatr. Soc. 1993, 41, 931–939. [Google Scholar] [CrossRef]
- Mejia-Arango, S.; Wong, R.; Michaels-Obregon, A. Normative and standardized data for cognitive measures in the Mexican Health and Aging Study. Salud Publica Mex. 2015, 57 (Suppl. 1), S90–S96. [Google Scholar] [CrossRef] [PubMed]
- Cherbuin, N.; Jorm, A.F. The IQCODE: Using Informant Reports to Assess Cognitive Change in the Clinic and in Older Individuals Living in the Community. Cogn. Screen. Instrum. 2017, 275–295. [Google Scholar] [CrossRef]
- Angrisani, M.; Lee, J.; Meijer, E. The gender gap in education and late-life cognition: Evidence from multiple countries and birth cohorts. J. Econ. Ageing 2020, 16, 100232. [Google Scholar] [CrossRef]
- Mejia-Arango, S.; Zuniga-Gil, C. Diabetes mellitus as a risk factor for dementia in the Mexican elder population. Rev. Neurol. 2011, 53, 397–405. [Google Scholar] [CrossRef] [PubMed] [Green Version]
- Seidel, D.; Thyrian, J.R. Burden of caring for people with dementia–comparing family caregivers and professional caregivers. A descriptive study. J. Multidiscip. Healthcare 2019, 12, 655. [Google Scholar] [CrossRef] [Green Version]
- Mijajlović, M.D.; Pavlović, A.; Brainin, M.; Heiss, W.D.; Quinn, T.J.; Ihle-Hansen, H.B.; Hermann, D.M.; Assayag, E.B.; Richard, E.; Thiel, A.; et al. Post-stroke dementia—A comprehensive review. BMC Med. 2017, 15, 11. [Google Scholar] [CrossRef] [Green Version]
- Plassman, B.L.; Langa, K.M.; McCammon, R.J.; Fisher, G.G.; Potter, G.G.; Burke, J.R.; Steffens, D.C.; Foster, N.L.; Giordani, B.; Unverzagt, F.W.; et al. Incidence of dementia and cognitive impairment, not dementia in the United States. Ann. Neurol. 2011, 70, 418–426. [Google Scholar] [CrossRef] [PubMed] [Green Version]
- Fei, M.; Qu, Y.C.; Wang, T.; Yin, J.; Bai, J.X.; Ding, Q.H. Prevalence and distribution of cognitive impairment no dementia (CIND) among the aged population and the analysis of socio-demographic characteristics: The community-based cross-sectional study. Alzheimer Dis Assoc. Disord. 2009, 23, 130–138. [Google Scholar] [CrossRef] [PubMed]
- Plassman, B.L.; Langa, K.M.; Fisher, G.G.; Heeringa, S.G.; Weir, D.R.; Ofstedal, M.B.; Burke, J.R.; Hurd, M.D.; Potter, G.G.; Rodgers, W.L.; et al. Prevalence of cognitive impairment without dementia in the United States. Ann. Intern. Med. 2008, 148, 427–434. [Google Scholar] [CrossRef] [PubMed] [Green Version]
- Atti, A.R.; Palmer, K.; Volpato, S.; Winblad, B.; De Ronchi, D.; Fratiglioni, L. Late-life body mass index and dementia incidence: Nine-year follow-up data from the Kungsholmen Project. J. Am. Geriatr. Soc. 2008, 56, 111–116. [Google Scholar] [CrossRef] [PubMed]
- Anstey, K.; Cherbuin, N.; Budge, M.; Young, J. Body mass index in midlife and late-life as a risk factor for dementia: A meta-analysis of prospective studies. Obes Rev. 2011, 12, e426–e437. [Google Scholar] [CrossRef]
- Tolppanen, A.M.; Ngandu, T.; Kåreholt, I.; Laatikainen, T.; Rusanen, M.; Soininen, H.; Kivipelto, M. Midlife and late-life body mass index and late-life dementia: Results from a prospective population-based cohort. J. Alzheimers Dis. 2014, 38, 201–209. [Google Scholar] [CrossRef]
- Naderali, E.K.; Ratcliffe, S.H.; Dale, M.C. Obesity and Alzheimer’s disease: A link between body weight and cognitive function in old age. Am. J. Alzheimer’s Dis. Other Dement. 2009, 24, 445–449. [Google Scholar] [CrossRef]
- Livingston, G.; Huntley, J.; Sommerlad, A.; Ames, D.; Ballard, C.; Banerjee, S.; Brayne, C.; Burns, A.; Cohen-Mansfield, J.; Cooper, C.; et al. Dementia prevention, intervention, and care: 2020 report of the Lancet Commission. Lancet 2020, 396, 413–446. [Google Scholar] [CrossRef]
- Jorm, A.F. A short form of the Informant Questionnaire on Cognitive Decline in the Elderly (IQCODE): Development and cross-validation. Psychol. Med. 1994, 24, 145–153. [Google Scholar] [CrossRef]
- Downer, B.; Kumar, A.; Mehta, H.; Al Snih, S.; Wong, R. The effect of undiagnosed diabetes on the association between self-reported diabetes and cognitive impairment among older Mexican adults. Am. J. Alzheimer’s Dis. Other Dement. 2016, 31, 564–569. [Google Scholar] [CrossRef] [PubMed] [Green Version]


| 2001 | 2015 | ||
|---|---|---|---|
| n = 6822 | n = 10219 | p Value | |
| Age, y | |||
| 60–74 years | 5224 (74.5) | 7073 (72.5) | <0.001 |
| ≥75 years | 1598 (25.5) | 3146 (27.5) | <0.001 |
| Mean (SD) | 69.3 (7.5) | 71.2 (7.9) | <0.001 |
| Sex | |||
| Male | 3169 (47.6) | 4496 (45.2) | 0.002 |
| Female | 3653 (52.4) | 5723 (54.8) | |
| Education, y | |||
| No schooling | 2138 (36.0) | 2142 (24.0) | <0.001 |
| 1–6 years | 3646 (50.3) | 5541 (52.9) | 0.31 |
| ≥7 years | 1038 (13.7) | 2536 (22.9) | <0.001 |
| Mean (SD) | 3.6 (3.9) | 4.9 (4.5) | <0.001 |
| Residence | |||
| Urban | 4936 (57.8) | 7267 (60.5) | 0.08 |
| Rural | 1886 (42.2) | 2952 (39.5) | |
| Cardiovascular conditions | |||
| Hypertension | 2876 (41.3) | 5354 (50.3) | <0.001 |
| Diabetes | 1188 (16.8) | 2686 (24.9) | <0.001 |
| Heart attack | 298 (3.3) | 477 (3.8) | 0.37 |
| Stroke | 254 (3.5) | 293 (2.6) | 0.002 |
| CVD Treatment b | |||
| Hypertension | 2190 (76.3) | 4738 (85.9) | <0.001 |
| Diabetes | 1030 (87.6) | 2499 (93.2) | <0.001 |
| Heart attack | 211 (66.8) | 341 (70.7) | 0.95 |
| Stroke | 141 (53.4) | 153 (46.9) | 0.44 |
| BMI | |||
| 18.5–24.9 (Normal) | 2491 (38.7) | 3511 (34.8) | 0.004 |
| <18.5 (Underweight) | 158 (3.5) | 185 (2.2) | 0.03 |
| 25.0–29.9 (Overweight) | 2983 (41.5) | 4331 (42.9) | 0.08 |
| ≥30 (Obese) | 1183 (16.3) | 2182 (20.1) | <0.001 |
| Health insurance (yes) | 4287 (56.9) | 9376 (90.4) | <0.001 |
| Overall | Males | Females | ||||
|---|---|---|---|---|---|---|
| OR (95% CI) | p Value | OR (95% CI) | p Value | OR (95% CI) | p Value | |
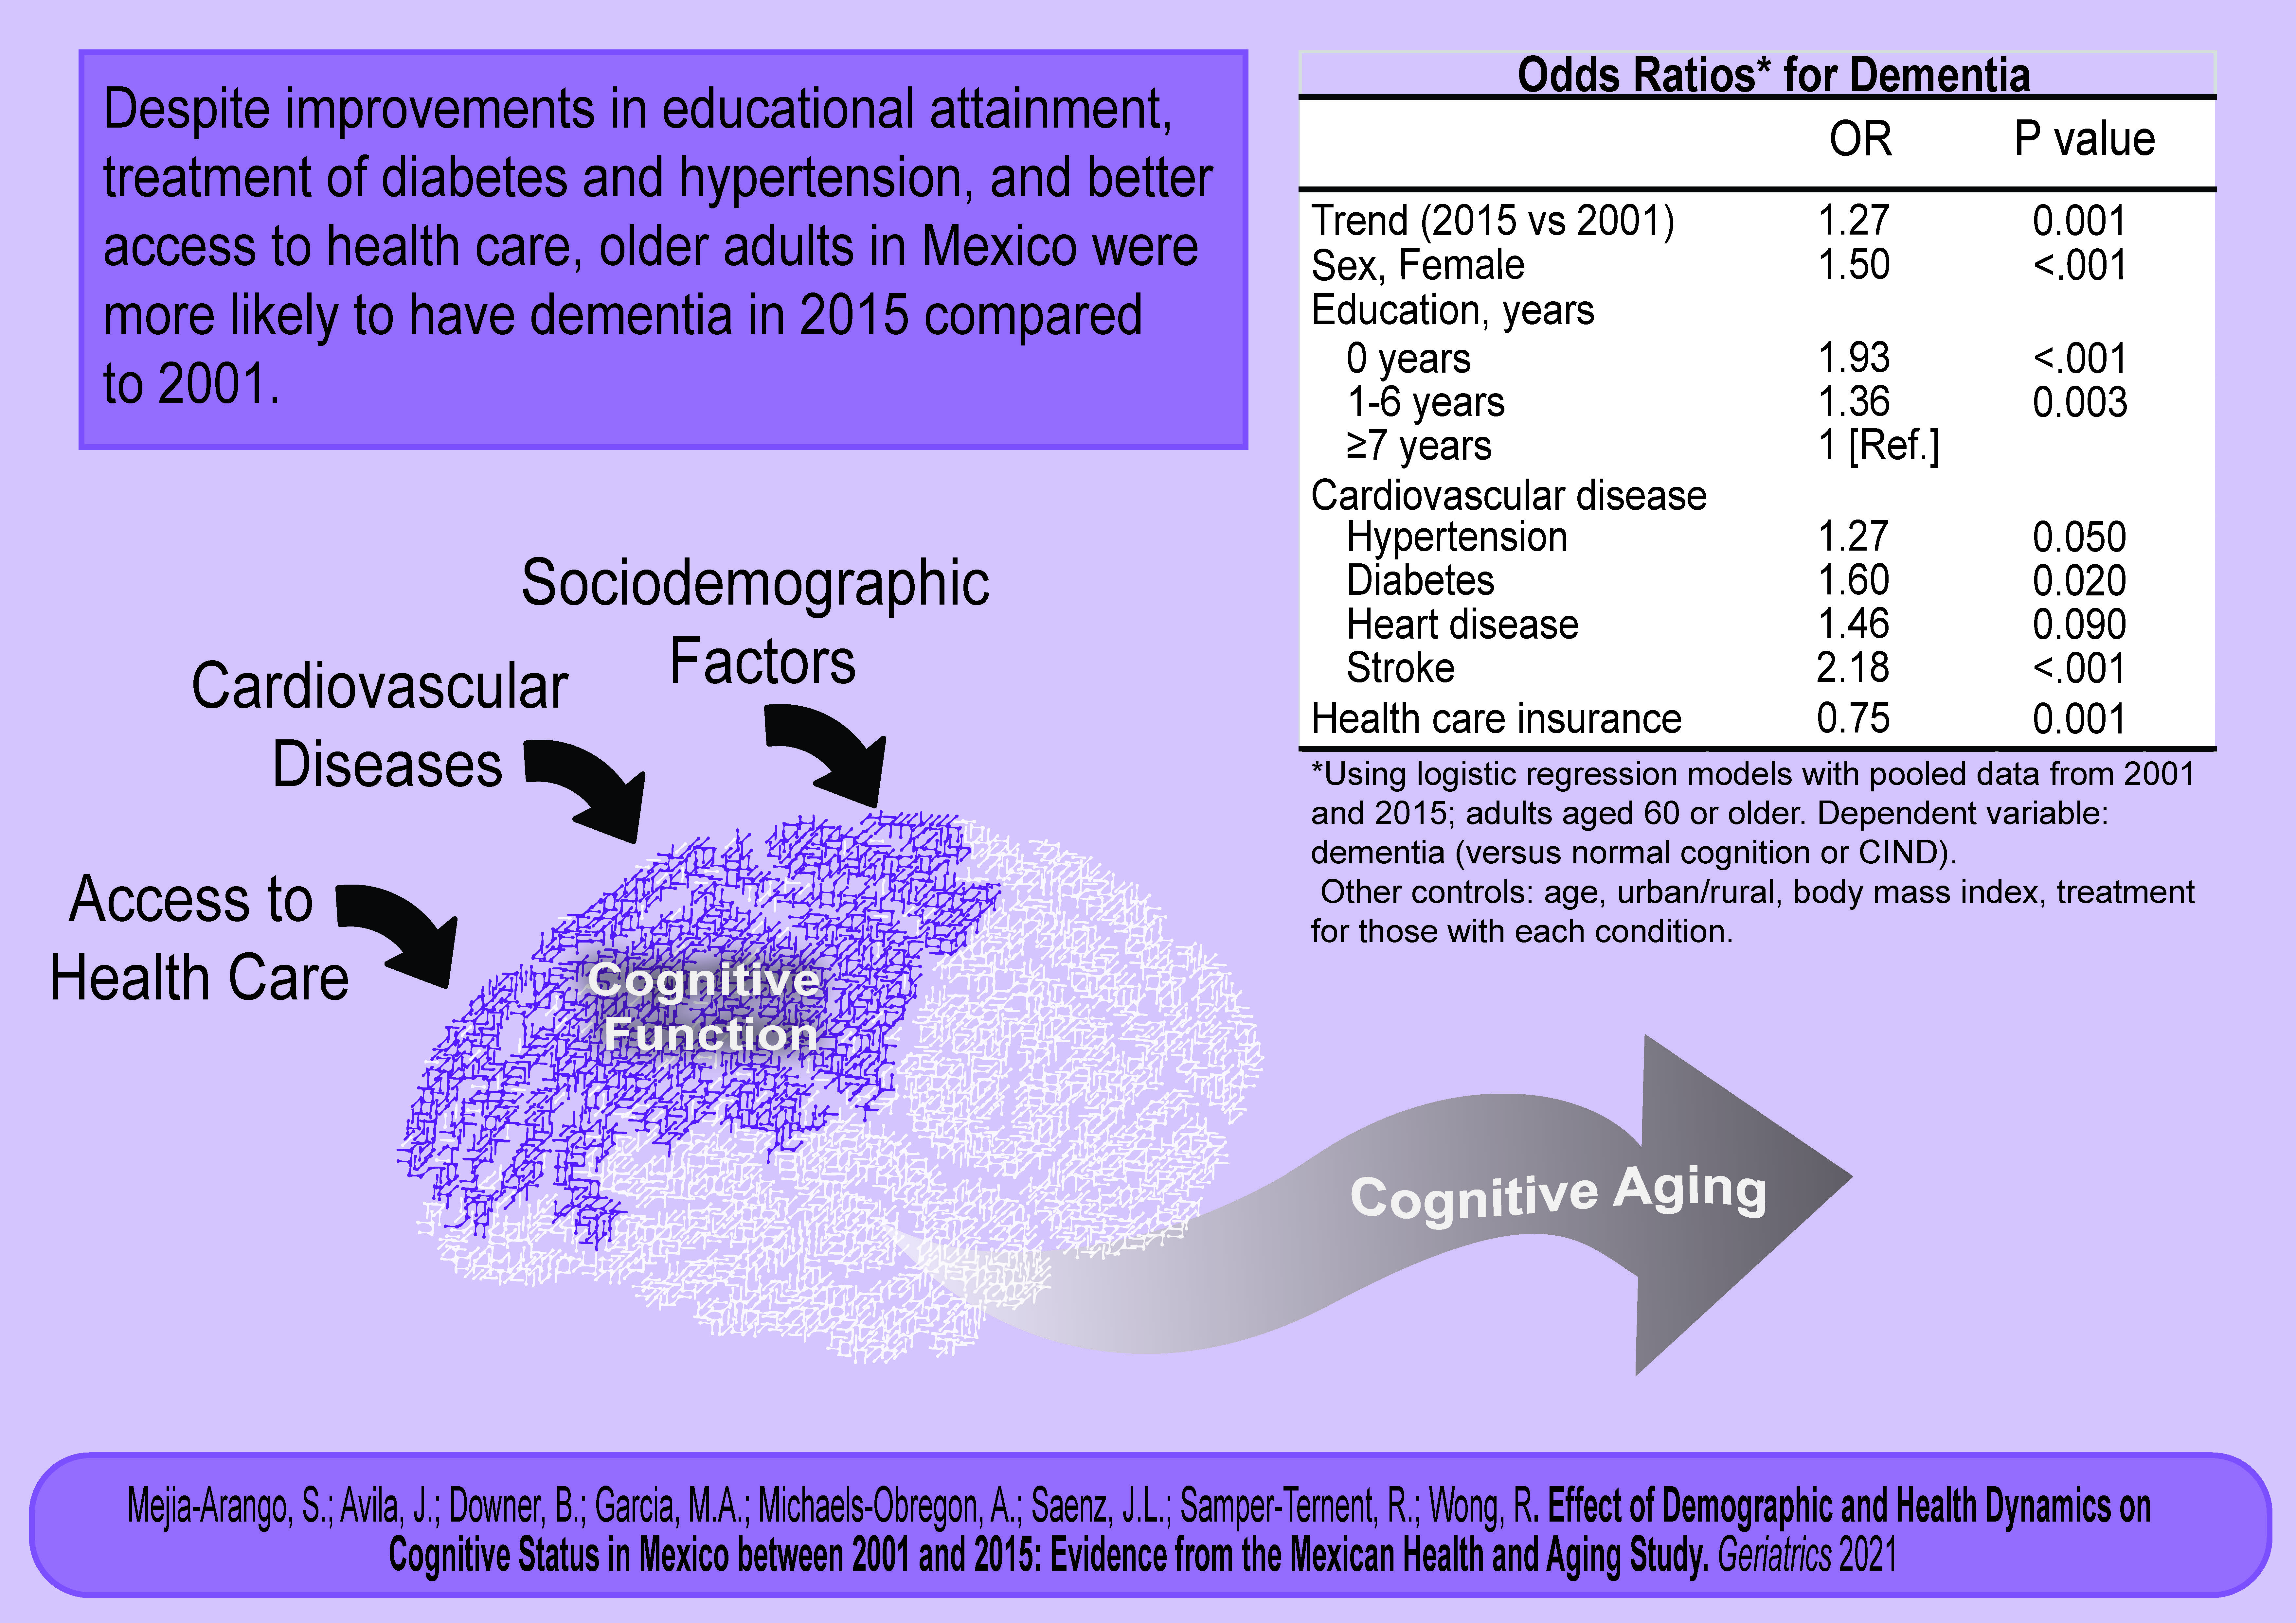
| Trend (2015 vs. 2001) | 1.27 (1.10–1.47) | 0.001 | 1.33 (1.09–1.69) | 0.020 | 1.24 (1.03–1.49) | 0.020 |
| Sex, Female | 1.50 (1.32–1.72) | <0.001 | NA | NA | ||
| Age, y | ||||||
| 60–74 years | 1 [Reference] | 1 [Reference] | 1 [Reference] | |||
| ≥75 years | 4.53 (3.97–5.17) | <0.001 | 4.72 (3.78–5.90) | <0.001 | 4.34 (3.68–5.13) | <0.001 |
| Education, y | ||||||
| 0 years | 1.93 (1.56–2.40) | <0.001 | 2.13 (1.49–3.05) | <0.001 | 1.81 (1.38–2.37) | <0.001 |
| 1–6 years | 1.36 (1.11–1.66) | 0.003 | 1.40 (1.00–1.95) | 0.05 | 1.32 (1.02–1.70) | 0.03 |
| ≥7 years | 1 [Reference] | 1 [Reference] | 1 [Reference] | |||
| Residence | ||||||
| Urban | 1 [Reference] | 1 [Reference] | 1 [Reference] | |||
| Rural | 1.04 (0.90–1.20) | 0.57 | 1.36 (1.09–1.71) | 0.006 | 0.87 (0.72–1.05) | 0.16 |
| Cardiovascular disease | ||||||
| Hypertension | 1.27 (1.00–1.61) | 0.05 | 0.74 (0.46–1.20) | 0.23 | 1.55 (1.17–2.05) | 0.002 |
| Diabetes | 1.60 (1.08–2.36) | 0.02 | 1.56 (0.82–2.98) | 0.17 | 1.68 (1.02–2.77) | 0.04 |
| Heart disease | 1.46 (0.94–2.27) | 0.09 | 1.46 (0.76–2.81) | 0.25 | 1.46 (0.79–2.68) | 0.22 |
| Stroke | 2.18 (1.52–3.13) | <0.001 | 3.80 (2.21–6.54) | <0.001 | 1.55 (0.95–2.51) | 0.08 |
| BMI | ||||||
| Underweight (<18.5) | 1.46 (1.06–2.01) | 0.02 | 1.68 (1.01–2.79) | 0.04 | 1.36 (0.90–2.07) | 0.14 |
| Normal (18.5–24.9) | 1 [Reference] | 1 [Reference] | 1 [Reference] | |||
| Overweight (25.0–29.9) | 0.72 (0.63–0.83) | <0.001 | 0.70 (0.55–0.88) | 0.002 | 0.73 (0.61–0.88) | 0.001 |
| Obese (≥30.0) | 0.63 (0.52–0.77) | <0.001 | 0.55 (0.38–0.82) | 0.003 | 0.66 (0.52–0.83) | 0.001 |
| CVD Treatment b | ||||||
| Hypertension | 0.83 (0.65–1.06) | 0.15 | 1.33 (0.81–2.19) | 0.25 | 0.71 (0.54–0.94) | 0.02 |
| Diabetes | 0.91 (0.60–1.36) | 0.65 | 1.10 (0.56–2.14) | 0.77 | 0.80 (0.48–1.34) | 0.41 |
| Heart disease | 0.99 (0.59–1.68) | 0.98 | 1.08 (0.51–2.32) | 0.82 | 0.93 (0.45–1.92) | 0.86 |
| Stroke | 3.24 (2.08–5.05) | <0.001 | 2.13 (1.11–4.09) | 0.022 | 4.04 (2.18–7.46) | <0.001 |
| Health care insurance c | 0.75 (0.63–0.89) | 0.001 | 0.94 (0.71–1.26) | 0.72 | 0.66 (0.54–0.82) | <0.001 |
| Overall | Males | Females | ||||
|---|---|---|---|---|---|---|
| OR (95% CI) | p Value | OR (95% CI) | p Value | OR (95% CI) | p Value | |
| Trend (2015 vs. 2001) | 0.53 (0.49–0.58) | <0.001 | 0.61 (0.54–0.69) | <0.001 | 0.46 (0.41–0.53) | <0.001 |
| Sex, Male | 1.33 (1.22–1.44) | <0.001 | NA | NA | ||
| Age, y | ||||||
| 60–74 years | 1 [Reference] | 1 [Reference] | 1 [Reference] | |||
| ≥75 years | 1.01 (0.92–1.12) | 0.70 | 1.26 (1.11–1.44) | <0.001 | 0.78 (0.68–0.91) | 0.001 |
| Education, y | ||||||
| 0 years | 0.83 (0.72–0.94) | 0.006 | 0.76 (0.63–0.91) | 0.004 | 0.89 (0.74–1.07) | 0.23 |
| 1–6 years | 0.95 (0.85–1.06) | 0.38 | 1.00 (0.86–1.16) | 0.97 | 0.90 (0.77–1.06) | 0.22 |
| ≥7 years | 1 [Reference] | 1 [Reference] | 1 [Reference] | |||
| Residence | ||||||
| Urban | 1 [Reference] | 1 [Reference] | 1 [Reference] | |||
| Rural | 1.36 (1.23–1.49) | <0.001 | 1.36 (1.19–1.54) | <0.001 | 1.36 (1.18–1.56) | <0.001 |
| Cardiovascular disease | ||||||
| Hypertension | 0.98 (0.83–1.14) | 0.80 | 0.95 (0.76–1.19) | 0.68 | 0.98 (0.78–1.22) | 0.86 |
| Diabetes | 1.10 (0.83–1.46) | 0.50 | 1.20 (0.82–1.75) | 0.33 | 0.98 (0.63–1.52) | 0.93 |
| Heart disease | 0.69 (0.46–1.05) | 0.09 | 0.78 (0.47–1.29) | 0.34 | 0.53 (0.25–1.11) | 0.09 |
| Stroke | 0.71 (0.48–1.06) | 0.09 | 0.61 (0.32–1.14) | 0.12 | 0.80 (0.48–1.33) | 0.40 |
| BMI | ||||||
| Underweight (<18.5) | 1.05 (0.79–1.40) | 0.72 | 1.19 (0.79–1.78) | 0.39 | 0.94 (0.62–1.42) | 0.77 |
| Normal (18.5–24.9) | 1 [Reference] | 1 [Reference] | 1 [Reference] | |||
| Overweight (25.0–29.9) | 0.88 (0.80–0.96) | 0.008 | 0.89 (0.78–1.01) | 0.07 | 0.86 (0.75–0.98) | 0.03 |
| Obese (≥30.0) | 0.70 (0.62–0.79) | <0.001 | 0.75 (0.62–0.90) | 0.002 | 0.67 (0.56–0.79) | <0.001 |
| CVD Treatment b | ||||||
| Hypertension | 0.97 (0.83–1.14) | 0.77 | 1.02 (0.80–1.29) | 0.84 | 0.95 (0.76–1.19) | 0.70 |
| Diabetes | 0.98 (0.73–1.32) | 0.91 | 0.92 (0.62–1.37) | 0.70 | 1.07 (0.68–1.70) | 0.74 |
| Heart disease | 1.18 (0.73–1.92) | 0.48 | 1.06 (0.58–1.92) | 0.84 | 1.49 (0.64–3.45) | 0.35 |
| Stroke | 1.56 (0.92–2.64) | 0.09 | 1.93 (0.90–4.11) | 0.08 | 1.30 (0.60–2.83) | 0.50 |
| Health care insurance c | 0.85 (0.77–0.95) | 0.004 | 0.87 (0.75–1.01) | 0.07 | 0.82 (0.70–0.95) | 0.01 |
Publisher’s Note: MDPI stays neutral with regard to jurisdictional claims in published maps and institutional affiliations. |
© 2021 by the authors. Licensee MDPI, Basel, Switzerland. This article is an open access article distributed under the terms and conditions of the Creative Commons Attribution (CC BY) license (https://creativecommons.org/licenses/by/4.0/).
Share and Cite
Mejia-Arango, S.; Avila, J.; Downer, B.; Garcia, M.A.; Michaels-Obregon, A.; Saenz, J.L.; Samper-Ternent, R.; Wong, R. Effect of Demographic and Health Dynamics on Cognitive Status in Mexico between 2001 and 2015: Evidence from the Mexican Health and Aging Study. Geriatrics 2021, 6, 63. https://0-doi-org.brum.beds.ac.uk/10.3390/geriatrics6030063
Mejia-Arango S, Avila J, Downer B, Garcia MA, Michaels-Obregon A, Saenz JL, Samper-Ternent R, Wong R. Effect of Demographic and Health Dynamics on Cognitive Status in Mexico between 2001 and 2015: Evidence from the Mexican Health and Aging Study. Geriatrics. 2021; 6(3):63. https://0-doi-org.brum.beds.ac.uk/10.3390/geriatrics6030063
Chicago/Turabian StyleMejia-Arango, Silvia, Jaqueline Avila, Brian Downer, Marc A. Garcia, Alejandra Michaels-Obregon, Joseph L. Saenz, Rafael Samper-Ternent, and Rebeca Wong. 2021. "Effect of Demographic and Health Dynamics on Cognitive Status in Mexico between 2001 and 2015: Evidence from the Mexican Health and Aging Study" Geriatrics 6, no. 3: 63. https://0-doi-org.brum.beds.ac.uk/10.3390/geriatrics6030063