
Comparison of Plant Metabolites in Root Exudates of Lolium perenne Infected with Different Strains of the Fungal Endophyte Epichloë festucae var. lolii


Abstract
:1. Introduction
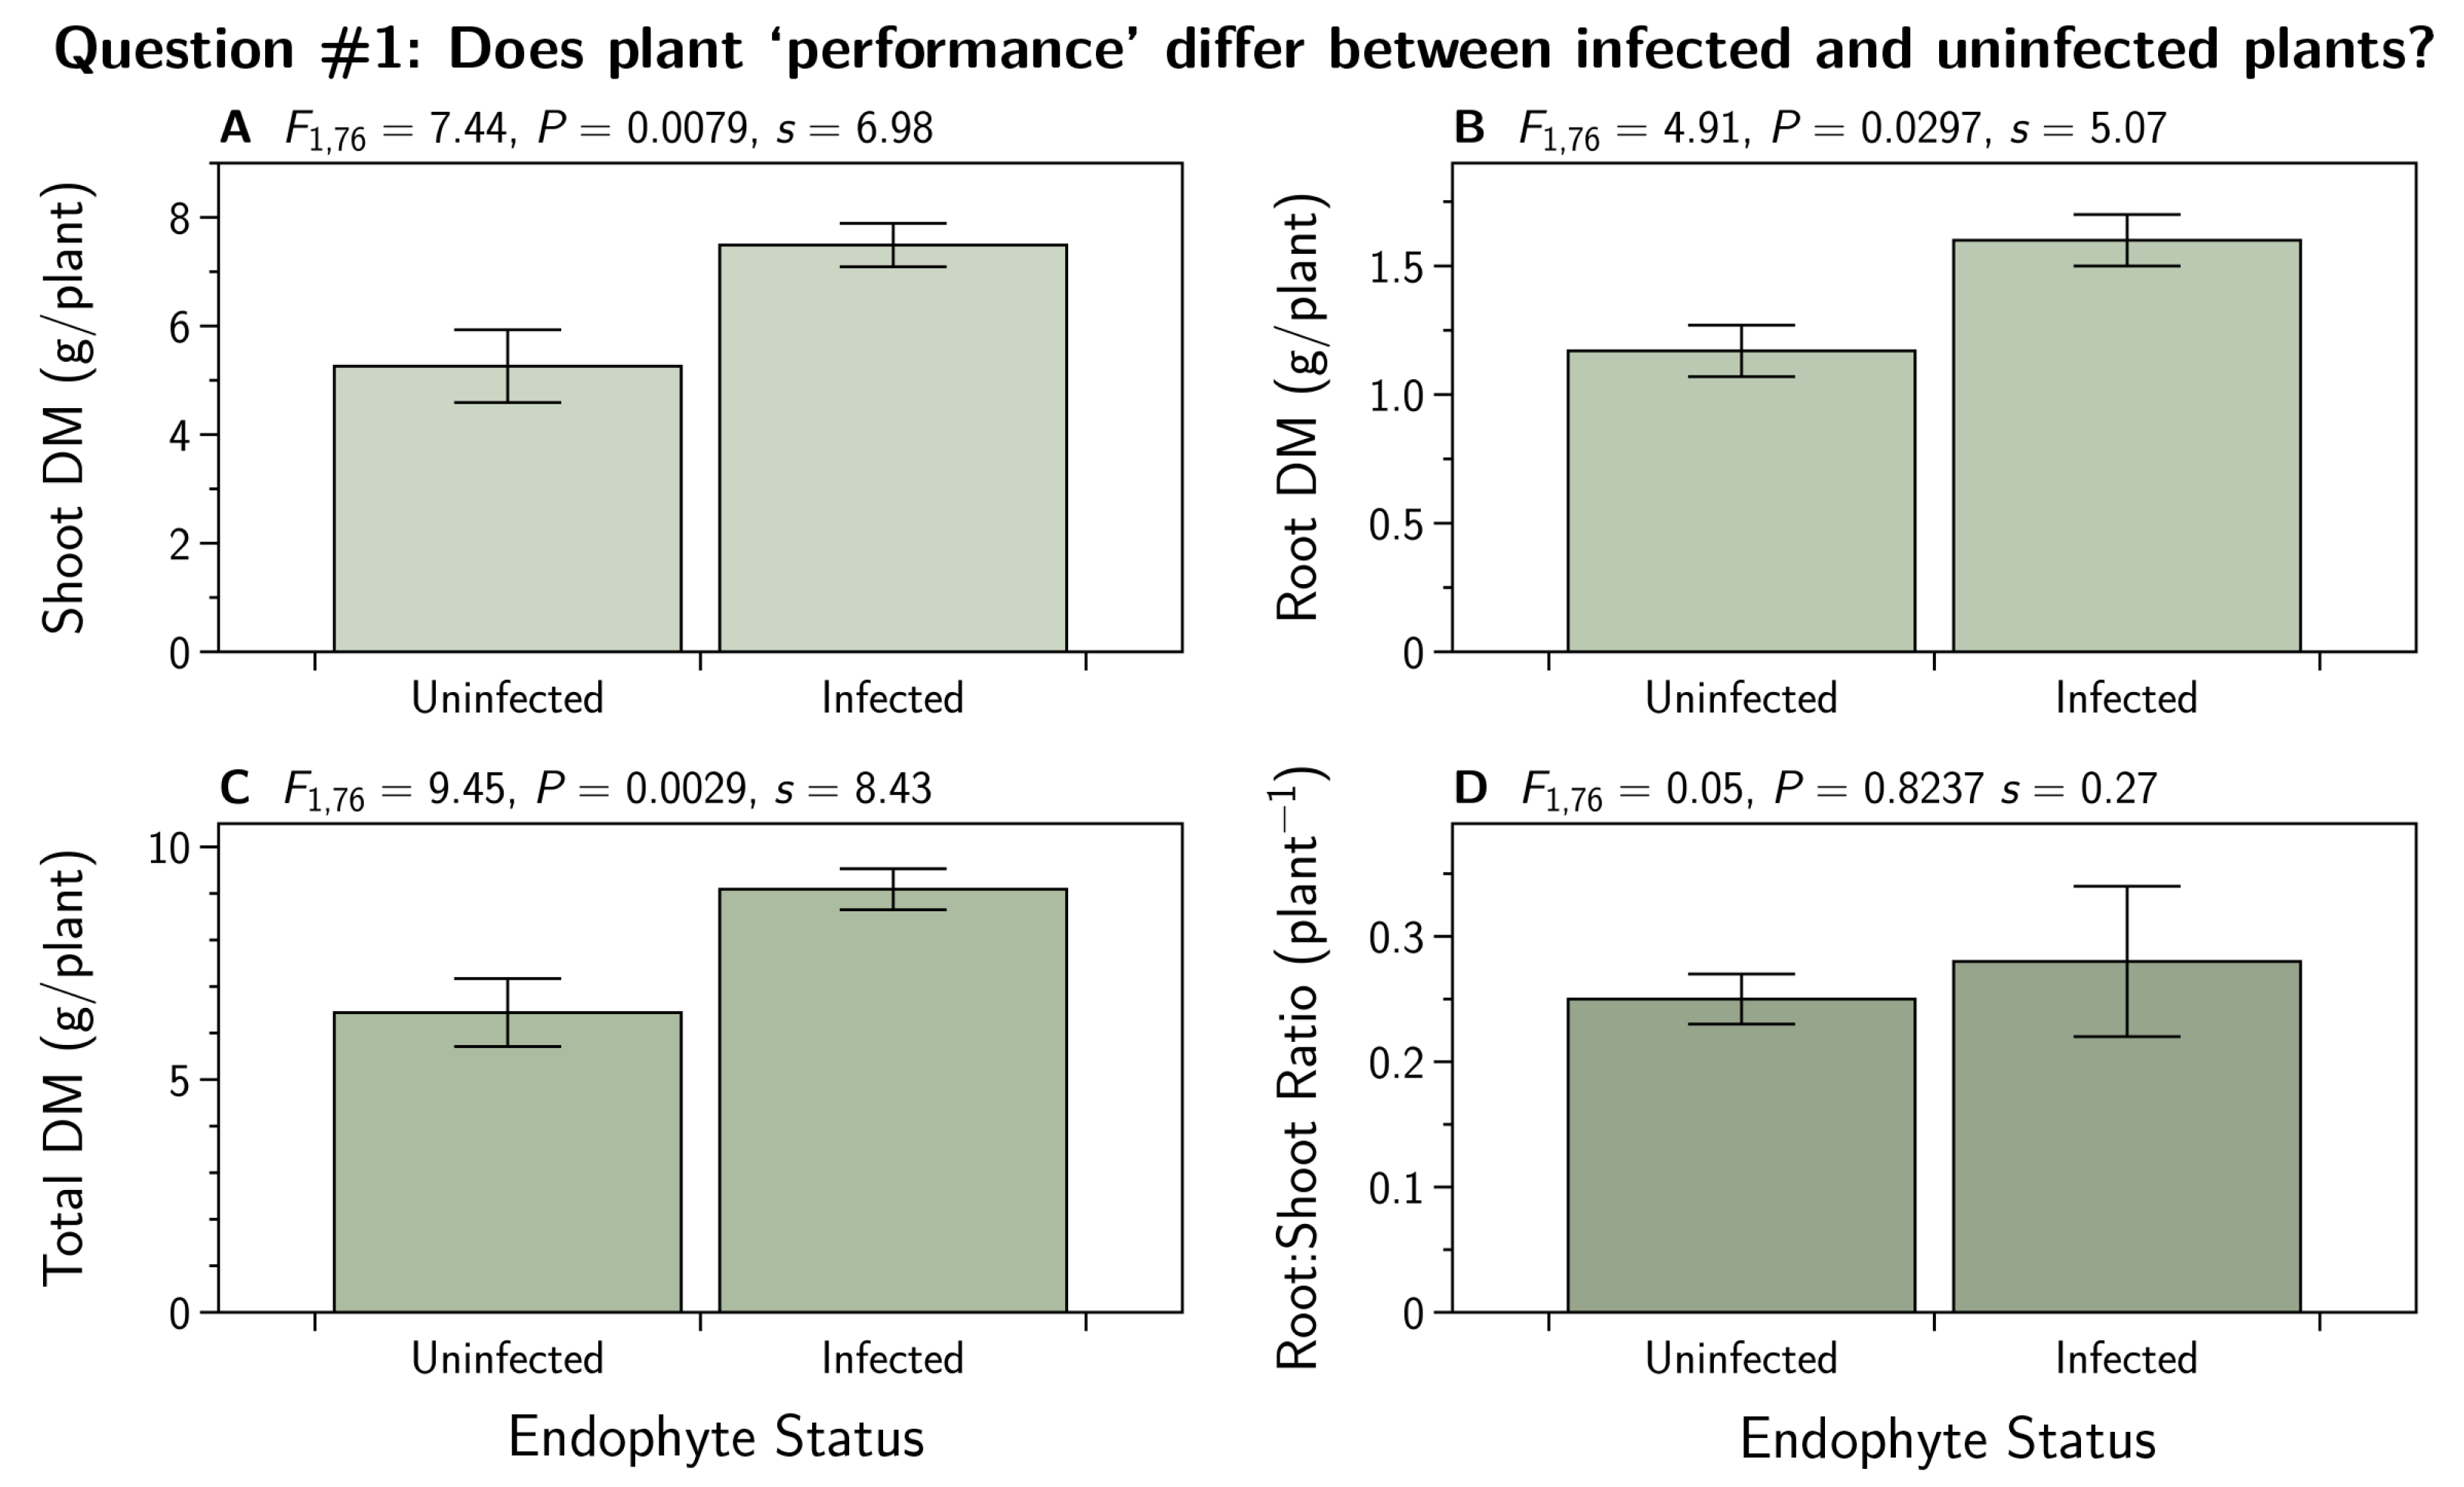
- Q1:
- Does plant ‘performance’ (root dry mass (DM), shoot DM, root to shoot ratio) differ between infected and uninfected plants?
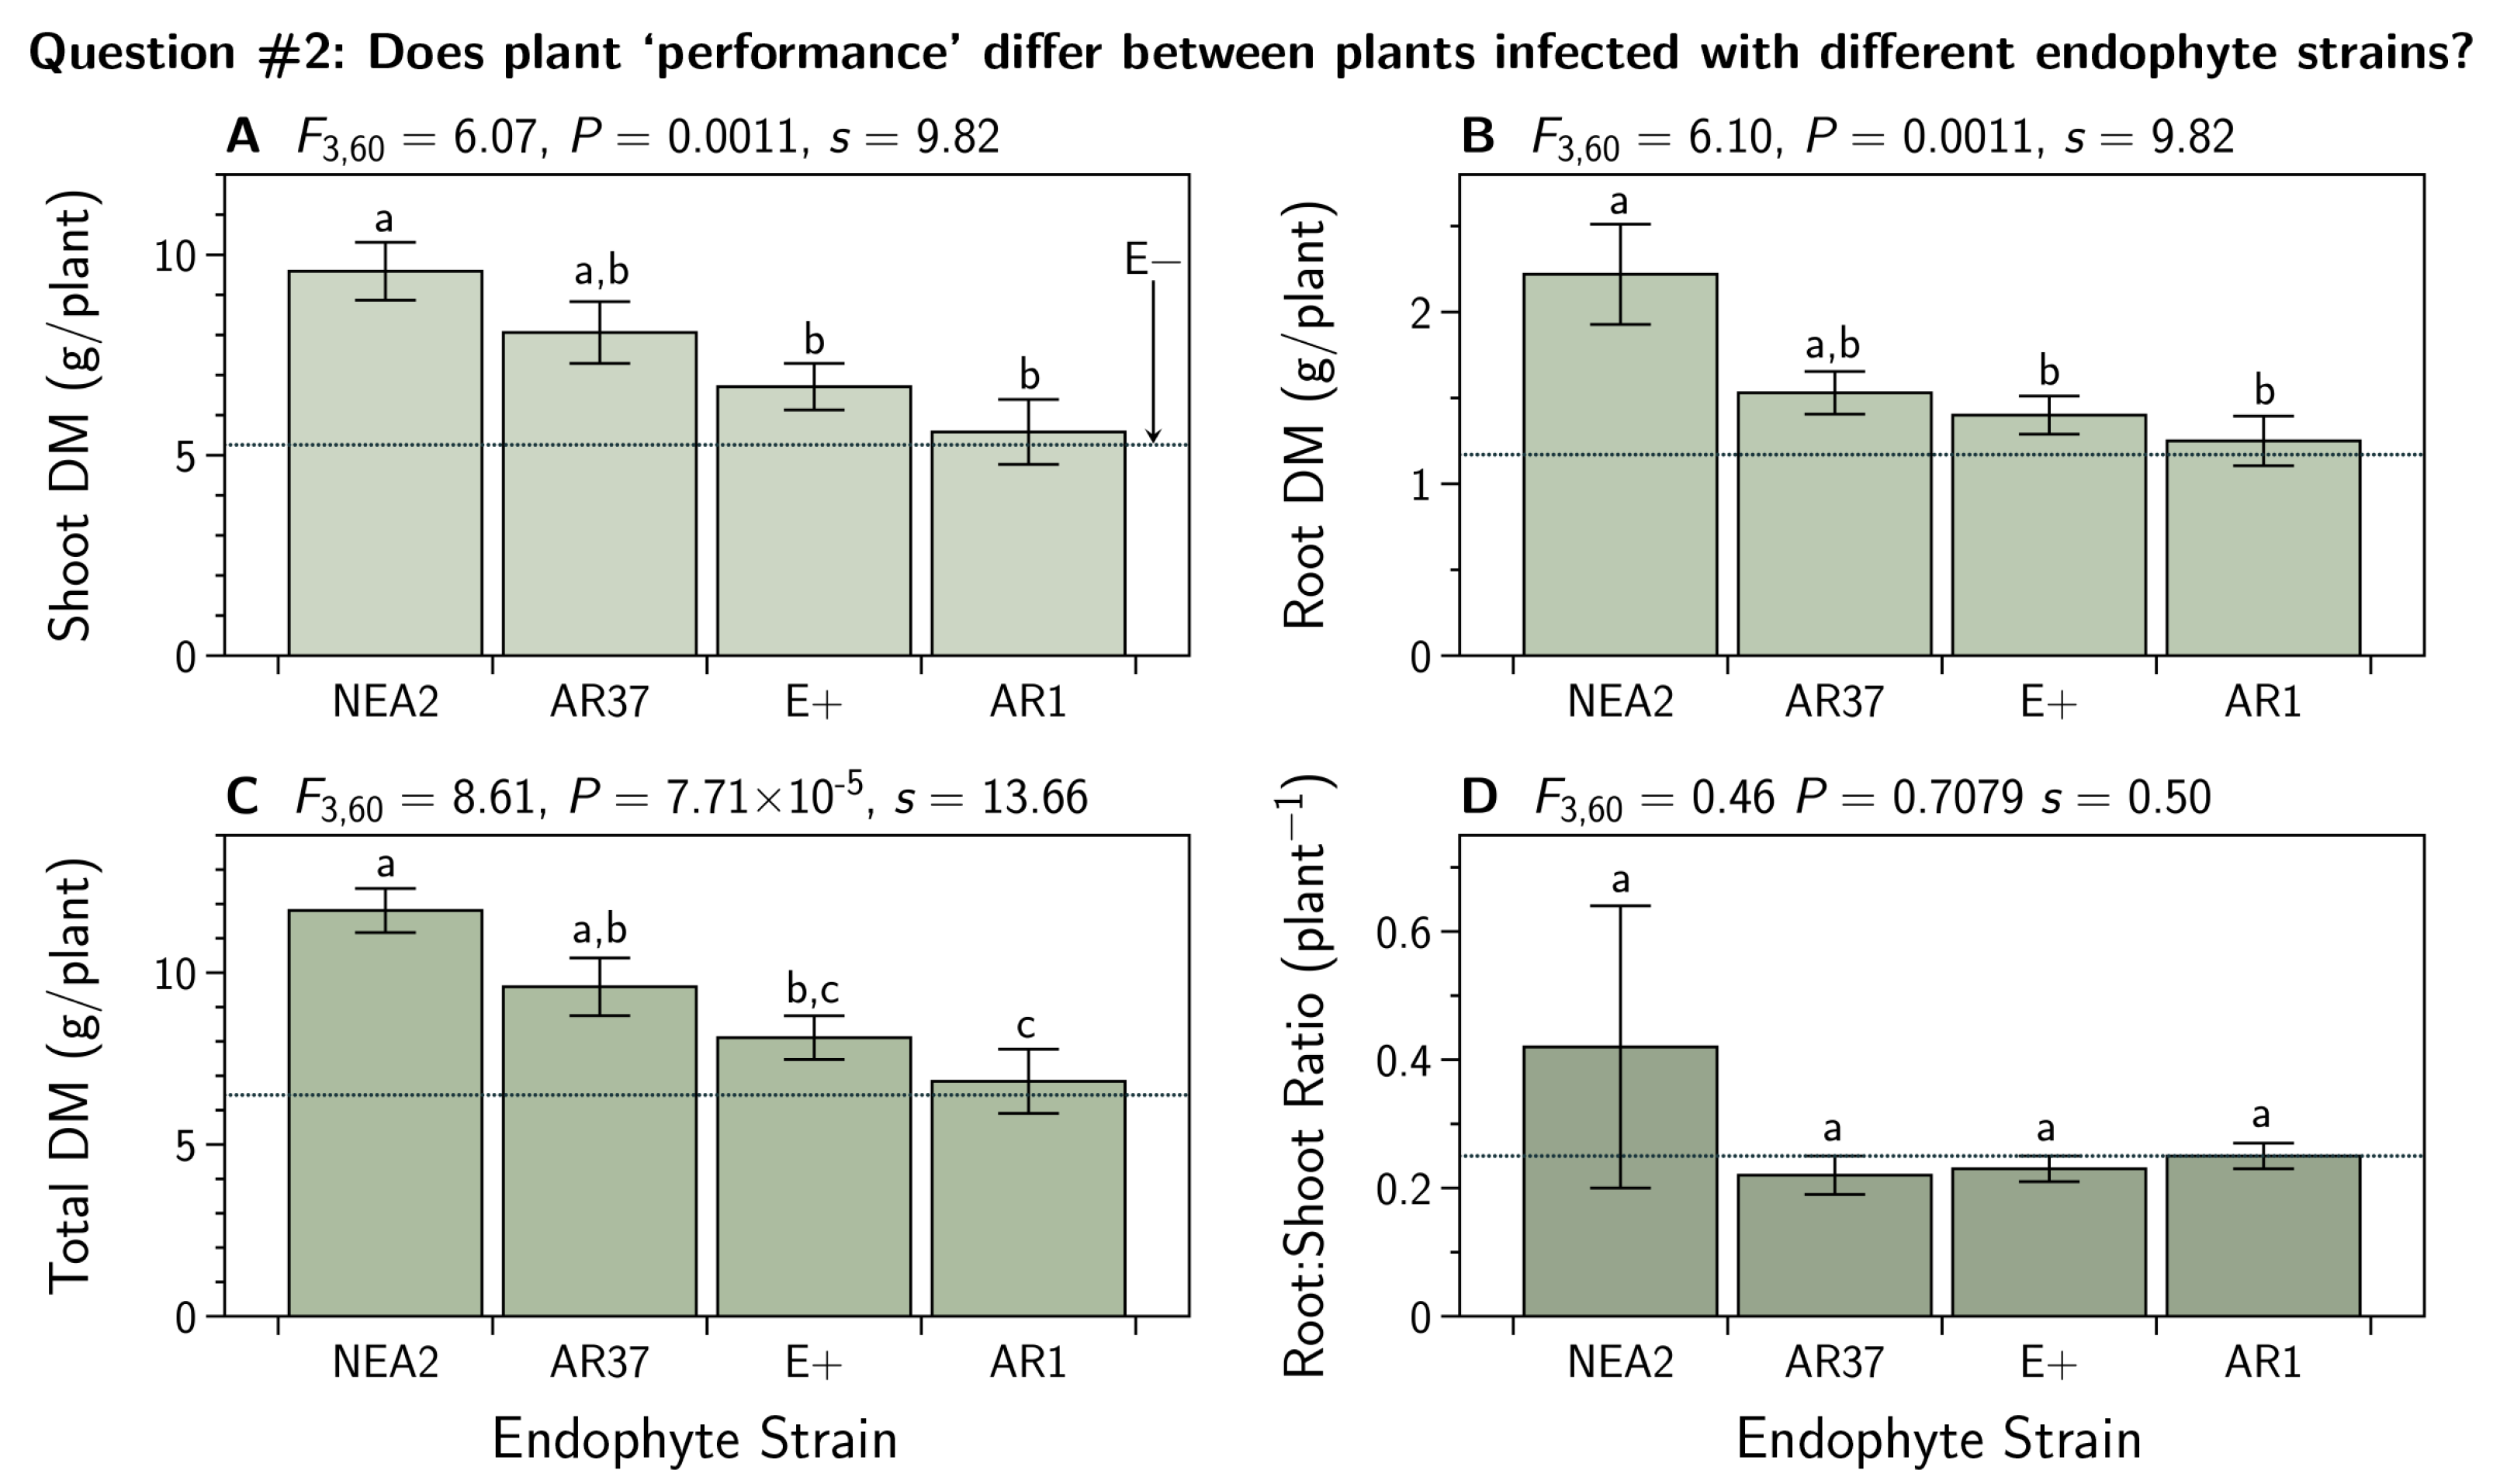
- Q2:
- Does plant ‘performance’ differ between plants infected with different endophyte strains?
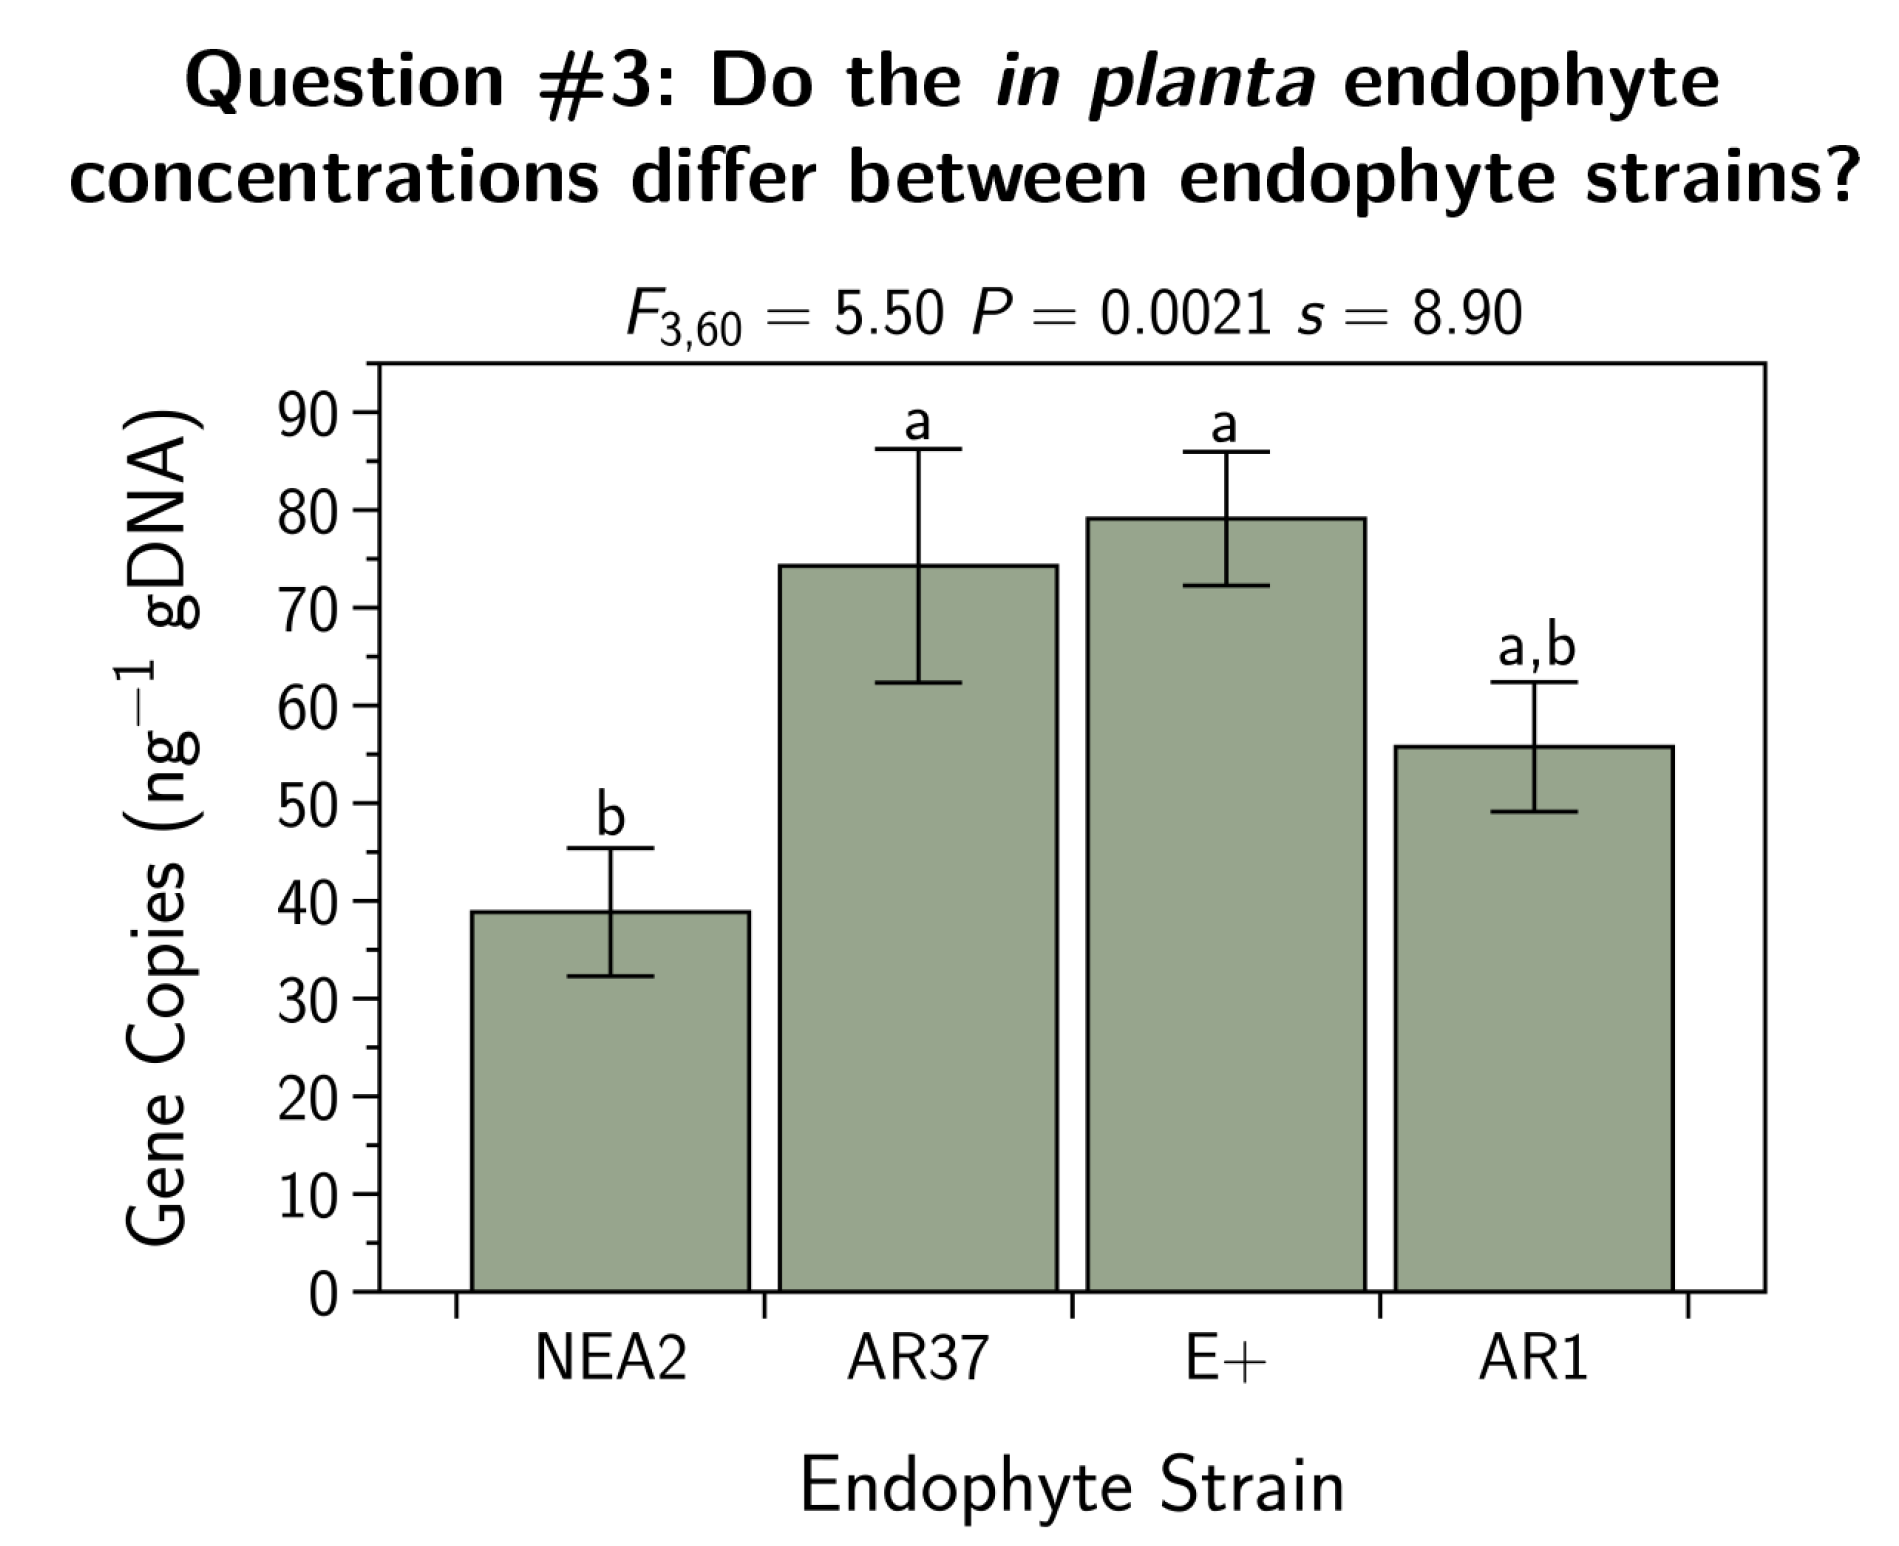
- Q3:
- Do the in planta endophyte concentrations differ between endophyte strains?
- Q4:
- Do the exudate metabolomes differ between infected and uninfected plants?
- Q5:
- Do the exudate metabolomes differ between plants infected with different strains?
- Q6:
- Do relative abundances of any of the exudate metabolites correlate with endophyte concentration?
2. Methods
2.1. Experimental Design
2.2. Sample Preparation
2.3. Sample Collection
2.4. Endophyte Concentration
2.5. Metabolomic Profile of Root Exudate
2.6. Metabolomic Data Analysis
2.7. Statistical Analyses
2.7.1. Contrast Analysis to Compare Uninfected and Infected Plants
2.7.2. ANOVA and Tukey’s HSD to Compare Effects of Different Endophyte Strains
2.7.3. Analysis of Plant Performance and Endophyte Concentration
2.7.4. Analysis of the Exudate Metabolome
3. Results
3.1. Does Plant ‘Performance’ Differ between Infected and Uninfected Plants?
3.2. Does Plant ‘Performance’ Differ between Plants Infected with Different Endophyte Strains?
3.3. Do the in Planta Endophyte Concentrations Differ between Endophyte Strains?
3.4. Do the Exudate Metabolomes Differ between Infected and Uninfected Plants?
3.4.1. Positive Ion Mode
3.4.2. Negative Ion Mode
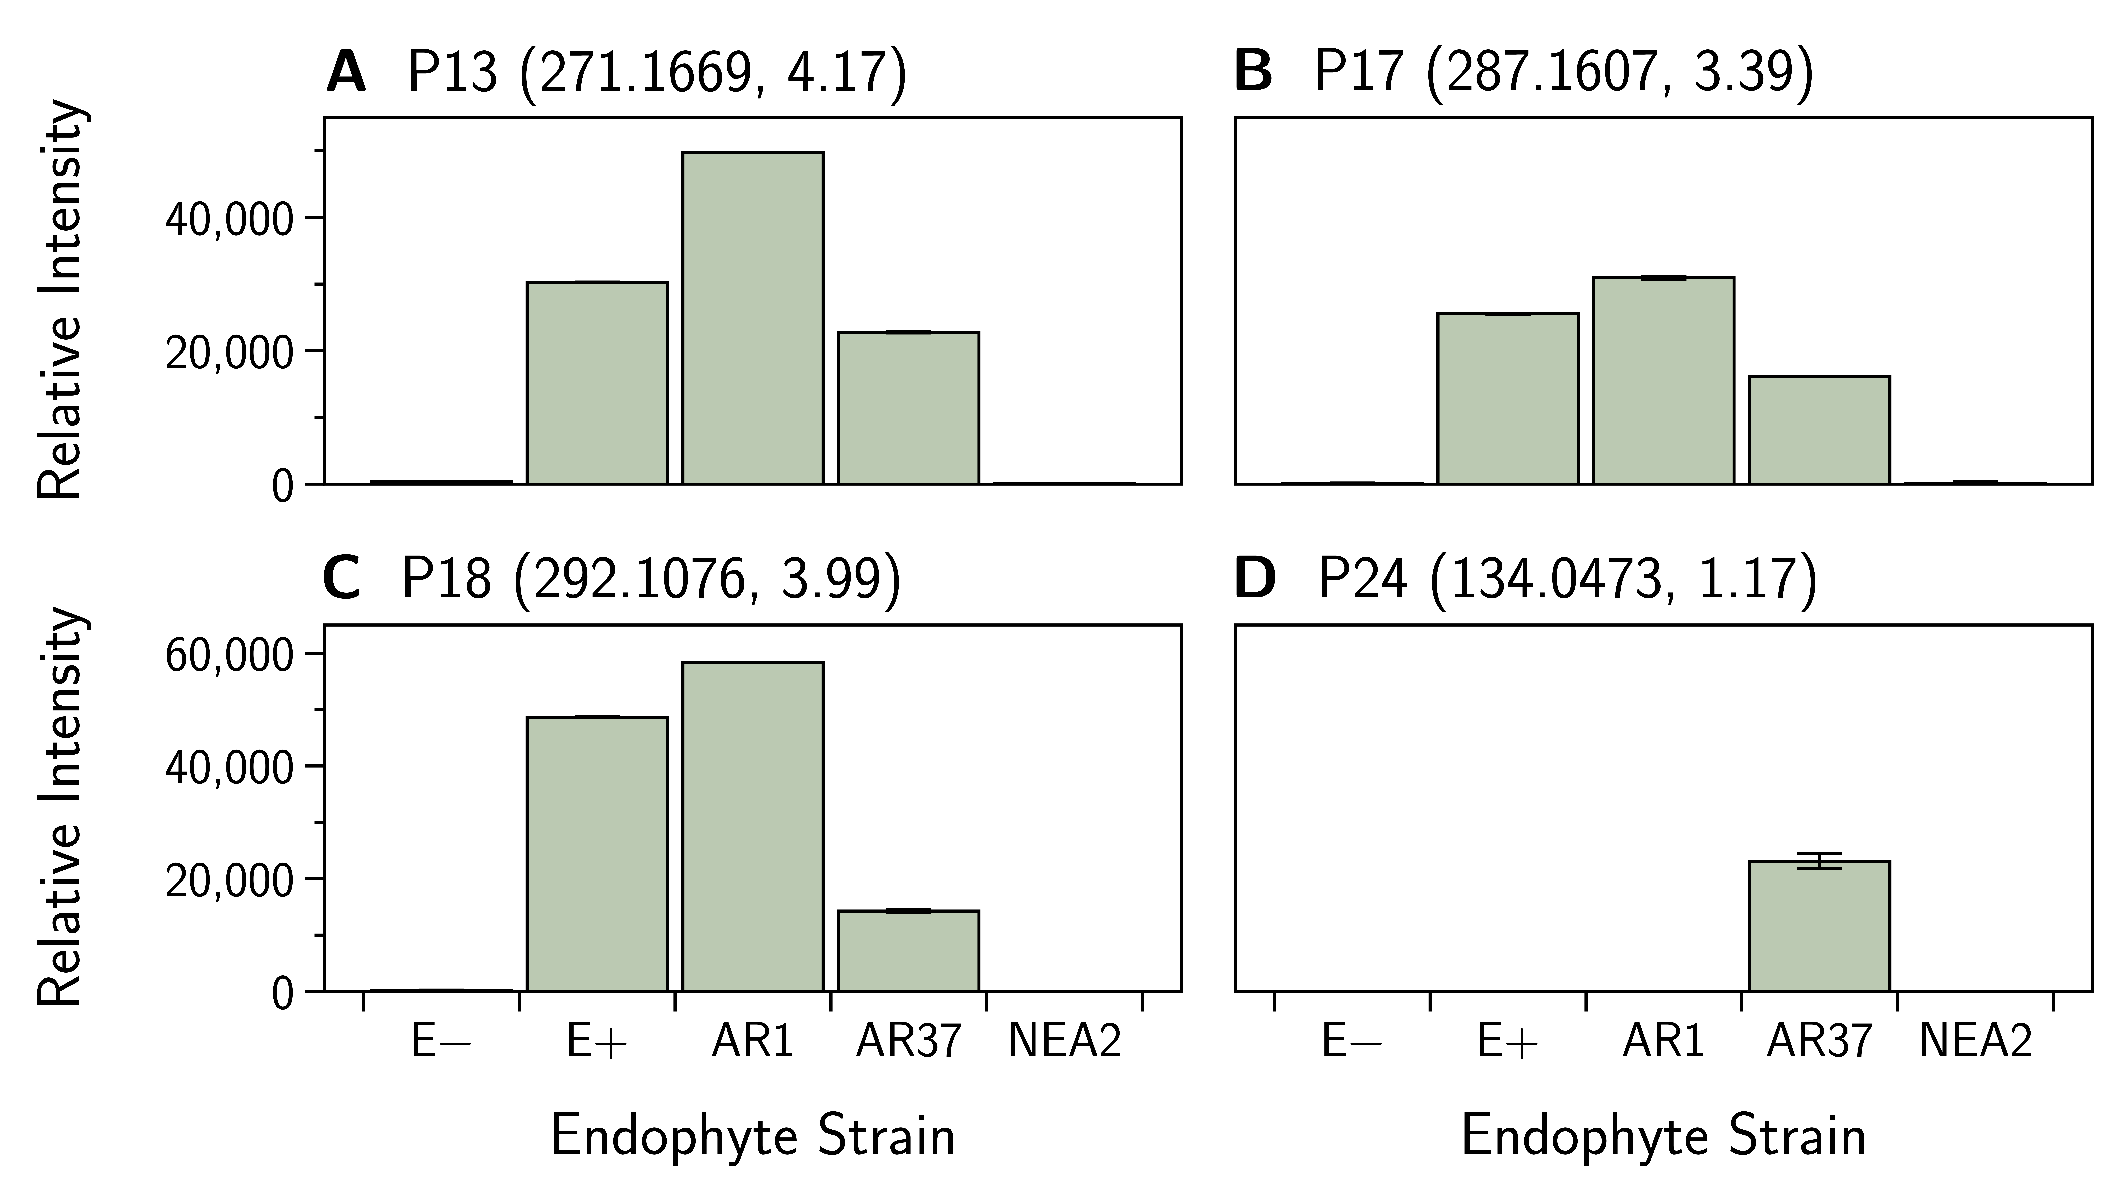
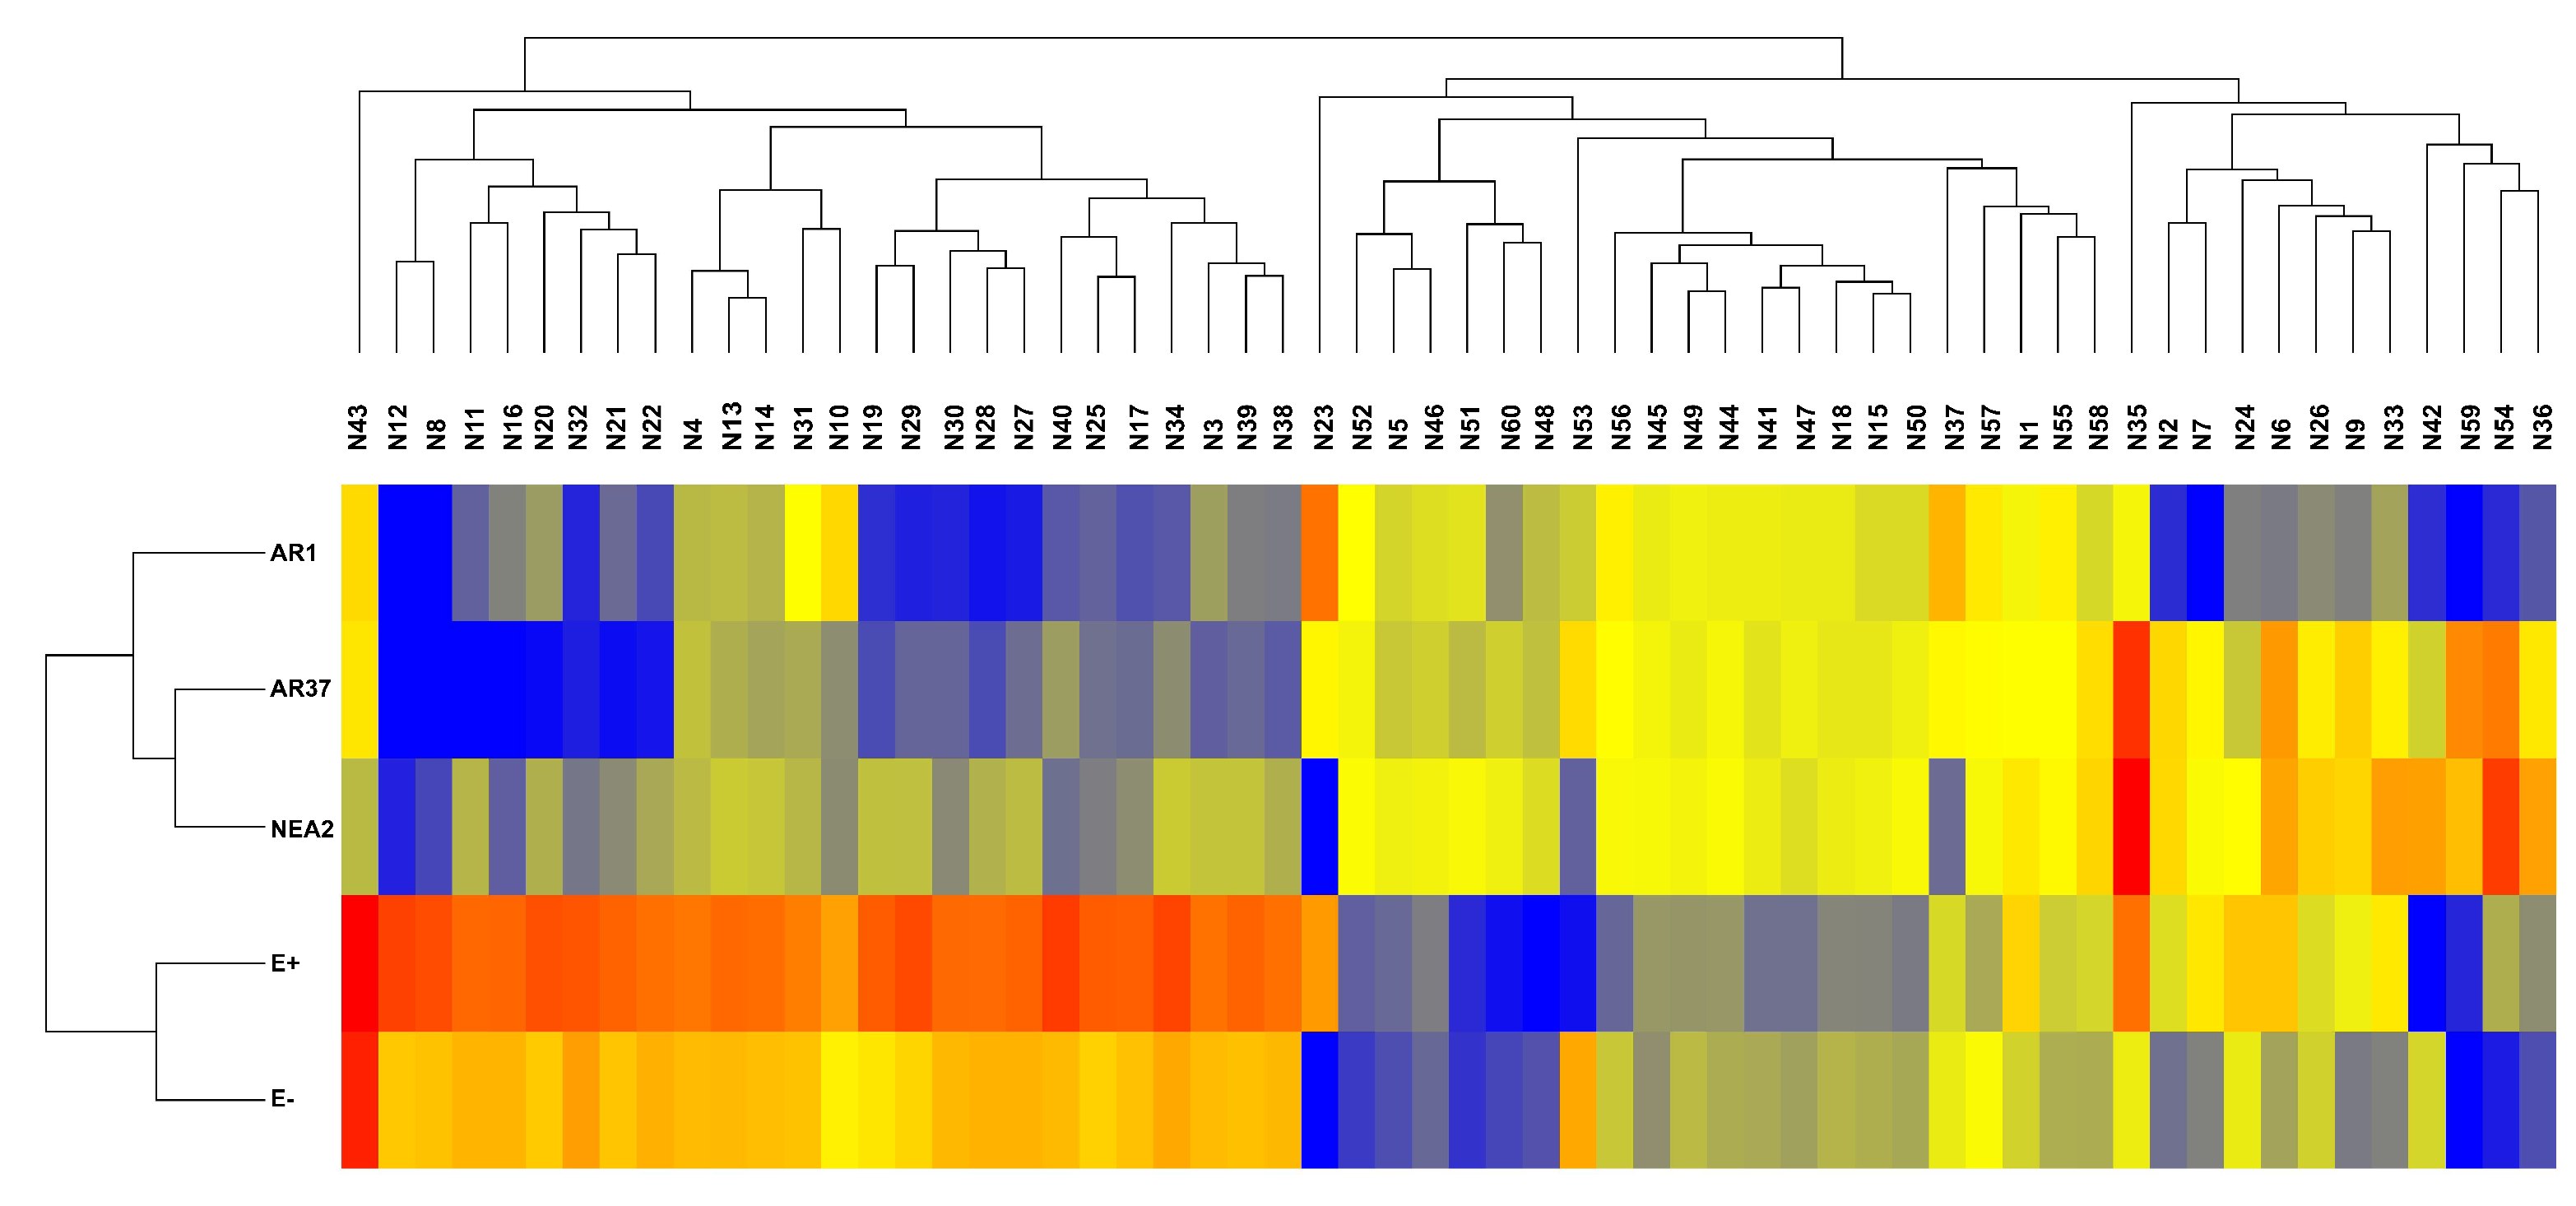
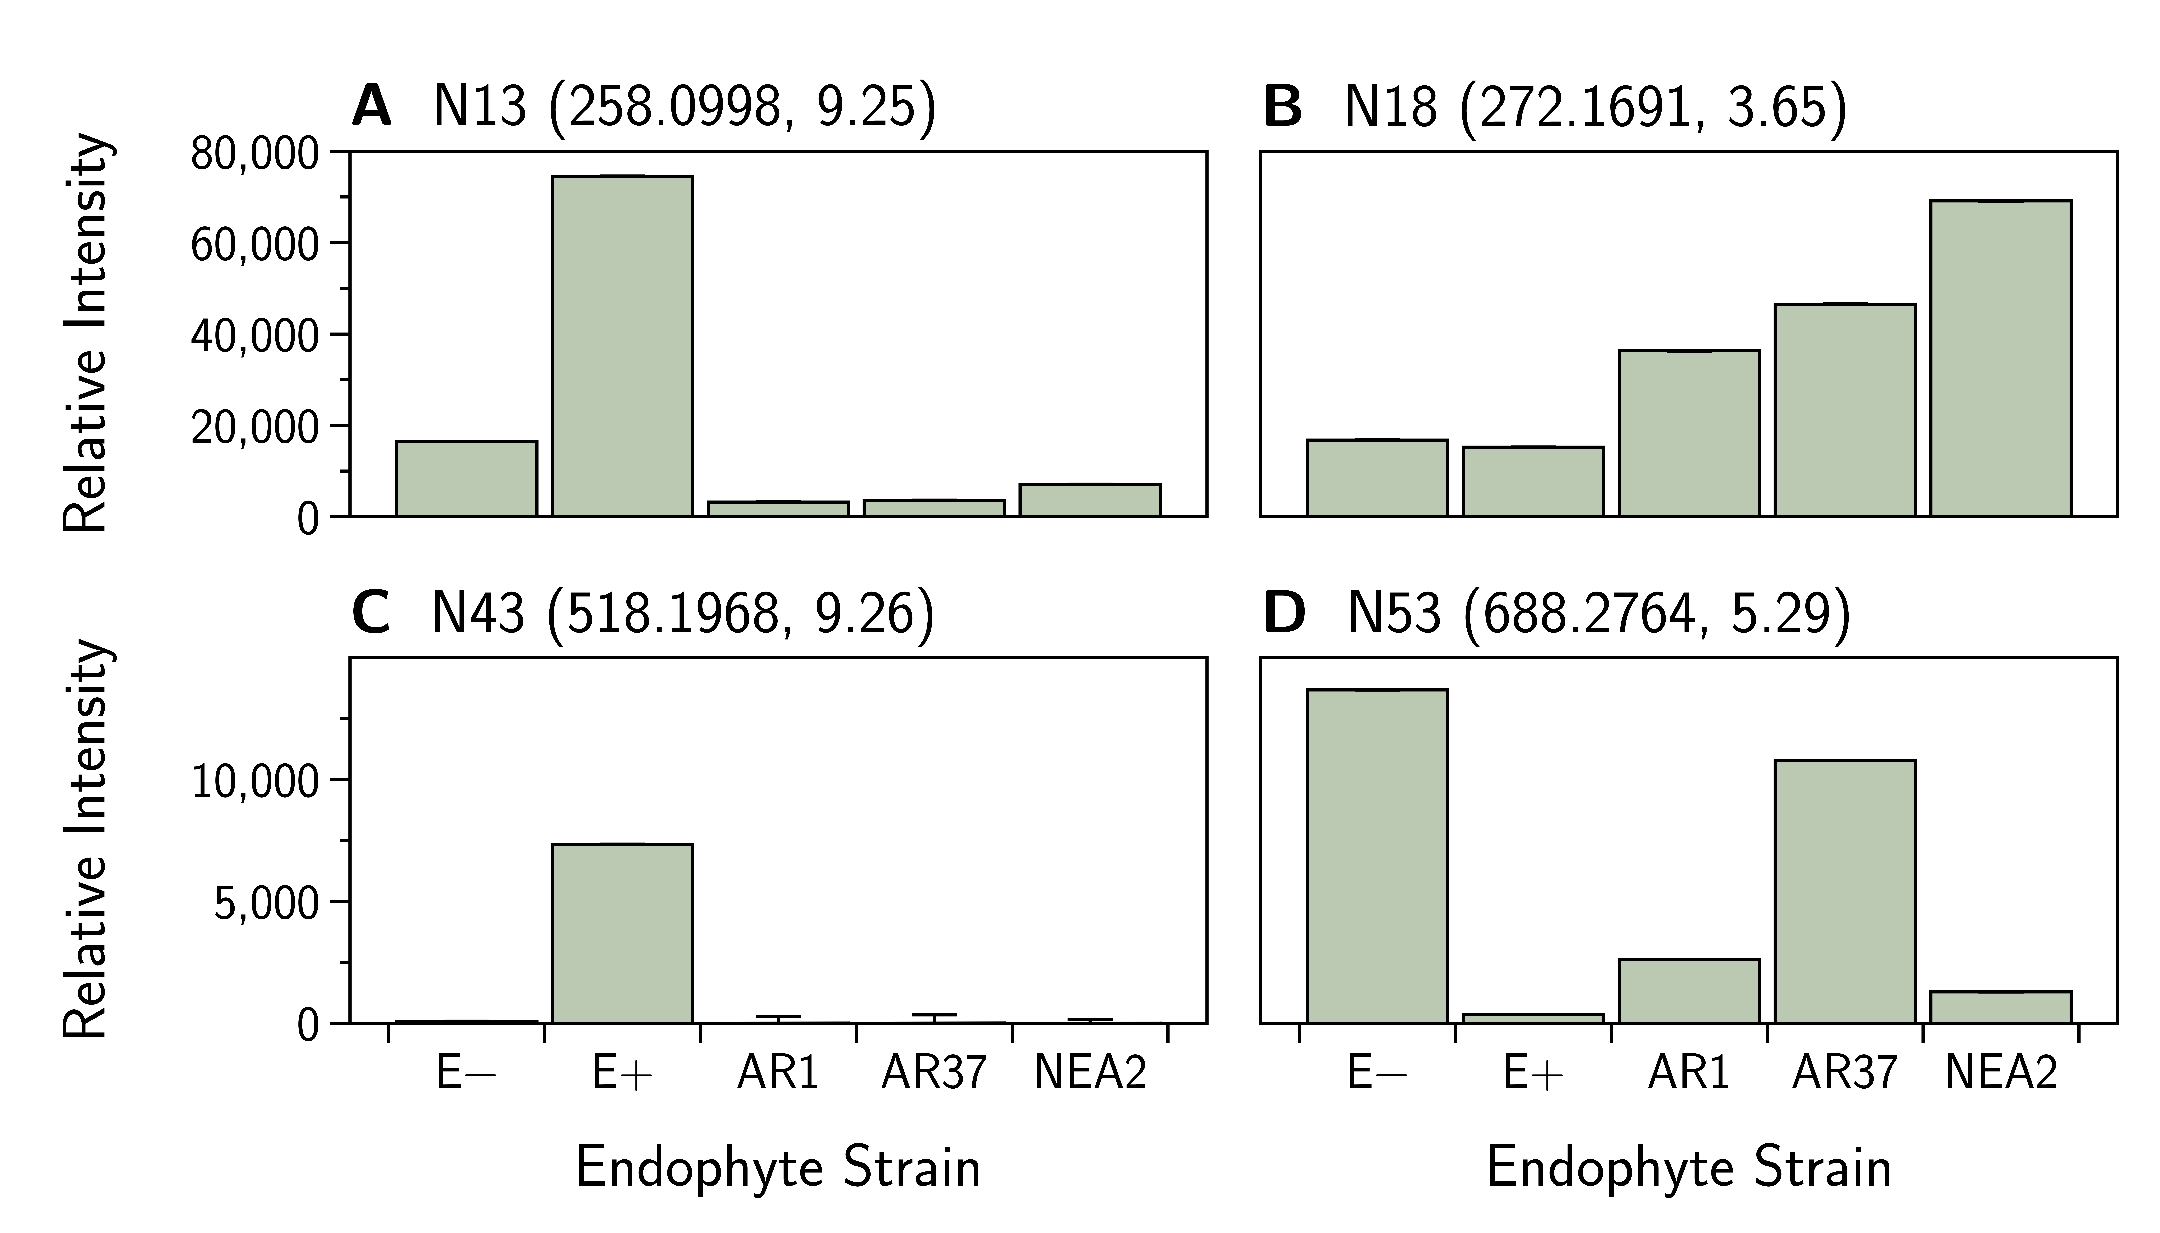
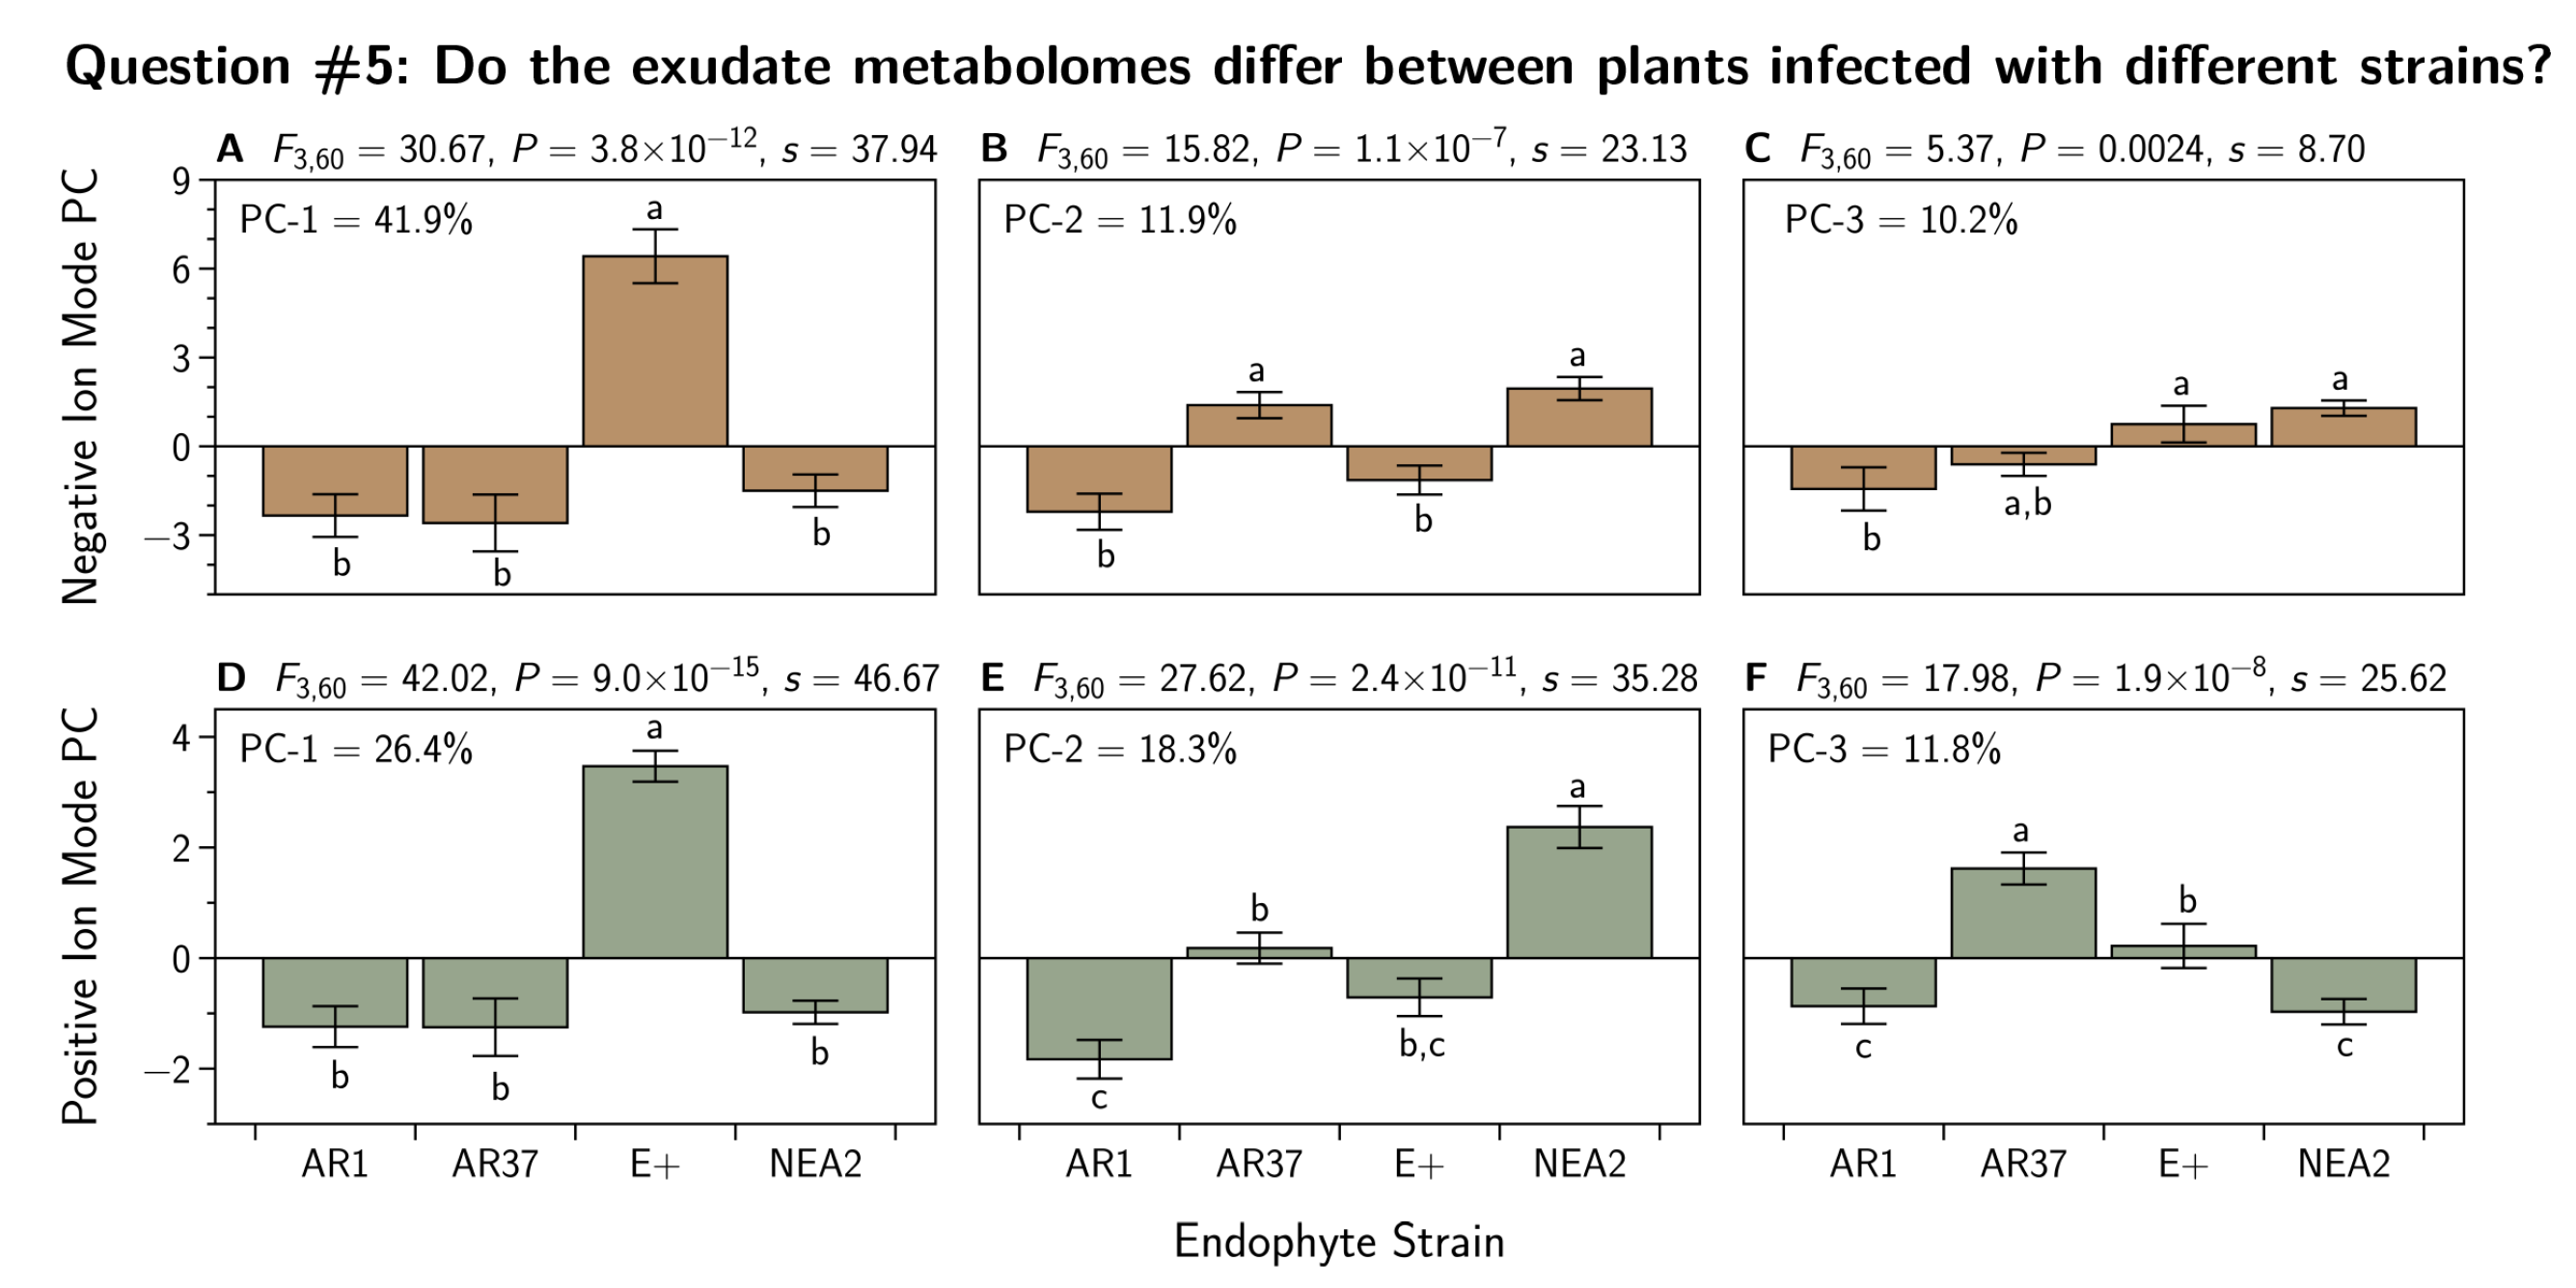
3.5. Do the Exudate Metabolomes Differ between Plants Infected with Different Strains?
3.5.1. Positive Ion Mode
3.5.2. Negative Ion Mode
3.6. Do Relative Abundances of Any of the Exudate Metabolites Correlate with Endophyte Concentration?
4. Discussion
4.1. Does Plant ‘Performance’ Differ between Infected and Uninfected Plants?
4.2. Does Plant ‘Performance’ Differ between Plants Infected with Different Endophyte Strains?
4.3. Do the in Planta Endophyte Concentrations Differ between Endophyte Strains?
4.4. Do the Exudate Metabolomes Differ between Infected and Uninfected Plants?
4.5. Do the Exudate Metabolomes Differ between Plants Infected with Different Strains?
4.6. Do Relative Abundances of Any of the Exudate Metabolites Correlate with Endophyte Concentration?
4.7. General Discussion
4.7.1. Endophyte Infection
4.7.2. Biomass
4.7.3. Metabolites in Root Exudate
4.8. Conclusions
Supplementary Materials
Author Contributions
Funding
Institutional Review Board Statement
Informed Consent Statement
Data Availability Statement
Acknowledgments
Conflicts of Interest
Appendix A. Metabolite Details

| Treatment | E− | E+ | AR1 | AR37 | NEA2 |
|---|---|---|---|---|---|
| E− | 41 | 12 | 8 | 15 | 9 |
| E+ | 29 | 41 | 20 | 19 | 26 |
| AR1 | 33 | 21 | 41 | 5 | 10 |
| AR37 | 26 | 22 | 36 | 41 | 4 |
| NEA2 | 32 | 15 | 31 | 37 | 41 |
| Positive Ionization Mode | Fold-Change (Log2) | ||||||||
|---|---|---|---|---|---|---|---|---|---|
| Mass (Code) | m/z | RT | Fragments | P(1) | p-Value (s-Value) | E+ | AR1 | AR37 | NEA2 |
| 134.0474 (P1) | 135.0546 | 1.17 | 53.0380, 56.9632, 80.0493, 107.0589, 135.0548 | −0.220 | (60.21) | −0.09 | −1.29 | 11.40 | −1.56 |
| 151.0984 (P2) | 152.0967 | 1.74 | 65.1095, 67.0532, 68.9968, 92.0562, 95.0479 | 0.043 | (6.77) | 1.36 | −1.26 | 1.68 | 0.52 |
| 218.0929 (P3) | 219.0988 | 7.15 | 91.0534, 117.0314, 121.0629, 145.0618, 187.0733 | 0.118 | (6.77) | 3.87 | 1.63 | 5.24 | 5.24 |
| 220.1085 (P4) | 221.1179 | 7.02 | 95.0503, 162.8361, 177.1276 | 0.128 | (9.27) | 6.19 | 1.58 | 5.43 | 7.18 |
| 222.1232 (P5) | 223.1362 | 7.01 | 61.9898, 178.1371, 208.9768, 223.1332, 707.5326 | 0.185 | (15.98) | 2.04 | −1.97 | −3.01 | −1.34 |
| 222.1232 (P6) | 223.12959 | 6.97 | 79.0533, 91.0534, 93.0692, 149.0943, 150.1018 | 0.337 | (30.53) | 1.81 | −7.66 | −5.33 | −2.40 |
| 224.1392 (P7) | 225.1462 | 7.40 | 79.0528, 91.0534, 105.0685, 119.0836, 133.0993 | 0.361 | (18.73) | 2.06 | −5.25 | −5.38 | −1.74 |
| 241.1657 (P8) | 242.1716 | 7.47 | 79.0523, 99.0434, 133.1000, 147.1141, 207.1337 | 0.181 | (23.86) | 1.36 | −2.49 | −3.94 | −2.07 |
| 256.1311 (P9) | 257.1365 | 5.70 | 105.0683, 119.0838, 123.0781, 165.0887, 175.1106 | 0.146 | (21.68) | 2.31 | −0.93 | −4.97 | −4.87 |
| 258.1919 (P10) | 259.2001 | 4.21 | 55.0537, 59.0120, 83.0843, 100.1112, 115.0749 | −0.039 | (8.99) | −1.37 | 0.93 | 1.16 | 1.49 |
| 271.1669 (P11) | 272.1741 | 4.16 | 97.0751, 125.1066, 131.0482, 168.1123 | −0.379 | (35.86) | 5.95 | 6.85 | 5.53 | −2.84 |
| 275.1267 (P12) | 276.1330 | 9.27 | 43.52241, 57.0700212, 61.836, 75.67711, 81.5744, 149.02072, 159.1144, 160.5581, 171.1357, 177.1268 | 0.149 | (42.07) | 1.77 | −2.92 | −2.74 | −1.94 |
| 277.124 (P13) | 9.26 | 0.263 | (25.60) | 1.79 | −5.37 | −4.79 | −2.31 | ||
| 287.1607 (P14) | 288.1695 | 3.34 | 58.06496, 125.1066, 147.04361, 168.1123, 241.5898, 288.1684 | −0.376 | (42.92) | 7.60 | 8.06 | 6.93 | −0.91 |
| 292.1076 (P15) | 293.1167 | 4.01 | 219.1086, 234.1209, 245.1129, 293.1163 | −0.424 | (50.94) | 7.40 | 7.84 | 5.62 | −4.28 |
| 332.1135 (P16) | 333.1155 | 5.24 | 289.0938, 317.0889, 333.1201 | 0.052 | (4.37) | 0.34 | −1.38 | 0.46 | −0.35 |
| 353.2758 (P17) | 354.2816 | 10.72 | 45.0329, 57.0692, 59.0483, 87.0431, 103.0738 | 0.013 | (11.26) | −2.28 | 0.17 | −0.81 | 0.15 |
| 358.2297 (P18) | 359.2363 | 10.83 | 99.0435, 129.0881, 359.2350 | 0.019 | (9.12) | −2.40 | 0.24 | −0.85 | 0.21 |
| 371.1752 (P19) | 372.1870 | 4.49 | 45.0339, 59.0498, 89.0607, 103.0395, 147.0663 | 0.088 | (24.65) | 4.07 | 1.45 | 8.36 | 8.28 |
| 381.3048 (P20) | 10.82 | 0.004 | (18.73) | −5.46 | 0.17 | −0.67 | 0.35 | ||
| 387.2441 (P21) | 388.2516 | 4.54 | 45.0334, 57.0699, 89.0595, 133.0855, 149.0223 | 0.029 | (10.73) | 0.48 | 0.37 | 1.48 | 1.74 |
| 424.3398 (P22) | 5.36 | −0.075 | (5.36) | 0.41 | 3.27 | 2.52 | 3.35 | ||
| 433.205 (P23) | 434.2121 | 5.06 | 124.1104, 288.1565, 434.2117 | 0.089 | (9.22) | −3.53 | −2.39 | 0.92 | 2.23 |
| 434.3239 (P24) | 435.3262 | 5.47 | 57.0680, 109.1018, 118.0844, 151.0729, 176.1059, 207.0601, 211.1391, 298.0424, 421.1824 | −0.069 | (4.37) | −0.33 | 2.36 | 1.74 | 2.55 |
| Positive Ion with E− | Positive Ion without E− | |||||
|---|---|---|---|---|---|---|
| Metabolite | PC-1 | PC-2 | PC-3 | PC-1 | PC-2 | PC-3 |
| P1 | −0.23 | 0.02 | 0.47 | −0.15 | 0.09 | 0.58 |
| P2 | 0.23 | 0.26 | 0.62 | 0.23 | 0.38 | 0.57 |
| P3 | 0.12 | 0.48 | 0.45 | 0.17 | 0.63 | 0.24 |
| P4 | 0.14 | 0.39 | 0.45 | 0.20 | 0.60 | 0.14 |
| P5 | 0.85 | 0.04 | −0.05 | 0.83 | 0.10 | −0.24 |
| P6 | 0.79 | 0.12 | −0.05 | 0.75 | 0.26 | −0.10 |
| P7 | 0.85 | 0.14 | −0.09 | 0.78 | 0.25 | −0.27 |
| P8 | 0.86 | 0.01 | −0.21 | 0.83 | 0.11 | −0.33 |
| P9 | 0.68 | −0.24 | −0.16 | 0.65 | −0.25 | −0.21 |
| P10 | −0.55 | 0.03 | 0.00 | −0.58 | −0.01 | −0.08 |
| P11 | −0.04 | −0.77 | 0.24 | 0.21 | −0.76 | 0.26 |
| P12 | 0.95 | −0.02 | −0.04 | 0.93 | 0.10 | −0.11 |
| P13 | 0.81 | 0.01 | −0.06 | 0.77 | 0.14 | −0.14 |
| P14 | −0.10 | −0.72 | 0.35 | 0.20 | −0.72 | 0.34 |
| P15 | −0.02 | −0.81 | 0.21 | 0.23 | −0.79 | 0.26 |
| P16 | 0.38 | 0.33 | 0.36 | 0.34 | 0.40 | 0.43 |
| P17 | −0.26 | 0.43 | −0.62 | −0.42 | 0.29 | −0.60 |
| P18 | −0.25 | 0.44 | −0.63 | −0.37 | 0.29 | −0.63 |
| P19 | −0.07 | 0.53 | 0.58 | −0.04 | 0.65 | 0.40 |
| P20 | −0.37 | 0.42 | −0.56 | −0.51 | 0.25 | −0.51 |
| P21 | −0.06 | 0.61 | 0.56 | −0.09 | 0.70 | 0.38 |
| P22 | −0.48 | 0.00 | 0.16 | −0.52 | −0.02 | 0.06 |
| P23 | −0.17 | 0.49 | 0.13 | −0.32 | 0.48 | 0.10 |
| P24 | −0.45 | −0.09 | 0.14 | −0.49 | −0.05 | 0.03 |
| Treatment | E− | E+ | AR1 | AR37 | NEA2 |
|---|---|---|---|---|---|
| E− | 102 | 41 | 27 | 35 | 34 |
| E+ | 61 | 102 | 78 | 73 | 76 |
| AR1 | 75 | 24 | 102 | 8 | 20 |
| AR37 | 67 | 29 | 94 | 102 | 5 |
| NEA2 | 68 | 26 | 82 | 97 | 102 |
| Negative Ionization Mode | Fold-Change (Log2) | ||||||||
|---|---|---|---|---|---|---|---|---|---|
| Mass (Code) | m/z | RT | Fragments | P(1) | p-Value (s-Value) | E+ | AR1 | AR37 | NEA2 |
| 183.0886 (N1) | 182.0839 | 5.06 | 22.38964, 24.00521, 28.29697, 28.74668, 44.33648, 61.9898, 112.03114, 128.2595 | 0.019 | (5.22) | 1.60 | 0.64 | 0.84 | 1.23 |
| 222.0293 (N2) | 221.0305 | 5.75 | 79.9590, 157.0675, 221.0303 | 0.030 | (12.37) | 1.99 | −1.23 | 3.33 | 3.31 |
| 222.1244 (N3) | 221.1179 | 7.02 | 27.59896, 29.39881, 35.02124, 38.24089, 41.62328, 95.05037, 162.8361, 177.1276 | 0.158 | (21.68) | 1.32 | −3.01 | −4.16 | −2.31 |
| 224.1391 (N4) | 223.1362 | 7.01 | 20.83417, 21.21704, 26.55221, 31.06935, 42.66667, 61.98988, 178.1371, 208.9769, 223.13328 | 0.105 | (48.73) | 1.24 | −2.53 | −2.38 | −2.50 |
| 226.1654 (N5) | 225.1462 | 7.40 | 79.0528, 91.05348, 105.068589, 119.0837, 133.09936 | −0.100 | (6.11) | 0.50 | 2.44 | 2.23 | 2.94 |
| 236.1024 (N6) | 235.0976 | 7.15 | 62.00181, 78.683, 80.7794, 84.2328, 105.03409, 158.0746, 157.5531, 177.0557, 235.0948 | 0.046 | (9.49) | 2.73 | −0.75 | 3.54 | 3.32 |
| 240.134 (N7) | 6.19 | 0.052 | (9.41) | 2.74 | −2.50 | 2.46 | 2.21 | ||
| 240.1347 (N8) | 239.1303 | 6.24 | 45.88506, 51.70296, 57.0356, 62.9934, 66.41873, 85.09677, 86.6111, 107.05075, 123.08235, 239.1305 | 0.233 | (9.41) | 2.74 | −2.50 | 2.46 | 2.21 |
| 252.0967 (N9) | 251.0942 | 5.86 | 57.03481, 75.0168, 80.31151, 82.07862, 105.03536, 157.8586, 173.8734, 190.06535, 221.08245 | −0.005 | (6.38) | 2.13 | 0.11 | 3.34 | 3.19 |
| 256.0851 (N10) | 255.0256 | 7.05 | 38.37795, 41.39448, 47.78295, 61.02047, 77.82369, 79.9573, 83.2637, 129.09133, 143.05869 | 0.077 | (45.17) | 1.45 | 0.44 | −2.33 | −2.37 |
| 256.1289 (N11) | 255.1250 | 5.75 | 125.0986, 255.1237 | 0.224 | (26.60) | 1.39 | −4.23 | −7.36 | −2.70 |
| 258.0985 (N12) | 257.0962 | 8.49 | 19.59993, 21.10193, 22.20991, 52.4277, 28.36111, 35.59788, 145.31803, 178.1321, 221.1178 | 0.118 | (26.60) | 2.46 | −6.03 | −6.49 | −5.03 |
| 258.0998 (N13) | 9.25 | 0.118 | (48.73) | 1.46 | −2.50 | −2.76 | −2.24 | ||
| 260.0974 (N14) | 9.25 | 0.120 | (47.70) | 1.48 | −2.55 | −2.84 | −2.22 | ||
| 262.1423 (N15) | 261.1404 | 3.64 | 18.2351, 19.01389, 24.10197, 27.78419, 32.2279, 197.9015 | −0.064 | (8.10) | −0.76 | 0.81 | 1.03 | 1.23 |
| 270.1086 (N16) | 269.1059 | 5.25 | 46.27977, 55.020019, 65.97169, 98.9411, 105.3432, 135.08309, 163.1151, 181.1243, 208.1078, 228.3399 | 0.228 | (30.21) | 1.45 | −3.63 | −7.85 | −4.29 |
| 272.1238 (N17) | 271.1209 | 5.10 | 61.86755, 75.93481, 120.3023, 165.1305, 180.5423, 207.1042, 209.1204, 290.1051, 227.1302, 271.1204 | 0.175 | (20.02) | 1.79 | −4.32 | −3.81 | −3.20 |
| 272.1691 (N18) | 271.1663 | 3.61 | 29.33423, 31.84118, 36.40309, 44.9984, 53.87695, 83.04982, 186.2128 | −0.065 | (9.03) | −0.85 | 0.98 | 0.91 | 1.01 |
| 274.0957 (N19) | 273.0923 | 7.52 | 79.9571, 120.9018, 239.0403 | 0.185 | (22.71) | 2.50 | −4.28 | −3.74 | −1.61 |
| 278.1108 (N20) | 5.72 | 0.193 | (24.01) | 2.24 | −2.78 | −5.46 | −2.42 | ||
| 282.1448 (N21) | 281.1423 | 6.33 | 28.68056, 37.10545, 44.9993, 47.4394, 49.23808, 71.07635, 125.9432, 237.1522, 238.1544, 281.1406 | 0.175 | (23.09) | 1.82 | −3.75 | −5.46 | −3.17 |
| 290.1111 (N22) | 7.00 | 0.194 | (26.44) | 1.16 | −4.75 | −5.71 | −3.03 | ||
| 292.1089 (N23) | 291.1030 | 4.00 | 55.02972, 74.5326, 110.9243, 171.9102, 231.09958, 257.1145, 291.1018 | 0.004 | (47.10) | 7.23 | 7.98 | 5.57 | −1.22 |
| 294.1081 (N24) | 293.1051 | 6.77 | 106.0435, 135.1298, 165.0555, 172.09136, 196.4521, 201.8361, 221.0823, 231.1034, 242.0645 | 0.075 | (15.19) | 1.41 | −1.97 | −0.64 | 0.40 |
| 296.0738 (N25) | 9.25 | 0.177 | (22.88) | 2.14 | −3.69 | −3.43 | −3.20 | ||
| 302.1238 (N26) | 301.1220 | 4.97 | 45.8685, 57.44, 57.51875, 117.0584, 160.0413, 161.0501, 283.1125 | 0.077 | (4.80) | 0.20 | −1.30 | 1.17 | 1.74 |
| 316.0583 (N27) | 9.25 | 0.179 | (31.21) | 1.46 | −5.54 | −4.04 | −2.60 | ||
| 316.106 (N28) | 315.1013 | 7.09 | 32.54166, 61.9881, 66.41003, 67.7094, 90.87622, 146.9665, 158.7408 | 0.174 | (30.21) | 1.29 | −5.70 | −4.67 | −2.81 |
| 316.106 (N29) | 8.19 | 0.189 | (24.38) | 2.57 | −4.84 | −3.57 | −1.93 | ||
| 318.1037 (N30) | 317.1014 | 7.12 | 61.9893, 121.0290, 278.2160, 299.5229 | 0.189 | (23.72) | 1.41 | −5.30 | −4.10 | −3.45 |
| 326.0872 (N31) | 9.26 | 0.092 | (47.84) | 1.25 | −1.09 | −2.65 | −2.44 | ||
| 328.0832 (N32) | 8.54 | 0.190 | (34.08) | 1.33 | −5.75 | −5.87 | −4.26 | ||
| 338.1705 (N33) | 337.1666 | 7.89 | 59.19598, 62.61855, 89.14405, 106.0433, 150.03368, 165.05589, 231.7807, 317.8932, 337.16603 | 0.022 | (8.82) | 2.69 | 0.63 | 2.57 | 4.07 |
| 343.0776 (N34) | 9.25 | 0.177 | (28.39) | 1.82 | −4.62 | −3.68 | −2.55 | ||
| 347.1702 (N35) | 346.1657 | 8.55 | 37.0372, 42.8426, 58.7676, 61.9881, 67.0801, 73.8238, 133.5098 | 0.013 | (14.24) | 2.94 | 0.15 | 4.08 | 7.17 |
| 352.1333 (N36) | 351.1321 | 3.59 | 57.0366, 59.01548, 83.1737, 91.31488, 98.45027, 99.0455, 101.0255, 104.3767, 194.56109, 337.0621 | −0.044 | (5.19) | 1.16 | 0.16 | 3.66 | 4.95 |
| 362.1447 (N37) | 361.1418 | 4.21 | 29.44697, 35.12963, 37.57853, 46.3367, 60.61403, 90.72506, 160.7155, 174.05642, 269.1017 | 0.008 | (15.59) | −0.34 | 1.72 | 0.50 | −2.33 |
| 418.9382 (N38) | 417.9399 | 9.26 | 160.8439, 162.8406, 417.9403 | 0.164 | (26.60) | 1.30 | −3.70 | −4.30 | −2.76 |
| 420.9378 (N39) | 419.9326 | 8.57 | 34.55704, 37.63, 40.03553, 43.15385, 59.46324, 189.9559, 333.1031, 346.0412 | 0.152 | (27.71) | 1.70 | −3.49 | −3.88 | −2.22 |
| 422.9337 (N40) | 9.25 | 0.170 | (26.95) | 2.31 | −4.30 | −3.04 | −3.88 | ||
| 452.3299 (N41) | 5.36 | −0.075 | (6.50) | ||||||
| 479.212 (N42) | 478.2061 | 5.10 | 25.98425, 27.50015, 42.875, 44.99806, 80.4495, 115.0385, 286.1415, 315.4149, 401.1564 | −0.067 | (9.57) | −4.26 | −3.06 | −0.07 | 2.51 |
| 518.1987 (N43) | 9.26 | 0.240 | (47.01) | 6.50 | −3.40 | −3.60 | −5.34 | ||
| 550.3019 (N44) | 549.2983 | 5.39 | 78.9593, 96.9619, 98.9566, 549.3004 | −0.064 | (7.91) | −0.38 | 1.18 | 1.34 | 1.41 |
| 556.2976 (N45) | 5.36 | −0.071 | (7.06) | 0.17 | 1.68 | 1.83 | 1.90 | ||
| 558.2961 (N46) | 5.36 | −0.087 | (4.80) | 0.38 | 2.14 | 1.86 | 2.51 | ||
| 573.2877 (N47) | 5.36 | −0.074 | (5.88) | −0.90 | 1.32 | 1.44 | 1.11 | ||
| 575.2794 (N48) | 5.36 | −0.142 | (7.21) | −1.98 | 1.93 | 2.00 | 2.51 | ||
| 583.3164 (N49) | 5.36 | −0.059 | (9.95) | −0.67 | 1.01 | 0.90 | 1.05 | ||
| 600.3065 (N50) | 5.36 | −0.070 | (5.99) | −0.82 | 0.93 | 1.33 | 1.49 | ||
| 651.3033 (N51) | 5.36 | −0.132 | (7.14) | −0.18 | 3.19 | 2.48 | 3.59 | ||
| 685.2842 (N52) | 5.36 | −0.105 | (12.72) | 0.69 | 3.58 | 3.39 | 3.51 | ||
| 688.2764 (N53) | 687.2796 | 5.27 | 205.8351, 239.5135, 281.09199, 466.2721, 581.21507, 653.9155, 687.2787 | −0.005 | (14.69) | −5.95 | −2.52 | −0.91 | −4.44 |
| 768.1591 (N54) | 767.1577 | 3.92 | 82.3149, 553.1354, 603.8227, 767.1552 | −0.087 | (22.27) | 2.69 | 0.25 | 6.54 | 7.71 |
| 774.4346 (N55) | 6.00 | −0.045 | (7.79) | 0.55 | 1.77 | 1.50 | 1.60 | ||
| 854.4604 (N56) | 5.99 | −0.074 | (8.82) | −1.76 | 1.29 | 1.05 | 0.89 | ||
| 858.483 (N57) | 5.99 | −0.043 | (7.80) | −1.46 | 0.50 | 0.16 | −0.04 | ||
| 900.5351 (N58) | 5.99 | −0.039 | (7.80) | 0.75 | 0.79 | 2.12 | 2.28 | ||
| 999.2011 (N59) | 998.2025 | 3.90 | 28.9734, 33.5092, 96.9584, 298.4722, 815.2975, 998.2023 | −0.099 | (17.86) | 0.97 | −1.07 | 7.10 | 6.11 |
| 1403.0048 (N60) | 1402.0042 | 5.99 | 677.4985, 723.5008, 815.1445 | −0.137 | (4.89) | −0.99 | 1.36 | 2.50 | 3.08 |
| Negative Ion with E− | Negative Ion without E− | |||||
|---|---|---|---|---|---|---|
| Metabolite | PC-1 | PC-2 | PC-3 | PC-1 | PC-2 | PC-3 |
| N1 | 0.33 | 0.60 | −0.14 | 0.46 | 0.47 | −0.18 |
| N2 | 0.21 | 0.78 | 0.30 | 0.28 | 0.81 | 0.15 |
| N3 | 0.81 | 0.00 | 0.24 | 0.79 | 0.04 | 0.22 |
| N4 | 0.90 | −0.22 | 0.13 | 0.88 | −0.23 | 0.17 |
| N5 | −0.69 | −0.26 | 0.45 | −0.69 | −0.17 | 0.49 |
| N6 | 0.27 | 0.76 | 0.25 | 0.35 | 0.74 | 0.05 |
| N7 | 0.19 | 0.41 | 0.48 | 0.31 | 0.46 | 0.30 |
| N8 | 0.69 | −0.20 | 0.29 | 0.68 | −0.13 | 0.34 |
| N9 | 0.01 | 0.62 | 0.34 | 0.17 | 0.68 | 0.11 |
| N10 | 0.69 | −0.31 | −0.23 | 0.68 | −0.44 | −0.21 |
| N11 | 0.77 | −0.17 | 0.26 | 0.74 | −0.12 | 0.30 |
| N12 | 0.70 | −0.21 | 0.17 | 0.68 | −0.15 | 0.23 |
| N13 | 0.96 | −0.13 | 0.15 | 0.96 | −0.14 | 0.18 |
| N14 | 0.95 | −0.15 | 0.17 | 0.94 | −0.17 | 0.20 |
| N15 | −0.76 | −0.26 | 0.45 | −0.77 | −0.09 | 0.52 |
| N16 | 0.77 | −0.26 | 0.18 | 0.75 | −0.24 | 0.21 |
| N17 | 0.70 | −0.09 | 0.30 | 0.70 | 0.03 | 0.32 |
| N18 | −0.80 | −0.29 | 0.41 | −0.83 | −0.13 | 0.47 |
| N19 | 0.74 | −0.15 | 0.36 | 0.72 | −0.11 | 0.42 |
| N20 | 0.77 | −0.23 | 0.18 | 0.76 | −0.25 | 0.23 |
| N21 | 0.67 | −0.14 | 0.19 | 0.62 | −0.14 | 0.23 |
| N22 | 0.77 | −0.16 | 0.23 | 0.75 | −0.11 | 0.25 |
| N23 | 0.03 | −0.16 | −0.29 | 0.23 | −0.41 | −0.39 |
| N24 | 0.67 | 0.49 | 0.25 | 0.68 | 0.52 | 0.11 |
| N25 | 0.79 | −0.06 | 0.22 | 0.78 | −0.06 | 0.20 |
| N26 | 0.13 | 0.64 | 0.24 | 0.21 | 0.71 | 0.16 |
| N27 | 0.79 | −0.06 | 0.37 | 0.77 | 0.05 | 0.41 |
| N28 | 0.71 | −0.23 | 0.34 | 0.67 | −0.15 | 0.44 |
| N29 | 0.73 | −0.15 | 0.36 | 0.75 | −0.04 | 0.41 |
| N30 | 0.78 | −0.01 | 0.23 | 0.77 | 0.06 | 0.23 |
| N31 | 0.85 | −0.29 | −0.07 | 0.82 | −0.36 | −0.03 |
| N32 | 0.72 | −0.27 | 0.27 | 0.68 | −0.20 | 0.37 |
| N33 | 0.18 | 0.72 | 0.22 | 0.32 | 0.76 | 0.05 |
| N34 | 0.85 | 0.00 | 0.28 | 0.83 | 0.04 | 0.29 |
| N35 | 0.10 | 0.64 | 0.22 | 0.20 | 0.64 | 0.11 |
| N36 | −0.08 | 0.65 | 0.18 | −0.02 | 0.64 | 0.01 |
| N37 | 0.13 | −0.02 | −0.54 | 0.10 | −0.23 | −0.48 |
| N38 | 0.83 | −0.04 | 0.24 | 0.82 | 0.01 | 0.25 |
| N39 | 0.78 | −0.13 | 0.32 | 0.74 | −0.09 | 0.37 |
| N40 | 0.72 | −0.20 | 0.28 | 0.68 | −0.15 | 0.35 |
| N41 | −0.67 | −0.27 | 0.36 | −0.70 | −0.16 | 0.37 |
| N42 | −0.14 | 0.45 | −0.05 | −0.24 | 0.48 | −0.05 |
| N43 | 0.72 | −0.17 | 0.23 | 0.79 | −0.17 | 0.17 |
| N44 | −0.73 | −0.19 | 0.43 | −0.83 | −0.08 | 0.47 |
| N45 | −0.71 | −0.16 | 0.55 | −0.82 | −0.09 | 0.52 |
| N46 | −0.62 | −0.18 | 0.43 | −0.62 | −0.04 | 0.52 |
| N47 | −0.63 | −0.24 | 0.33 | −0.63 | −0.15 | 0.31 |
| N48 | −0.67 | −0.17 | 0.32 | −0.69 | −0.03 | 0.32 |
| N49 | −0.82 | −0.31 | 0.38 | −0.83 | −0.15 | 0.47 |
| N50 | −0.64 | −0.17 | 0.51 | −0.64 | −0.02 | 0.54 |
| N51 | −0.67 | −0.28 | 0.33 | −0.67 | −0.16 | 0.47 |
| N52 | −0.68 | −0.13 | 0.41 | −0.74 | −0.07 | 0.38 |
| N53 | 0.02 | −0.08 | −0.32 | −0.14 | −0.08 | −0.29 |
| N54 | −0.24 | 0.70 | 0.31 | −0.16 | 0.74 | 0.14 |
| N55 | −0.55 | 0.00 | 0.41 | −0.69 | 0.01 | 0.14 |
| N56 | −0.56 | −0.17 | 0.11 | −0.62 | −0.15 | 0.19 |
| N57 | −0.50 | −0.15 | 0.05 | −0.56 | −0.04 | 0.14 |
| N58 | −0.38 | 0.30 | 0.61 | −0.25 | 0.53 | 0.47 |
| N59 | −0.24 | 0.66 | 0.23 | −0.15 | 0.76 | 0.06 |
| N60 | −0.66 | −0.26 | 0.46 | −0.65 | −0.15 | 0.52 |
References
- Schardl, C.L. The epichloae, symbionts of the grass subfamily poöideae1. Ann. Mo. Bot. Gard. 2010, 97, 646–665. [Google Scholar] [CrossRef]
- Leuchtmann, A.; Bacon, C.W.; Schardl, C.L.; White, J.F., Jr.; Tadych, M. Nomenclatural realignment of Neotyphodium species with genus Epichloë. Mycologia 2014, 106, 202–215. [Google Scholar] [CrossRef]
- Newman, J.A.; Gillis, S.; Hager, H.A. Costs, benefits, parasites and mutualists: The use and abuse of the mutualism–parasitism continuum concept for Epichloë fungi. Philos. Theory Pract. Biol. 2021. in review. [Google Scholar]
- Saikkonen, K.; Wäli, P.; Helander, M.; Faeth, S.H. Evolution of endophyte–plant symbioses. Trends Plant Sci. 2004, 9, 275–280. [Google Scholar] [CrossRef]
- Schardl, C.L.; Leuchtmann, A.; Spiering, M.J. Symbioses of grasses with seedborne fungal endophytes. Annu. Rev. Plant Biol. 2004, 55, 315–340. [Google Scholar] [CrossRef]
- Gond, S.; Verma, V.; Mishra, A.; Kumar, A.; Kharwar, R. Role of fungal endophytes in plant protection. In Management of Fungal Plant Pathogens; Arya, A., Perelló, A., Eds.; CAB International: Wallingford, UK, 2010; pp. 183–197. [Google Scholar]
- Cao, M.; Koulman, A.; Johnson, L.J.; Lane, G.A.; Rasmussen, S. Advanced data-mining strategies for the analysis of direct-infusion ion trap mass spectrometry data from the association of perennial ryegrass with its endophytic fungus, Neotyphodium lolii. Plant Physiol. 2008, 146, 1501–1514. [Google Scholar] [CrossRef] [Green Version]
- Rasmussen, S.; Parsons, A.J.; Popay, A.; Xue, H.; Newman, J.A. Plant-endophyte-herbivore interactions: More than just alkaloids? Plant Signal. Behav. 2008, 3, 974–977. [Google Scholar] [CrossRef] [PubMed] [Green Version]
- Dupont, P.Y.; Eaton, C.J.; Wargent, J.J.; Fechtner, S.; Solomon, P.; Schmid, J.; Day, R.C.; Scott, B.; Cox, M.P. Fungal endophyte infection of ryegrass reprograms host metabolism and alters development. New Phytol. 2015, 208, 1227–1240. [Google Scholar] [CrossRef]
- Rasmussen, S.; Parsons, A.J.; Bassett, S.; Christensen, M.J.; Hume, D.E.; Johnson, L.J.; Johnson, R.D.; Simpson, W.R.; Stacke, C.; Voisey, C.R.; et al. High nitrogen supply and carbohydrate content reduce fungal endophyte and alkaloid concentration in Lolium perenne. New Phytol. 2007, 173, 787–797. [Google Scholar] [CrossRef]
- Rasmussen, S.; Parsons, A.J.; Fraser, K.; Xue, H.; Newman, J.A. Metabolic profiles of Lolium perenne are differentially affected by nitrogen supply, carbohydrate content, and fungal endophyte infection. Plant Physiol. 2008, 146, 1440–1453. [Google Scholar] [CrossRef] [PubMed] [Green Version]
- Rasmussen, S.; Parsons, A.J.; Newman, J.A. Metabolomics analysis of the Lolium perenne–Neotyphodium lolii symbiosis: More than just alkaloids? Phytochem. Rev. 2009, 8, 535–550. [Google Scholar] [CrossRef] [Green Version]
- Cao, M.; Fraser, K.; Jones, C.; Stewart, A.; Lyons, T.; Faville, M.; Barrett, B. Untargeted metabotyping Lolium perenne reveals population-level variation in plant flavonoids and alkaloids. Front. Plant Sci. 2017, 8, 133. [Google Scholar] [CrossRef] [PubMed] [Green Version]
- Guo, J.; McCulley, R.L.; McNear, D.H., Jr. Tall fescue cultivar and fungal endophyte combinations influence plant growth and root exudate composition. Front. Plant Sci. 2015, 6, 183. [Google Scholar] [CrossRef] [PubMed] [Green Version]
- Guo, J.; McCulley, R.; Phillips, T.; McNear, D., Jr. Fungal endophyte and tall fescue cultivar interact to differentially affect bulk and rhizosphere soil processes governing C and N cycling. Soil Biol. Biochem. 2016, 101, 165–174. [Google Scholar] [CrossRef]
- Wakelin, S.; Harrison, S.; Mander, C.; Dignam, B.; Rasmussen, S.; Monk, S.; Fraser, K.; O’Callaghan, M. Impacts of endophyte infection of ryegrass on rhizosphere metabolome and microbial community. Crop Pasture Sci. 2015, 66, 1049–1057. [Google Scholar] [CrossRef]
- Koulman, A.; Lee, T.V.; Fraser, K.; Johnson, L.; Arcus, V.; Lott, J.S.; Rasmussen, S.; Lane, G. Identification of extracellular siderophores and a related peptide from the endophytic fungus Epichloë festucae in culture and endophyte-infected Lolium perenne. Phytochemistry 2012, 75, 128–139. [Google Scholar] [CrossRef] [Green Version]
- Cheplick, G.; Cho, R. Interactive effects of fungal endophyte infection and host genotype on growth and storage in Lolium perenne. New Phytol. 2003, 158, 183–191. [Google Scholar] [CrossRef]
- Hunt, M.G.; Rasmussen, S.; Newton, P.C.; Parsons, A.J.; Newman, J.A. Near-term impacts of elevated CO2, nitrogen and fungal endophyte-infection on Lolium perenne L. growth, chemical composition and alkaloid production. Plant Cell Environ. 2005, 28, 1345–1354. [Google Scholar] [CrossRef]
- Ren, A.Z.; Gao, Y.B.; Wang, W.; Wang, J.L.; Zhao, N.X. Influence of nitrogen fertilizer and endophyte infection on ecophysiological parameters and mineral element content of perennial ryegrass. J. Integr. Plant Biol. 2009, 51, 75–83. [Google Scholar] [CrossRef]
- Rasmussen, S.; Parsons, A.J.; Jones, C.S. Metabolomics of forage plants: A review. Ann. Bot. 2012, 110, 1281–1290. [Google Scholar] [CrossRef] [PubMed] [Green Version]
- Abeynayake, S.W.; Etzerodt, T.P.; Jonavičienė, K.; Byrne, S.; Asp, T.; Boelt, B. Fructan metabolism and changes in fructan composition during cold acclimation in perennial ryegrass. Front. Plant Sci. 2015, 6, 329. [Google Scholar] [CrossRef] [Green Version]
- Hildebrandt, T.M.; Nesi, A.N.; Araújo, W.L.; Braun, H.P. Amino acid catabolism in plants. Mol. Plant 2015, 8, 1563–1579. [Google Scholar] [CrossRef] [Green Version]
- Cheplick, G.; Clay, K.; Marks, S. Interactions between infection by endophytic fungi and nutrient limitation in the grasses Lolium perenne and Festuca arundinacea. New Phytol. 1989, 111, 89–97. [Google Scholar] [CrossRef]
- Ball, O.; Prestidge, R.; Sprosen, J. Interrelationships between Acremonium lolii, peramine, and lolitrem B in perennial ryegrass. Appl. Environ. Microbiol. 1995, 61, 1527–1533. [Google Scholar] [CrossRef] [PubMed] [Green Version]
- Easton, H.; Latch, G.; Tapper, B.; Ball, O.P. Ryegrass host genetic control of concentrations of endophyte-derived alkaloids. Crop Sci. 2002, 42, 51–57. [Google Scholar] [PubMed]
- Spiering, M.J.; Lane, G.A.; Christensen, M.J.; Schmid, J. Distribution of the fungal endophyte Neotyphodium lolii is not a major determinant of the distribution of fungal alkaloids in Lolium perenne plants. Phytochemistry 2005, 66, 195–202. [Google Scholar] [CrossRef] [PubMed]
- Reed, K.; Nie, Z.; Walker, L.; Mace, W.; Clark, S. Weather and pasture characteristics associated with outbreaks of perennial ryegrass toxicosis in southern Australia. Anim. Prod. Sci. 2011, 51, 738–752. [Google Scholar] [CrossRef]
- Gaynor, D.; Hunt, W. The relationship between nitrogen supply, endophytic fungus, and Argentine stem weevil resistance in ryegrasses. Proc. N. Z. Grassl. Assoc. 1982, 44, 257–263. [Google Scholar] [CrossRef]
- Fletcher, L.; Harvey, I. An association of a Lolium endophyte with ryegrass staggers. N. Z. Vet. J. 1981, 29, 185–186. [Google Scholar] [CrossRef]
- Rowan, D.; Shaw, G.J. Detection of ergopeptine alkaloids in endophyte-infected perennial ryegrass by tandem mass spectrometry. N. Z. Vet. J. 1987, 35, 197–198. [Google Scholar] [CrossRef]
- Christensen, M.; Latch, G.; Tapper, A. Variation within isolates of Acremonium endophytes from perennial rye-grasses. Mycol. Res. 1991, 95, 918–923. [Google Scholar] [CrossRef]
- Tapper, B.; Lane, G. Janthitrems found in a Neotyphodium endophyte of perennial ryegrass. In Proceedings of the 5th International Symposium on Neotyphodium/Grass Interactions; Roberts, C., West, C.P., Eds.; University of Arkansas Press: Fayetteville, NC, USA, 2004; Volume 301. [Google Scholar]
- Saikkonen, K.; Saari, S.; Helander, M. Defensive mutualism between plants and endophytic fungi? Fungal Divers. 2010, 41, 101–113. [Google Scholar] [CrossRef]
- Prestidge, R.; Barker, G. An association of Lolium endophyte with ryegrass resistance to Argentine stem weevil. In Proceedings of the New Zealand Weed and Pest Control Conference, Hamilton, New Zealand, 9–12 August 1982; Volume 35, pp. 119–122. [Google Scholar]
- Qawasmeh, A.; Raman, A.; Wheatley, W.; Nicol, H. Antioxidative capacity of phenolic compounds extracted from Lolium perenne and Lolium arundinaceum infected with Neotyphodium (Hypocreales: Clavicipitaceae). Acta Physiol. Plant. 2012, 34, 827–833. [Google Scholar] [CrossRef]
- Qawasmeh, A.; Obied, H.K.; Raman, A.; Wheatley, W. Influence of fungal endophyte infection on phenolic content and antioxidant activity in grasses: Interaction between Lolium perenne and different strains of Neotyphodium lolii. J. Agric. Food Chem. 2012, 60, 3381–3388. [Google Scholar] [CrossRef] [PubMed]
- Pańka, D.; Piesik, D.; Jeske, M.; Troczyński, M.; Bocianowski, J. Effect of endophyte Neotyphodium lolii on defense reaction of perennial ryegrass (Lolium perenne L.) infected by Rhizoctonia solani. In Proceedings of the XIII th Congress of the European Society for Agronomy, Debrecen, Hungary, 25–29 August 2014; p. 459. [Google Scholar]
- Wiewióra, B.; Żurek, G.; Żurek, M. Endophyte-mediated disease resistance in wild populations of perennial ryegrass (Lolium perenne). Fungal Ecol. 2015, 15, 1–8. [Google Scholar] [CrossRef]
- Bastías, D.A.; Martínez-Ghersa, M.A.; Newman, J.A.; Card, S.D.; Mace, W.J.; Gundel, P.E. Jasmonic acid regulation of the anti-herbivory mechanism conferred by fungal endophytes in grasses. J. Ecol. 2018, 106, 2365–2379. [Google Scholar] [CrossRef]
- Bastías, D.A.; Alejandra Martínez-Ghersa, M.; Newman, J.A.; Card, S.D.; Mace, W.J.; Gundel, P.E. The plant hormone salicylic acid interacts with the mechanism of anti-herbivory conferred by fungal endophytes in grasses. Plant Cell Environ. 2018, 41, 395–405. [Google Scholar] [CrossRef] [PubMed]
- Van Hecke, M.M.; Treonis, A.M.; Kaufman, J.R. How does the fungal endophyte Neotyphodium coenophialum affect tall fescue (Festuca arundinacea) rhizodeposition and soil microorganisms? Plant Soil 2005, 275, 101–109. [Google Scholar] [CrossRef]
- Rasmussen, S.; Liu, Q.; Parsons, A.J.; Xue, H.; Sinclair, B.; Newman, J.A. Grass–endophyte interactions: A note on the role of monosaccharide transport in the Neotyphodium lolii–Lolium perenne symbiosis. New Phytol. 2012, 196, 7–12. [Google Scholar] [CrossRef] [Green Version]
- Ryan, G.; Rasmussen, S.; Parsons, A.; Newman, J. The effects of carbohydrate supply and host genetic background on Epichloë endophyte and alkaloid concentrations in perennial ryegrass. Fungal Ecol. 2015, 18, 115–125. [Google Scholar] [CrossRef]
- Ryan, G.D.; Shukla, K.; Rasmussen, S.; Shelp, B.J.; Newman, J.A. Phloem phytochemistry and aphid responses to elevated CO2, nitrogen fertilization and endophyte infection. Agric. For. Entomol. 2014, 16, 273–283. [Google Scholar] [CrossRef]
- Wasserstein, R.L.; Schirm, A.L.; Lazar, N.A. Moving to a world beyond “p < 0.05”. Am. Stat. 2019, 73, 1–19. [Google Scholar]
- Greenland, S. Valid p-values behave exactly as they should: Some misleading criticisms of p-values and their resolution with s-values. Am. Stat. 2019, 73, 106–114. [Google Scholar] [CrossRef] [Green Version]
- Newman, J.A.; Bergelson, J.; Grafen, A. Blocking factors and hypothesis tests in ecology: Is your statistics text wrong? Ecology 1997, 78, 1312–1320. [Google Scholar] [CrossRef]
- Tukey, J. Multiple comparisons. J. Am. Stat. Assoc. 1953, 48, 624–625. [Google Scholar]
- Box, G.E.; Cox, D.R. An analysis of transformations. J. R. Stat. Soc. Ser. B Methodol. 1964, 26, 211–243. [Google Scholar] [CrossRef]
- Benjamini, Y.; Hochberg, Y. Controlling the false discovery rate: A practical and powerful approach to multiple testing. J. R. Stat. Soc. Ser. B Methodol. 1995, 57, 289–300. [Google Scholar] [CrossRef]
- Taylor, J.; King, R.D.; Altmann, T.; Fiehn, O. Application of metabolomics to plant genotype discrimination using statistics and machine learning. Bioinformatics 2002, 18, S241–S248. [Google Scholar] [CrossRef] [PubMed] [Green Version]
- Anderson, M.J. Distance-based tests for homogeneity of multivariate dispersions. Biometrics 2006, 62, 245–253. [Google Scholar] [CrossRef]
- Ward, J.H., Jr. Hierarchical grouping to optimize an objective function. J. Am. Stat. Assoc. 1963, 58, 236–244. [Google Scholar] [CrossRef]
- Geddes-McAlister, J.; Sukumaran, A.; Patchett, A.; Hager, H.A.; Dale, J.; Roloson, J.L.; Prudhomme, N.; Bolton, K.; Muselius, B.; Powers, J.; et al. Examining the impacts of CO2 concentration and genetic compatibility on perennial ryegrass–Epichloë festucae var. lolii interactions. J. Fungi 2020, 6, 360. [Google Scholar] [CrossRef]
- Tian, P.; Le, T.N.; Ludlow, E.; Smith, K.; Forster, J.; Guthridge, K.; Spangenberg, G. Characterisation of novel perennial ryegrass host–Neotyphodium endophyte associations. Crop Pasture Sci. 2013, 64, 716–725. [Google Scholar] [CrossRef]
- Faville, M.J.; Briggs, L.; Cao, M.; Koulman, A.; Jahufer, M.Z.; Koolaard, J.; Hume, D.E. A QTL analysis of host plant effects on fungal endophyte biomass and alkaloid expression in perennial ryegrass. Mol. Breed. 2015, 35, 161. [Google Scholar] [CrossRef] [PubMed] [Green Version]
- Popay, A.; Hume, D.; Baltus, J.; Latch, G.; Tapper, B.; Lyons, T.; Cooper, B.; Pennell, C.; Eerens, J.; Marshall, S. Field performance of perennial ryegrass (Lolium perenne) infected with toxin-free fungal endophytes (Neotyphodium spp.). Grassl. Res. Pract. Ser. 1999, 7, 113–122. [Google Scholar]
- Popay, A.; Hume, D. Endophytes improve ryegrass persistence by controlling insects. Pasture Persistence Grassland Res. Pract. Ser. 2011, 15, 149–156. [Google Scholar]
- Moate, P.; Williams, S.; Grainger, C.; Hannah, M.; Mapleson, D.; Auldist, M.; Greenwood, J.; Popay, A.; Hume, D.; Mace, W.; et al. Effects of wild-type, AR1 and AR37 endophyte-infected perennial ryegrass on dairy production in Victoria, Australia. Anim. Prod. Sci. 2012, 52, 1117–1130. [Google Scholar] [CrossRef]
- Hume, D.; Ryan, D.; Cooper, B.; Popay, A. Agronomic performance of AR37-infected ryegrass in northern New Zealand. N. Z. Grassl. Assoc. 2007, 69, 201. [Google Scholar] [CrossRef]
- Thom, E.R.; Popay, A.J.; Hume, D.E.; Fletcher, L.R. Evaluating the performance of endophytes in farm systems to improve farmer outcomes—A review. Crop Pasture Sci. 2013, 63, 927–943. [Google Scholar] [CrossRef]
- Bell, N.; Rohan, T.; James, S.; Aalders, L.; Burch, G.; Sarathchandra, S.; Gerard, E.; O’Callaghan, M. An investigation on non-target impacts of ryegrass endophytes on nematodes and soil microorganisms. N. Z. Grassl. Assoc. 2009, 71, 139–144. [Google Scholar]
- Liu, Q.; Parsons, A.J.; Xue, H.; Fraser, K.; Ryan, G.D.; Newman, J.A.; Rasmussen, S. Competition between foliar Neotyphodium lolii endophytes and mycorrhizal Glomus spp. fungi in Lolium perenne depends on resource supply and host carbohydrate content. Funct. Ecol. 2011, 25, 910–920. [Google Scholar] [CrossRef] [Green Version]
- Ludlow, E.J.; Vassiliadis, S.; Ekanayake, P.N.; Hettiarachchige, I.K.; Reddy, P.; Sawbridge, T.I.; Rochfort, S.J.; Spangenberg, G.C.; Guthridge, K.M. Analysis of the indole diterpene gene cluster for biosynthesis of the epoxy-janthitrems in Epichloë endophytes. Microorganisms 2019, 7, 560. [Google Scholar] [CrossRef] [Green Version]
- Koulman, A.; Tapper, B.A.; Fraser, K.; Cao, M.; Lane, G.A.; Rasmussen, S. High-throughput direct-infusion ion trap mass spectrometry: A new method for metabolomics. Rapid Commun. Mass Spectrom. 2007, 21, 421–428. [Google Scholar] [CrossRef] [PubMed]
- Koulman, A.; Lane, G.A.; Christensen, M.J.; Fraser, K.; Tapper, B.A. Peramine and other fungal alkaloids are exuded in the guttation fluid of endophyte-infected grasses. Phytochemistry 2007, 68, 355–360. [Google Scholar] [CrossRef] [PubMed]


Publisher’s Note: MDPI stays neutral with regard to jurisdictional claims in published maps and institutional affiliations. |
© 2021 by the authors. Licensee MDPI, Basel, Switzerland. This article is an open access article distributed under the terms and conditions of the Creative Commons Attribution (CC BY) license (http://creativecommons.org/licenses/by/4.0/).
Share and Cite
Patchett, A.; Newman, J.A. Comparison of Plant Metabolites in Root Exudates of Lolium perenne Infected with Different Strains of the Fungal Endophyte Epichloë festucae var. lolii. J. Fungi 2021, 7, 148. https://0-doi-org.brum.beds.ac.uk/10.3390/jof7020148
Patchett A, Newman JA. Comparison of Plant Metabolites in Root Exudates of Lolium perenne Infected with Different Strains of the Fungal Endophyte Epichloë festucae var. lolii. Journal of Fungi. 2021; 7(2):148. https://0-doi-org.brum.beds.ac.uk/10.3390/jof7020148
Chicago/Turabian StylePatchett, Aurora, and Jonathan A. Newman. 2021. "Comparison of Plant Metabolites in Root Exudates of Lolium perenne Infected with Different Strains of the Fungal Endophyte Epichloë festucae var. lolii" Journal of Fungi 7, no. 2: 148. https://0-doi-org.brum.beds.ac.uk/10.3390/jof7020148