
Development of CAPS Markers for Evaluation of Genetic Diversity and Population Structure in the Germplasm of Button Mushroom (Agaricus bisporus)

 , , and
Abstract
:1. Introduction
2. Materials and Methods
2.1. A. bisporus Genetic Resources and DNA Extraction
2.2. Primer Construction and PCR
2.3. Data Analysis
3. Results
3.1. Genotyping and Marker Diversity
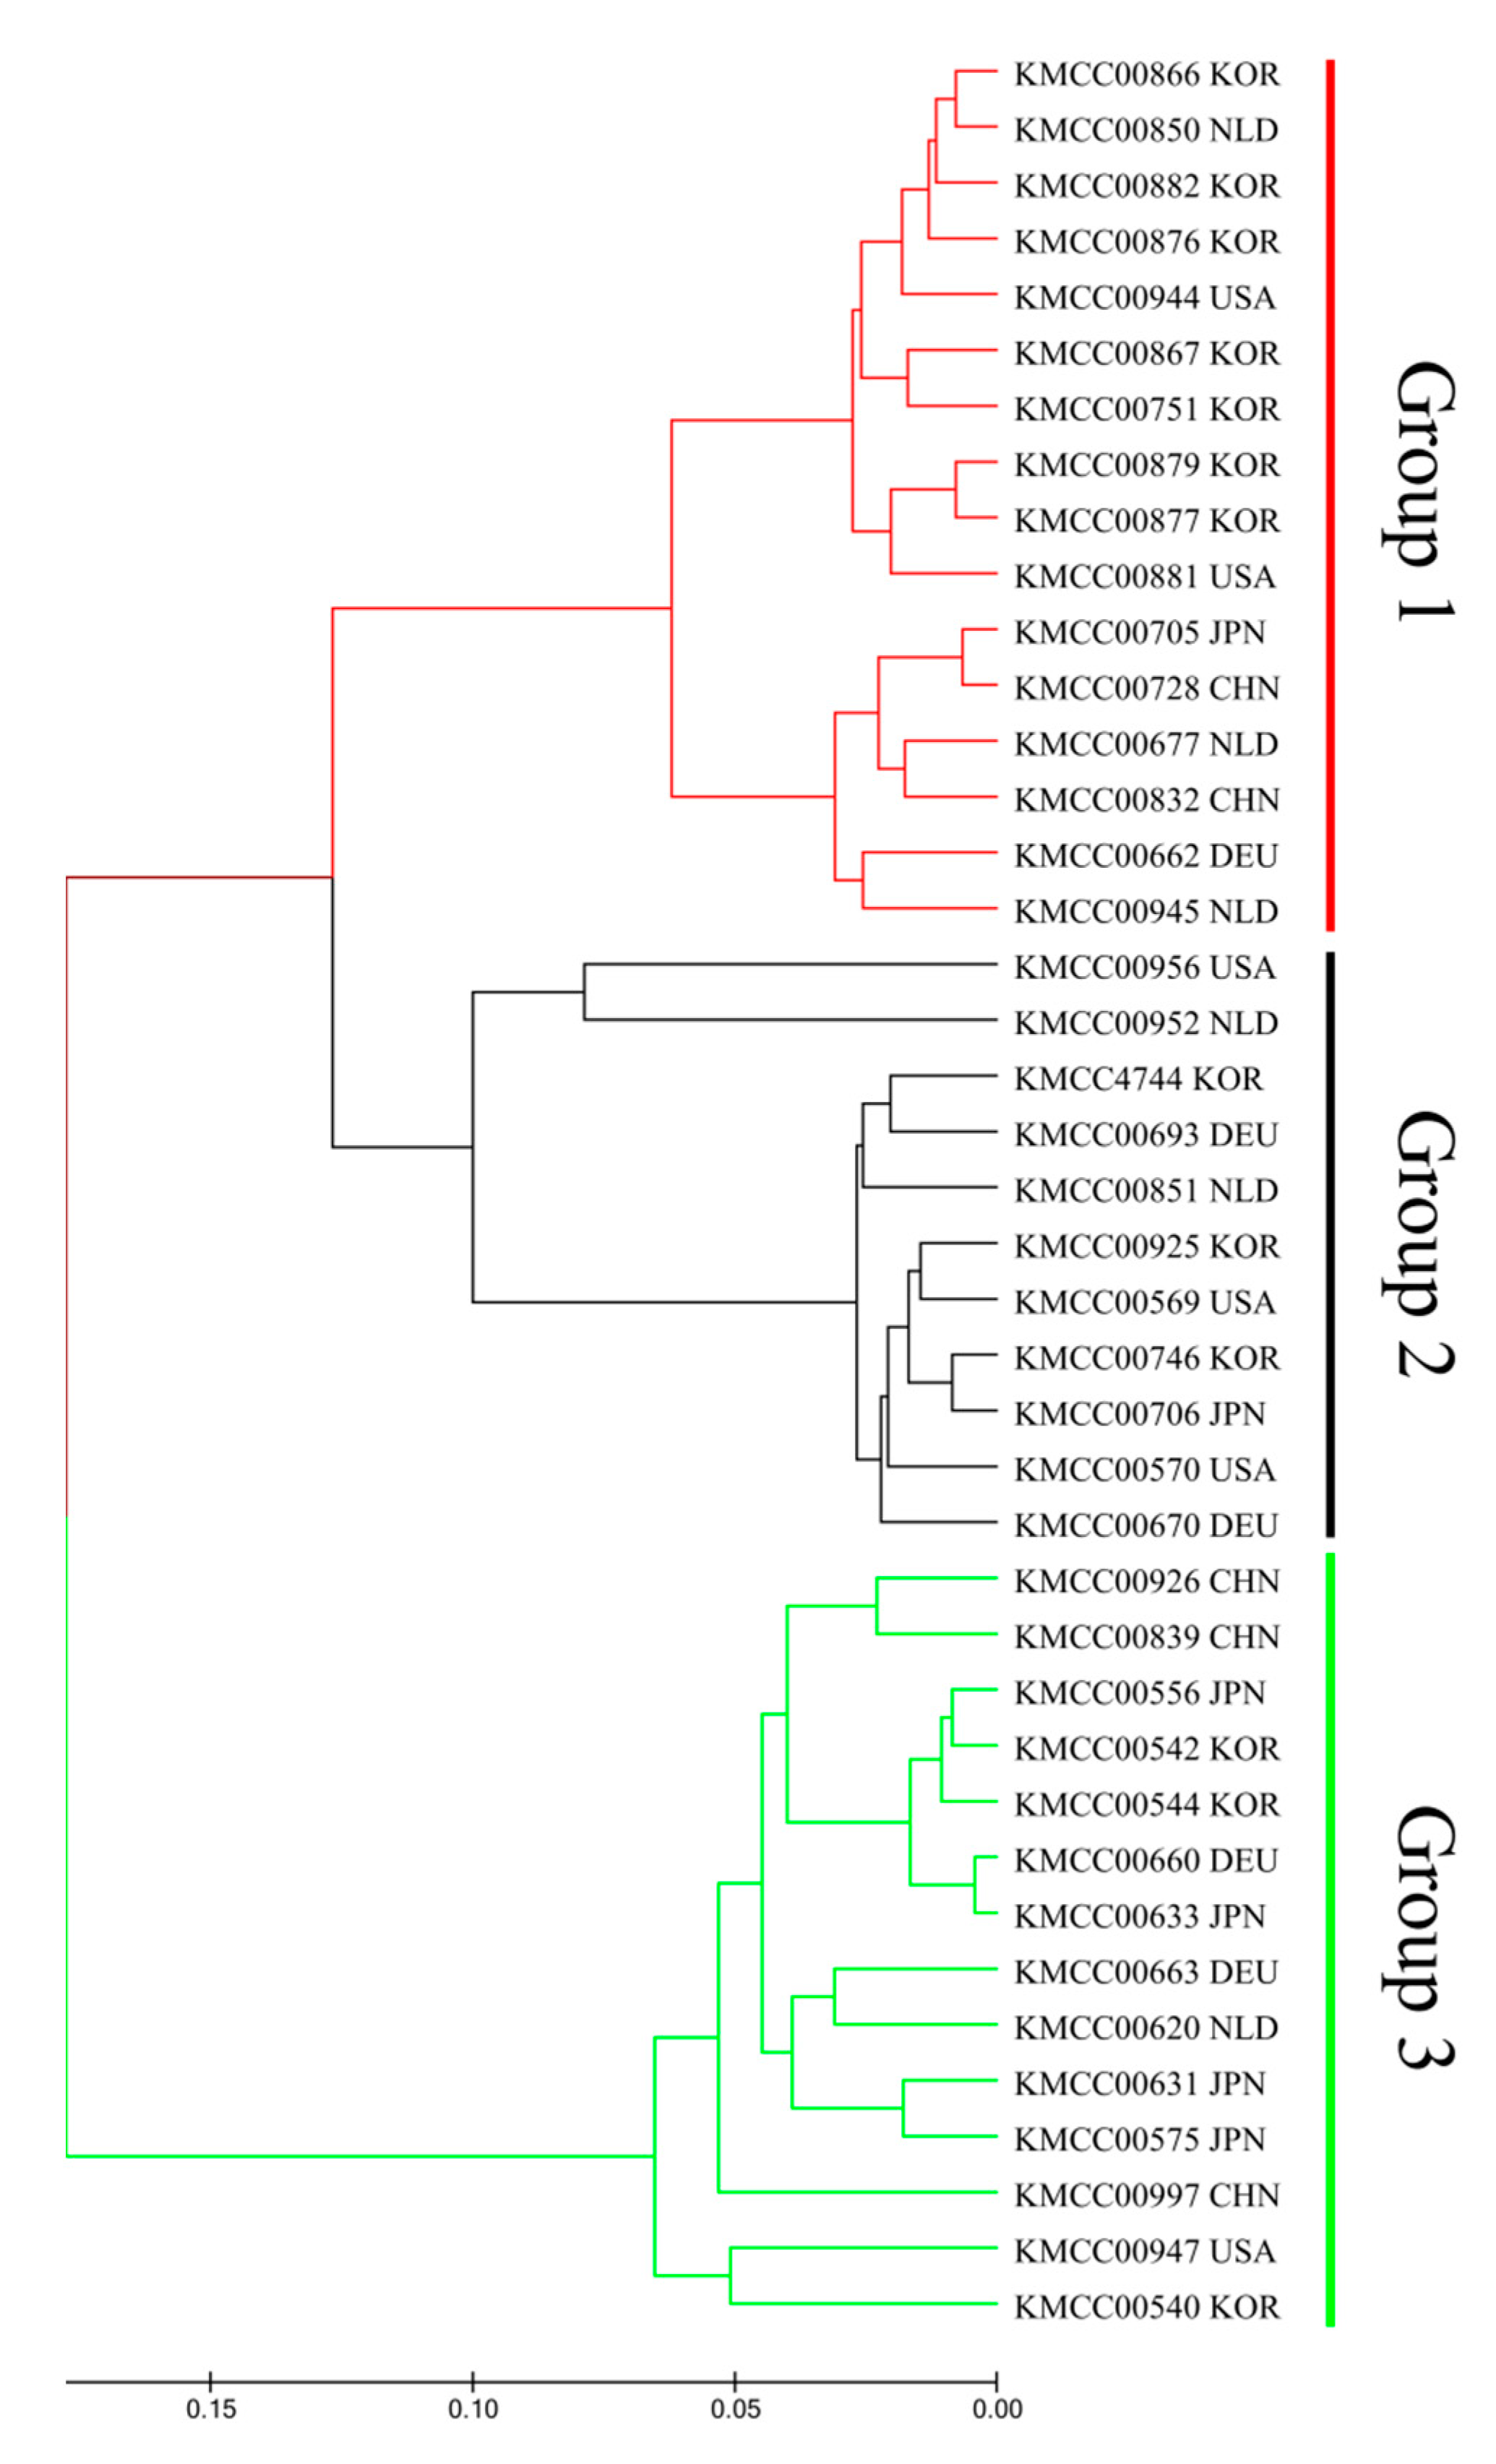
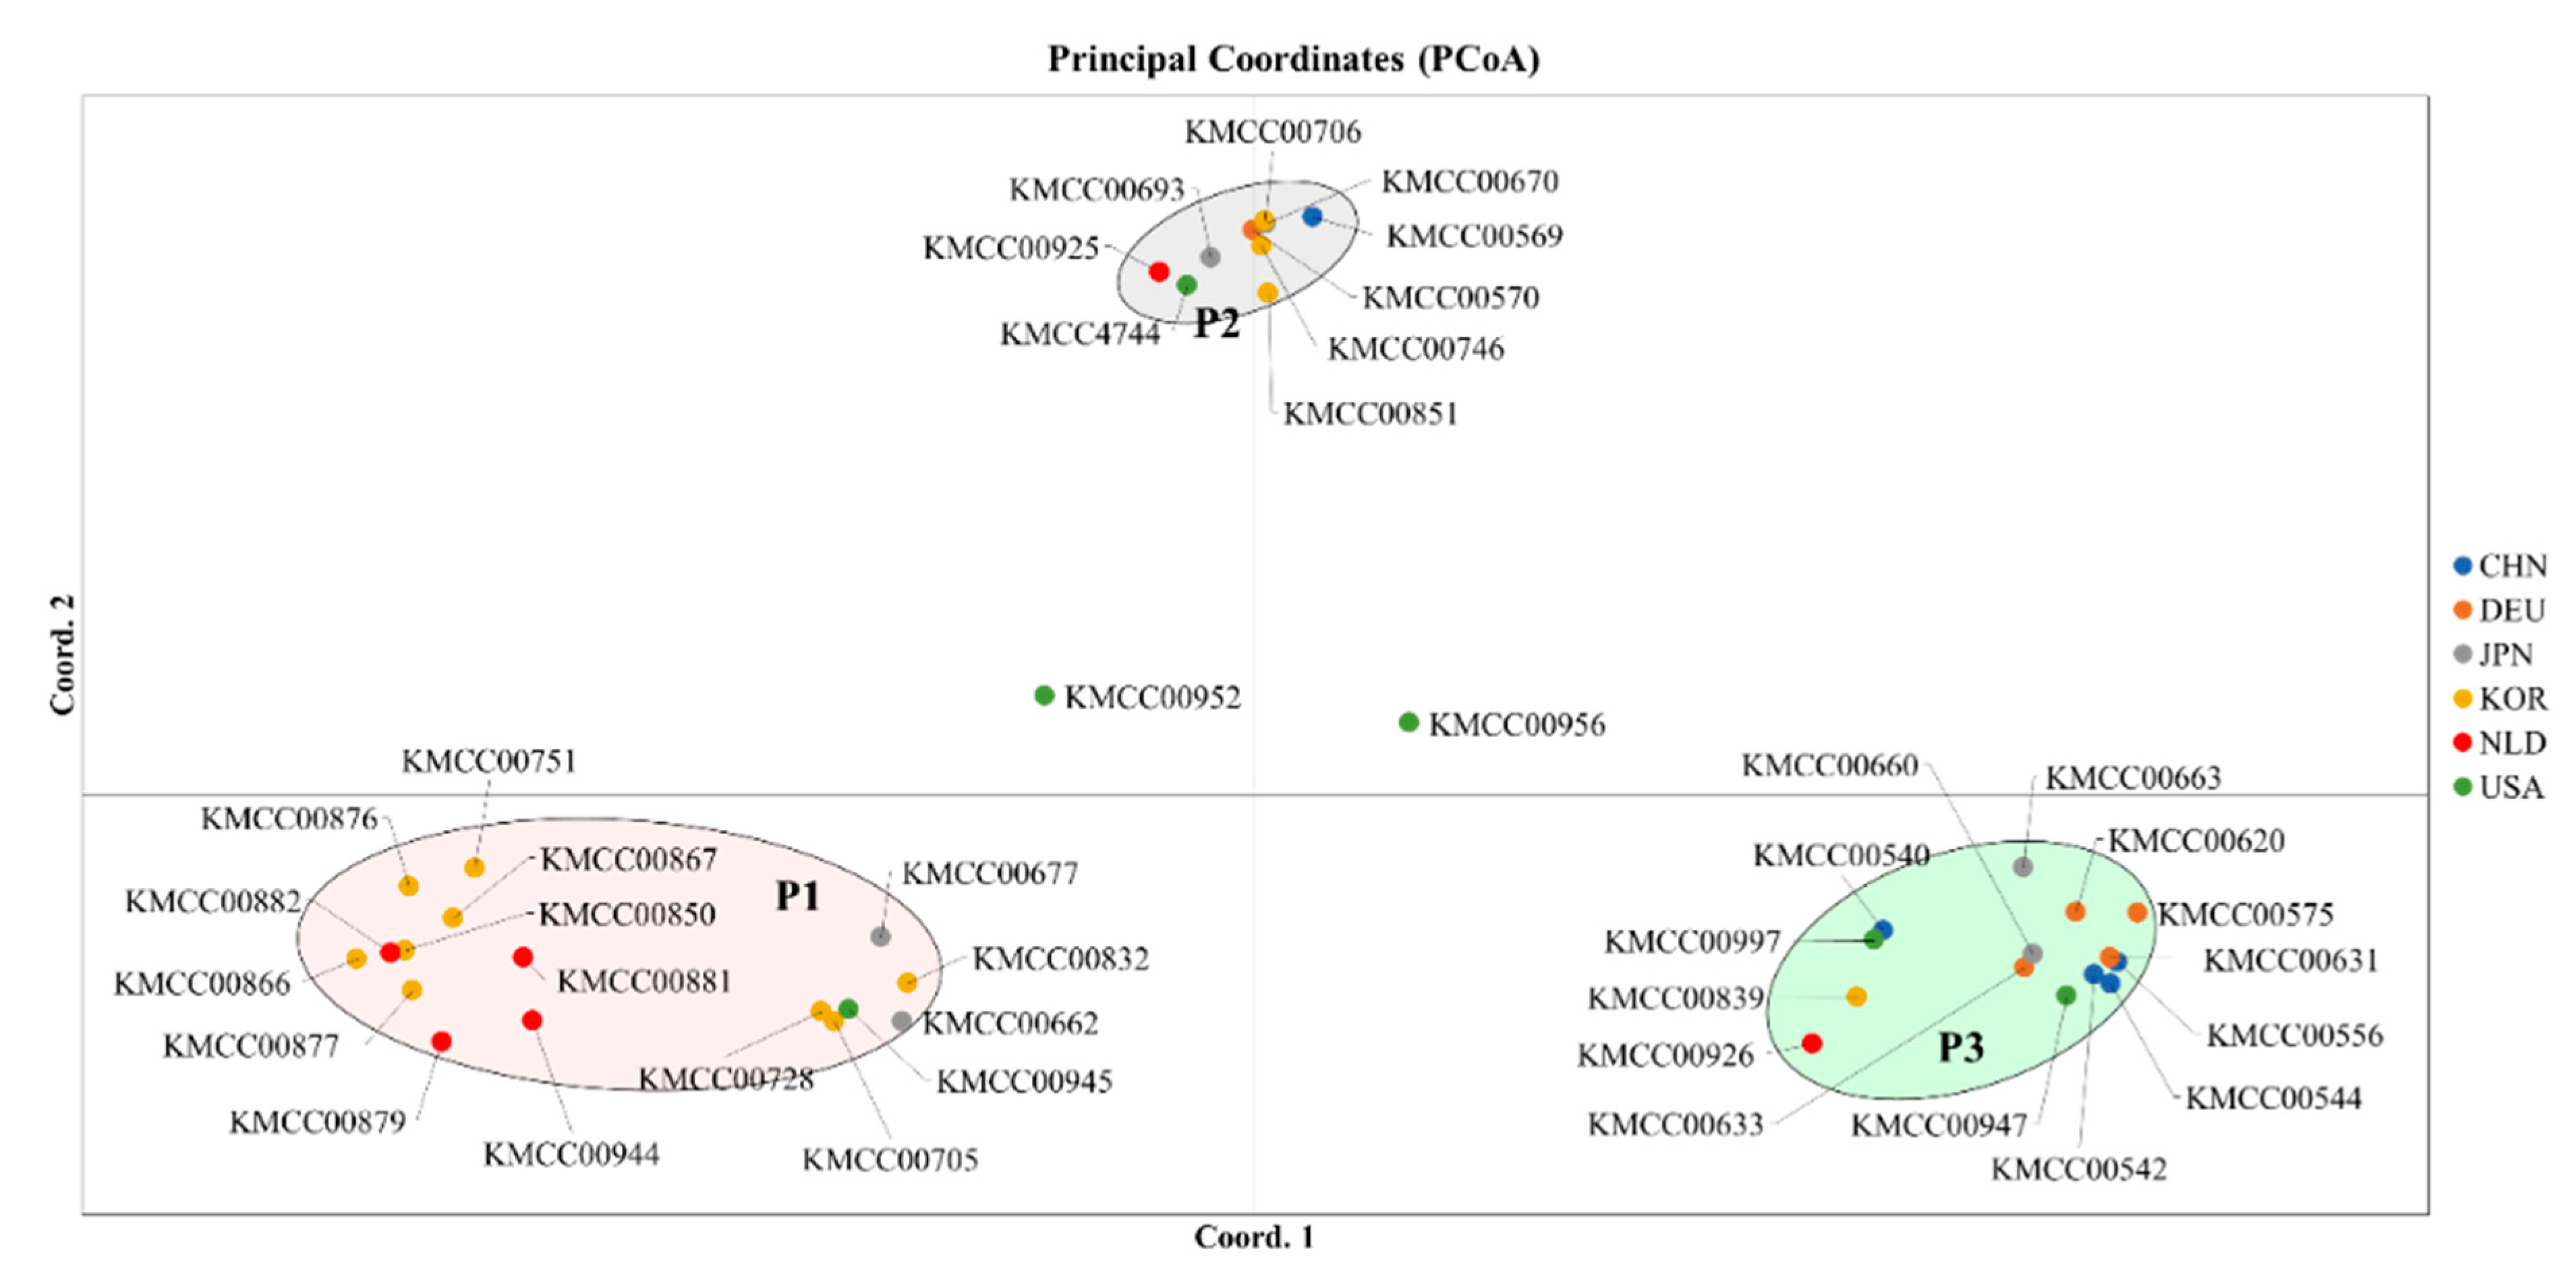
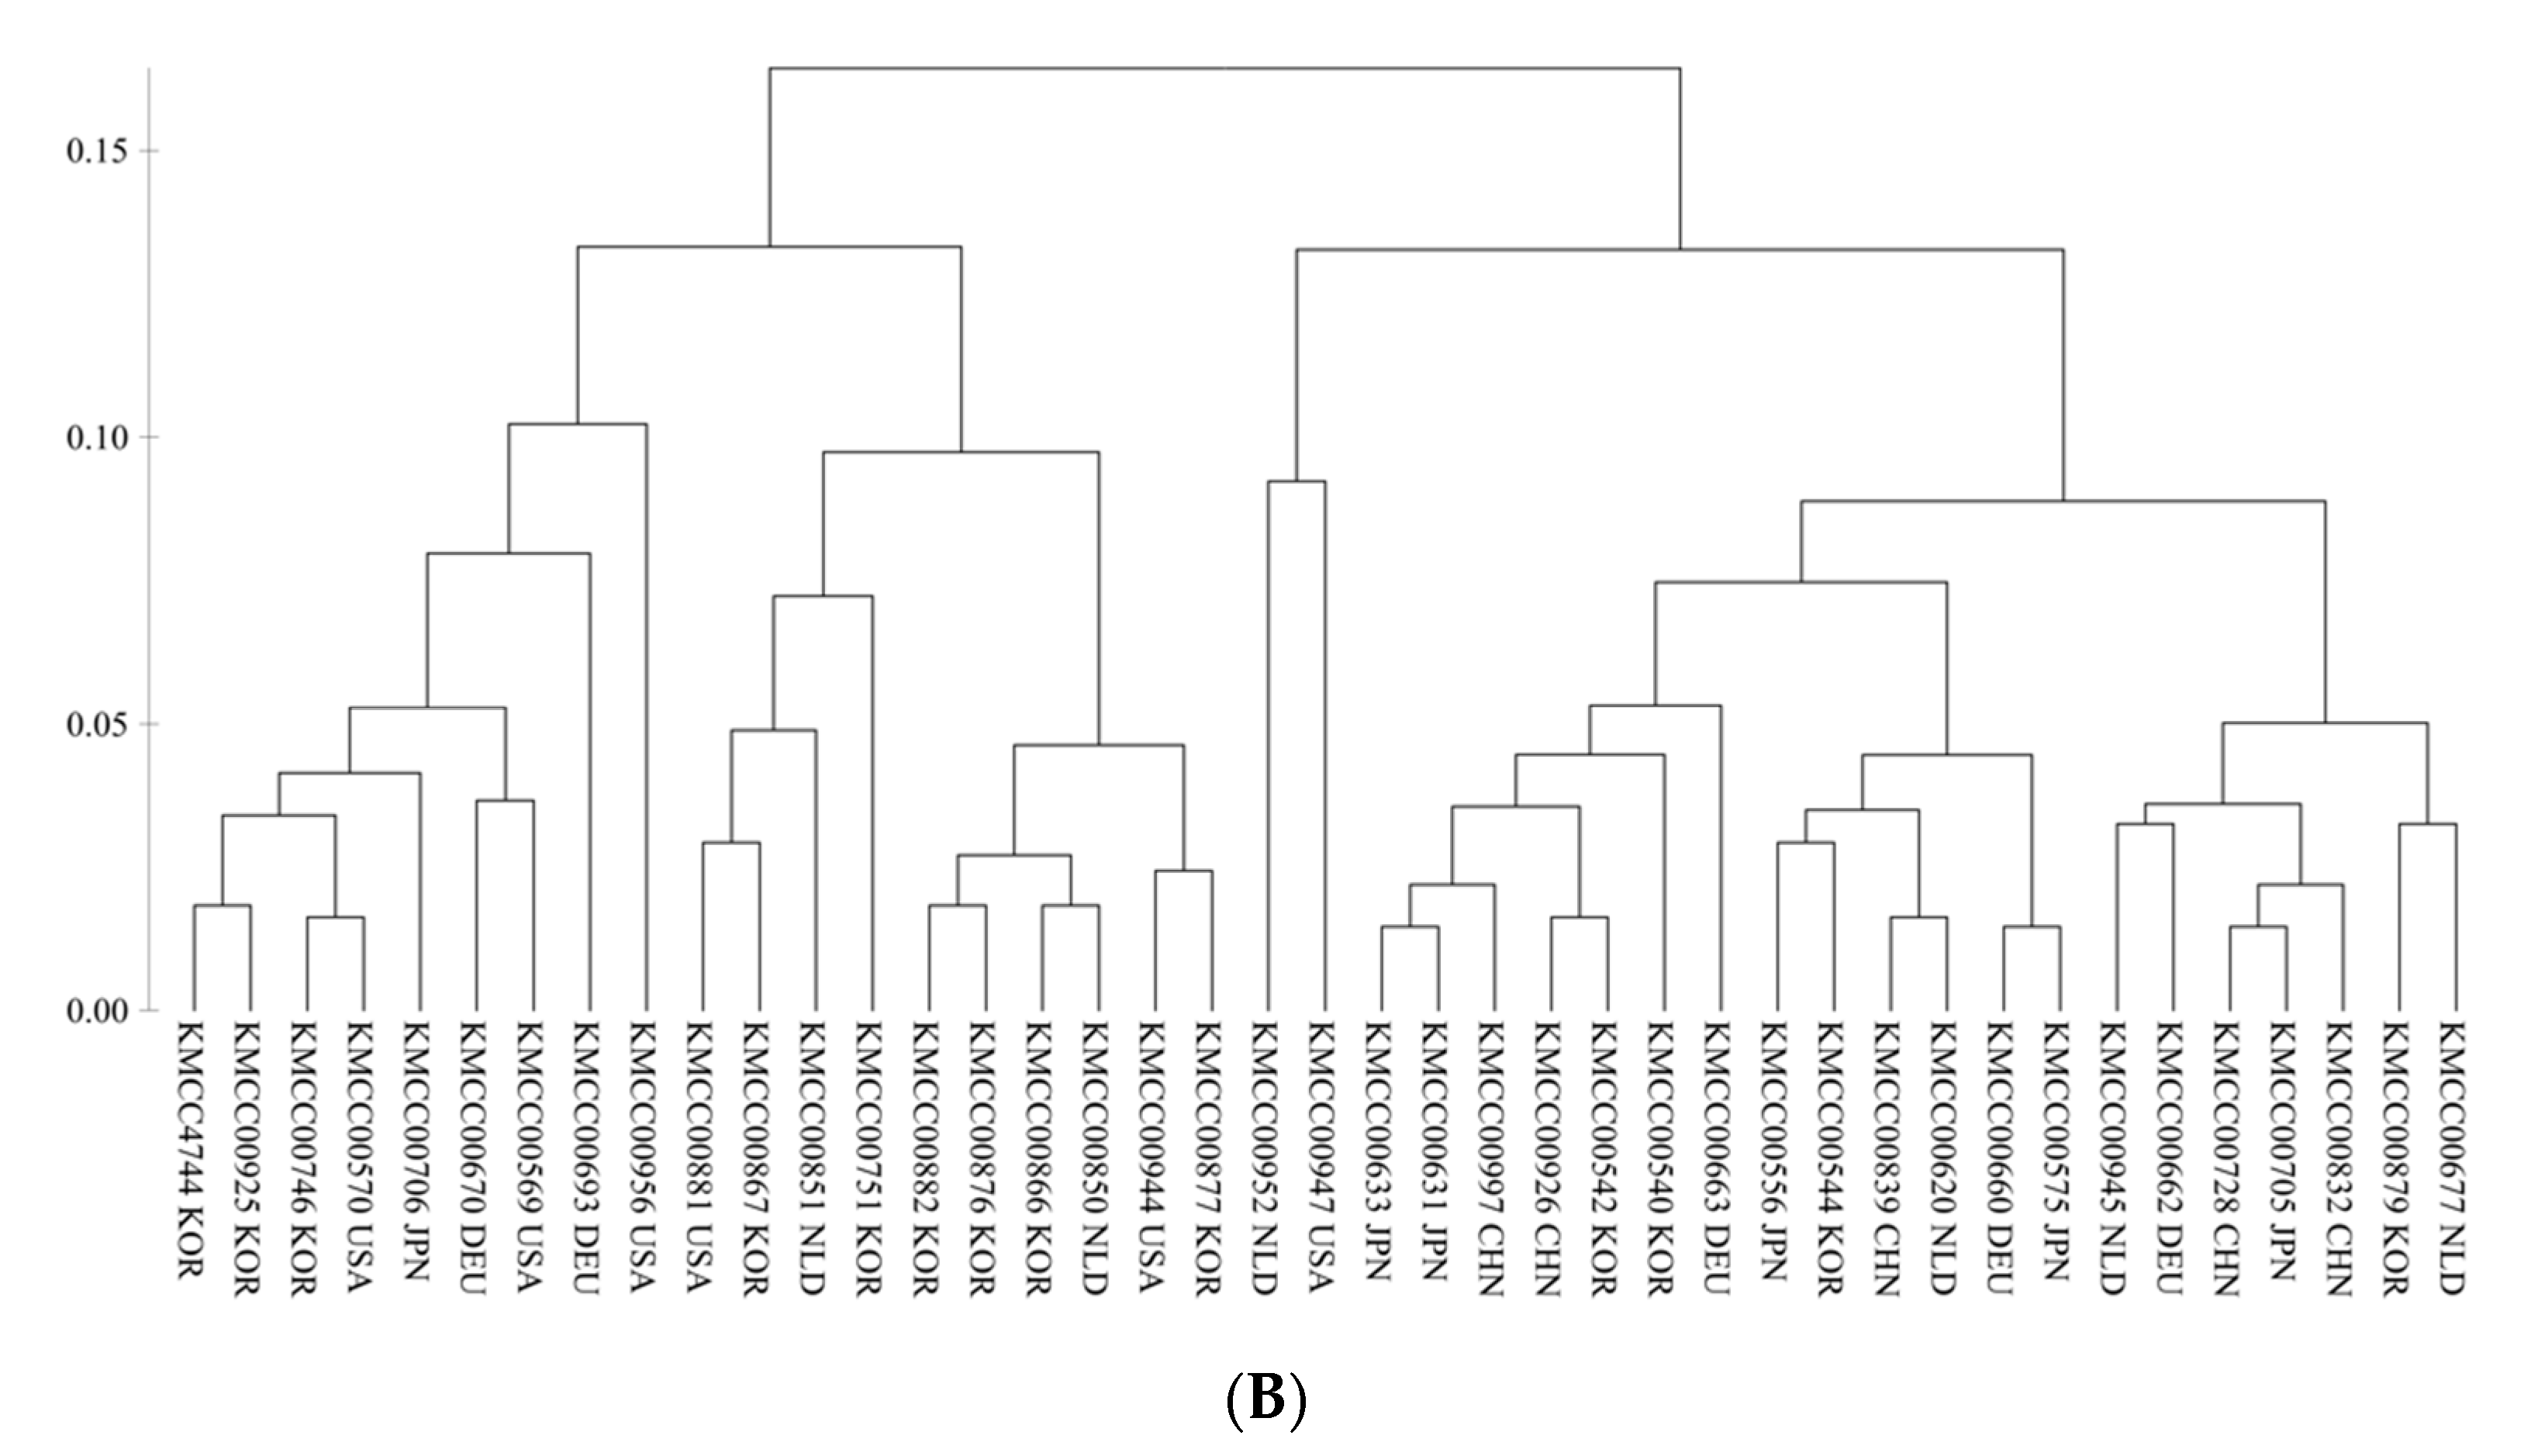
3.2. Grouping Based on Data Analysis and AMOVA
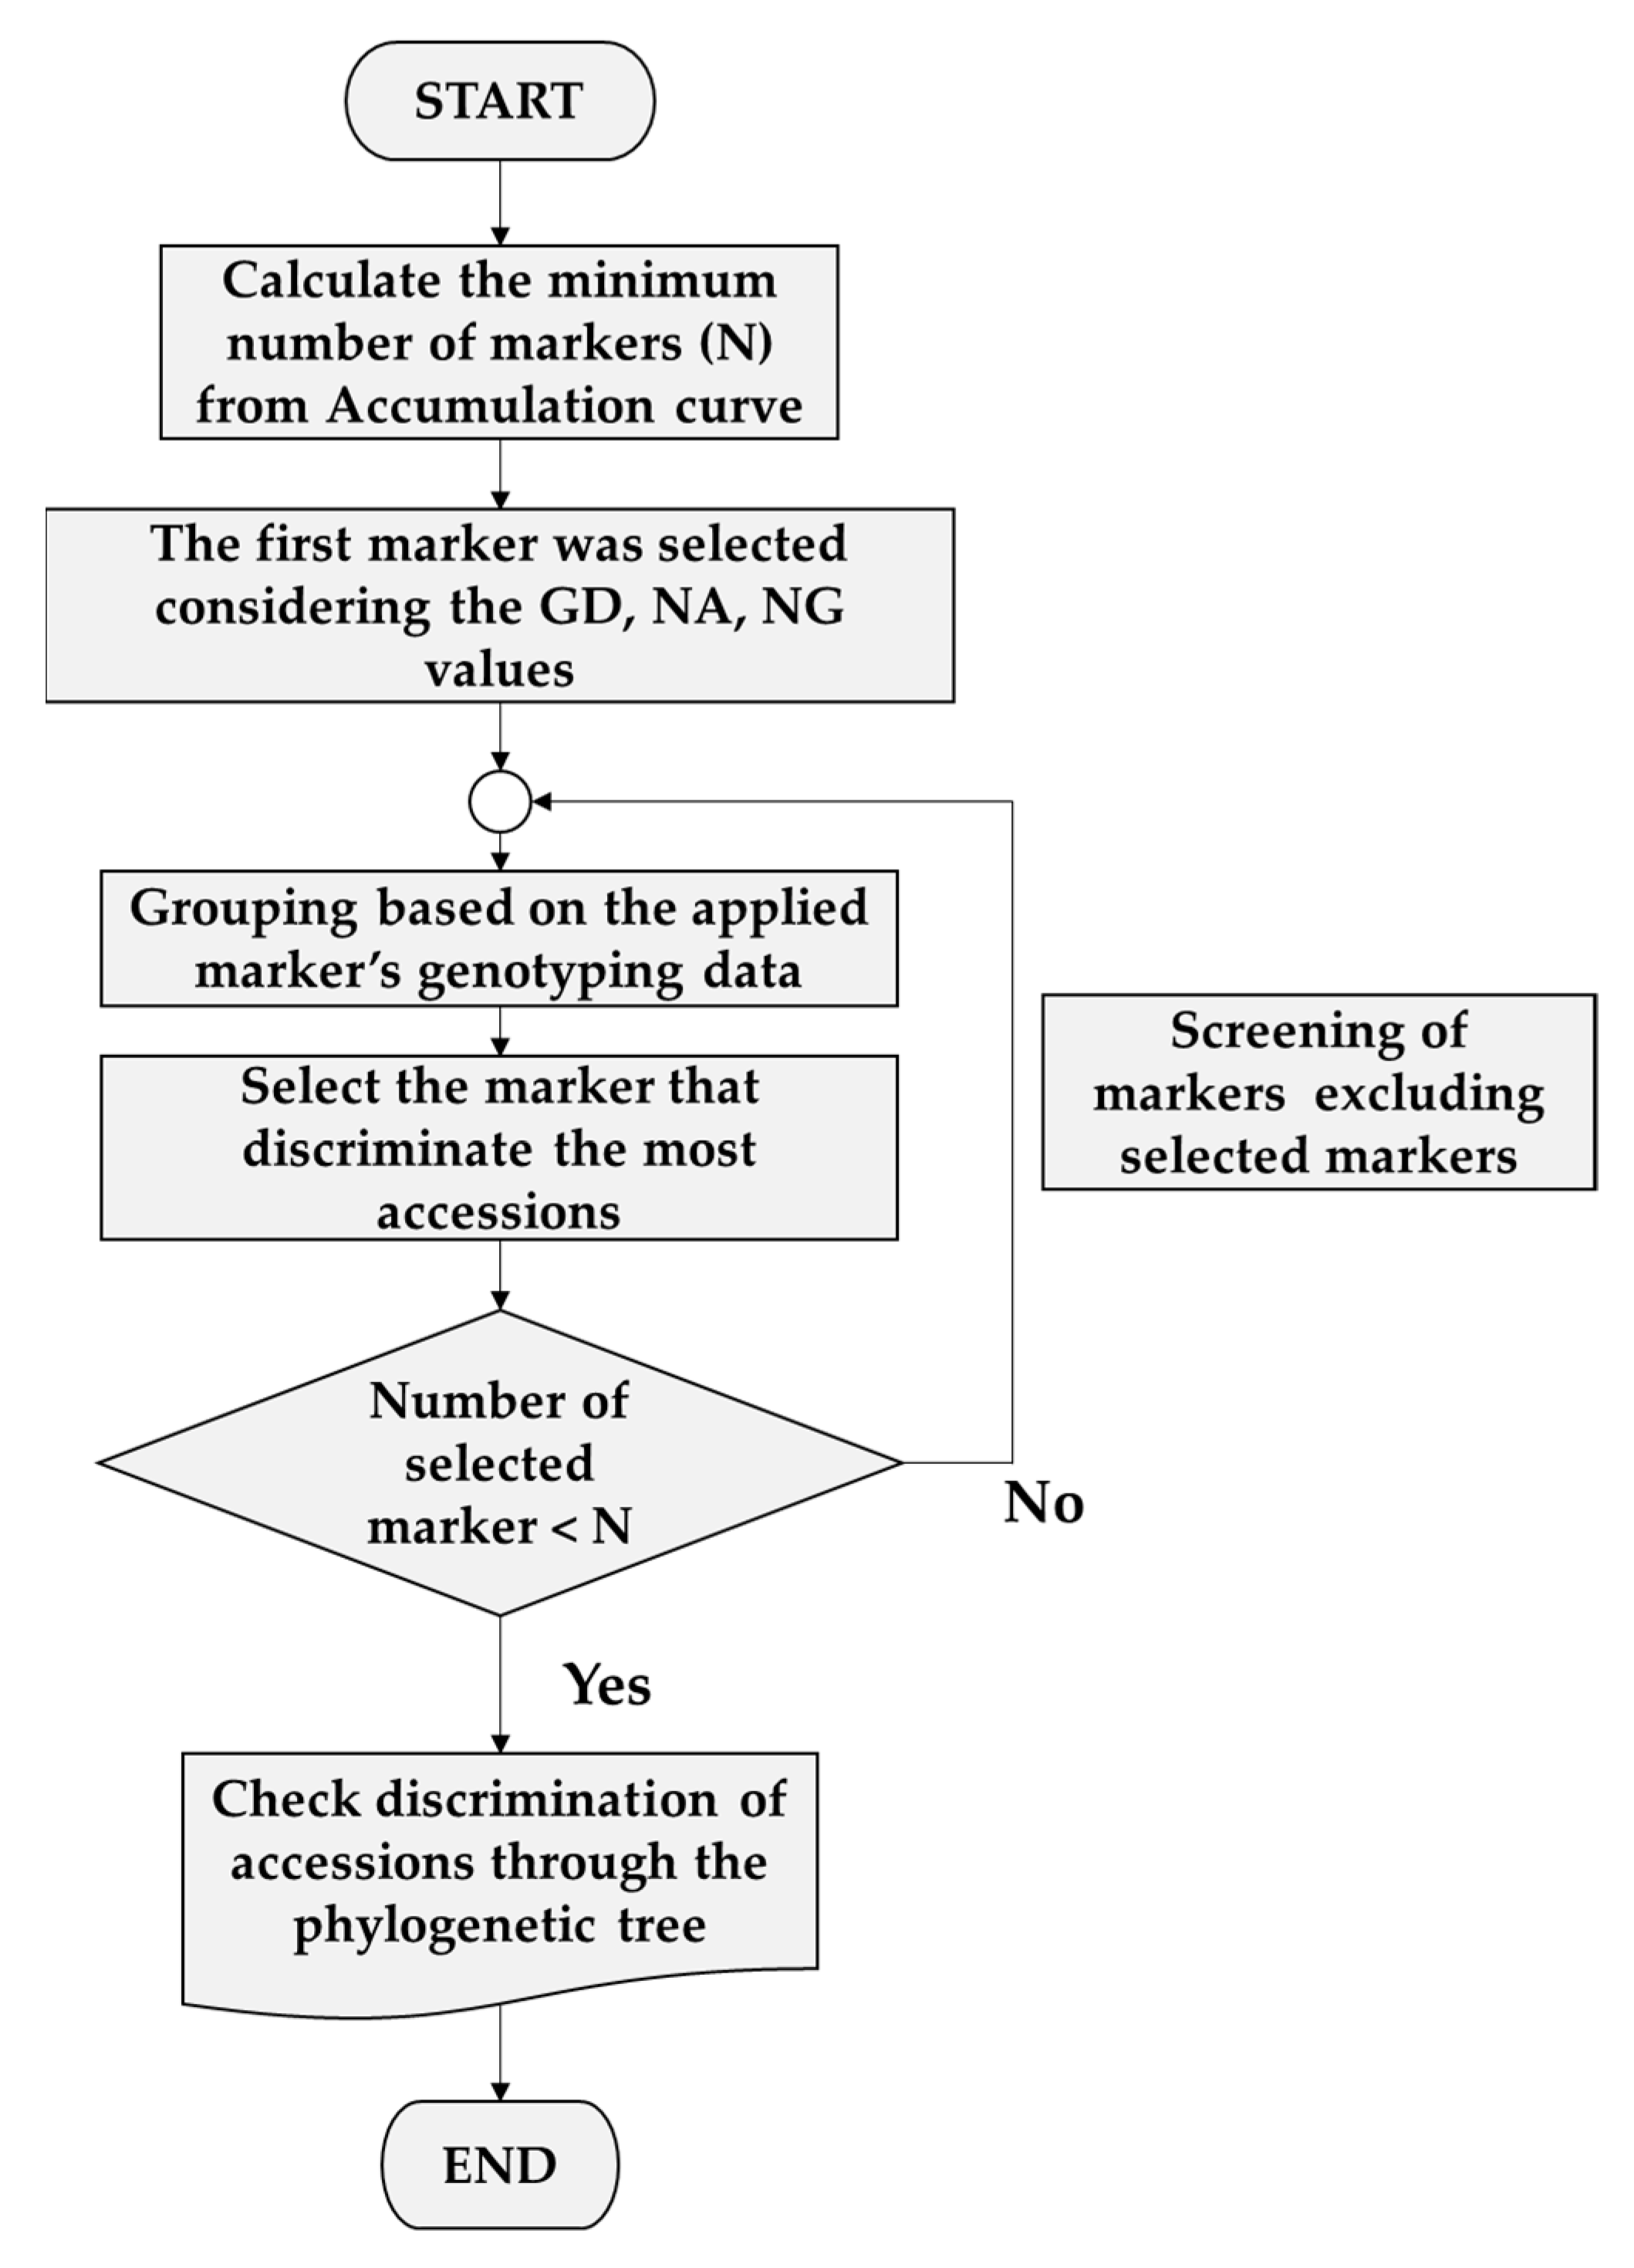
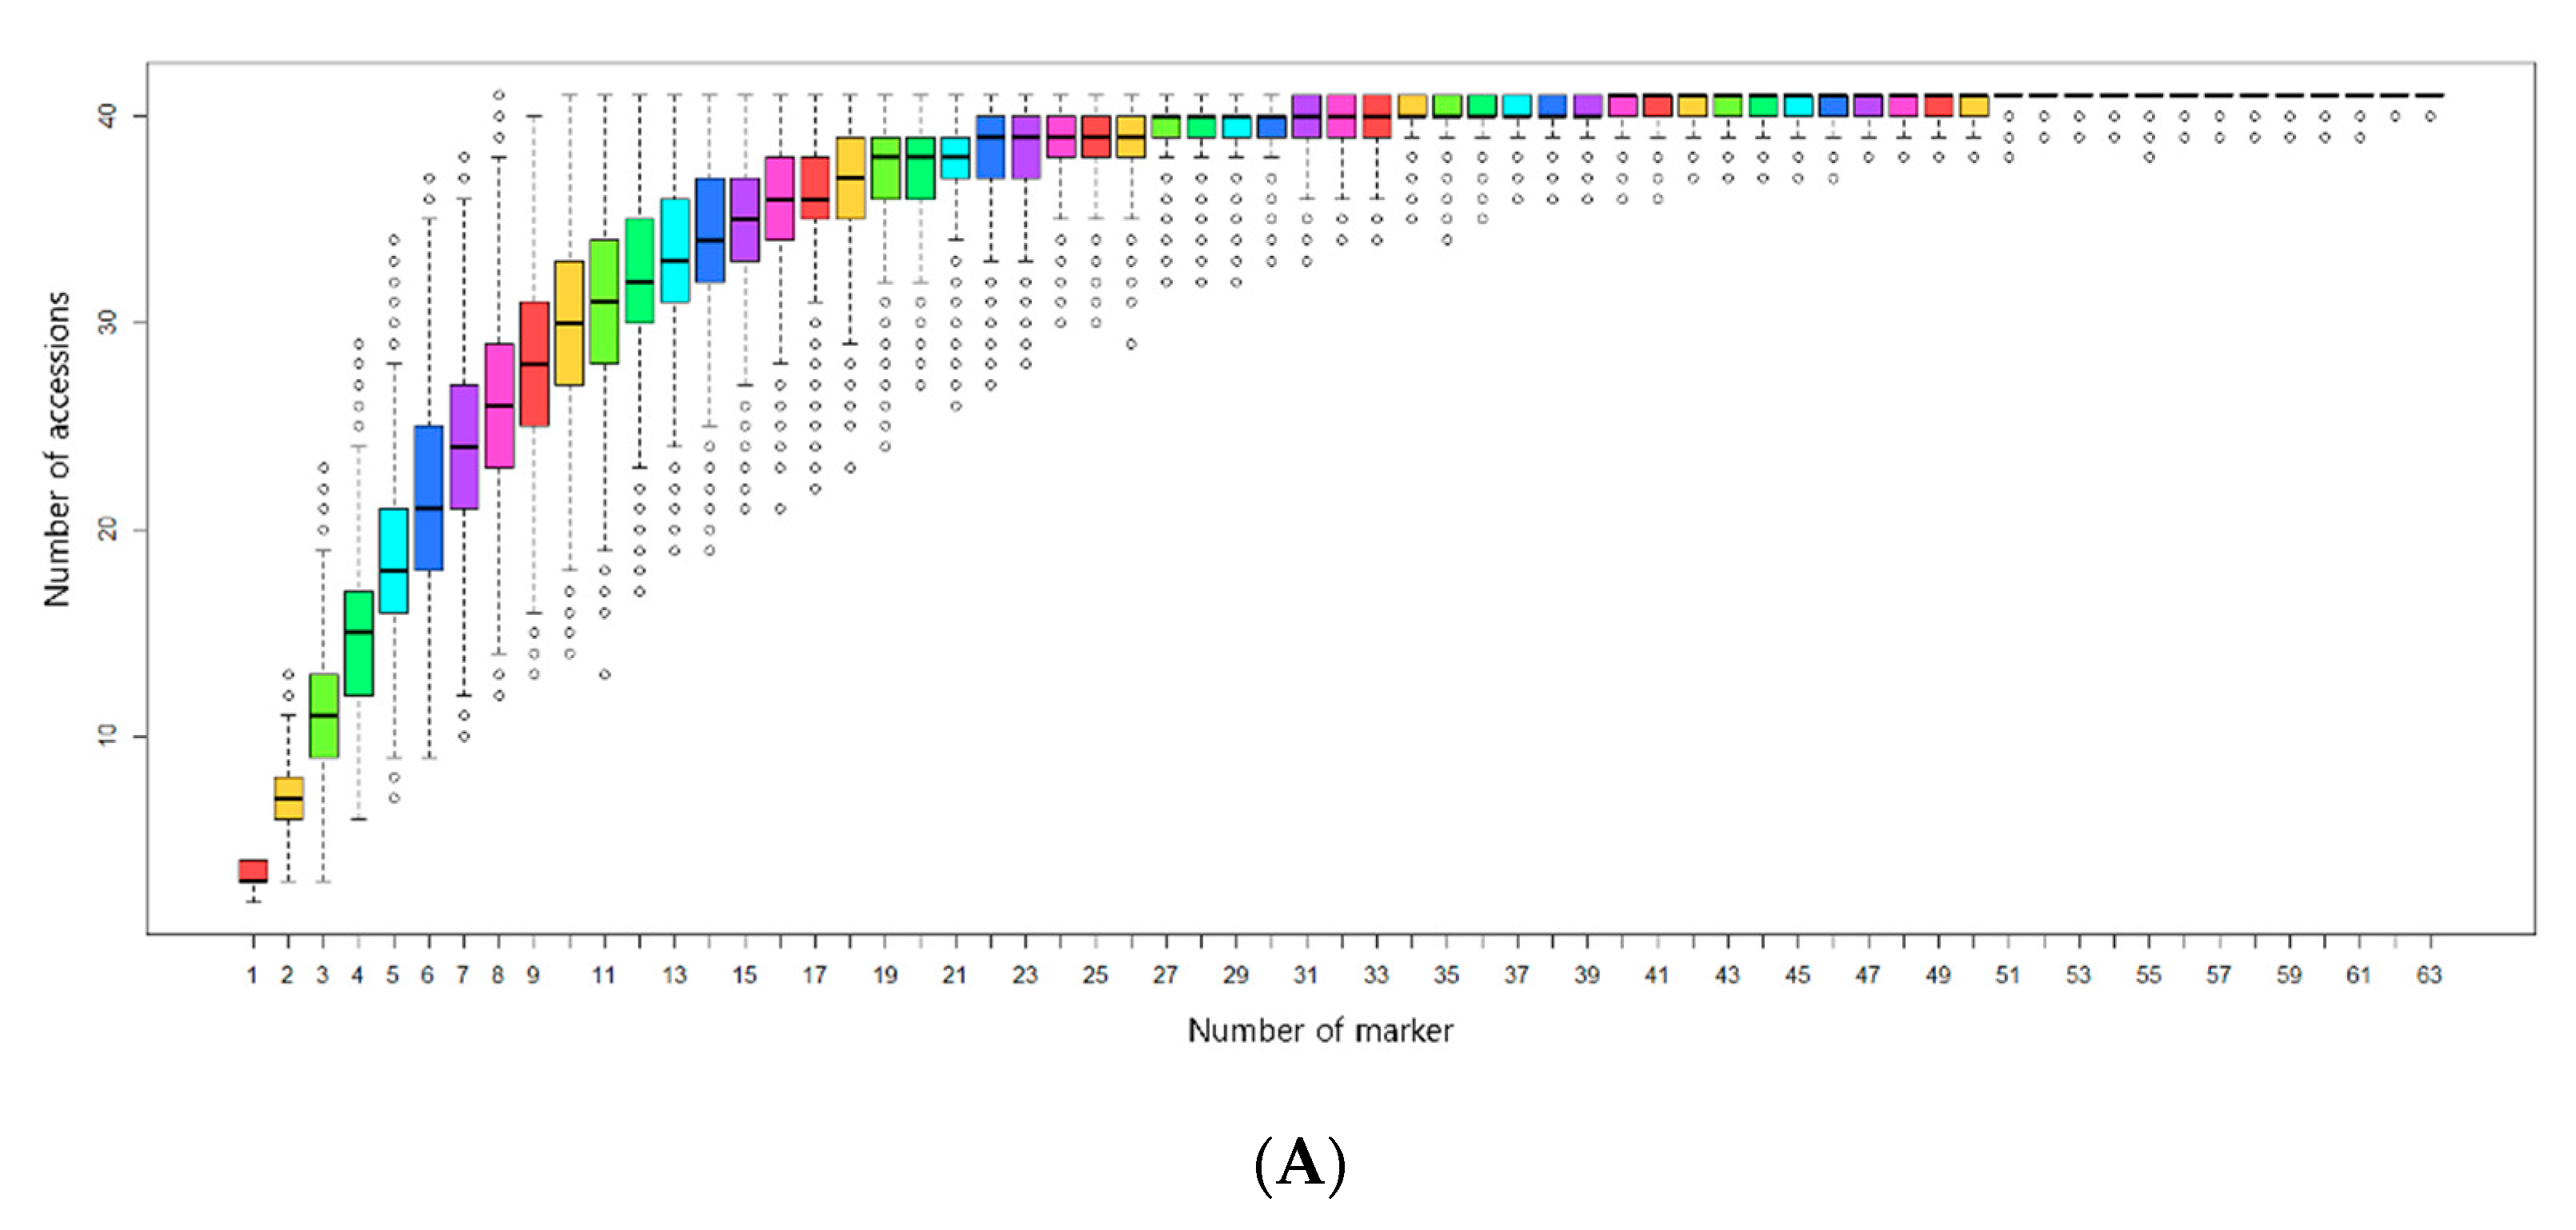
3.3. Selection of Minimum Markers for Discrimination
4. Discussion
4.1. Polymorphism Did Not Differ According to SNP Mutation Type
4.2. Diversity of Developed SNP Markers
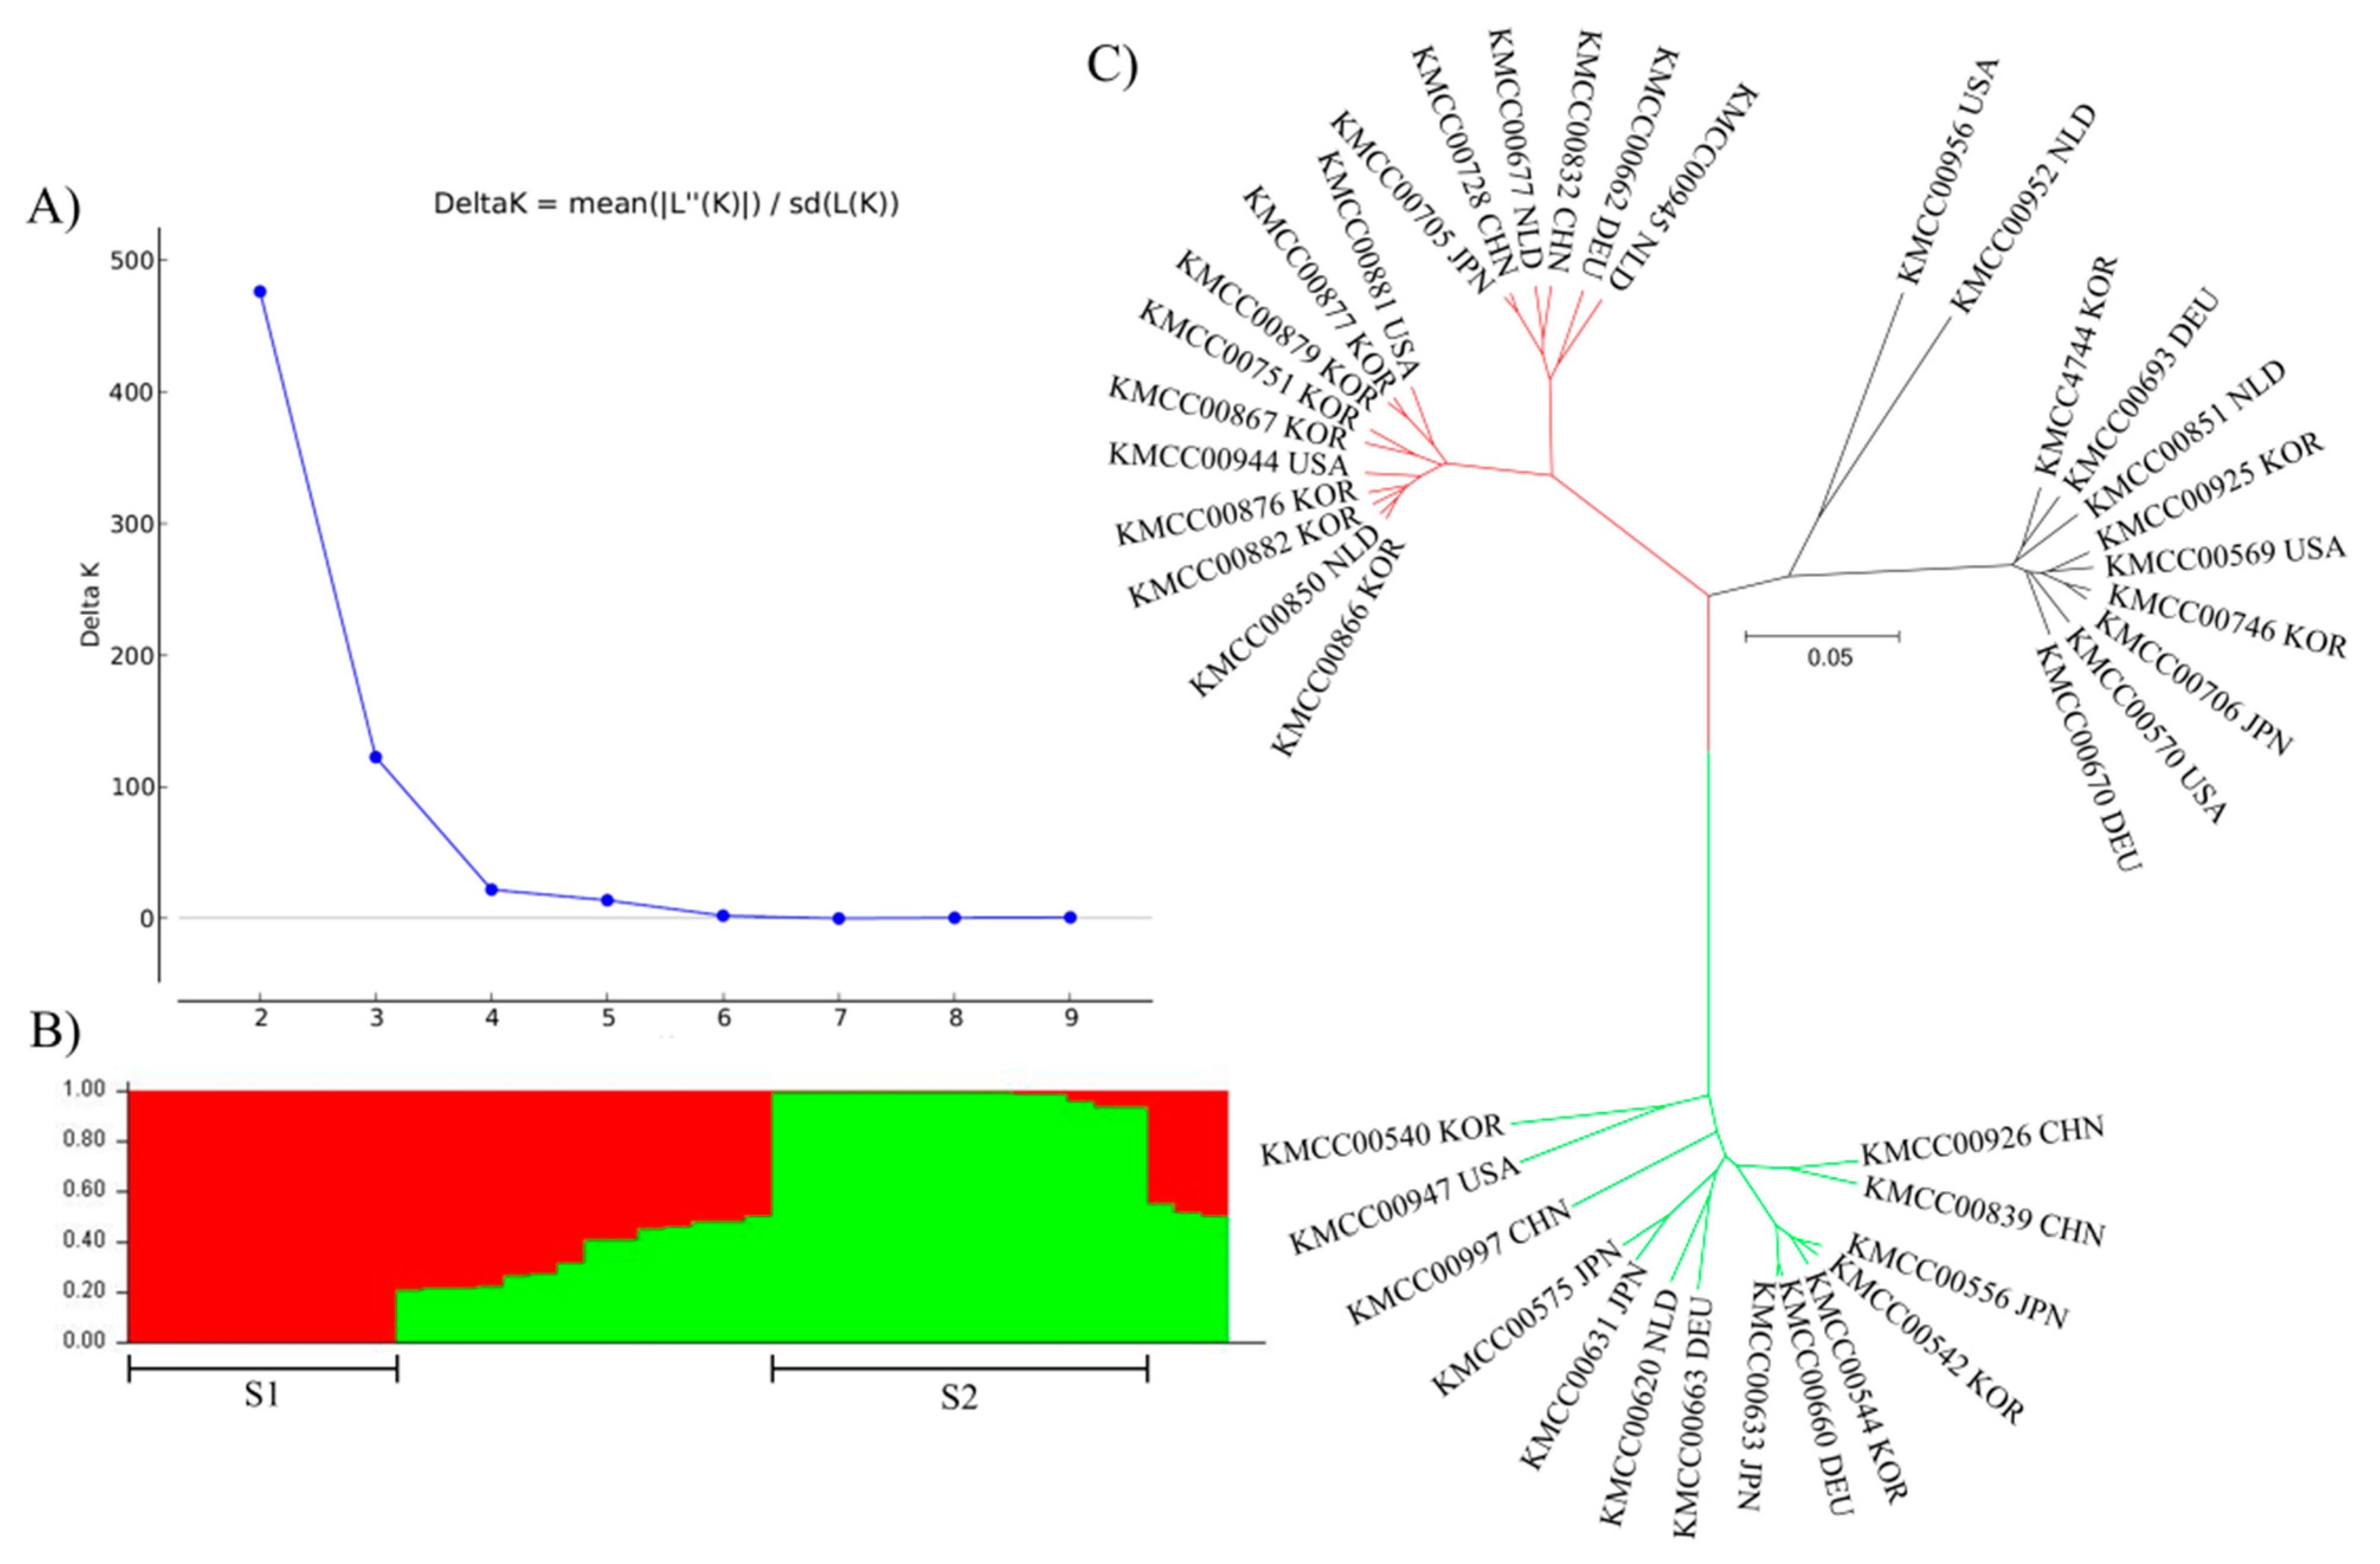
4.3. Population Structure Analysis Using SNP Markers
4.4. Selection of Minimum Markers for Accession Identification
5. Conclusions
Author Contributions
Funding
Institutional Review Board Statement
Informed Consent Statement
Data Availability Statement
Conflicts of Interest
References
- Yun, M.-J.; Oh, S.-I.; Lee, M.-S. Antioxidative and antimutagenic effects of Agaricus bisporus ethanol extracts. J. Korean Soc. Food Sci. Nutr. 2009, 38, 19–24. [Google Scholar] [CrossRef]
- Jeong, S.C.; Jeong, Y.T.; Yang, B.K.; Islam, R.; Koyyalamudi, S.R.; Pang, G.; Cho, K.Y.; Song, C.H. White button mushroom (Agaricus bisporus) lowers blood glucose and cholesterol levels in diabetic and hypercholesterolemic rats. Nutr. Res. 2010, 30, 49–56. [Google Scholar] [CrossRef] [PubMed]
- Royse, D.J.; Baars, J.; Tan, Q. Current overview of mushroom production in the world. In Edible and Medicinal Mushrooms: Technology and Applications; Zied, D.C., Pardo-Giménez, A., Eds.; Wiley-Blackwell: Hoboken, NJ, USA, 2017; Chapter 2; pp. 5–13. [Google Scholar]
- Sonnenberg, A.; Baars, J.; Hendrickx, P.; Lavrijssen, B.; Gao, W.; Weijn, A.; Mes, J. Breeding and strain protection in the button mushroom Agaricus bisporus. In Proceedings of the 7th International Conference of the World Society for Mushroom Biology and Mushroom Products, Arcachon, France, 4–7 October 2011; pp. 7–15. [Google Scholar]
- Bretting, P.; Widrlechner, M.P. Genetic markers and plant genetic accession management. In Plant Breeding Reviews; NCRPIS Publications and Papers: Ames, IA, USA, 1995; Volume 13, pp. 11–86. [Google Scholar]
- Agarwal, M.; Shrivastava, N.; Padh, H. Advances in molecular marker techniques and their applications in plant sciences. Plant Cell Rep. 2008, 27, 617–631. [Google Scholar] [CrossRef]
- Loftus, M.; Moore, D.; Elliott, T. DNA polymorphisms in commercial and wild strains of the cultivated mushroom, Agaricus bisporus. Theor. Appl. Genet. 1988, 76, 712–718. [Google Scholar] [CrossRef]
- Moore, A.; Challen, M.; Warner, P.; Elliott, T. RAPD discrimination of Agaricus bisporus mushroom cultivars. Appl. Microbiol. Biotechnol. 2001, 55, 742–749. [Google Scholar] [CrossRef]
- Foulongne-Oriol, M.; Spataro, C.; Savoie, J.-M. Novel microsatellite markers suitable for genetic studies in the white button mushroom Agaricus bisporus. Appl. Microbiol. Biotechnol. 2009, 84, 1125–1135. [Google Scholar] [CrossRef] [PubMed]
- Lee, H.-Y.; Raveendar, S.; An, H.; Oh, Y.-L.; Jang, K.-Y.; Kong, W.-S.; Ryu, H.; So, Y.-S.; Chung, J.-W. Development of polymorphic simple sequence repeat markers using high-throughput sequencing in button mushroom (Agaricus bisporus). Mycobiology 2018, 46, 421–428. [Google Scholar] [CrossRef] [PubMed]
- An, H.; Jo, I.-H.; Oh, Y.-L.; Jang, K.-Y.; Kong, W.-S.; Sung, J.-K.; So, Y.-S.; Chung, J.-W. Molecular characterization of 170 new gDNA-SSR markers for genetic diversity in button mushroom (Agaricus bisporus). Mycobiology 2019, 47, 527–532. [Google Scholar] [CrossRef] [Green Version]
- Oh, Y.-L.; Choi, I.-G.; Kong, W.-S.; Jang, K.-Y.; Oh, M.J.; Im, J.-H. Evaluating genetic diversity of Agaricus bisporus accessions through phylogenetic analysis using single-nucleotide polymorphism (SNP) markers. Mycobiology 2021, 49, 61–68. [Google Scholar] [CrossRef]
- Sonnenberg, A.S.; Gao, W.; Lavrijssen, B.; Hendrickx, P.; Sedaghat-Tellgerd, N.; Foulongne-Oriol, M.; Kong, W.-S.; Schijlen, E.G.; Baars, J.J.; Visser, R.G. A detailed analysis of the recombination landscape of the button mushroom Agaricus bisporus var. bisporus. Fungal Genet. Biol. 2016, 93, 35–45. [Google Scholar] [CrossRef] [Green Version]
- Sonnenberg, A.S.; Baars, J.J.; Gao, W.; Visser, R.G. Developments in breeding of Agaricus bisporus var. bisporus: Progress made and technical and legal hurdles to take. Appl. Microbiol. Biotechnol. 2017, 101, 1819–1829. [Google Scholar] [CrossRef] [PubMed] [Green Version]
- Gao, W.; Weijn, A.; Baars, J.J.; Mes, J.J.; Visser, R.G.; Sonnenberg, A.S. Quantitative trait locus mapping for bruising sensitivity and cap color of Agaricus bisporus (button mushrooms). Fungal Genet. Biol. 2015, 77, 69–81. [Google Scholar] [CrossRef]
- Gao, W.; Baars, J.J.; Maliepaard, C.; Visser, R.G.; Zhang, J.; Sonnenberg, A.S. Multi-trait QTL analysis for agronomic and quality characters of Agaricus bisporus (button mushrooms). AMB Express 2016, 6, 1–13. [Google Scholar] [CrossRef] [Green Version]
- Edwards, D.; Forster, J.W.; Chagné, D.; Batley, J. What Are SNPs? In Association Mapping in Plants; Oraguzie, N.C., Rikkerink, E.H.A., Gardiner, S.E., De Silva, H.N., Eds.; Springer: New York, NY, USA, 2007; pp. 41–52. [Google Scholar]
- Moon, S.; Lee, H.-Y.; Ka, K.-H.; Koo, C.-D.; Ryu, H. Development of a CAPS marker for the identification of the Lentinula edodes cultivar, ‘Sanmaru 2ho’. J. Mushroom 2018, 16, 51–56. [Google Scholar]
- Konieczny, A.; Ausubel, F.M. A procedure for mapping Arabidopsis mutations using co-dominant ecotype-specific PCR-based markers. Plant J. 1993, 4, 403–410. [Google Scholar] [CrossRef]
- Blair, M.W.; Cortés, A.J.; Penmetsa, R.V.; Farmer, A.; Carrasquilla-Garcia, N.; Cook, D.R. A high-throughput SNP marker system for parental polymorphism screening, and diversity analysis in common bean (Phaseolus vulgaris L.). Theor. Appl. Genet. 2013, 126, 535–548. [Google Scholar] [CrossRef]
- Parsons, B.L.; Heflich, R.H. Genotypic selection methods for the direct analysis of point mutations. Mutat. Res. Rev. Mutat. Res. 1997, 387, 97–121. [Google Scholar] [CrossRef]
- Neff, M.M.; Neff, J.D.; Chory, J.; Pepper, A.E. dCAPS, a simple technique for the genetic analysis of single nucleotide polymorphisms: Experimental applications in Arabidopsis thaliana genetics. Plant J. 1998, 14, 387–392. [Google Scholar] [CrossRef]
- Arlotta, C.; Ciacciulli, A.; Strano, M.C.; Cafaro, V.; Salonia, F.; Caruso, P.; Licciardello, C.; Russo, G.; Smith, M.W.; Cuenca, J.; et al. Disease resistant citrus breeding using newly developed high resolution melting and CAPS protocols for Alternaria brown spot marker assisted selection. Agronomy 2020, 10, 1368. [Google Scholar] [CrossRef]
- Choi, Y.R.; Lee, J.Y.; Hwang, S.; Kim, H.U. PCR-based InDel marker associated with powdery mildew-resistant MR-1. Agronomy 2020, 10, 1274. [Google Scholar] [CrossRef]
- Neff, M.M.; Turk, E.; Kalishman, M. Web-based primer design for single nucleotide polymorphism analysis. TRENDS Genet. 2002, 18, 613–615. [Google Scholar] [CrossRef]
- Liu, K.; Muse, S.V. PowerMarker: An integrated analysis environment for genetic marker analysis. Bioinformatics 2005, 21, 2128–2129. [Google Scholar] [CrossRef] [PubMed] [Green Version]
- Pamilo, P.; Nei, M. Relationships between gene trees and species trees. Mol. Biol. Evol. 1988, 5, 568–583. [Google Scholar]
- Kumar, S.; Tamura, K.; Nei, M. MEGA: Molecular evolutionary genetics analysis software for microcomputers. Bioinformatics 1994, 10, 189–191. [Google Scholar] [CrossRef] [Green Version]
- Peakall, R.; Smouse, P.E. GENALEX 6: Genetic analysis in Excel. Population genetic software for teaching and research. Mol. Ecol. Notes 2006, 6, 288–295. [Google Scholar] [CrossRef]
- Evanno, G.; Regnaut, S.; Goudet, J. Detecting the number of clusters of individuals using the software STRUCTURE: A simulation study. Mol. Ecol. 2005, 14, 2611–2620. [Google Scholar] [CrossRef] [Green Version]
- Hubisz, M.J.; Falush, D.; Stephens, M.; Pritchard, J.K. Inferring weak population structure with the assistance of sample group information. Mol. Ecol. Resour. 2009, 9, 1322–1332. [Google Scholar] [CrossRef] [Green Version]
- Earl, D.A. STRUCTURE HARVESTER: A website and program for visualizing STRUCTURE output and implementing the Evanno method. Cons. Genet. Res. 2012, 4, 359–361. [Google Scholar] [CrossRef]
- Excoffier, L.; Smouse, P.E.; Quattro, J.M. Analysis of molecular variance inferred from metric distances among DNA haplotypes-application to human mitochondrial-DNA restriction data. Genetics 1992, 131, 479–491. [Google Scholar] [CrossRef]
- Kamvar, Z.N.; Tabima, J.F.; Grünwald, N.J. Poppr: An R package for genetic analysis of populations with clonal, partially clonal, and/or sexual reproduction. PeerJ 2014, 2, e281. [Google Scholar] [CrossRef] [Green Version]
- Singh, N.; Choudhury, D.R.; Singh, A.K.; Kumar, S.; Srinivasan, K.; Tyagi, R.; Singh, N.; Singh, R. Comparison of SSR and SNP markers in estimation of genetic diversity and population structure of Indian rice varieties. PLoS ONE 2013, 8, e84136. [Google Scholar] [CrossRef] [PubMed] [Green Version]
- Kimura, M. A simple method for estimating evolutionary rates of base substitutions through comparative studies of nucleotide sequences. J. Mol. Evol. 1980, 16, 111–120. [Google Scholar] [CrossRef]
- Ingvarsson, P.K. Natural selection on synonymous and nonsynonymous mutations shapes patterns of polymorphism in Populus tremula. Mol. Biol. Evol. 2009, 27, 650–660. [Google Scholar] [CrossRef] [Green Version]
- Wang, J.; Raskin, L.; Samuels, D.C.; Shyr, Y.; Guo, Y. Genome measures used for quality control are dependent on gene function and ancestry. Bioinformatics 2015, 31, 318–323. [Google Scholar] [CrossRef] [PubMed] [Green Version]
- Foster, P.L.; Lee, H.; Popodi, E.; Townes, J.P.; Tang, H. Determinants of spontaneous mutation in the bacterium Escherichia coli as revealed by whole-genome sequencing. Proc. Natl. Acad. Sci. USA 2015, 112, E5990–E5999. [Google Scholar] [CrossRef] [Green Version]
- Emanuelli, F.; Lorenzi, S.; Grzeskowiak, L.; Catalano, V.; Stefanini, M.; Troggio, M.; Myles, S.; Martinez-Zapater, J.M.; Zyprian, E.; Moreira, F.M. Genetic diversity and population structure assessed by SSR and SNP markers in a large germplasm collection of grape. BMC Plant Biol. 2013, 13, 39. [Google Scholar] [CrossRef] [PubMed] [Green Version]
- Van Inghelandt, D.; Melchinger, A.E.; Lebreton, C.; Stich, B. Population structure and genetic diversity in a commercial maize breeding program assessed with SSR and SNP markers. Theor. Appl. Genet. 2010, 120, 1289–1299. [Google Scholar] [CrossRef] [Green Version]
- Yang, X.; Xu, Y.; Shah, T.; Li, H.; Han, Z.; Li, J.; Yan, J. Comparison of SSRs and SNPs in assessment of genetic relatedness in maize. Genetica 2011, 139, 1045. [Google Scholar] [CrossRef]
- Tsykun, T.; Rellstab, C.; Dutech, C.; Sipos, G.; Prospero, S. Comparative assessment of SSR and SNP markers for inferring the population genetic structure of the common fungus Armillaria cepistipes. Heredity 2017, 119, 371–380. [Google Scholar] [CrossRef]
- Fu, Y.; Wang, X.; Li, D.; Liu, Y.; Song, B.; Zhang, C.; Wang, Q.; Chen, M.; Zhang, Z.; Li, Y. Identification of resistance to wet bubble disease and genetic diversity in wild and cultivated strains of Agaricus bisporus. Int. J. Mol. Sci. 2016, 17, 1568. [Google Scholar] [CrossRef] [Green Version]


| Strain Number | Geographic Region | Strain Number | Geographic Region |
|---|---|---|---|
| KMCC00540 | KOR | KMCC00832 | CHN |
| KMCC00542 | KOR | KMCC00839 | CHN |
| KMCC00544 | KOR | KMCC00850 | NLD |
| KMCC00556 | JPN | KMCC00851 | NLD |
| KMCC00569 | USA | KMCC00866 | KOR |
| KMCC00570 | USA | KMCC00867 | KOR |
| KMCC00575 | JPN | KMCC00876 | KOR |
| KMCC00620 | NLD | KMCC00877 | KOR |
| KMCC00631 | JPN | KMCC00879 | KOR |
| KMCC00633 | JPN | KMCC00881 | USA |
| KMCC00660 | DEU | KMCC00882 | KOR |
| KMCC00662 | DEU | KMCC00925 | KOR |
| KMCC00663 | DEU | KMCC00926 | CHN |
| KMCC00670 | DEU | KMCC00944 | USA |
| KMCC00677 | NLD | KMCC00945 | NLD |
| KMCC00693 | DEU | KMCC00947 | USA |
| KMCC00705 | JPN | KMCC00952 | NLD |
| KMCC00706 | JPN | KMCC00956 | USA |
| KMCC00728 | CHN | KMCC00997 | CHN |
| KMCC00746 | KOR | KMCC4744 | KOR |
| KMCC00751 | KOR |
| CAPS Marker | SNP Locus | Chr. | Substitution | Ref | Alt | Restriction Enzyme | Temp. (°C) | Left (L)/Right (R) Primer |
|---|---|---|---|---|---|---|---|---|
| AB-gCAPS-001 | HD1 homeodomain transcription factor A mating type protein | Chr01 | Transversion | C | A | Fnu4HI | 37 | L–TGTCAATGTCAATTCAGACTCC |
| R–TTTGAATATCGTGTTGCAGAGA | ||||||||
| AB-gCAPS-002 | HD1 homeodomain transcription factor A mating type protein | Chr01 | Transition | T | C | NdeI | 37 | L–CTCAATCGAGGACGAGTTATTC |
| R–GTTCGAGCTCAAAATCAAGTTC | ||||||||
| AB-gCAPS-003 | HD1 homeodomain transcription factor A mating type protein | Chr01 | Transversion | G | T | HpyCH4V | 37 | L–CTCAATCGAGGACGAGTTATTC |
| R–GTTCGAGCTCAAAATCAAGTTC | ||||||||
| AB-gCAPS-004 | PIF1 protein | Chr01 | Transition | A | G | BtsCI | 50 | L–ACTACAGTATCCACCAATTGCC |
| R–ATAGGGATTTAGTTGCCATGTG | ||||||||
| AB-gCAPS-005 | PIF1 protein | Chr01 | Transition | G | A | BsaBI | 60 | L–TGATTCTTCCAAAGTTTGAGGT |
| R–ATGGCCTCTTATACTGGTGTTG | ||||||||
| AB-gCAPS-006 | Transposon Tf2-11 polyprotein | Chr02 | Transversion | A | C | BtsCI | 50 | L–GAACCGTCTTGGTACTATTTGC |
| R–TAAGGCAGAACGTCTAGAGGAA | ||||||||
| AB-gCAPS-007 | Transposon Tf2-11 polyprotein | Chr02 | Transition | A | G | MseI | 37 | L–CCACACTCCTCGCATCTATATT |
| R–GTGGGTACAAAGACAAAGGAAA | ||||||||
| AB-gCAPS-008 | Oleate activated transcription factor 3, partial | Chr06 | Transition | T | C | TaqI-v2 | 65 | L–CTCAGCCATCTCTACCTCTCTC |
| R–ACATGTACAAGACCGTCAATCA | ||||||||
| AB-gCAPS-009 | ATP20 subunit G of the mitochondrial F1F0 ATP synthase | Chr07 | Transversion | G | C | Hpy99I | 37 | L–TTAGGTGTACAAAGACAATGCG |
| R–CTTCTCCAACTCTTTAACGCTC | ||||||||
| AB-gCAPS-012 | ATP20 subunit G of the mitochondrial F1F0 ATP synthase | Chr07 | Transversion | C | A | HpyCH4IV | 37 | L–CATCATCTGTTGTGGTCATCTC |
| R–AGTGAGGCAATAAAATGGAAGA | ||||||||
| AB-gCAPS-013 | ATP20 subunit G of the mitochondrial F1F0 ATP synthase | Chr07 | Transition | C | T | HaeIII | 37 | L–CATCATCTGTTGTGGTCATCTC |
| R–AGTGAGGCAATAAAATGGAAGA | ||||||||
| AB-gCAPS-015 | Polyphenol oxidase | Chr08 | Transition | G | A | TaqI-v2 | 65 | L–GACCGTCAATTCTCTCTTTACG |
| R–AATCAAAACATAAGGACGATGC | ||||||||
| AB-gCAPS-016 | Polyphenol oxidase | Chr08 | Transversion | A | C | MseI | 37 | L–AAGTCATCTCCCTACCCAAAGT |
| R–TCGACTTTTATCAGACCCATTT | ||||||||
| AB-gCAPS-017 | WC-1 blue light photoreceptor | Chr08 | Transition | G | A | BtsCI | 50 | L–GTTCTGGAAGTAAAGCGAAGAC |
| R–CGTAGAACACAAAGTCTTGCAG | ||||||||
| AB-gCAPS-018 | Serine/threonine-protein kinase ATG1 | Chr09 | Transition | A | G | HpyAV | 37 | L–GCAAGACTAGAGGGTGATGAAG |
| R–TATGTCCTTGTGGACGATACAA | ||||||||
| AB-gCAPS-019 | Serine/threonine-protein kinase ATG1 | Chr09 | Transversion | A | C | ApoI | 50 | L–CCTCCGATTGTTATCCATAGTC |
| R–GAGGTGTTAGATCCCAAAGCTA | ||||||||
| AB-gCAPS-020 | Serine/threonine-protein kinase Ppk19 | Chr09 | Transition | G | A | NcoI | 37 | L–ACCGTCTATCCCACAATGTTAG |
| R–GAATATGTTACCAGCATGGTCC | ||||||||
| AB-gCAPS-021 | Serine/threonine-protein kinase Ppk19 | Chr09 | Transversion | A | T | BtsCI | 50 | L–TAGCAGTCTCTATGCTGGACAA |
| R–CCGGATACAGGAAGAACACTTA | ||||||||
| AB-gCAPS-022 | Cytochrome P450 | Chr12 | Transversion | T | A | HinfI | 37 | L–CATCGAAGCTGATGAGTACAAC |
| R–CGAATAGAACTGTCGAGTTTCC | ||||||||
| AB-gCAPS-024 | Transposon Tf2-11 polyprotein | Chr12 | Transversion | T | G | BccI | 37 | L–GTCTCCATTCTTCTAAACACCG |
| R–AGCACCAGAACTGGATAAAGAA | ||||||||
| AB-gCAPS-025 | Retrovirus-related Pol polyprotein | Chr13 | Transition | G | A | Hpy99I | 37 | L–CAAGTATCAAATGGAACTGCCT |
| R–AGATATACACACCGAAGGATGG | ||||||||
| AB-gCAPS-026 | Retrovirus-related Pol polyprotein | Chr13 | Transition | C | T | DpnI | 37 | L–CAAATCTGCCTTCGTATTCATT |
| R–ATCATCAATCACGTCGAACATA | ||||||||
| AB-gCAPS-028 | hypothetical protein AGABI2DRAFT_123095 | Chr02 | Transition | T | C | HpyCH4V | 37 | L–GTTTATCAAGTTCATCAAGCCC |
| R–TCTGGGTGCTTCTGTATTCTTT | ||||||||
| AB-gCAPS-030 | hypothetical protein AGABI2DRAFT_196053 | Chr02 | Transition | C | T | RsaI | 37 | L–GAACCAATTCACAGTGGTTTCT |
| R–TACTTTATGGAGCCGTCAGAAT | ||||||||
| AB-gCAPS-031 | hypothetical protein AGABI2DRAFT_146035 | Chr02 | Transition | C | T | Hpy99I | 37 | L–AACGTCACTCTTACTCATGCAA |
| R–TACATGAATGCCTCATGTTGTT | ||||||||
| AB-gCAPS-032 | hypothetical protein AGABI2DRAFT_146035 | Chr02 | Transversion | T | G | MnlI | 37 | L–ATTACTGGGATGATGACTCTCG |
| R–AGGAGGGGTAGGGACTCTG | ||||||||
| AB-gCAPS-033 | hypothetical protein AGABI2DRAFT_193507 | Chr03 | Transversion | C | A | BsmI | 65 | L–ATGTTGACATGTTGGACAGAAA |
| R–ATGGTGCCGTTGTAGTCTTACT | ||||||||
| AB-gCAPS-034 | hypothetical protein AGABI2DRAFT_193507 | Chr03 | Transition | A | G | Hpy166II | 37 | L–AGGGACGCTTAAAATTACCTGT |
| R–GTCTCCAAACTCGTCAGTTCTC | ||||||||
| AB-gCAPS-035 | hypothetical protein AGABI2DRAFT_193507 | Chr03 | Transversion | C | G | MspI | 37 | L–GCCATATGTCACCTCAGAAAAT |
| R–TTCTTTTTCTCAGGATGTTGCT | ||||||||
| AB-gCAPS-036 | hypothetical protein AGABI1DRAFT_131635 | Chr03 | Transition | G | A | PvuI | 37 | L–CAATGGTGATCTAAGCACTCAA |
| R–AGGGAGACGAAGACAAAACATA | ||||||||
| AB-gCAPS-037 | hypothetical protein AGABI2DRAFT_176555 | Chr03 | Transition | C | T | HaeIII | 37 | L–GTGCTTATCCTCGAATGTCTTC |
| R–GAATCGTCGGGATATAATGTTG | ||||||||
| AB-gCAPS-038 | hypothetical protein AGABI2DRAFT_141360 | Chr03 | Transition | G | A | Hpy188I | 37 | L–GTCACAGCAGCAAAGAAATACA |
| R–GGTGAGATTAGACAGAGGTTCG | ||||||||
| AB-gCAPS-039 | hypothetical protein AGABI2DRAFT_200532 | Chr03 | Transversion | T | A | BtsCI | 50 | L–TGAGGATAGCGAAAGAAGAGAG |
| R–TAGCCTTCGATTTAAGTTCAGC | ||||||||
| AB-gCAPS-041 | hypothetical protein AGABI2DRAFT_71082 | Chr03 | Transition | C | T | HaeIII | 37 | L–TATCTTGGTATTTACGATGGCG |
| R–TGTACTCAGCAGTCTTGTGCTC | ||||||||
| AB-gCAPS-042 | hypothetical protein AGABI2DRAFT_71082 | Chr03 | Transition | T | C | NlaIV | 37 | L–ATAACAATGGCCATCAAACTCT |
| R–CGGCTCTCGTATAGAATGAATC | ||||||||
| AB-gCAPS-043 | hypothetical protein AGABI2DRAFT_71082 | Chr03 | Transition | A | G | BsrDI | 65 | L–GATGCCACTTTAGACTTTTTGG |
| R–TATGGTAAATGGAAAAGATCCG | ||||||||
| AB-gCAPS-045 | hypothetical protein AGABI2DRAFT_121386 | Chr04 | Transition | A | G | HpyCH4V | 37 | L–AACAGACTGACCTCACAAAACC |
| R–CGTCGTTATCTTTCCATTTGAT | ||||||||
| AB-gCAPS-047 | hypothetical protein AGABI1DRAFT_90407 | Chr04 | Transition | G | A | HpyCH4V | 37 | L–CTCTTAGCGAGGCGTTATCTTA |
| R–ATTGGAACATAATTCATTGGGA | ||||||||
| AB-gCAPS-048 | hypothetical protein AGABI2DRAFT_117363 | Chr04 | Transition | G | A | Hpy188I | 37 | L–TTCCTTAAGCCAGTTTTGAAGA |
| R–GAGGATTGGACTAATACCGTGA | ||||||||
| AB-gCAPS-050 | hypothetical protein AGABI2DRAFT_178864 | Chr06 | Transition | A | G | HphI | 37 | L–CACTACTTCCCCTCCTCTCTTT |
| R–ACTACCAAAAGAGGCATCTCAA | ||||||||
| AB-gCAPS-051 | hypothetical protein AGABI2DRAFT_119143 | Chr06 | Transition | G | A | HaeIII | 37 | L–AGTTAGCTATTGCCTGAGCTTG |
| R–GTCACAAGCCATCTCAATCTTT | ||||||||
| AB-gCAPS-052 | hypothetical protein AGABI2DRAFT_119143 | Chr06 | Transition | T | C | HpyCH4III | 37 | L–GGTTTTCTAGTGCCGTAGTGAG |
| R–TTCTCAATGACCCTTTGAACTT | ||||||||
| AB-gCAPS-053 | hypothetical protein AGABI2DRAFT_119143 | Chr06 | Transversion | A | T | MluCI | 37 | L–TCAGTAAACTCCCTACGCTCAT |
| R–GCCTAGCCGTAAGTTCACATAA | ||||||||
| AB-gCAPS-054 | hypothetical protein AGABI1DRAFT_126593 | Chr06 | Transition | A | G | SfaNI | 37 | L–CAACAATGTCTCCTTGAGTCCT |
| R–TTTCAGTTTGCATTCTCTGATG | ||||||||
| AB-gCAPS-055 | hypothetical protein AGABI1DRAFT_126593 | Chr06 | Transversion | A | T | ApoI | 50 | L–GATCCCCAAATAATGAATGCTA |
| R–TATACTCCCGACGTAGAACAGC | ||||||||
| AB-gCAPS-056 | hypothetical protein AGABI1DRAFT_126595 | Chr06 | Transversion | T | G | BtsCI | 50 | L–GATGGTCACGATTTGTTTCTTT |
| R–AACAAACCTCATTATTTCTGCC | ||||||||
| AB-gCAPS-058 | hypothetical protein AGABI2DRAFT_179115, partial | Chr06 | Transversion | C | G | RsaI | 37 | L–GTTTCTGGAGGGAGTATACGTG |
| R–ATCACATGTCAAGTTGTGGAGA | ||||||||
| AB-gCAPS-059 | hypothetical protein AGABI2DRAFT_225478 | Chr10 | Transition | C | T | Tsp45I | 65 | L–CAGTGGTACGACGTTCAAAATA |
| R–ACACCAATTATGGTCTCGATTC | ||||||||
| AB-gCAPS-061 | hypothetical protein AGABI1DRAFT_133092, partial | Chr10 | Transition | G | A | HphI | 37 | L–ACAAAACGAGAAGAGCAGAGAG |
| R–CTAATACGATTTACGATGGCGT | ||||||||
| AB-gCAPS-062 | hypothetical protein AGABI1DRAFT_133088 | Chr10 | Transition | G | A | BssSI | 37 | L–CTCGAGATAGCAGAGGAGCAT |
| R–TACAACGCATCGTACTCAAAAC | ||||||||
| AB-gCAPS-063 | hypothetical protein AGABI1DRAFT_133088 | Chr10 | Transversion | G | T | BssSI | 37 | L–AGCTTTTGCACGAGATGAATAC |
| R–AGGAAGGTTGAGAAAGGGATAG | ||||||||
| AB-gCAPS-064 | hypothetical protein AGABI2DRAFT_194394 | Chr10 | Transversion | C | G | BstAPI | 60 | L–GTCTCTTCATCGAAACCATCTC |
| R–TTTGGCATCATTCATTACTTCA | ||||||||
| AB-gCAPS-065 | hypothetical protein AGABI2DRAFT_179918 | Chr10 | Transition | C | T | BstNI | 60 | L–CCTTATTCTTGTGATTGAAGGC |
| R–GACATTTGGTGCAGGAGTAGAT | ||||||||
| AB-gCAPS-066 | hypothetical protein AGABI2DRAFT_74687 | Chr10 | Transversion | G | C | XcmI | 37 | L–AAGTCCGCAATTGACCTACTAA |
| R–AGTGTGCAAAATTGAGGAGAGT | ||||||||
| AB-gCAPS-068 | hypothetical protein AGABI2DRAFT_74687 | Chr10 | Transversion | G | C | HpyCH4III | 37 | L–GACGTCCAAAATCTTGAGTGAT |
| R–GACGTTGGTCTCAGCTTACTTC | ||||||||
| AB-gCAPS-070 | hypothetical protein AGABI1DRAFT_48245, partial | Chr10 | Transition | T | C | MluCI | 37 | L–CTTCGGAAATATGTCTTCAAGG |
| R–GCGAGGTATCAGAGGAATGTAG | ||||||||
| AB-gCAPS-071 | hypothetical protein AGABI1DRAFT_48245, partial | Chr10 | Transition | A | G | Hpy188I | 37 | L–AACCTCATTCCCAACCTTATCT |
| R–AATATATTGGTCATTGGAACCG | ||||||||
| AB-gCAPS-072 | hypothetical protein AGABI1DRAFT_48245, partial | Chr10 | Transition | G | A | BstNI | 60 | L–TTGTAGCTTATGACATGGTTCG |
| R–GGAATTATTTTGACGGTTTGAA | ||||||||
| AB-gCAPS-073 | Uncharacterized protein Hypma_04748, partial | Chr10 | Transition | C | T | TaqI | 65 | L–TATTGATCTCAGCCAACCTTTT |
| R–TCCTCACTTTTAGGAGGATCAA | ||||||||
| AB-gCAPS-078 | hypothetical protein AGABI2DRAFT_195493 | Chr11 | Transition | C | T | Hpy166II | 37 | L–CTAGGATCATATGCGATTTTGC |
| R–ATAGAACTCAACGCCGACAG | ||||||||
| AB-gCAPS-081 | hypothetical protein AGABI2DRAFT_68830 | Chr11 | Transition | T | C | BsmI | 65 | L–ATTTTTCAGGTCACGTTCTCAC |
| R–TAGATGGTTAAACGTGTGGGAT | ||||||||
| AB-gCAPS-082 | hypothetical protein AGABI2DRAFT_68830 | Chr11 | Transition | A | G | HinfI | 37 | L–GTAAAAACAGTTTCCGAAGCAC |
| R–TATTTCTCAACAGGAGTGACCC | ||||||||
| AB-gCAPS-083 | hypothetical protein AGABI2DRAFT_196017, partial | Chr11 | Transition | C | T | MnlI | 37 | L–GATCTATACTTCGGCGATTGAG |
| R–ACTATAGAGAGTGCCACCAGGA | ||||||||
| AB-gCAPS-084 | hypothetical protein AGABI2DRAFT_229511 | Chr11 | Transition | G | A | BtsI | 55 | L–TGGAATTAATAAGGCATTTTGG |
| R–ATCGACCTCTGATATTCACGAT | ||||||||
| AB-gCAPS-086 | hypothetical protein AGABI2DRAFT_79146 | Chr11 | Transversion | T | A | HphI | 37 | L–CCCAATTCCTATCATGCTTATC |
| R–ATACTGACCATCGCCACTATGT | ||||||||
| AB-gCAPS-087 | hypothetical protein AGABI1DRAFT_77545 | Chr11 | Transition | T | C | SfaNI | 37 | L–TGCAATCGCTTTGTAAGTATCA |
| R–ATCCCTATACCCATCGCTAGTT | ||||||||
| AB-gCAPS-088 | hypothetical protein AGABI1DRAFT_77545 | Chr11 | Transversion | G | T | BbsI | 37 | L–AATCATTCGACCAATGCTAATC |
| R–ACCATCCTGACCACTCTATTTG | ||||||||
| AB-gCAPS-089 | hypothetical protein AGABI1DRAFT_77545 | Chr11 | Transversion | C | A | BstBI | 65 | L–TCGTACCATAGAACCCTTGACT |
| R–TTGGCTTCTACAACCCTTACAT | ||||||||
| AB-gCAPS-090 | hypothetical protein AGABI1DRAFT_77545 | Chr11 | Transversion | C | G | HpyAV | 37 | L–AGAAAGGTGAAGACTCACGGTA |
| R–GGGTTGTTGTTTTCAGCTTATC | ||||||||
| AB-gCAPS-093 | hypothetical protein AGABI2DRAFT_188752 | Chr11 | Transition | T | C | Hpy188I | 37 | L–AATCCTAGAATCACTTCAGCCA |
| R–CACCTCATTCCGAATTATTCAT |
| Marker | MAF 1 | NG 2 | NA 3 | GD 4 | He 5 |
|---|---|---|---|---|---|
| AB-gCAPS-001 | 0.564 | 3 | 2 | 0.492 | 0.256 |
| AB-gCAPS-002 | 0.609 | 3 | 2 | 0.476 | 0.696 |
| AB-gCAPS-003 | 0.587 | 2 | 2 | 0.485 | 0.826 |
| AB-gCAPS-004 | 1.000 | 1 | 1 | 0.000 | 0.000 |
| AB-gCAPS-005 | 0.750 | 3 | 2 | 0.375 | 0.250 |
| AB-gCAPS-006 | 1.000 | 1 | 1 | 0.000 | 0.000 |
| AB-gCAPS-007 | 1.000 | 1 | 1 | 0.000 | 0.000 |
| AB-gCAPS-008 | 0.694 | 2 | 2 | 0.425 | 0.613 |
| AB-gCAPS-009 | 0.975 | 2 | 2 | 0.049 | 0.000 |
| AB-gCAPS-012 | 0.700 | 2 | 2 | 0.420 | 0.000 |
| AB-gCAPS-013 | 0.724 | 3 | 2 | 0.400 | 0.079 |
| AB-gCAPS-015 | 0.720 | 3 | 2 | 0.404 | 0.463 |
| AB-gCAPS-016 | 0.744 | 2 | 2 | 0.381 | 0.513 |
| AB-gCAPS-017 | 0.738 | 2 | 2 | 0.387 | 0.525 |
| AB-gCAPS-018 | 0.750 | 2 | 2 | 0.375 | 0.500 |
| AB-gCAPS-019 | 0.732 | 3 | 2 | 0.393 | 0.341 |
| AB-gCAPS-020 | 0.659 | 3 | 2 | 0.450 | 0.390 |
| AB-gCAPS-021 | 0.756 | 2 | 2 | 0.369 | 0.488 |
| AB-gCAPS-022 | 0.793 | 3 | 2 | 0.329 | 0.317 |
| AB-gCAPS-024 | 0.683 | 2 | 2 | 0.433 | 0.634 |
| AB-gCAPS-025 | 0.765 | 2 | 2 | 0.360 | 0.000 |
| AB-gCAPS-026 | 0.770 | 2 | 2 | 0.354 | 0.459 |
| AB-gCAPS-028 | 0.650 | 2 | 2 | 0.455 | 0.700 |
| AB-gCAPS-030 | 0.610 | 2 | 2 | 0.476 | 0.000 |
| AB-gCAPS-031 | 0.951 | 2 | 2 | 0.093 | 0.098 |
| AB-gCAPS-032 | 1.000 | 1 | 1 | 0.000 | 0.000 |
| AB-gCAPS-033 | 0.586 | 3 | 2 | 0.485 | 0.371 |
| AB-gCAPS-034 | 0.561 | 3 | 2 | 0.493 | 0.146 |
| AB-gCAPS-035 | 0.598 | 3 | 2 | 0.481 | 0.756 |
| AB-gCAPS-036 | 0.500 | 3 | 2 | 0.500 | 0.294 |
| AB-gCAPS-037 | 1.000 | 1 | 1 | 0.000 | 0.000 |
| AB-gCAPS-038 | 0.817 | 2 | 2 | 0.299 | 0.366 |
| AB-gCAPS-039 | 0.549 | 3 | 2 | 0.495 | 0.512 |
| AB-gCAPS-041 | 0.537 | 3 | 2 | 0.497 | 0.585 |
| AB-gCAPS-042 | 0.625 | 3 | 2 | 0.469 | 0.500 |
| AB-gCAPS-043 | 0.662 | 3 | 2 | 0.448 | 0.618 |
| AB-gCAPS-045 | 0.793 | 3 | 2 | 0.329 | 0.366 |
| AB-gCAPS-047 | 0.855 | 2 | 2 | 0.248 | 0.289 |
| AB-gCAPS-048 | 0.694 | 3 | 2 | 0.425 | 0.226 |
| AB-gCAPS-050 | 0.750 | 3 | 2 | 0.375 | 0.289 |
| AB-gCAPS-051 | 0.634 | 3 | 2 | 0.464 | 0.244 |
| AB-gCAPS-052 | 0.615 | 3 | 2 | 0.473 | 0.205 |
| AB-gCAPS-053 | 0.577 | 3 | 2 | 0.488 | 0.692 |
| AB-gCAPS-054 | 0.973 | 2 | 2 | 0.053 | 0.000 |
| AB-gCAPS-055 | 0.625 | 2 | 2 | 0.469 | 0.750 |
| AB-gCAPS-056 | 0.771 | 3 | 2 | 0.353 | 0.057 |
| AB-gCAPS-058 | 0.577 | 3 | 2 | 0.488 | 0.128 |
| AB-gCAPS-059 | 0.524 | 3 | 2 | 0.499 | 0.610 |
| AB-gCAPS-061 | 0.608 | 3 | 2 | 0.477 | 0.135 |
| AB-gCAPS-062 | 0.671 | 3 | 2 | 0.442 | 0.171 |
| AB-gCAPS-063 | 0.768 | 2 | 2 | 0.356 | 0.463 |
| AB-gCAPS-064 | 0.775 | 2 | 2 | 0.349 | 0.450 |
| AB-gCAPS-065 | 0.713 | 3 | 2 | 0.410 | 0.125 |
| AB-gCAPS-066 | 0.632 | 2 | 2 | 0.465 | 0.000 |
| AB-gCAPS-068 | 0.775 | 3 | 2 | 0.349 | 0.350 |
| AB-gCAPS-070 | 0.585 | 2 | 2 | 0.485 | 0.000 |
| AB-gCAPS-071 | 0.615 | 2 | 2 | 0.473 | 0.000 |
| AB-gCAPS-072 | 0.600 | 2 | 2 | 0.480 | 0.000 |
| AB-gCAPS-073 | 0.848 | 2 | 2 | 0.257 | 0.000 |
| AB-gCAPS-078 | 0.634 | 3 | 2 | 0.464 | 0.098 |
| AB-gCAPS-081 | 0.613 | 3 | 2 | 0.475 | 0.025 |
| AB-gCAPS-082 | 0.667 | 2 | 2 | 0.444 | 0.000 |
| AB-gCAPS-083 | 0.526 | 3 | 2 | 0.499 | 0.231 |
| AB-gCAPS-084 | 1.000 | 1 | 1 | 0.000 | 0.000 |
| AB-gCAPS-086 | 0.675 | 2 | 2 | 0.439 | 0.000 |
| AB-gCAPS-087 | 0.671 | 3 | 2 | 0.442 | 0.073 |
| AB-gCAPS-088 | 0.878 | 3 | 2 | 0.214 | 0.049 |
| AB-gCAPS-089 | 0.850 | 3 | 2 | 0.255 | 0.100 |
| AB-gCAPS-090 | 0.902 | 3 | 2 | 0.176 | 0.098 |
| AB-gCAPS-093 | 0.984 | 2 | 2 | 0.031 | 0.031 |
| Mean | 0.7248 | 2.4 | 1.9 | 0.3599 | 0.2650 |
| Distance-Based Group | ||||||
|---|---|---|---|---|---|---|
| Source | df | SS | MS | Est. Var. | Percentage | FST |
| Among Pops | 2 | 147.844 | 73.922 | 2.062 | 13% | 0.134 |
| Among Indiv | 38 | 691.058 | 18.186 | 4.849 | 31% | |
| Within Indiv | 41 | 348.000 | 8.488 | 8.488 | 55% | |
| Total | 81 | 1186.902 | 15.399 | 100% | ||
| Model-Based Population | ||||||
| Source | df | SS | MS | Est. Var. | Percentage | FST |
| Among Pops | 2 | 163.971 | 81.985 | 2.377 | 15% | 0.153 |
| Among Indiv | 38 | 674.932 | 17.761 | 4.637 | 30% | |
| Within Indiv | 41 | 348.000 | 8.488 | 8.488 | 55% | |
| Total | 81 | 1186.902 | 15.501 | 100% | ||
Publisher’s Note: MDPI stays neutral with regard to jurisdictional claims in published maps and institutional affiliations. |
© 2021 by the authors. Licensee MDPI, Basel, Switzerland. This article is an open access article distributed under the terms and conditions of the Creative Commons Attribution (CC BY) license (https://creativecommons.org/licenses/by/4.0/).
Share and Cite
An, H.; Lee, H.-Y.; Shim, D.; Choi, S.H.; Cho, H.; Hyun, T.K.; Jo, I.-H.; Chung, J.-W. Development of CAPS Markers for Evaluation of Genetic Diversity and Population Structure in the Germplasm of Button Mushroom (Agaricus bisporus). J. Fungi 2021, 7, 375. https://0-doi-org.brum.beds.ac.uk/10.3390/jof7050375
An H, Lee H-Y, Shim D, Choi SH, Cho H, Hyun TK, Jo I-H, Chung J-W. Development of CAPS Markers for Evaluation of Genetic Diversity and Population Structure in the Germplasm of Button Mushroom (Agaricus bisporus). Journal of Fungi. 2021; 7(5):375. https://0-doi-org.brum.beds.ac.uk/10.3390/jof7050375
Chicago/Turabian StyleAn, Hyejin, Hwa-Yong Lee, Donghwan Shim, Seong Ho Choi, Hyunwoo Cho, Tae Kyung Hyun, Ick-Hyun Jo, and Jong-Wook Chung. 2021. "Development of CAPS Markers for Evaluation of Genetic Diversity and Population Structure in the Germplasm of Button Mushroom (Agaricus bisporus)" Journal of Fungi 7, no. 5: 375. https://0-doi-org.brum.beds.ac.uk/10.3390/jof7050375