
Ustilago maydis Metabolic Characterization and Growth Quantification with a Genome-Scale Metabolic Model

 ,
,  , , ,
, , ,
Abstract
:1. Introduction
2. Materials and Methods
2.1. Draft GSMM from Pathway Tools
2.2. Strains Sequenced, Pangenome, KEGG Pathway Enrichment
2.3. Biomass Equation and Growth/Non-Growth Maintenance
2.4. Substrate and Growth Experiments
3. Results and Discussion
3.1. Description of iUma22
3.2. Carbon Substrate Tests with BIOLOG Phenotype Arrays
3.3. Growth Rate Correlation
3.4. U. maydis Pangenome Comparison
4. Conclusions
Supplementary Materials
Author Contributions
Funding
Institutional Review Board Statement
Informed Consent Statement
Data Availability Statement
Acknowledgments
Conflicts of Interest
References
- de León, V.C.; Martínez-Carrera, D.; Morales, P.; Sobal, M.; Gil-Muñoz, A.; Severiano-Pérez, P.; Leal-Lara, H. Productivity and flavor of diverse genotypes of Ustilago maydis “cuitlacoche” for human consumption. Fungal Biol. 2019, 123, 481–488. [Google Scholar] [CrossRef] [PubMed]
- Tehrani, H.H.; Becker, J.; Bator, I.; Saur, K.; Meyer, S.; Lóia, A.C.R.; Blank, L.M.; Wierckx, N. Integrated strain- and process design enable production of 220 g L-1 itaconic acid with Ustilago maydis. Biotechnol. Biofuels 2019, 12, 263. [Google Scholar] [CrossRef] [PubMed]
- Becker, J.; Tehrani, H.H.; Gauert, M.; Mampel, J.; Blank, L.M.; Wierckx, N. An Ustilago maydis chassis for itaconic acid production without by-products. Microb. Biotechnol. 2020, 13, 350–362. [Google Scholar] [CrossRef] [PubMed] [Green Version]
- Becker, J.; Tehrani, H.H.; Ernst, P.; Blank, L.M.; Wierckx, N. An Optimized Ustilago maydis for Itaconic Acid Production at Maximal Theoretical Yield. J. Fungi 2020, 7, 20. [Google Scholar] [CrossRef]
- Wege, S.-M.; Gejer, K.; Becker, F.; Bölker, M.; Freitag, J.; Sandrock, B. Versatile CRISPR/Cas9 Systems for Genome Editing in Ustilago maydis. J. Fungi 2021, 7, 149. [Google Scholar] [CrossRef]
- Kämper, J.; Kahmann, R.; Bölker, M.; Ma, L.-J.; Brefort, T.; Saville, B.J.; Banuett, F.; Kronstad, J.W.; Gold, S.E.; Müller, O.; et al. Insights from the genome of the biotrophic fungal plant pathogen Ustilago maydis. Nature 2006, 444, 97–101. [Google Scholar] [CrossRef]
- Fang, X.; Lloyd, C.J.; Palsson, B.O. Reconstructing organisms in silico: Genome-scale models and their emerging applications. Nat. Rev. Microbiol. 2020, 18, 731–743. [Google Scholar] [CrossRef]
- Liebal, U.W.; Blank, L.M.; Ebert, B.E. CO2 to succinic acid–Estimating the potential of biocatalytic routes. Metab. Eng. Commun. 2018, 7, e00075. [Google Scholar] [CrossRef]
- Chan, S.H.J.; Simons, M.N.; Maranas, C.D. SteadyCom: Predicting microbial abundances while ensuring community stability. PLoS Comput. Biol. 2017, 13, e1005539. [Google Scholar] [CrossRef] [Green Version]
- Ravikrishnan, A.; Blank, L.M.; Srivastava, S.; Raman, K. Investigating metabolic interactions in a microbial co-culture through integrated modelling and experiments. Comput. Struct. Biotechnol. J. 2020, 18, 1249–1258. [Google Scholar] [CrossRef]
- Sambamoorthy, G.; Raman, K. Deciphering the evolution of microbial interactions: In silico studies of two-member microbial communities. bioRxiv 2022, 14, 476316. [Google Scholar] [CrossRef]
- Tatusova, T.; Ciufo, S.; Fedorov, B.; O’Neill, K.; Tolstoy, I. RefSeq microbial genomes database: New representation and annotation strategy. Nucleic Acids Res. 2014, 42, D553–D559. [Google Scholar] [CrossRef] [PubMed] [Green Version]
- Frishman, D.; Albermann, K.; Hani, J.; Heumann, K.; Metanomski, A.; Zollner, A.; Mewes, H.-W. Functional and structural genomics using PEDANT. Bioinformatics 2001, 17, 44–57. [Google Scholar] [CrossRef] [Green Version]
- Karp, P.D.; Latendresse, M.; Caspi, R. The Pathway Tools Pathway Prediction Algorithm. Stand. Genom. Sci. 2011, 5, 424–429. [Google Scholar] [CrossRef] [Green Version]
- Caspi, R.; Altman, T.; Billington, R.; Dreher, K.; Foerster, H.; Fulcher, C.A.; Holland, T.A.; Keseler, I.M.; Kothari, A.; Kubo, A.; et al. The MetaCyc database of metabolic pathways and enzymes and the BioCyc collection of Pathway/Genome Databases. Nucleic Acids Res. 2014, 42, D459–D471. [Google Scholar] [CrossRef] [PubMed] [Green Version]
- Kanehisa, M.; Goto, S.; Kawashima, S.; Okuno, Y.; Hattori, M. The KEGG resource for deciphering the genome. Nucleic Acids Res. 2004, 32, D277–D280. [Google Scholar] [CrossRef] [Green Version]
- Yates, A.D.; Allen, J.; Amode, R.M.; Azov, A.G.; Barba, M.; Becerra, A.; Bhai, J.; Campbell, L.I.; Martinez, M.C.; Chakiachvili, M.; et al. Ensembl Genomes 2022: An expanding genome resource for non-vertebrates. Nucleic Acids Res. 2022, 50, D996–D1003. [Google Scholar] [CrossRef]
- Ullmann, L.; Wibberg, D.; Busche, T.; Rückert, C.; Müsgens, A.; Kalinowski, J.; Blank, L.M. Seventeen Ustilaginaceae High-Quality Genome Sequences Allow Phylogenomic Analysis and Provide Insights into Secondary Metabolite Synthesis. J. Fungi 2022, 8, 269. [Google Scholar] [CrossRef]
- Wibberg, D.; Andersson, L.; Tzelepis, G.; Rupp, O.; Blom, J.; Jelonek, L.; Pühler, A.; Fogelqvist, J.; Varrelmann, M.; Schlüter, A.; et al. Genome analysis of the sugar beet pathogen Rhizoctonia solani AG2-2IIIB revealed high numbers in secreted proteins and cell wall degrading enzymes. BMC Genom. 2016, 17, 245. [Google Scholar] [CrossRef] [Green Version]
- Koren, S.; Walenz, B.P.; Berlin, K.; Miller, J.R.; Bergman, N.H.; Phillippy, A.M. Canu: Scalable and accurate long-read assembly via adaptive k-mer weighting and repeat separation. Genome Res. 2017, 27, 722–736. [Google Scholar] [CrossRef] [Green Version]
- Walker, B.J.; Abeel, T.; Shea, T.; Priest, M.; Abouelliel, A.; Sakthikumar, S.; Cuomo, C.A.; Zeng, Q.; Wortman, J.; Young, S.K.; et al. Pilon: An Integrated Tool for Comprehensive Microbial Variant Detection and Genome Assembly Improvement. PLoS ONE 2014, 9, e112963. [Google Scholar] [CrossRef] [PubMed]
- Li, H. Aligning sequence reads, clone sequences and assembly contigs with BWA-MEM. arXiv 2013, arXiv:1303.3997. [Google Scholar]
- Langmead, B.; Salzberg, S.L. Fast gapped-read alignment with Bowtie 2. Nat. Methods 2012, 9, 357–359. [Google Scholar] [CrossRef] [PubMed] [Green Version]
- Ter-Hovhannisyan, V.; Lomsadze, A.; Chernoff, Y.O.; Borodovsky, M. Gene prediction in novel fungal genomes using an ab initio algorithm with unsupervised training. Genome Res. 2008, 18, 1979–1990. [Google Scholar] [CrossRef] [PubMed] [Green Version]
- Meyer, F.; Goesmann, A.; McHardy, A.C.; Bartels, D.; Bekel, T.; Clausen, J.; Kalinowski, J.; Linke, B.; Rupp, O.; Giegerich, R.; et al. GenDB—An open source genome annotation system for prokaryote genomes. Nucleic Acids Res. 2003, 31, 2187–2195. [Google Scholar] [CrossRef] [Green Version]
- Takahara, T.; Minamoto, T.; Yamanaka, H.; Doi, H.; Kawabata, Z. Estimation of Fish Biomass Using Environmental DNA. PLoS ONE 2012, 7, e35868. [Google Scholar] [CrossRef] [Green Version]
- Tatusov, R.L.; Fedorova, N.D.; Jackson, J.D.; Jacobs, A.R.; Kiryutin, B.; Koonin, E.V.; Krylov, D.M.; Mazumder, R.; Smirnov, S.; Nikolskaya, A.N.; et al. The COG database: An updated vesion includes eukaryotes. BMC Bioinform. 2003, 4, 41. [Google Scholar] [CrossRef] [Green Version]
- Boeckmann, B.; Bairoch, A.; Apweiler, R.; Blatter, M.-C.; Estreicher, A.; Gasteiger, E.; Martin, M.J.; Michoud, K.; O’Donovan, C.; Phan, I.; et al. The SWISS-PROT protein knowledgebase and its supplement TrEMBL in 2003. Nucleic Acids Res. 2003, 31, 365–370. [Google Scholar] [CrossRef]
- Lowe, T.M.; Eddy, S.R. tRNAscan-SE: A Program for Improved Detection of Transfer RNA Genes in Genomic Sequence. Nucleic Acids Res. 1997, 25, 955–964. [Google Scholar] [CrossRef]
- Simão, F.A.; Waterhouse, R.M.; Ioannidis, P.; Kriventseva, E.V.; Zdobnov, E.M. BUSCO: Assessing genome assembly and annotation completeness with single-copy orthologs. Bioinformatics 2015, 31, 3210–3212. [Google Scholar] [CrossRef] [Green Version]
- Dieckmann, M.A.; Beyvers, S.; Nkouamedjo-Fankep, R.C.; Hanel, P.H.G.; Jelonek, L.; Blom, J.; Goesmann, A. EDGAR3.0: Comparative genomics and phylogenomics on a scalable infrastructure. Nucleic Acids Res. 2021, 49, W185–W192. [Google Scholar] [CrossRef] [PubMed]
- Moriya, Y.; Itoh, M.; Okuda, S.; Yoshizawa, A.C.; Kanehisa, M. KAAS: An automatic genome annotation and pathway reconstruction server. Nucleic Acids Res. 2007, 35, W182–W185. [Google Scholar] [CrossRef] [PubMed] [Green Version]
- Cokelaer, T.; Pultz, D.; Harder, L.M.; Serra-Musach, J.; Saez-Rodriguez, J.; Valencia, A. BioServices: A common Python package to access biological Web Services programmatically. Bioinformatics 2013, 29, 3241–3242. [Google Scholar] [CrossRef] [PubMed] [Green Version]
- Hernández, A.; Cooke, D.T.; Lewis, M.; Clarkson, D.T. Fungicides and sterol-deficient mutants of Ustilago maydis: Plasma membrane physico-chemical characteristics do not explain growth inhibition. Microbiology 1997, 143, 3165–3174. [Google Scholar] [CrossRef] [Green Version]
- Ruiz-Herrera, J.; Leon, C.G.; Carabez-Trejo, A.; Reyes-Salinas, E. Structure and chemical composition of the cell walls from the haploid yeast and mycelial forms of Ustilago maydis. Fungal Genet. Biol. 1996, 20, 133–142. [Google Scholar] [CrossRef]
- Klement, T.; Milker, S.; Jäger, G.; Grande, P.M.; de María, P.D.; Büchs, J. Biomass pretreatment affects Ustilago maydis in producing itaconic acid. Microb. Cell Fact. 2012, 11, 43. [Google Scholar] [CrossRef] [Green Version]
- Bushell, M.E. Fungal physiology (2nd Edition). By David H. Griffin, J. Wiley & Sons, Inc., New York, 1994, x + 458 pp., price £66.00, US$92.50. ISBN 0 471 59586 1. J. Chem. Technol. Biotechnol. 1995, 64, 105. [Google Scholar] [CrossRef]
- Thiele, I.; Palsson, B.O. A protocol for generating a high-quality genome-scale metabolic reconstruction. Nat. Protoc. 2010, 5, 93–121. [Google Scholar] [CrossRef] [Green Version]
- Geiser, E.; Przybilla, S.K.; Engel, M.; Kleineberg, W.; Büttner, L.; Sarikaya, E.; den Hartog, T.; Klankermayer, J.; Leitner, W.; Bölker, M.; et al. Genetic and biochemical insights into the itaconate pathway of Ustilago maydis enable enhanced production. Metab. Eng. 2016, 38, 427–435. [Google Scholar] [CrossRef]
- Milo, R.; Jorgensen, P.; Moran, U.; Weber, G.; Springer, M. BioNumbers—The database of key numbers in molecular and cell biology. Nucleic Acids Res. 2010, 38, D750–D753. [Google Scholar] [CrossRef] [Green Version]
- Sato, T.K.; Tremaine, M.; Parreiras, L.S.; Hebert, A.S.; Myers, K.S.; Higbee, A.J.; Sardi, M.; McIlwain, S.J.; Ong, I.M.; Breuer, R.J.; et al. Directed Evolution Reveals Unexpected Epistatic Interactions That Alter Metabolic Regulation and Enable Anaerobic Xylose Use by Saccharomyces cerevisiae. PLoS Genet. 2016, 12, e1006372. [Google Scholar] [CrossRef] [Green Version]
- Lu, H.; Li, F.; Sánchez, B.J.; Zhu, Z.; Li, G.; Domenzain, I.; Marcišauskas, S.; Anton, P.M.; Lappa, D.; Lieven, C.; et al. A consensus S. cerevisiae metabolic model Yeast8 and its ecosystem for comprehensively probing cellular metabolism. Nat. Commun. 2019, 10, 3586. [Google Scholar] [CrossRef] [PubMed] [Green Version]
- Lieven, C.; Beber, M.E.; Olivier, B.G.; Bergmann, F.T.; Ataman, M.; Babaei, P.; Bartell, J.A.; Blank, L.M.; Chauhan, S.; Correia, K.; et al. MEMOTE for standardized genome-scale metabolic model testing. Nat. Biotechnol. 2020, 38, 272–276. [Google Scholar] [CrossRef] [PubMed] [Green Version]
- Schirawski, J. Invasion is sweet. New Phytol. 2015, 206, 892–894. [Google Scholar] [CrossRef]
- Verduyn, C.; Stouthamer, A.H.; Scheffers, W.A.; van Dijken, J.P. A theoretical evaluation of growth yields of yeasts. Antonie Van Leeuwenhoek 1991, 59, 49–63. [Google Scholar] [CrossRef]


| Component | Protein | DNA | RNA | Lipids | Cell Wall |
|---|---|---|---|---|---|
| g/100 gCDW | 30 | 0.3 | 10 | 40 | 16 |
| Component | iUma22 | Yeast 7.6 1 |
|---|---|---|
| Genes | 814 | 1150 |
| Metabolites | 1233 | 2742 |
| Reactions | 1856 | 4058 |
| Reactions with GPR | 1434 | 2633 |
| Predicted genes 2 | 6909 | 6464 |
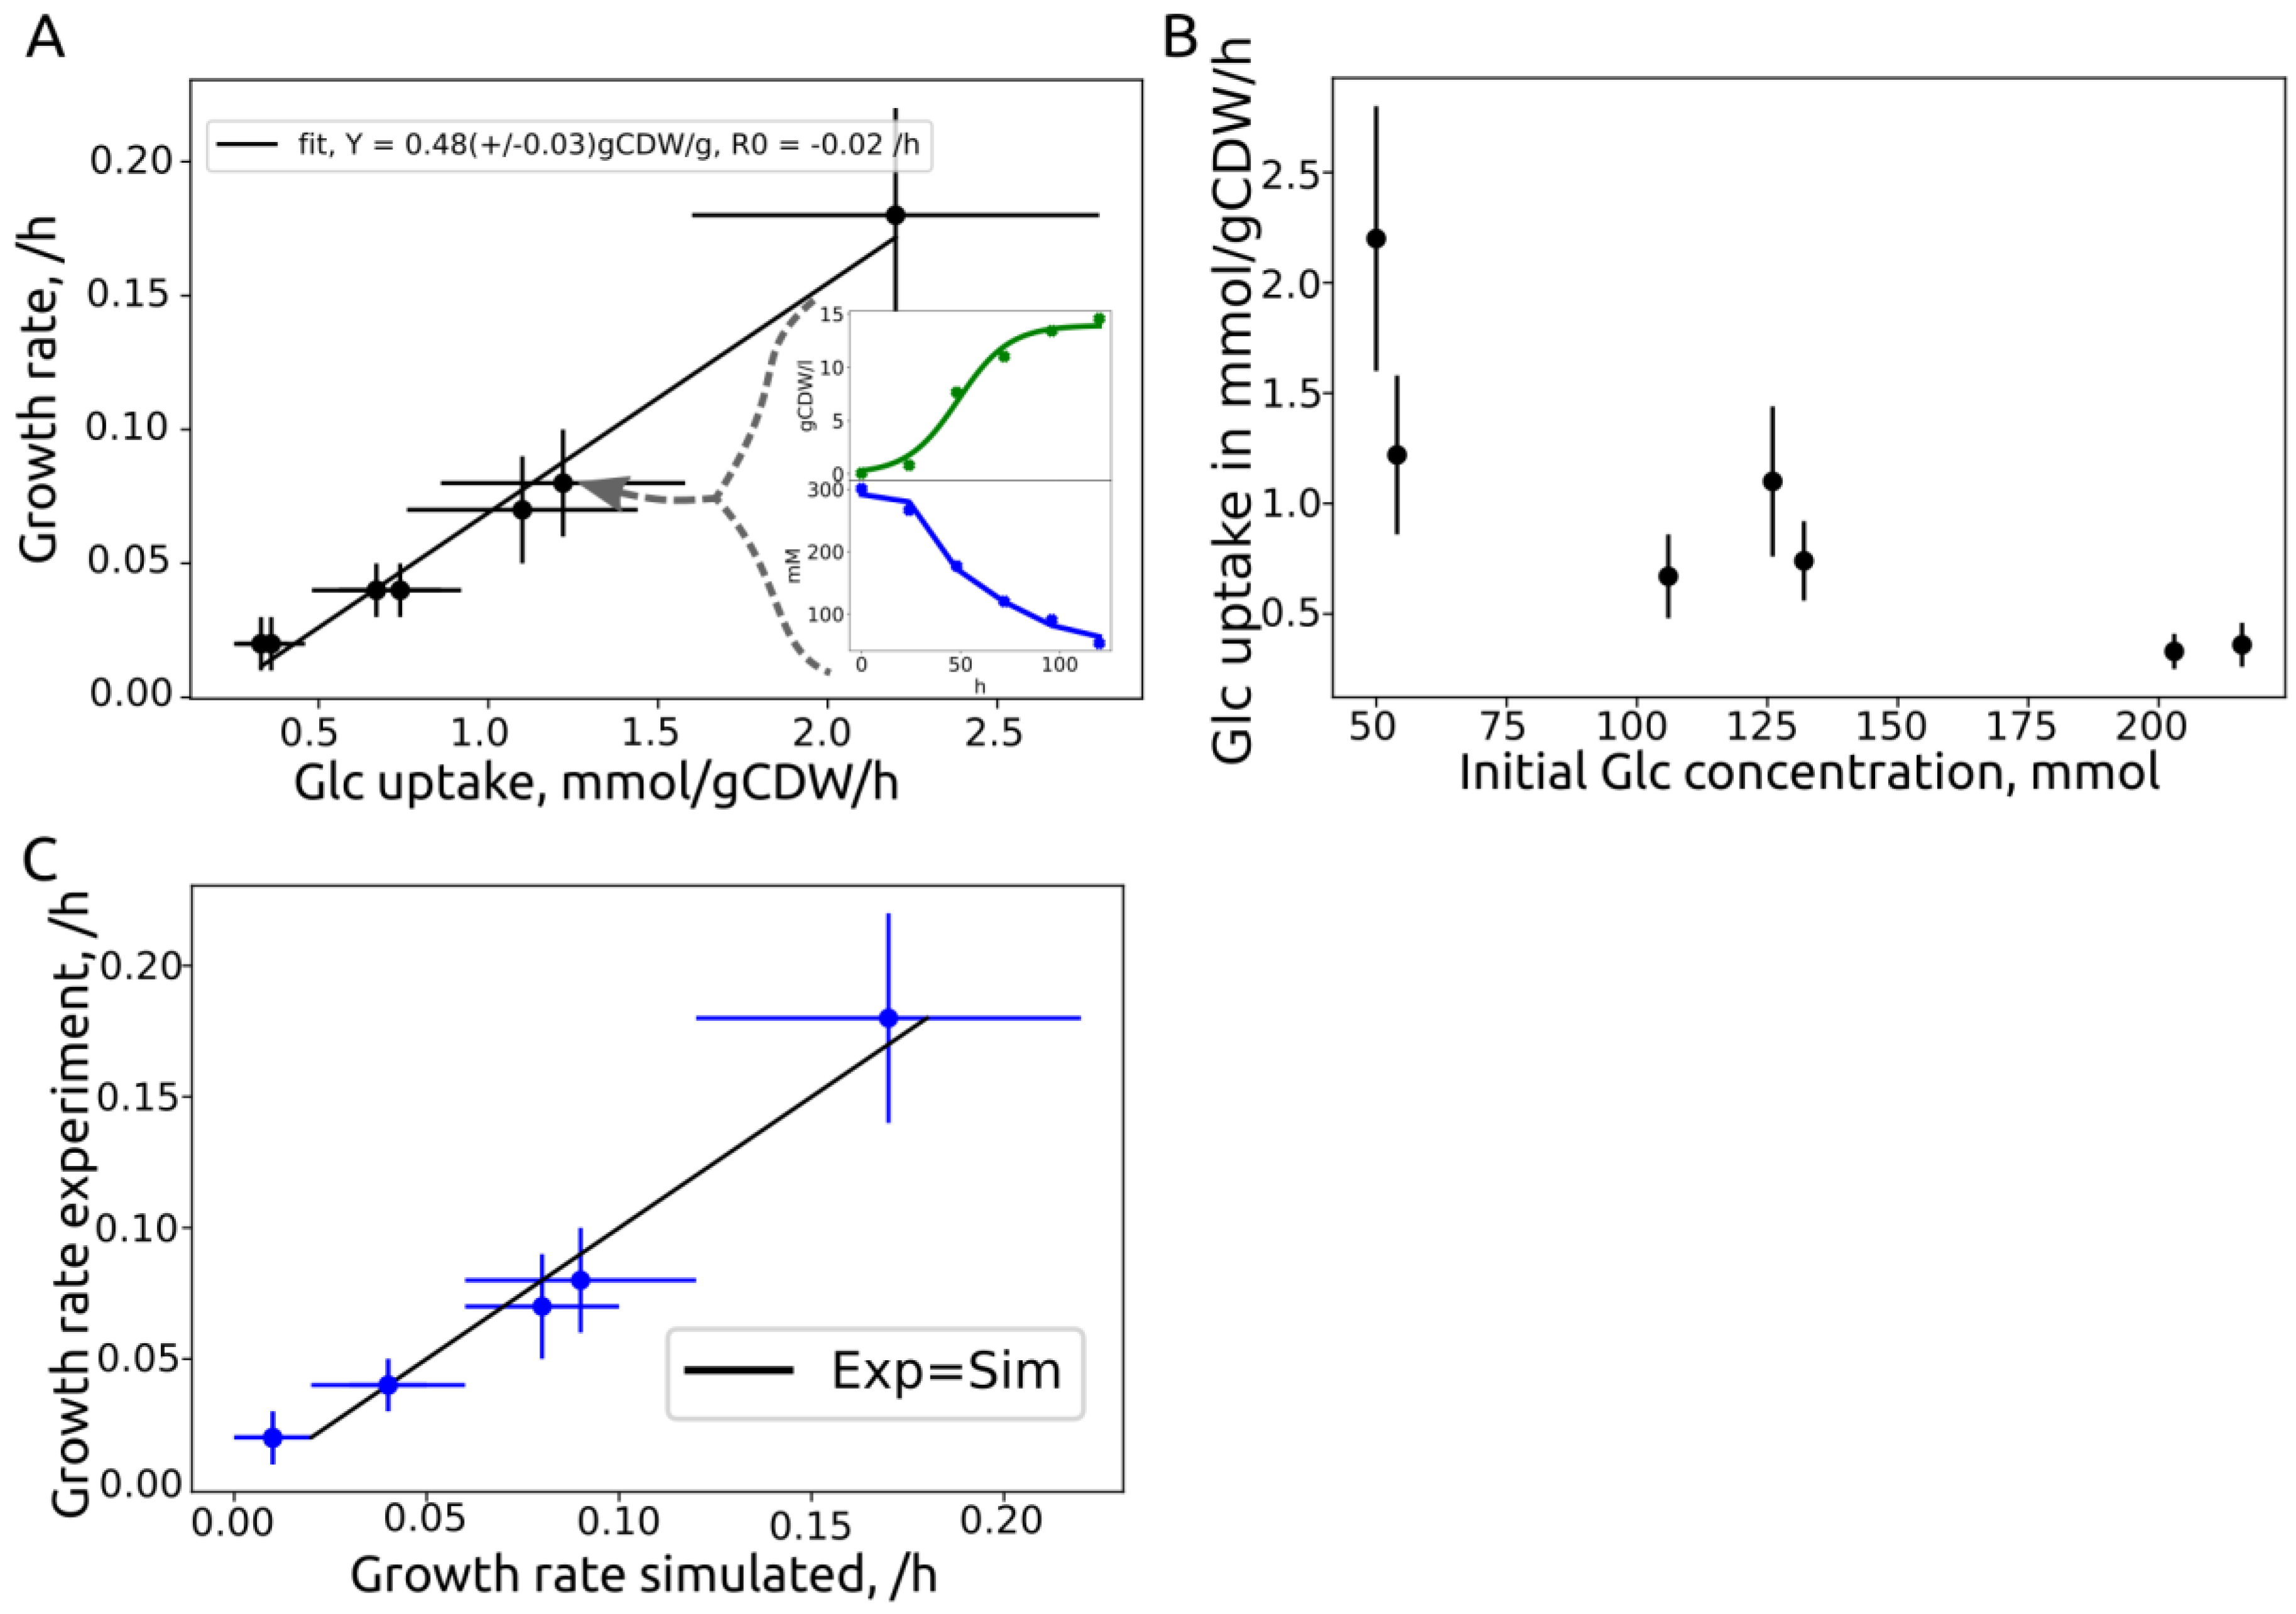
| Source | ID | Strain | Initial Glc, g/L | Growth Rate, /h | Substrate Rate, mmol/gCDW/h | Yield, gCDW/gglc |
|---|---|---|---|---|---|---|
| This work | 2229v1 | MB215 | 50 | 0.18 +/− 0.04 | 2.2 +/− 0.6 | 0.45 |
| Becker et al. | 50glc | MB215 | 54 | 0.08 +/− 0.02 | 1.22 +/− 0.36 | 0.36 |
| This work | 130v1 | MB215 | 126 | 0.07 +/− 0.02 | 1.1 +/− 0.34 | 0.33 |
| This work | 130v2 | MB215 | 132 | 0.04 +/− 0.01 | 0.74 +/− 0.18 | 0.3 |
| Becker et al. | 100glc | MB215 | 106 | 0.04 +/− 0.01 | 0.67 +/− 0.19 | 0.33 |
| This work | 200v1 | MB215 | 203 | 0.02 +/− 0.01 | 0.33 +/− 0.08 | 0.33 |
| This work | 200v2 | MB215 | 216 | 0.02 +/− 0.01 | 0.55 +/− 0.1 | 0.33 |
| iUma22-Unique | Shared | Pan-Unique |
|---|---|---|
| Oxidative phosphor. (42) | Purine (29) | Inositol phosphate (20) |
| TCA cycle (2) | Pyruvate metabolism (27) | Purine (12) |
| C5-branched metabolism (1) | Glycolysis (25) | N-Glycan biosynth. (11) |
| Nitrogen metabolism (1) | Gly, Ser, Thr metab. (24) | (GPI)-anchor biosynth. (11) |
| Starch and sucrose (1) | Val, Leu, Iso metab. (24) | Starch and sucrose (10) |
Publisher’s Note: MDPI stays neutral with regard to jurisdictional claims in published maps and institutional affiliations. |
© 2022 by the authors. Licensee MDPI, Basel, Switzerland. This article is an open access article distributed under the terms and conditions of the Creative Commons Attribution (CC BY) license (https://creativecommons.org/licenses/by/4.0/).
Share and Cite
Liebal, U.W.; Ullmann, L.; Lieven, C.; Kohl, P.; Wibberg, D.; Zambanini, T.; Blank, L.M. Ustilago maydis Metabolic Characterization and Growth Quantification with a Genome-Scale Metabolic Model. J. Fungi 2022, 8, 524. https://0-doi-org.brum.beds.ac.uk/10.3390/jof8050524
Liebal UW, Ullmann L, Lieven C, Kohl P, Wibberg D, Zambanini T, Blank LM. Ustilago maydis Metabolic Characterization and Growth Quantification with a Genome-Scale Metabolic Model. Journal of Fungi. 2022; 8(5):524. https://0-doi-org.brum.beds.ac.uk/10.3390/jof8050524
Chicago/Turabian StyleLiebal, Ulf W., Lena Ullmann, Christian Lieven, Philipp Kohl, Daniel Wibberg, Thiemo Zambanini, and Lars M. Blank. 2022. "Ustilago maydis Metabolic Characterization and Growth Quantification with a Genome-Scale Metabolic Model" Journal of Fungi 8, no. 5: 524. https://0-doi-org.brum.beds.ac.uk/10.3390/jof8050524