Article

Thermophysical Properties of Nanofluids Composed of Ethylene Glycol and Long Multi-Walled Carbon Nanotubes

1
Institute of Chemistry, University of Silesia in Katowice, Szkolna 9, 40-006 Katowice, Poland
2
Boryszew S.A. Branch Boryszew ERG Sochaczew, 15 Sierpnia 106, 96-500 Sochaczew, Poland
3
Department of Organic Chemistry, Bioorganic Chemistry and Biotechnology, Silesian University of Technology, B. Krzywoustego 4, 44-100 Gliwice, Poland
*
Authors to whom correspondence should be addressed.
Submission received: 10 November 2020 / Revised: 2 December 2020 / Accepted: 10 December 2020 / Published: 12 December 2020

Abstract

:
In this work, thermal conductivity, viscosity, isobaric heat capacity, and density of stable carbon-based nanofluids are presented. The nanofluids under study are composed of 1,2-ethanediol (ethylene glycol, EG) and long multi-walled carbon nanotubes (MWCNTs), so-called ‘in-house 16h’ (synthesized in our laboratory via catalytic chemical vapor deposition during 16 h with a diameter of 60–80 nm and length of 770 μm). Poly(N-vinylpyrrolidone) (PVP) was used to increase the stability of nanofluids. The nanofluids were prepared via an ultrasonication-assisted, three-step method while their key thermophysical characteristics were obtained using the hot-wire technique and rotary viscometer. As a result, the addition of MWCNTs significantly improved the thermal conductivity of nanofluids by 31.5% for the highest 1.0 wt% (0.498 vol%) long MWCNT content, leaving the Newtonian character of the nanofluids practically intact.

1. Introduction

The unceasing advance of thermal power plants, solar collectors/plants, thermal instrumentations, machines, and evolving miniaturization of electronic devices generates a continuously growing demand for high-performance heat transfer nanofluids (NFs) [1]. Among nanoparticles dispersible in 1,2-ethanediol (ethylene glycol, EG)—as the large-scale and economic chemical compound [2]—carbon nano-allotropes are of the highest importance and scaling-up potential. Those nanoparticles are nano-diamonds [3], graphene [4], quantum dots [5], and carbon nanotubes (CNTs) [6]. Particularly CNTs, as quasi-one-dimensional nanoparticles, emerge as the most promising solids dispersible in numerous continuous phases from water through organic solvents to ionic liquids [6].
Although the enhancement in numerous critical thermophysical properties—compared to the base fluids—is rather undeniable, the level of augmentation of the overall performance and versatility of the pre-designable nanofluids derives from numerous variables. This is particularly evident since the influence of CNTs on the key characteristics of nanofluids is difficult to track [7]. Indeed, CNTs—as large macromolecules—differ individually even at the molecular level by purity (content of amorphous carbon and metallic/non-metallic particles as a catalyst residue), morphology (shape, degree of entanglement, aspect ratio, way of nanotube closure), and surface physico-chemistry (number of crystallographic defects, deviations from C-sp2 hybridization, and functionalization) [8]. There is, hence, high demand for comprehensive characteristics of CNTs, base fluids, and all additives (surfactants, other nanoparticles, etc.), which eventually would yield synergetic nanofluids.
Up to now, several attempts to enhance the characteristics of EG-based nanofluids as heat transfer media using CNTs were reported. Xie et al. [9] prepared nanofluids containing pristine and oxidized multi-walled carbon nanotubes (MWCNTs) and found a 27.5% increase in thermal conductivity for the ball-milled pristine MWCNTs (diameter d = 30 nm, length l = 60 μm) at 0.01 vol%. Liu et al. [10] recorded a 12.4% increase in thermal conductivity for EG-based nanofluids containing 1.0 vol% MWCNTs (d = 20–30 nm, l = few μm). Kumar et al. [11] employed MWCNTs (d = 30–50 nm, l = 10–20 µm) in the commercial solar liquid obtaining nanofluid of 30.6% enhancement in thermal conductivity at 0.6 vol% MWCNT concentration. In our recent approach [12], we found that 1,2-propanediol-based (propylene glycol, PG) nanofluid, containing 0.53 vol% of curly ultra-long MWCNTs, had a 39% higher thermal conductivity than PG itself. Nevertheless, the Newtonian character of nanofluids under various shear rates and their stability at high MWCNT concentration was not cross-verified.
Herein, we present a study on the thermophysical properties of nanofluids composed of EG and long MWCNTs with the addition of poly(N-vinylpyrrolidone) (PVP) as the stabilizing agent. The elaborated protocol allowed us to obtain nanofluids with a significant enhancement in thermal conductivity, accompanied by practically purely Newtonian behavior, which, in the further perspective, emerges as an excellent premise for heat transfer applications.

2. Materials and Methods
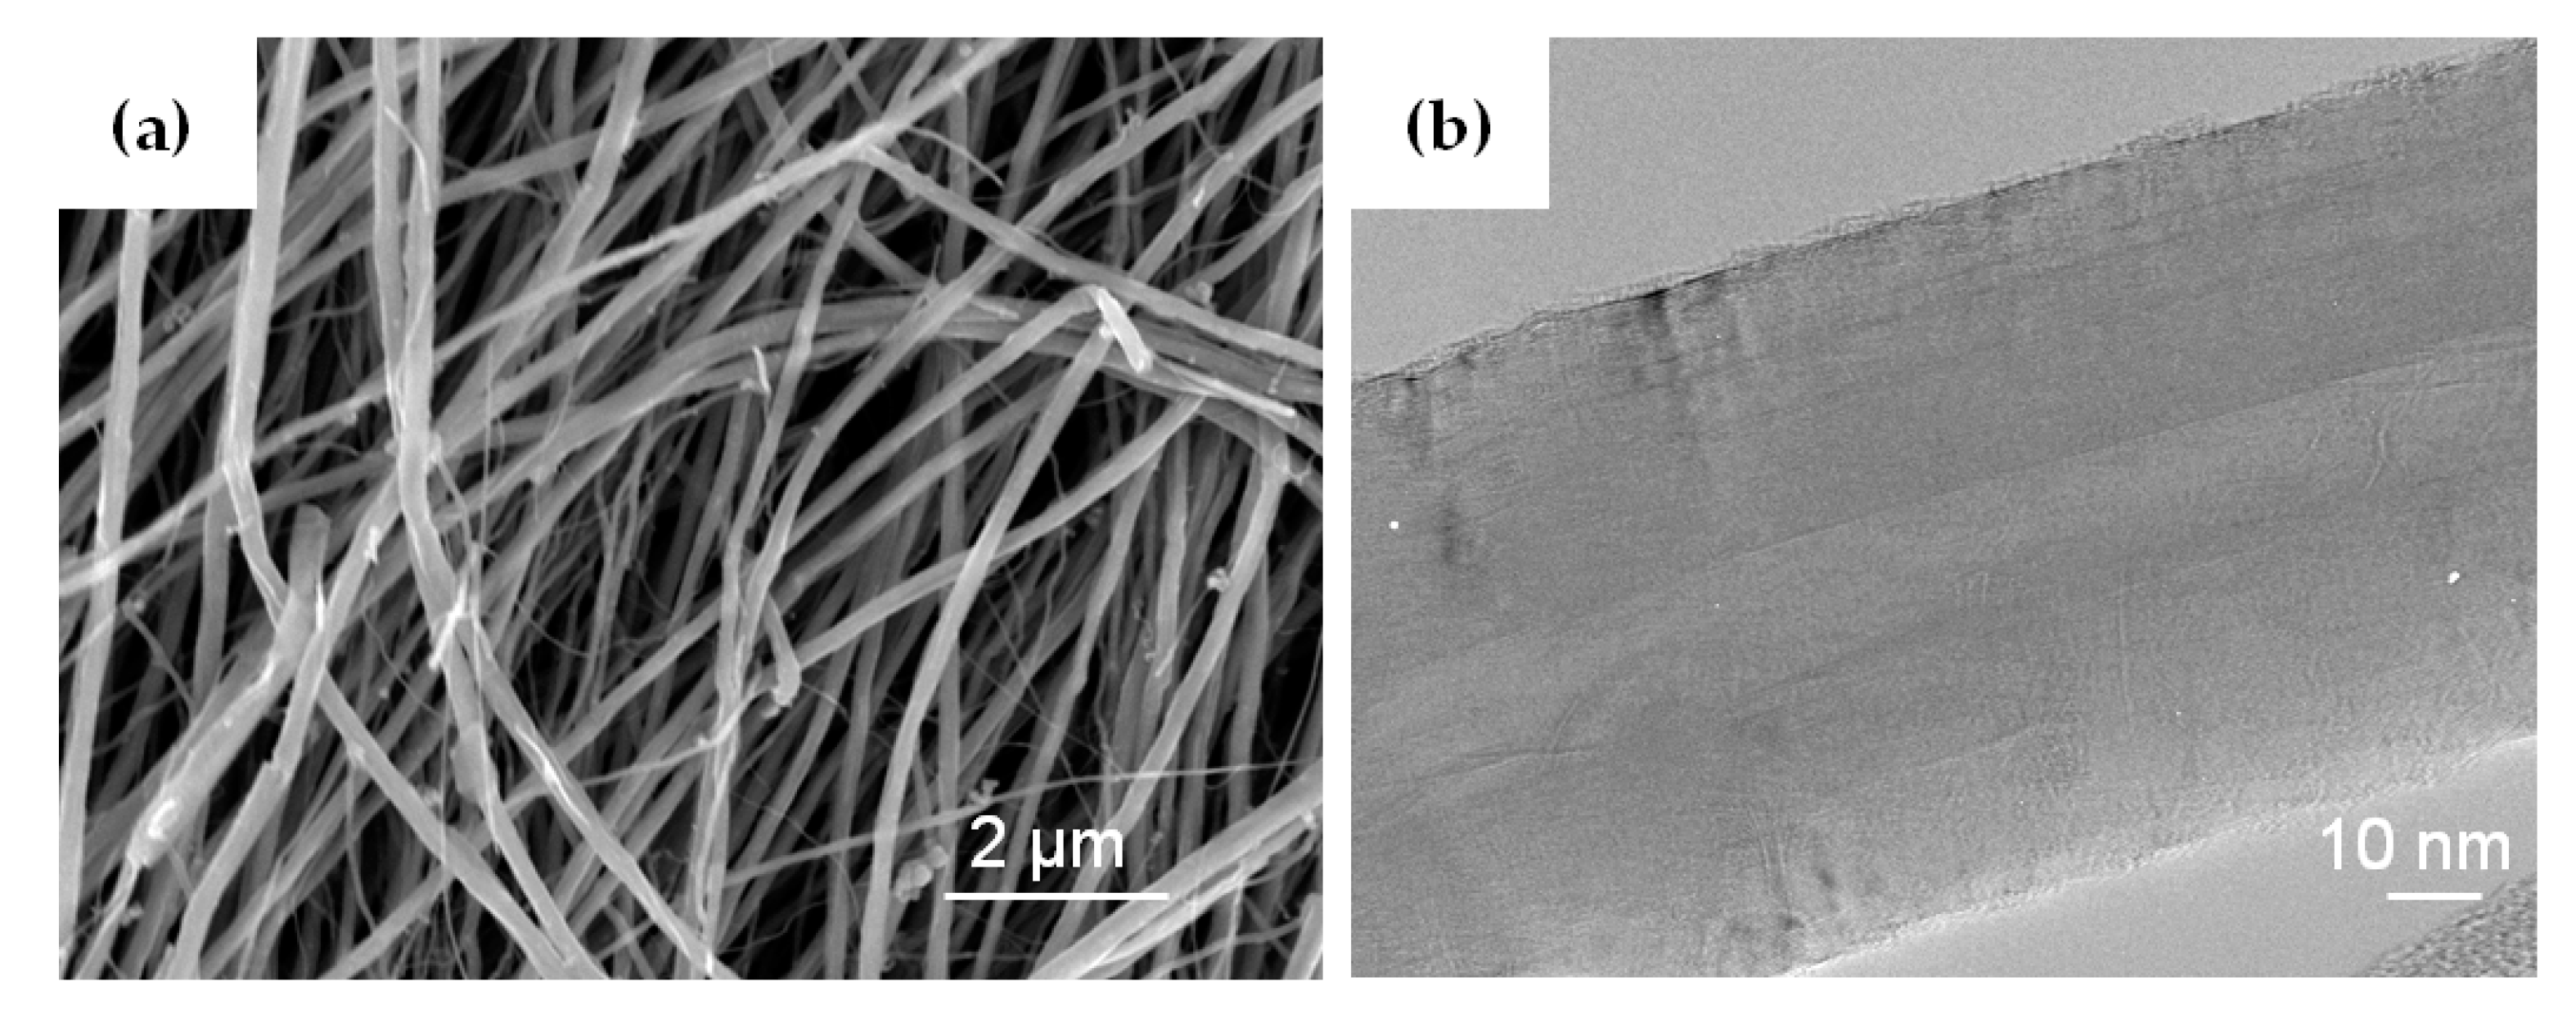
2.1. Materials

1,2-Ethanediol (0.998 mass fraction purity) was purchased from Oleon GmBH (Wiesbaden, Germany). The EG was dried using 4 Å molecular sieves (Merck, Darmstadt, Germany). The water content was measured using the Karl-Fischer method (870KF Titrino Plus, Metrohm AG, Herisau, Switzerland) and reached a value of 270 ppm. A brief specification of the EG is presented in Table 1. In-house multi-walled carbon nanotubes (in-house 16h MWCNTs) were prepared using the 16-h catalytic chemical vapor deposition (c-CVD) process described in detail previously [13]. A brief specification of the in-house 16h MWCNTs is presented in Table 2. SEM images obtained by JSM-634OF FEG (JEOL, Akishima, Tokyo, Japan) at 5 kV and TEM micrographs acquired using 200 CX (JEOL, Akishima, Tokyo, Japan) at 200 kV of in-house MWCNTs used in this study are presented in Figure 1.

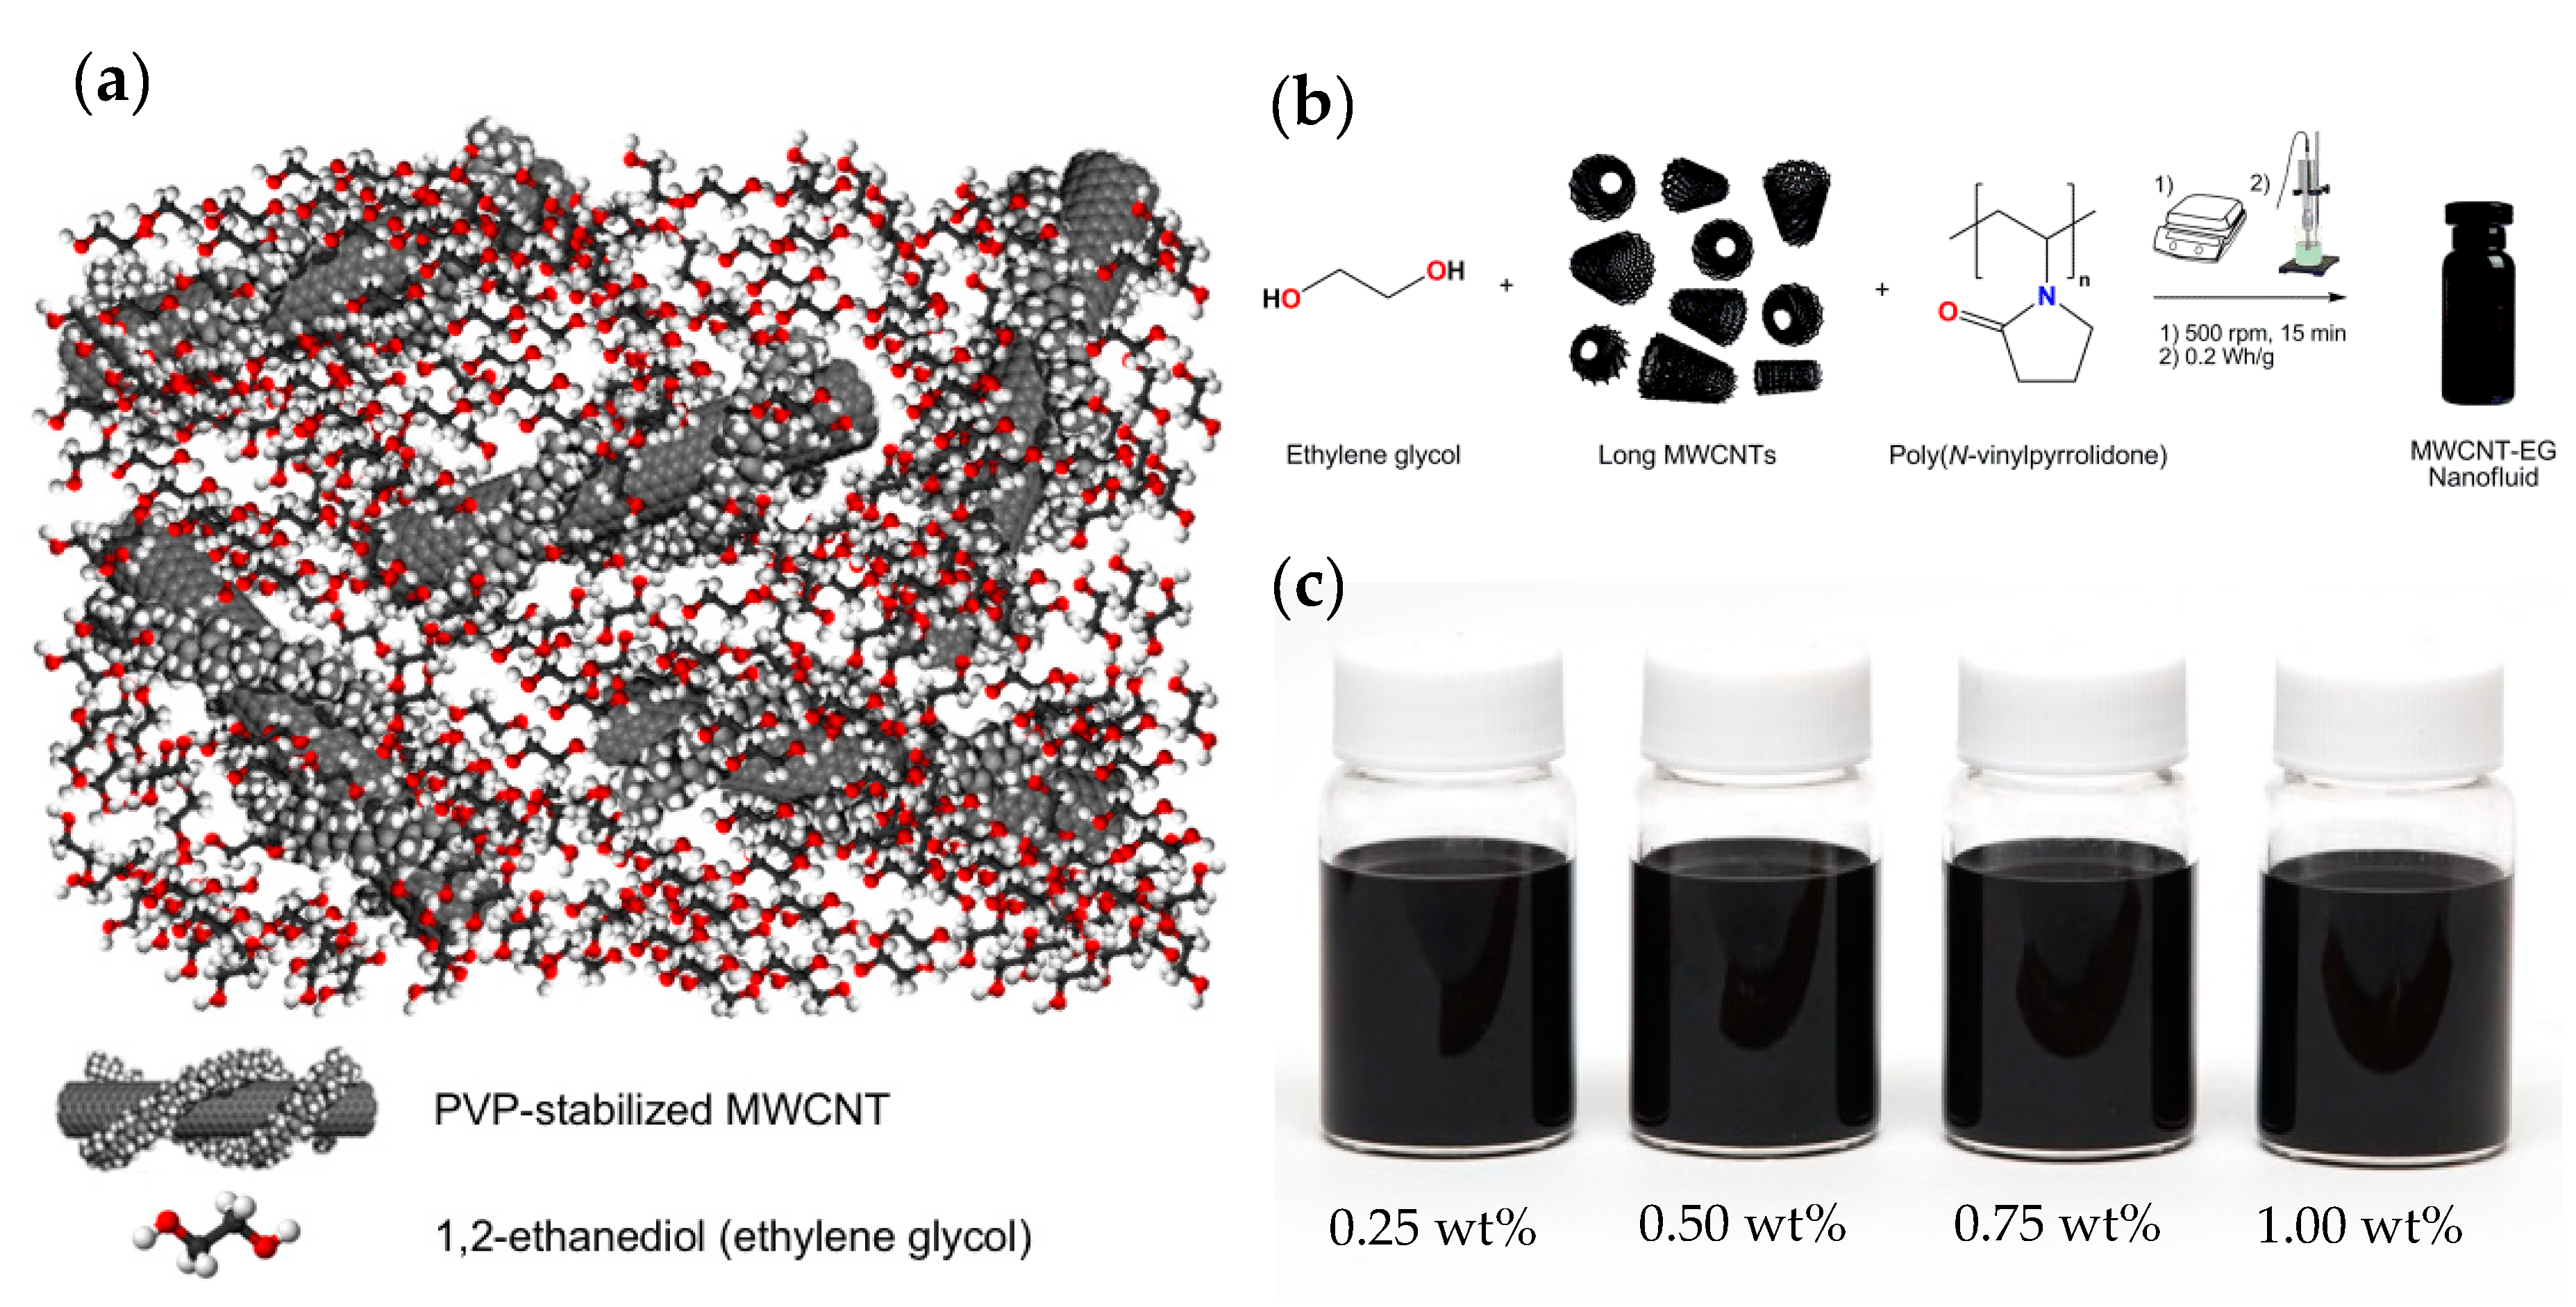
2.2. Sample Preparation

The NFs (Figure 2) were prepared via a three-step method. Firstly, PVP was dissolved in EG as a stabilizer to maintain high-quality, i.e., homogenous dispersion of in-house 16h MWCNTs. Then the desired weight of carbon nanoparticles (0.25, 0.5, 0.75, and 1.0 wt%) was added and mixed by a magnetic stirrer MS11 (Wigo, Poland) at 500 rpm for 15 min. Finally, the samples were sonicated using a 200 W UP200Ht homogenizer (Hielscher, Germany) with a sonotrode diameter of 15 mm. To prevent overheating of the dispersions, the ice bath was used. During the sonication procedure, the energy supplied to each sample was 0.2 Wh/g.

2.3. Thermal Conductivity Measurements

The thermal conductivity was measured via the hot-wire technique using KD2 Pro Thermal Properties Analyzer (Decagon Devices Inc., Pullman, WA, USA) with a single needle KS-1 sensor, pre-calibrated by a glycerin verification standard. The measurement uncertainty was equal to ±5% [26]. The research was conducted in triplicate at 298.15 K, 303.15 K, and 308.15 K. The temperature stability was ensured within ±0.1 K by an Open Bath Circulator ED-5 (Julabo GmbH, Seelbach, Germany) containing EG as a working liquid.

2.4. Viscosity Measurements

The viscosity was measured using rotary viscometer LV DV2T (Brookfield Engineering, Middleboro, MA, USA) with Small Sample Adapter and SC4–18 spindle. The influence of temperature on the viscosity was tested in the range from 283.15 K to 333.15 K (at 13.2 s−1), while the effect of the shear rate on the viscosity was investigated in the range from 1.32 s−1 to 105.6 s−1 (at 298.15 K). The temperatures were maintained with a Low Profile Refrigerated Circulator MX7LR-20 (PolyScience, Niles, IL, USA) containing EG-water coolant. The temperature stability was ±0.07 K. The uncertainty of viscosity measurements reached a value of ±3 mPas.

2.5. Density Measurements

The density of EG and nanofluids was measured in the range from 283.15 K to 333.15 K using vibrating-tube densimeters Anton Paar DMA 5000M and Anton Paar DMA 5000 (Anton Paar, Graz, Austria), respectively. The devices were calibrated with dry air and re-distilled water (with electrolytic conductivity of 1 × 10⁻⁴ S·m−1 at 298.15 K) using an extended calibration procedure. The viscosity corrections were made automatically. Expanded uncertainties of the density measurements were ±0.1 kg·m−3 and ±0.3 kg·m−3, respectively. The temperature was determined within the expanded uncertainty of ±0.02 K.

2.6. Isobaric Heat Capacity Measurements

The isobaric heat capacity was measured in the range from 283.15 K to 333.15 K, using a differential temperature-scanning (DSC) microcalorimeter μSC–2c (SETARAM Instrumentation, Caluire, France). The apparatus was calibrated on the Joule effect. The reference standard was 1-butanol (Sigma Aldrich, SureSeal, anhydrous, mass fraction purity of 0.998). The apparatus was tested using n-hexane (POCH, Poland, mass fraction purity of 0.999) and benzene (Sigma Aldrich, mass fraction purity of 0.998). The expanded uncertainty of the isobaric heat capacity measurements was equal to ±2%.

3. Results

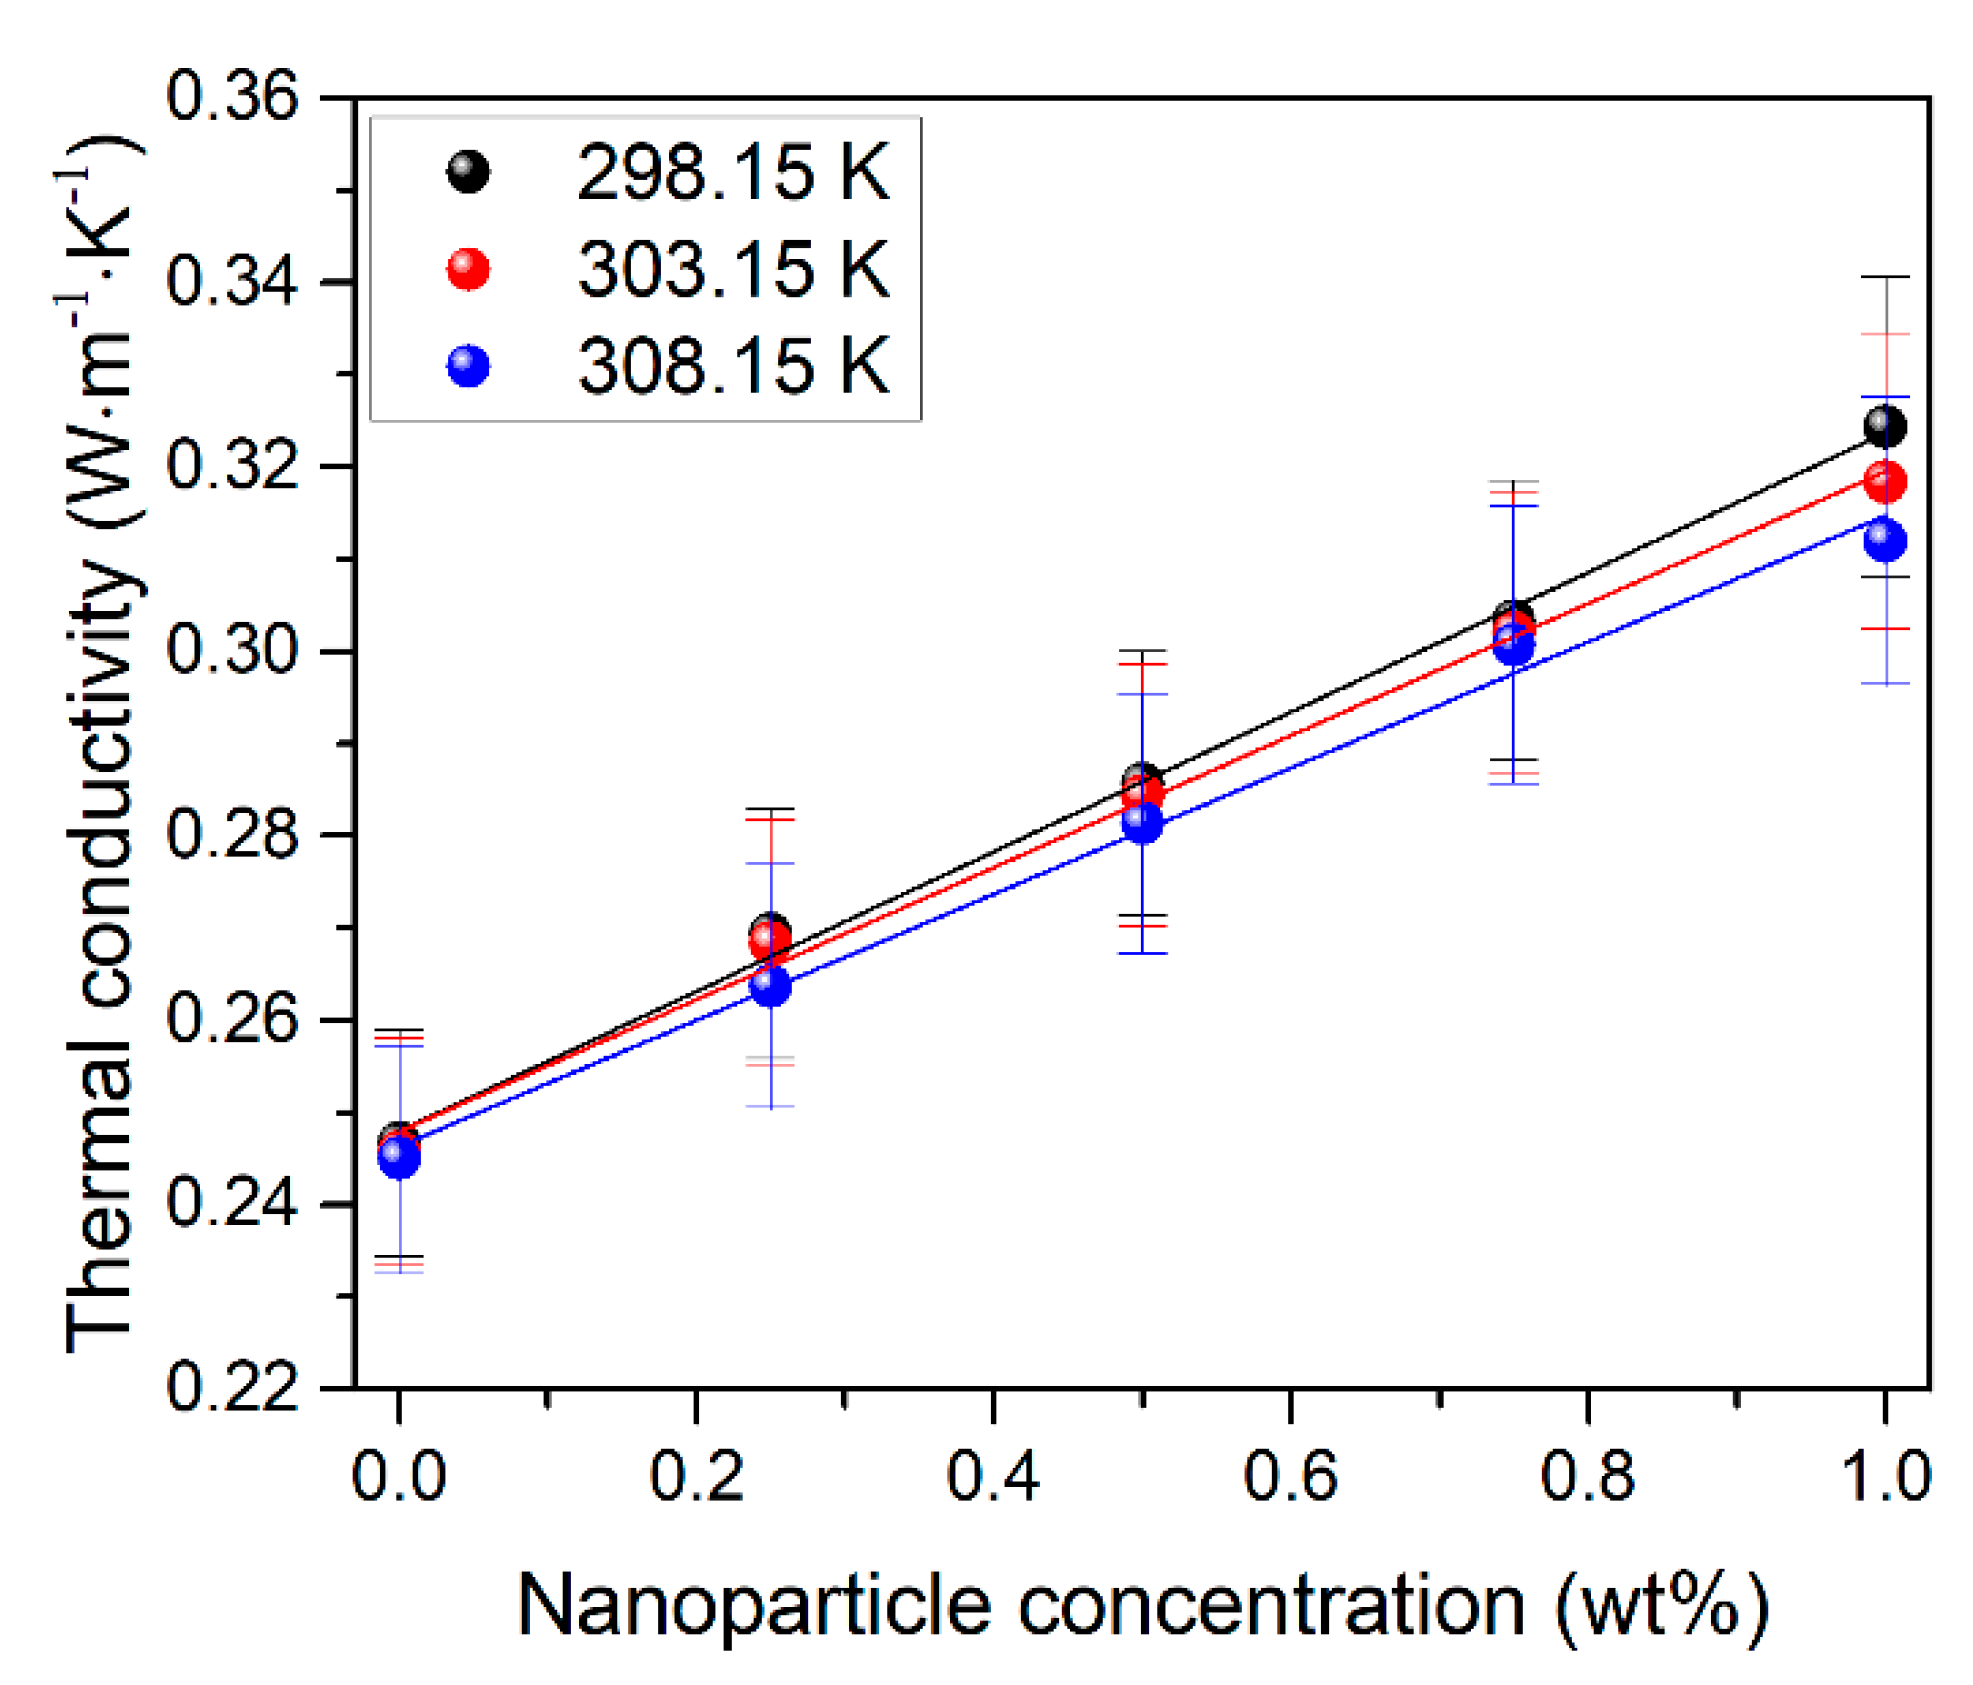
3.1. Thermal Conductivity

The thermal conductivity of EG and NFs was measured in triplicate in the temperature range from 298.15 K to 308.15 K in 5 K steps. The obtained results are listed in Table 3 and presented in Figure 3. As can be seen, the thermal conductivity increases almost linearly with the concentration of in-house 16h MWCNTs and decreases very slightly with the temperature. Although the influence of temperature on the thermal conductivity of NF is much smaller, it clearly increases with the concentration of nanotubes. The maximum enhancement in thermal conductivity compared to the base liquid is 31.5% for NF containing 1 wt% in-house 16h MWCNTs.

3.2. Viscosity

The viscosity of EG and NFs under the test was measured at a shear rate of 13.2 s−1 within the temperature range from 283.15 K to 333.15 K. Additionally, a viscosity curve for NF with the highest concentration of MWCNTs was determined at 298.15 K in the shear rate range from 1.32 s−1 to 105.6 s−1. The obtained results are presented in Figure 4.
As it turned out, the viscosity of EG and NFs decreases significantly with temperature due to the weakening of intermolecular interactions (Figure 4a). This decline is from 80.3% to 84.8% and slightly increases with a decreasing concentration of MWCNTs. Moreover, the NF containing 1 wt% in-house 16h MWCNTs appears to be a Newtonian fluid with a constant (absolute) viscosity of 30.9 ± 3.0 mPa·s (Figure 4b). It can be, hence, assumed that more diluted NFs with a lower concentration of MWCNTs will also exhibit Newtonian behavior.

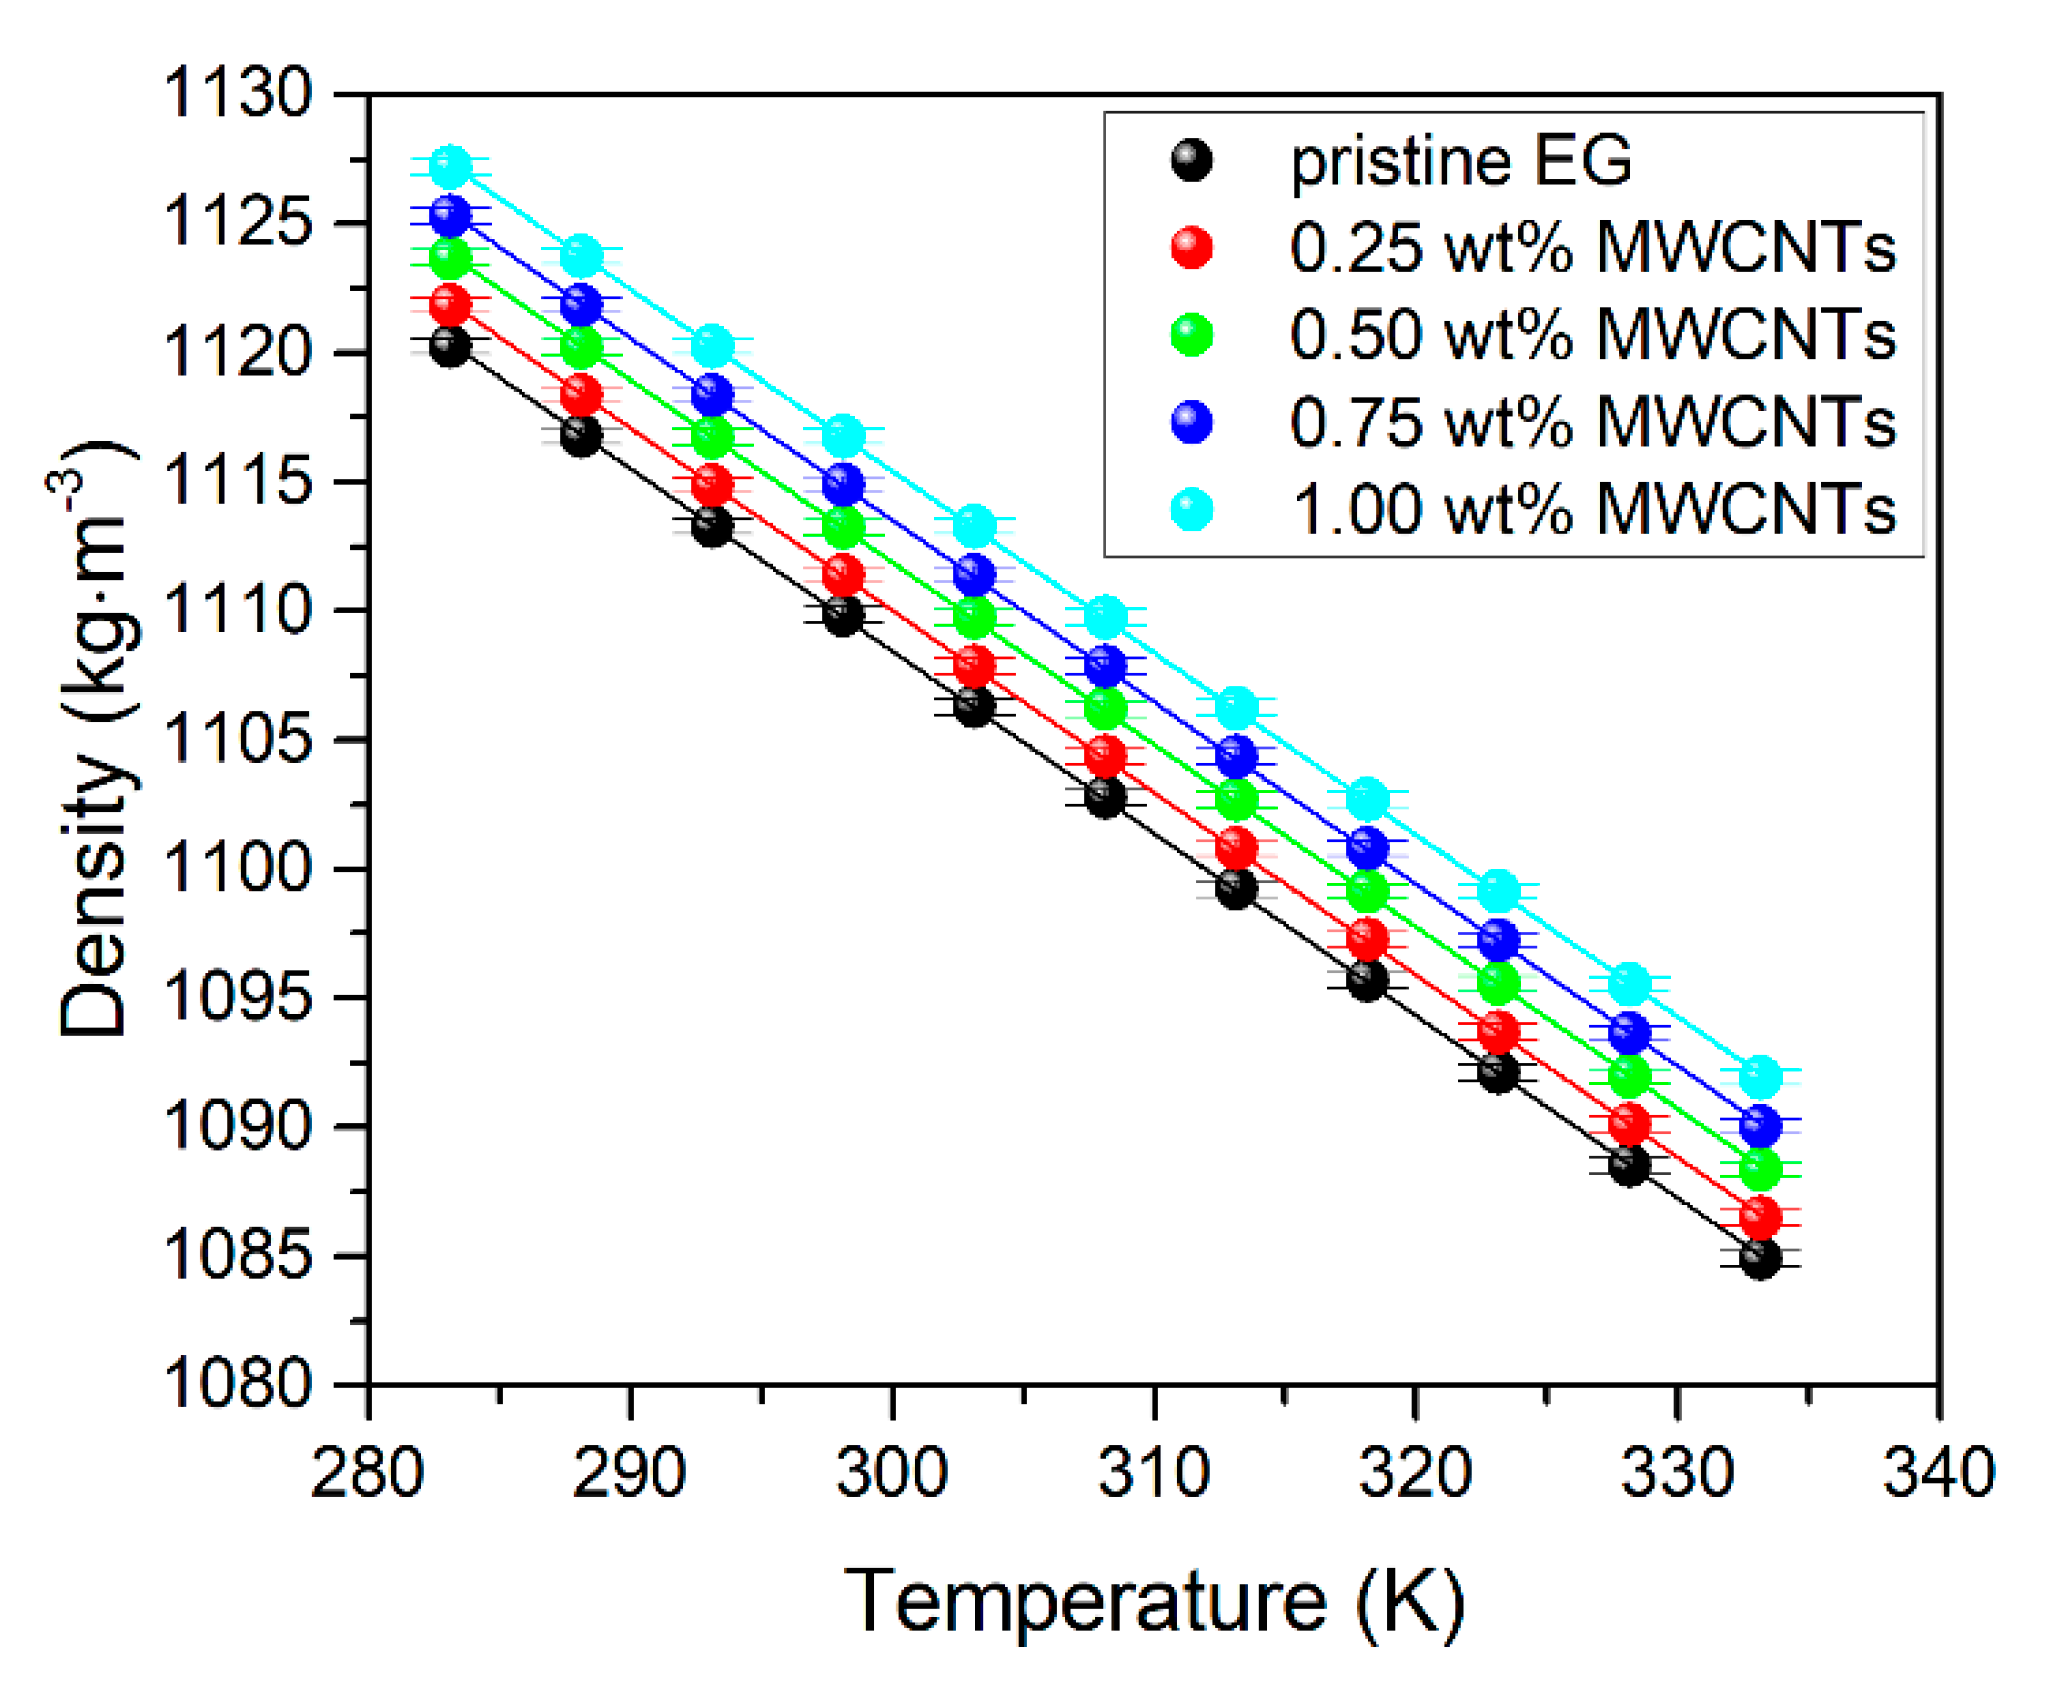
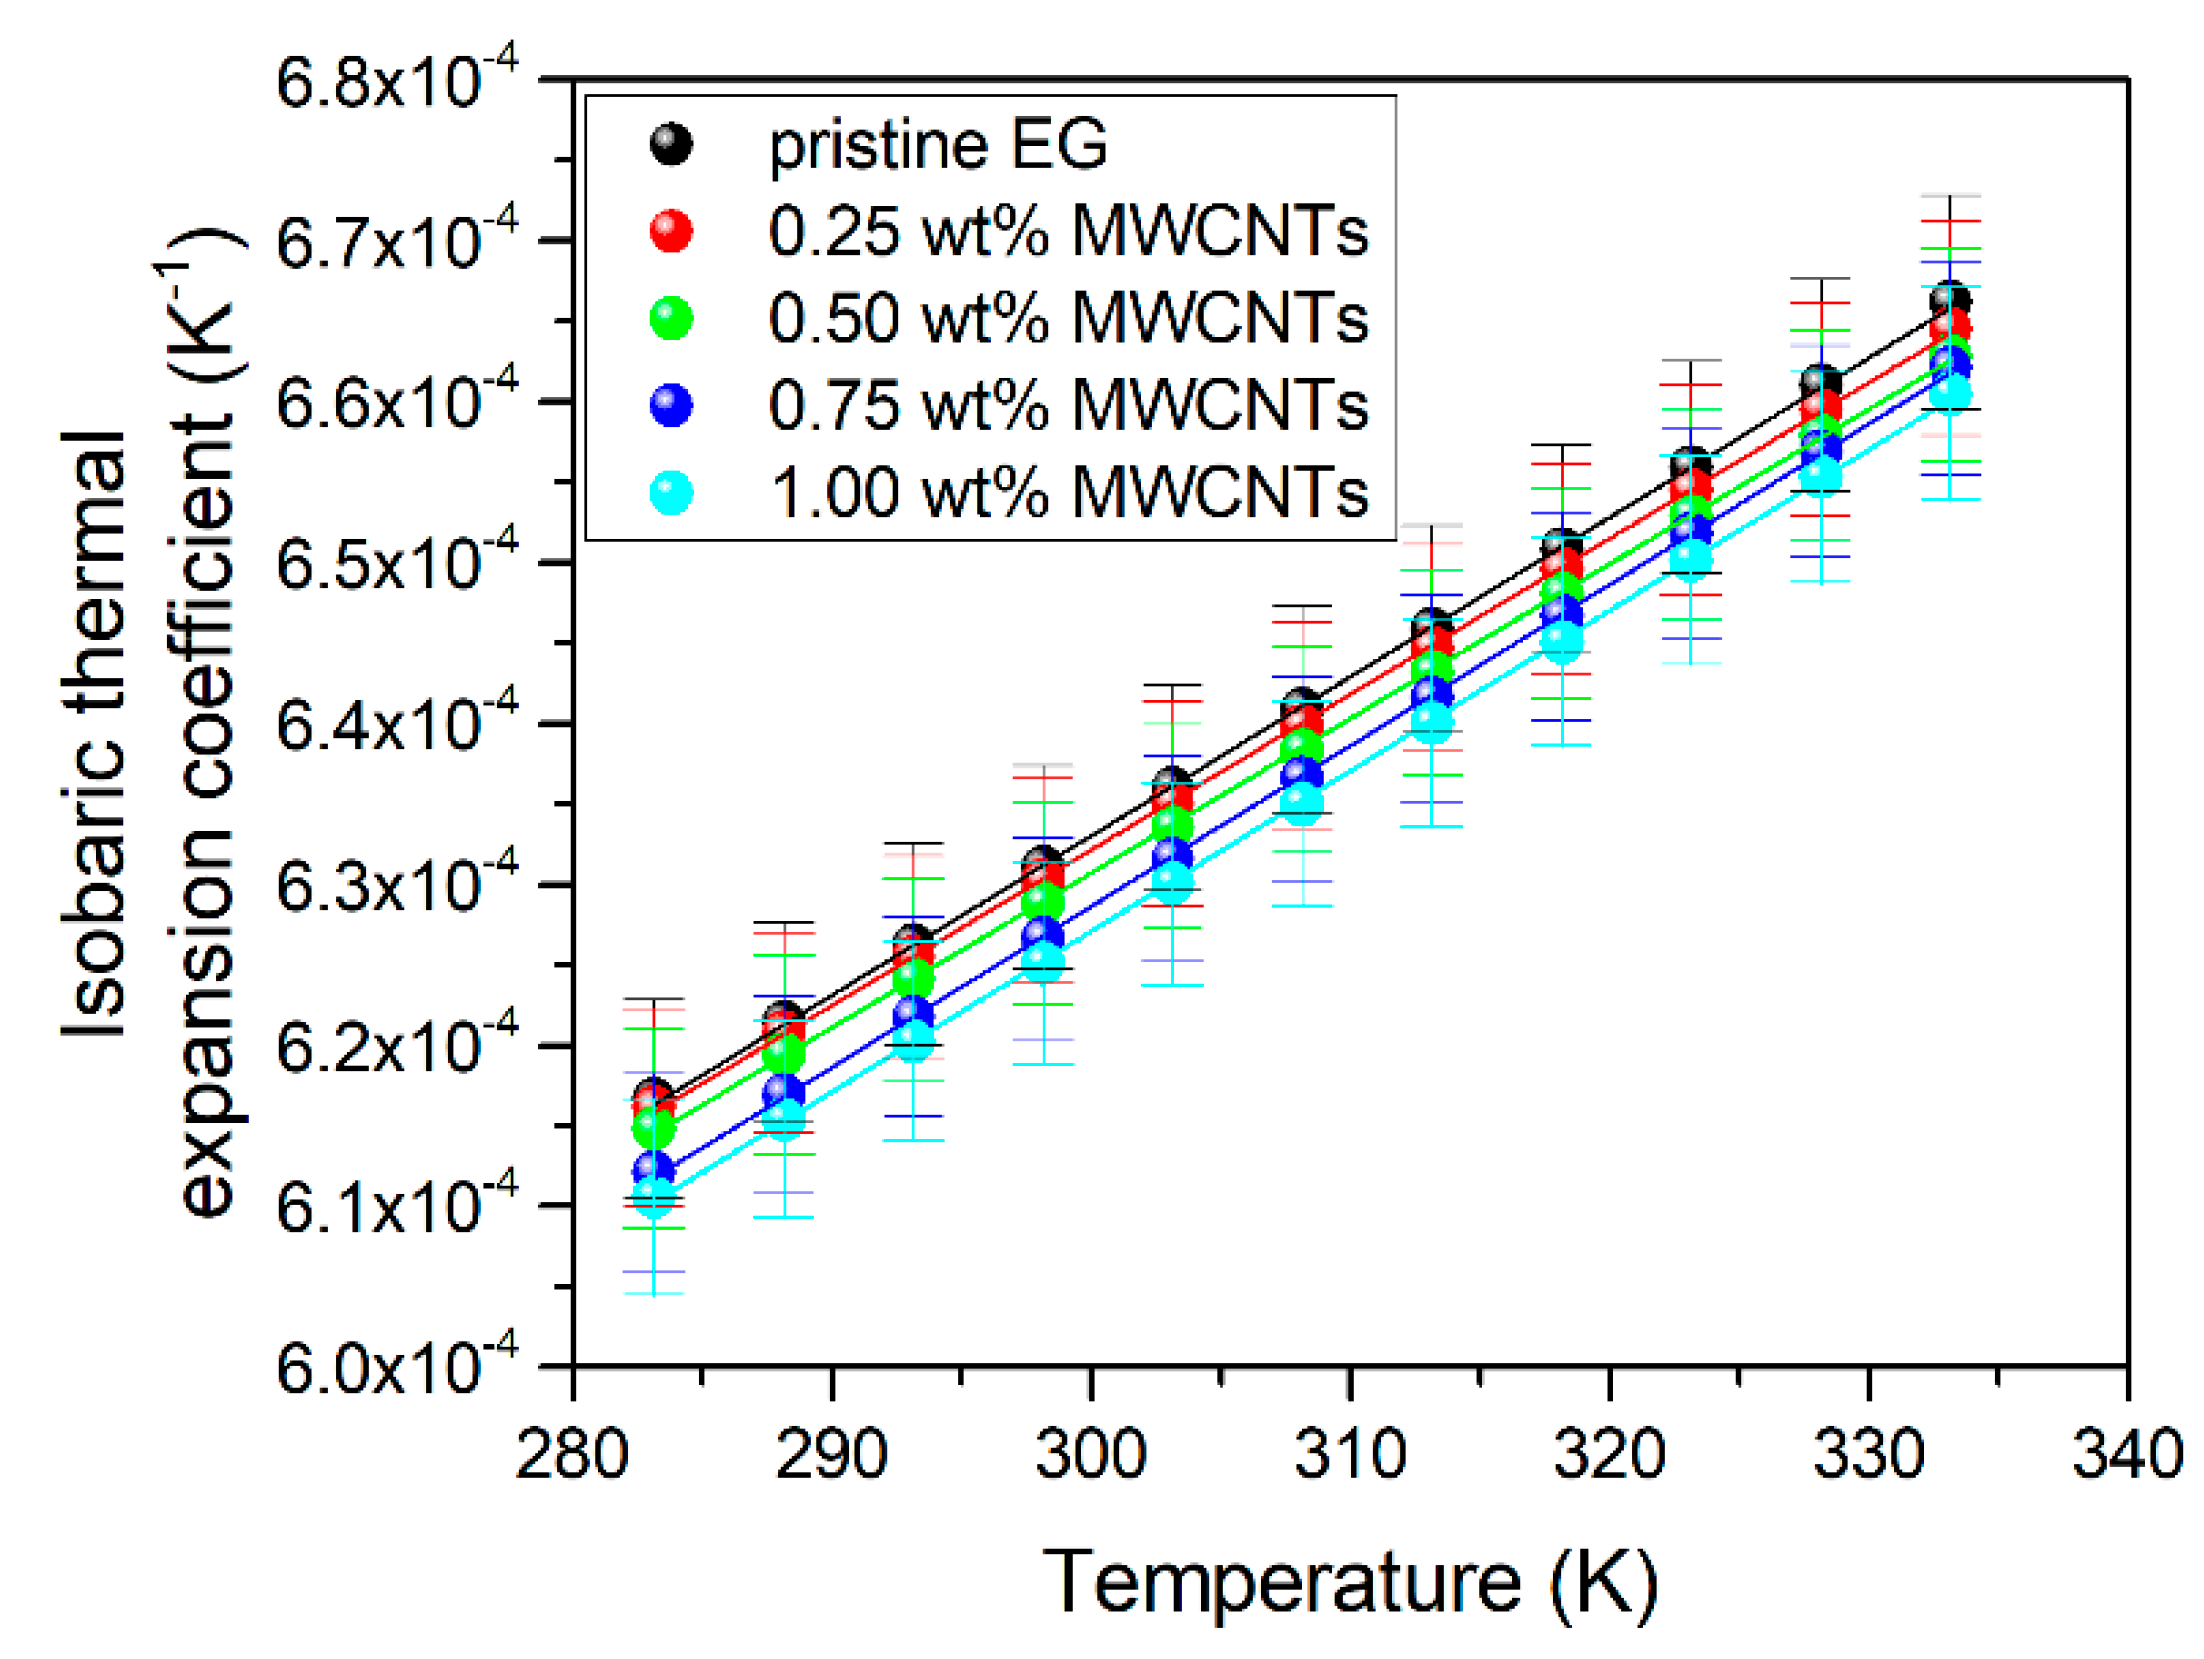
3.3. Density and Isobaric Thermal Expansion Coefficient

The density of EG and nanofluids was measured in the temperature range from 283.15 K to 333.15 K in 5 K steps. The obtained results are listed in Table 4 and presented in Figure 5. The temperature dependence of density was described by the second-order polynomial.
ρ = i = 0 2 a i ( T     283.15 ) i
The polynomial coefficients (ai) were calculated by the least-squares method. The backward stepwise rejection procedure was used to reduce the number of non-zero coefficients. The coefficients and the mean deviations from the regression lines are given in Table 5.
The isobaric thermal expansion coefficient, αp, is one of the most important fundamental material constants. The αp was calculated by the definition below.
α p     ( 1 ρ ) ( ρ T ) p
The obtained results are listed in Table 6 and presented in Figure 6.

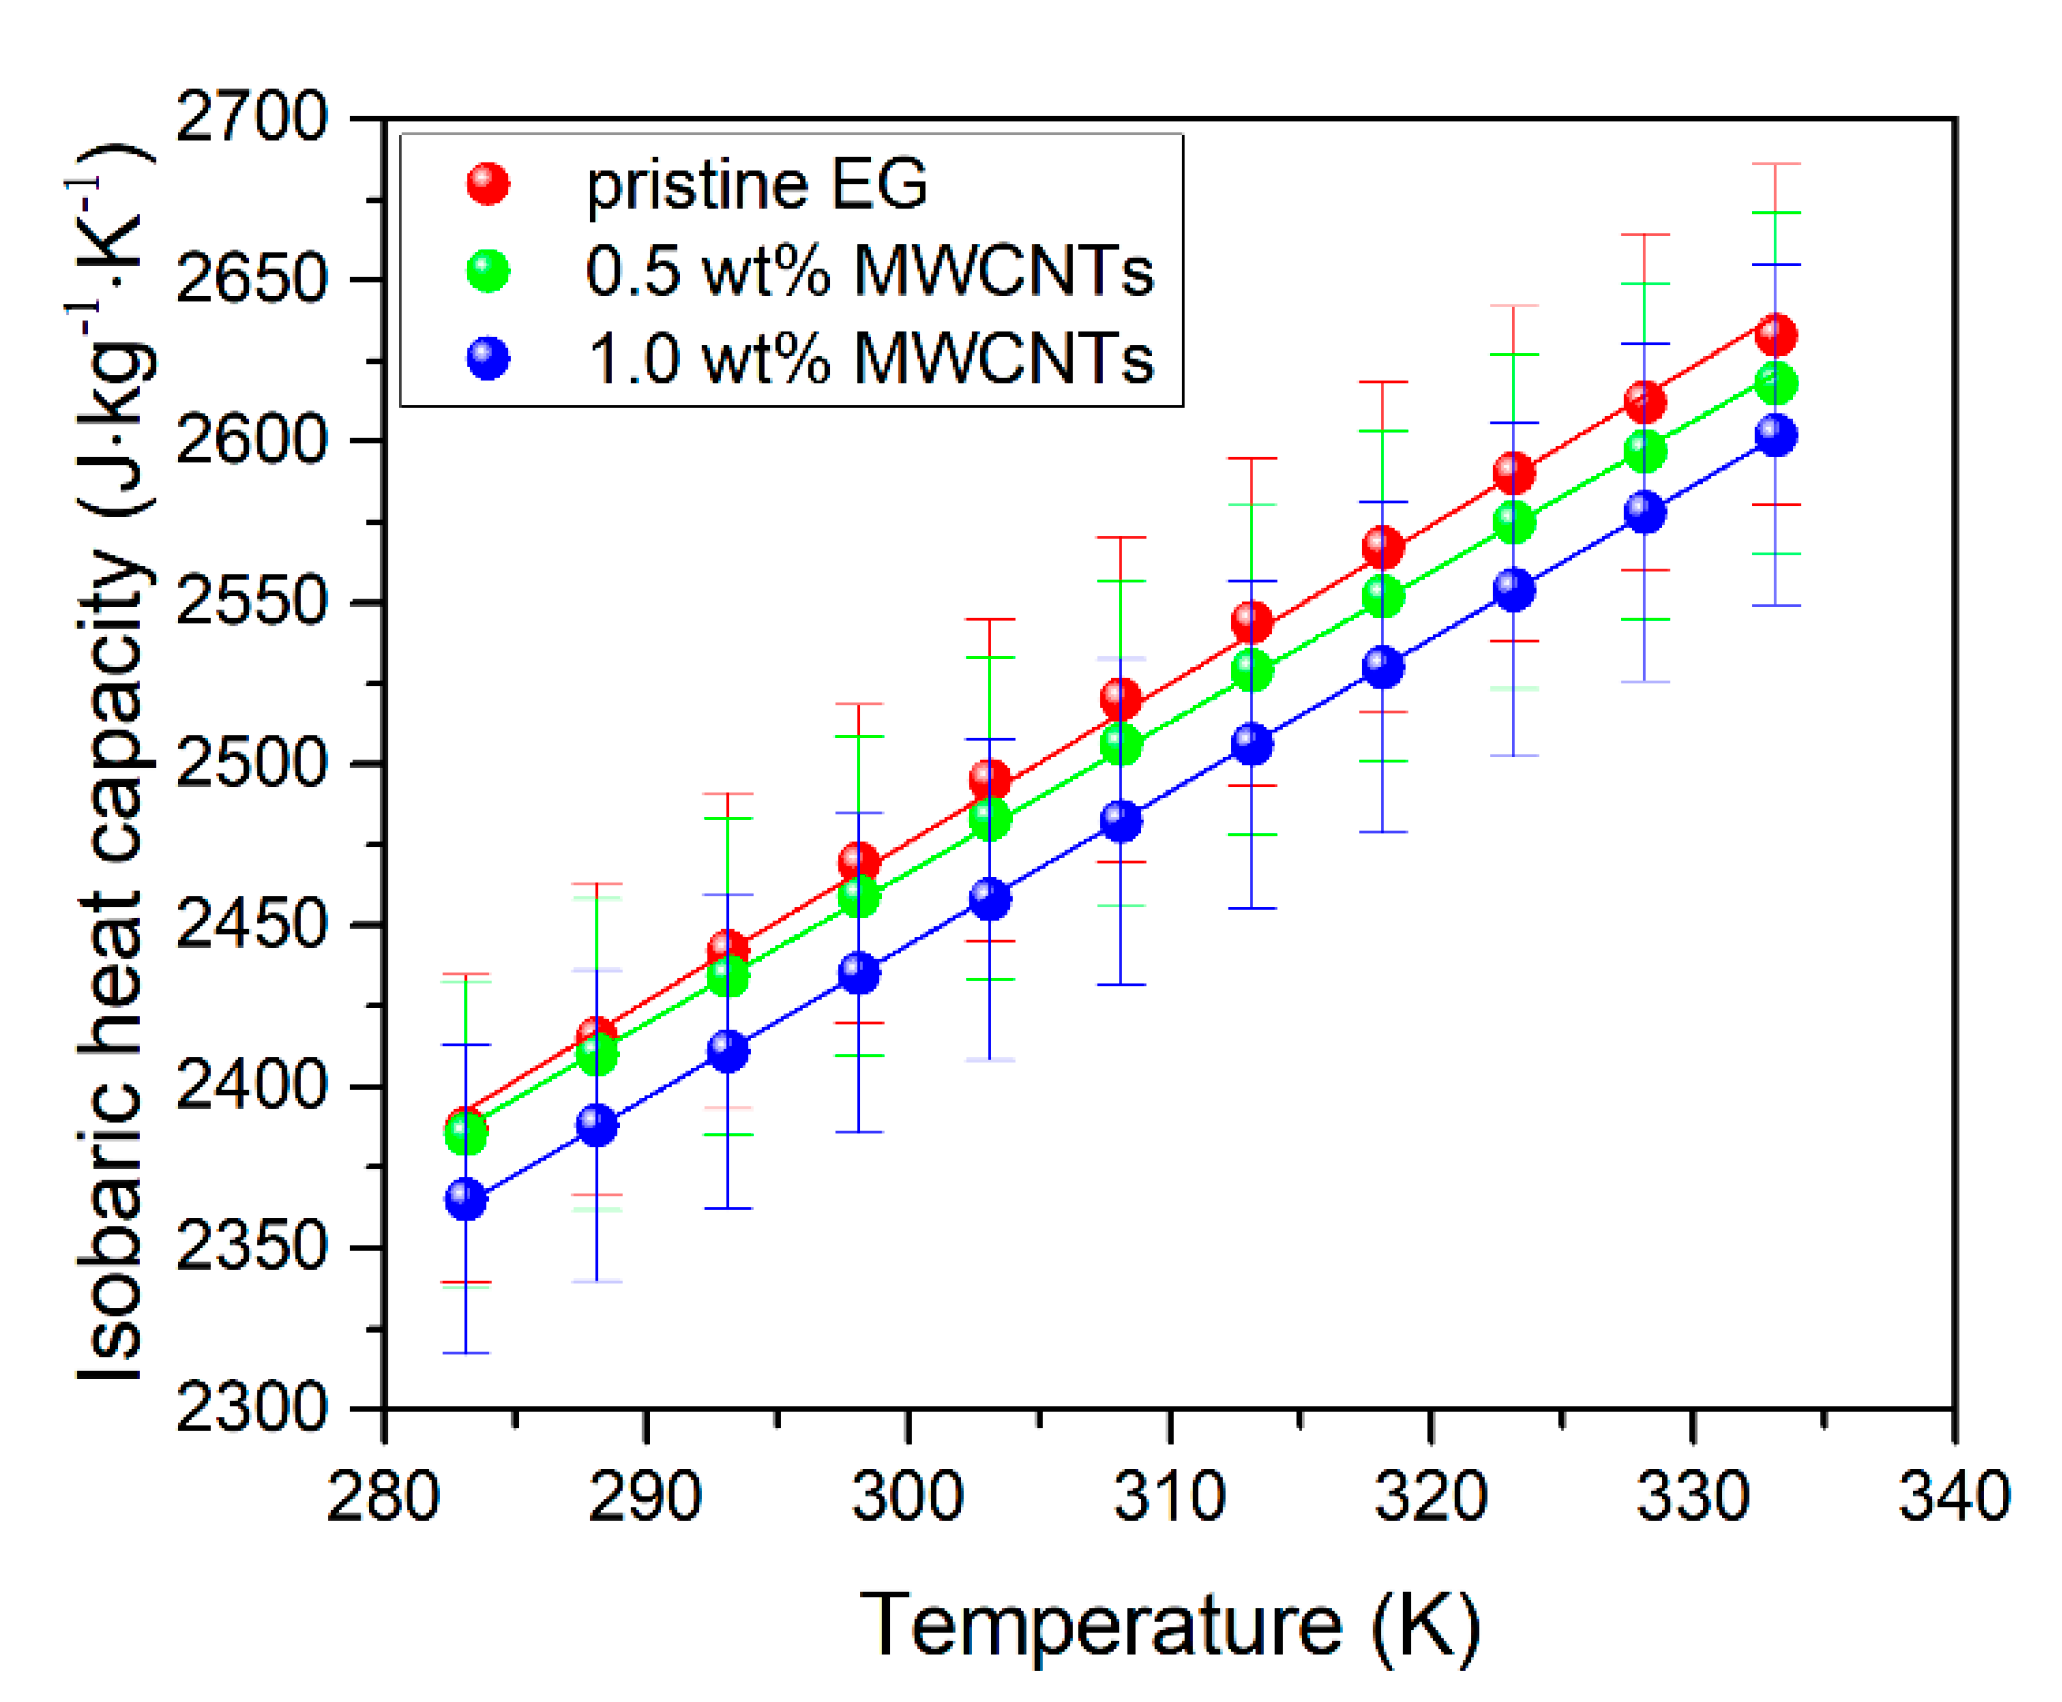
3.4. Isobaric Heat Capacity

The isobaric heat capacity of EG and nanofluids containing 0.5 wt% and 1.0 wt% of MWCNTs was measured in the temperature range from 283.15 K to 333.15 K in 5 K steps. The obtained results are listed in Table 7 and presented in Figure 7.

3.5. Prandtl Number

The Prandtl number (Pr) of EG and nanofluids containing 0.5 wt% and 1.0 wt% of MWCNTs at temperatures of 298.15 K, 303.15 K, and 308.15 K, was calculated based on Equation (3). The obtained results are listed in Table 8 and presented in Figure 8.
P r = C p η λ

4. Discussion and Conclusions

Referring back to Figure 1, pristine 760 μm-long MWCNTs (Figure 1)—serving as the dispersed phase in nanofluids—were obtained via c-CVD. Macroscopically, MWCNT grew as vertically aligned films (Figure 1a) composed of straight, low-defect, several-dozen-wall nanotubes (Figure 1b). Importantly, all NFs–obtained via the elaborated three-stage protocol emerged as stable, black dispersions. Notably, in the range from 0 to 1 wt.%, the relationship between MWCNT concentration and thermal conductivity of NFs was fully linear. The maximum enhancement in thermal conductivity compared to the base liquid was found equal to 31.5% for NF containing 1 wt% in-house 16h MWCNTs. Such an increase could be linked purely to the behavior of MWCNTs, which acted as ‘thermal bridges’ in the continuous EG-phase. The overall effect is, hence, the generation of preferential paths enabling more efficient heat transfer. Additionally, as essential from the application point-of-view, MWCNT-EG NFs—in the entire range of nanotube concentrations tested herein–emerged as Newtonian fluids, enabling minimized pressure losses throughout the pumping. Being still in the application area, an increase in the density of NFs with MWCNT concentration was at the minimum level. At the same time, the isobaric thermal expansion coefficient of EG-based NFs as compared with base EG could be treated as insignificant. Importantly, since Pr >> 1, the momentum diffusivity dominates over the thermal diffusivity. Consequently, the thermal boundary layer is much thinner when compared to the velocity boundary layer. Overall, the analysis of the above criteria proves that NFs based on long MWCNTs—dispersed in EG in the presence of PVP as a stabilizer—constitute an excellent prognostic for their prospective application as heat transfer media.

Author Contributions

Conceptualization: K.B., M.D., and S.B. Validation: K.B., B.J., A.G., M.D., and S.B. Investigation: K.B., B.J., A.G., M.D., and S.B. Writing—original draft preparation: S.B. Writing—review and editing: K.B., B.J., and M.D. Visualization: B.J., M.D., and S.B. Formal analysis: A.G. All authors have read and agreed to the published version of the manuscript.

Funding

B.J., A.G., S.B., and M.D. thank the NATIONAL SCIENCE CENTRE (POLAND), grant number 2017/27/B/ST4/02748 for the financial support in the synthesis of in-house 16h MWCNTs.

Acknowledgments

The authors are very grateful to Barbara Maciejewska and Karin H. Müller for acquiring SEM and TEM images.

Conflicts of Interest

The authors declare no conflict of interest.

Nomenclature

a0polynomial coefficient in Equation (1)kg⋅m−3
a1polynomial coefficient in Equation (1)kg⋅m−3⋅K–1
a2polynomial coefficient in Equation (1)kg⋅m−3⋅K–2
Cpisobaric heat capacityJ·kg–1·K–1
dnanotube diameternm
lnanotube lengthnm
PrPrandtl number
SDstandard deviation of densitykg·m−3
Ttemperature K
αpisobaric thermal expansion coefficientK–1
δρmean deviation of densitykg·m−3
ηdynamic viscositymPa·s
λthermal conductivityW·m–1·K–1
ρdensitykg⋅m−3

References

  1. Jóźwiak, B.; Boncel, S. Rheology of ionanofluids—A review. J. Mol. Liq. 2020, 302, 112568. [Google Scholar] [CrossRef]
  2. Okonkwo, E.C.; Wole-Osho, I.; Almanassra, I.W.; Abdullatif, Y.M.; Al-Ansari, T. An updated review of nanofluids in various heat transfer devices. J. Therm. Anal. Calorim. 2020, 1–56. [Google Scholar] [CrossRef]
  3. Żyła, G.; Vallejo, J.P.; Fal, J.; Lugo, L. Nanodiamonds—Ethylene Glycol nanofluids: Experimental investigation of fundamental physical properties. Int. J. Heat Mass Transf. 2018, 121, 1201–1213. [Google Scholar] [CrossRef]
  4. Barai, D.P.; Bhanvase, B.A.; Sonawane, S.H. A Review on Graphene Derivatives-Based Nanoflfluids: Investigation on Properties and Heat Transfer Characteristics. Ind. Eng. Chem. Res. 2020, 59, 10231–10277. [Google Scholar] [CrossRef]
  5. Mirsaeidi, A.M.; Yousefi, F. Viscosity, thermal conductivity and density of carbon quantum dots nanofluids: An experimental investigation and development of new correlation function and ANN modeling. J. Therm. Anal. Calorim. 2019, 1–11. [Google Scholar] [CrossRef]
  6. Tam, N.T.; Phuong, N.V.; Khoi, P.H.; Minh, P.N.; Afrand, M.; Van Trinh, P.; Thang, B.H.; Żyła, G.; Estellé, P. Carbon Nanomaterial-Based Nanofluids for Direct Thermal Solar Absorption. Nanomaterials 2020, 10, 1199. [Google Scholar] [CrossRef]
  7. Ghalandari, M.; Maleki, A.; Haghighi, A.; Shadloo, M.S.; Nazari, M.A.; Tlili, I. Applications of nanofluids containing carbon nanotubes in solar energy systems: A review. J. Mol. Liq. 2020, 313, 113476. [Google Scholar] [CrossRef]
  8. De Volder, M.; Tawfick, S.H.; Baughman, R.H.; Hart, A.J. Carbon Nanotubes: Present and Future Commercial Applications. Science 2013, 339, 535–539. [Google Scholar] [CrossRef] [Green Version]
  9. Xie, H.; Chen, L. Adjustable thermal conductivity in carbon nanotube nanofluids. Phys. Lett. A 2009, 373, 1861–1864. [Google Scholar] [CrossRef]
  10. Liu, M.-S.; Lin, M.C.-C.; Huang, I.-T.; Wang, C.-C. Enhancement of thermal conductivity with carbon nanotube for nanofluids. Int. Commun. Heat Mass Transf. 2005, 32, 1202–1210. [Google Scholar] [CrossRef]
  11. Kumar, P.G.; Kumaresan, V.; Velraj, R. Stability, viscosity, thermal conductivity, and electrical conductivity enhancement of multi-walled carbon nanotube nanofluid using gum arabic. Fuller. Nanotub. Carbon Nanostruct. 2017, 25, 230–240. [Google Scholar] [CrossRef]
  12. Boncel, S.; Zniszczoł, A.; Pawlyta, M.; Labisz, K.; Dzido, G. Heat transfer nanofluid based on curly ultra-long multi-wall carbon nanotubes. Heat Mass Transf. 2017, 54, 333–339. [Google Scholar] [CrossRef] [Green Version]
  13. Jóźwiak, B.; Dzido, G.; Zorębski, E.; Kolanowska, A.; Jȩdrysiak, R.; Dziadosz, J.; Libera, M.; Boncel, S.; Dzida, M. Remarkable Thermal Conductivity Enhancement in Carbon-Based Ionanofluids: Effect of Nanoparticle Morphology. ACS Appl. Mater. Interfaces 2020, 12, 38113–38123. [Google Scholar] [CrossRef] [PubMed]
  14. Sahgal, A.; Hayduk, W. Ethylene solubility and diffusivity in hexane-dodecane and ethylene glycol-butanol solutions. J. Chem. Eng. Data 1979, 24, 222–227. [Google Scholar] [CrossRef]
  15. Matsumoto, Y.; Touhara, H.; Nakanishi, K.; Watanabe, N. Molar excess enthalpies for water + ethanediol, + 1,2-propanediol, and + 1,3-propanediol at 298.15 K. J. Chem. Thermodyn. 1977, 9, 801–805. [Google Scholar] [CrossRef]
  16. Zemánková, K.; Troncoso, J.; Romaní, L. Excess volumes and excess heat capacities for alkanediol+water systems in the temperature interval (283.15–313.15) K. Fluid Phase Equilibria 2013, 356, 1–10. [Google Scholar] [CrossRef]
  17. Douhéret, G.; Pal, A. Dielectric constants and densities of aqueous mixtures of 2-alkoxyethanols at 25.degree.C. J. Chem. Eng. Data 1988, 33, 40–43. [Google Scholar] [CrossRef]
  18. Zorębski, E.; Lubowiecka-Kostka, B. Thermodynamic and transport properties of (1,2-ethanediol+1-nonanol) at temperatures from (298.15 to 313.15) K. J. Chem. Thermodyn. 2009, 41, 197–204. [Google Scholar] [CrossRef]
  19. Zorębski, E.; Waligóra, A. Densities, Excess Molar Volumes, and Isobaric Thermal Expansibilities for 1,2-Ethanediol + 1-Butanol, or 1-Hexanol, or 1-Octanol in the Temperature Range from (293.15 to 313.15) K. J. Chem. Eng. Data 2008, 53, 591–595. [Google Scholar] [CrossRef]
  20. Cocchi, M.; Marchetti, A.; Pigani, L.; Sanna, G.; Tassi, L.; Ulrici, A.; Vaccari, G.; Zanardi, C. Density and volumetric properties of ethane-1,2-diol+di-ethylen-glycol mixtures at different temperatures. Fluid Phase Equilibria 2000, 172, 93–104. [Google Scholar] [CrossRef]
  21. Jiménez, E.; Cabanas, M.; Segade, L.; García-Garabal, S.; Casas, H. Excess volume, changes of refractive index and surface tension of binary 1,2-ethanediol + 1-propanol or 1-butanol mixtures at several temperatures. Fluid Phase Equilibria 2001, 180, 151–164. [Google Scholar] [CrossRef]
  22. Corradini, F.; Franchini, G.; Marchetti, A.; Tagliazucchi, M.; Tassi, L.; Tosi, G. Viscosities of 1,2-Ethanediol-2-Methoxyethanol solvent mixtures at various temperatures. J. Solut. Chem. 1993, 22, 1019–1028. [Google Scholar] [CrossRef]
  23. Pastoriza-Gallego, M.; Lugo, L.; Cabaleiro, D.; Legido, J.; Piñeiro, M. Thermophysical profile of ethylene glycol-based ZnO nanofluids. J. Chem. Thermodyn. 2014, 73, 23–30. [Google Scholar] [CrossRef]
  24. Pastoriza-Gallego, M.J.; Lugo, L.; Legido, J.L.; Piñeiro, M.M. Thermal conductivity and viscosity measurements of ethylene glycol-based Al2O3 nanofluids. Nanoscale Res. Lett. 2011, 6, 221. [Google Scholar] [CrossRef] [PubMed] [Green Version]
  25. Moosavi, M.; Taghizadeh, K.; Gholami, M.; Rostami, A.A. Thermodynamic and transport properties of acetonitrile + alkanediols liquid mixtures at different temperatures, experimental measurements and modeling. J. Chem. Thermodyn. 2017, 113, 236–249. [Google Scholar] [CrossRef]
  26. Decagon Devices Inc. KD2 Pro Thermal Properties Analyzer–Operator’s Manual; Decagon Devices Inc.: Pullman, WA, USA, 2016; Available online: http://manuals.decagon.com/Manuals/13351_KD2%20Pro_Web.pdf (accessed on 10 December 2020).
Figure 1. (a) SEM image—side view of the vertically aligned multi-walled carbon nanotube (MWCNT) array. (b) TEM image of an individual, representative of MWCNT.
Fluids 05 00241 g001
Figure 2. (a) Schematic overview of nanofluid composed from Poly(N-vinylpyrrolidone) (PVP)-stabilized long MWCNTs in ethylene glycol, (b) scheme of preparation of nanofluids, and (c) photographs of nanofluids at MWCNT concentration of 0.25, 0.5, 0.75, and 1 wt%, respectively.
Fluids 05 00241 g002
Figure 3. The influence of temperature and concentration of MWCNTs on the thermal conductivity of EG and EG-based NFs. Solid lines–linear trends.
Fluids 05 00241 g003
Figure 4. (a) The influence of temperature on the viscosity of EG and EG-based NFs. (b) The viscosity curve of NF containing EG and 1 wt% in-house 16h MWCNTs at 298.15 K. Solid lines—cubic trends (a) and linear trend (b).
Fluids 05 00241 g004
Figure 5. The influence of temperature on the density of EG and EG-based NFs. Solid lines—linear trends.
Fluids 05 00241 g005
Figure 6. The influence of temperature on the isobaric thermal expansion coefficient of EG and EG-based NFs. Solid lines—linear trends.
Fluids 05 00241 g006
Figure 7. The influence of temperature on the isobaric heat capacity of EG and EG-based NFs. Solid lines—linear trends.
Fluids 05 00241 g007
Figure 8. The influence of temperature on the Prandtl number of EG and EG-based NFs. Solid lines–linear trends.
Fluids 05 00241 g008
Table 1. Density, ρ, viscosity, η, and thermal conductivity, λ, of ethylene glycol (EG) at 298.15 K compared with the literature data.
Physicochemical PropertyThis WorkLiterature
ρ (kg⋅m−3)1109.84 ± 0.051109.60 [14], 1109.89 [15], 1109.79 [16], 1109.82 [17], 1109.88 [18], 1109.88 [19], 1109.91 [20], 1110.09 [21]
η (mPa·s)17.1 ± 3.016.95 [18], 17.14 [22], 17.25 [23], 17.7 [24]
λ (W·m−1·K−1)0.247 ± 5%0.245 [24], 0.2433 [25]
Table 2. Characteristics of long multi-walled carbon nanotubes (MWCNTs) used in this study.
NameAverage Length
(μm)
Average Diameter
(nm)
Aspect Ratio
(−)
Specific Surface Area
(m2⋅g−1)
Density (g⋅cm−3)Carbon Purity
(%)
in-house 16h MWCNTs77060–8011,000222.198
Table 3. Thermal conductivity of EG and NFs in the temperature range from 298.15 K to 308.15 K.
T (K)λ (W·m−1·K−1)
Series 1Series 2Series 3MeanSeries 1Series 2Series 3Mean
EGEG + 0.25 wt% in-house 16h MWCNTs
298.150.2470.2460.2470.2470.2700.2690.2690.269
303.150.2460.2460.2450.2460.2690.2680.2680.268
308.150.2470.2450.2430.2450.2650.2620.2640.264
EG + 0.5 wt% in-house 16h MWCNTsEG + 0.75 wt% in-house 16h MWCNTs
298.150.2860.2850.2860.2860.3000.3040.3060.303
303.150.2850.2840.2840.2840.3000.3020.3040.302
308.150.2780.2820.2840.2810.2970.3020.3030.301
EG + 1 wt% in-house 16h MWCNTs
298.150.3250.3240.3250.324
303.150.3170.3190.3200.318
308.150.3100.3120.3140.312
Table 4. Density of EG and NFs in the temperature range from 283.15 K to 333.15 K.
T (K)ρ (kg·m−3)T (K)ρ (kg·m−3)T (K)ρ (kg·m−3)
EG EG + 0.25 wt% in-house 16h MWCNTs EG + 0.5 wt% in-house 16h MWCNTs
283.151120.25283.151121.83283.151123.68
288.151116.78288.151118.36288.151120.22
293.151113.29293.151114.87293.151116.73
298.151109.84298.151111.38298.151113.24
303.151106.29303.151107.87303.151109.73
308.151102.77308.151104.35308.151106.21
313.151099.23313.151100.81313.151102.68
318.151095.68318.151097.26318.151099.13
323.151092.11323.151093.69323.151095.56
328.151088.52328.151090.10328.151091.97
333.151084.90333.151086.48333.151088.36
EG + 0.75 wt% in-house 16h MWCNTs EG + 1 wt% in-house 16h MWCNTs
283.151125.30283.151127.18
288.151121.84288.151123.73
293.151118.36293.151120.26
298.151114.88298.151116.77
303.151111.38303.151113.27
308.151107.86308.151109.76
313.151104.34313.151106.24
318.151100.79318.151102.69
323.151097.22323.151099.13
328.151093.63328.151095.54
333.151090.02333.151091.93
Table 5. Polynomial coefficients (ai) with standard deviations (SD) and mean deviations (δρ) from the regression lines depending on NF concentration.
Concentration
(wt%)
a0
(kg⋅m−3)
SD
(kg⋅m−3)
a1
(kg⋅m−3⋅K−1)
SD
(kg⋅m−3⋅K−1)
a2⋅104
(kg⋅m−3⋅K−2)
SD⋅104
(kg⋅m−3⋅K−2)
δρ
(kg⋅m−3)
01120.250.0067−0.690780.00062−3.19350.120.0097
0.251121.820.0061−0.691190.00056−3.08160.110.0080
0.51123.680.0054−0.690850.00050−3.05830.100.0071
0.751125.290.0064−0.688780.00059−3.29140.110.0084
11127.180.0062−0.688230.00057−3.29600.110.0081
Table 6. Isobaric thermal expansion coefficient of EG and NFs in the temperature range from 283.15 K to 333.15 K.
T (K)αp·104 (K−1)T (K)αp·104 (K−1)T (K)αp·104 (K−1)
EG EG + 0.25 wt% in-house 16h MWCNTs EG + 0.5 wt% in-house 16h MWCNTs
283.156.166283.156.161283.156.148
288.156.214288.156.208288.156.194
293.156.262293.156.255293.156.241
298.156.310298.156.303298.156.288
303.156.359303.156.350303.156.335
308.156.409308.156.399308.156.383
313.156.458313.156.447313.156.431
318.156.508318.156.496318.156.480
323.156.559323.156.545323.156.529
328.156.610328.156.595328.156.579
333.156.661333.156.646333.156.628
EG + 0.75 wt% in-house 16h MWCNTs EG + 1 wt% in-house 16h MWCNTs
283.156.121283.156.106
288.156.169288.156.154
293.156.218293.156.202
298.156.266298.156.251
303.156.316303.156.300
308.156.366308.156.350
313.156.416313.156.400
318.156.466318.156.451
323.156.517323.156.501
328.156.569328.156.553
333.156.621333.156.605
Table 7. Isobaric heat capacity of EG and NFs in the temperature range from 283.15 K to 333.15 K.
T (K)Cp (J·kg−1·K−1)T (K)Cp (J·kg−1·K−1)T (K)Cp (J·kg−1·K−1)
EG EG + 0.5 wt% in-house 16h MWCNTs EG + 1 wt% in-house 16h MWCNTs
283.152387283.152385283.152365
288.152415288.152410288.152388
293.152442293.152434293.152411
298.152469298.152459298.152435
303.152495303.152483303.152458
308.152520308.152506308.152482
313.152544313.152529313.152506
318.152567318.152552318.152530
323.152590323.152575323.152554
328.152612328.152597328.152578
333.152633333.152618333.152602
Table 8. Prandtl number of EG and NFs in the temperature range from 298.15 K to 308.15 K.
T (K)Pr (–)T (K)Pr (–)T (K)Pr (–)
EG EG + 0.5 wt% in-house 16h MWCNTs EG + 1 wt% in-house 16h MWCNTs
298.15170.9298.15211.5298.15257.0
303.15141.0303.15178.4303.15222.6
308.15117.3308.15149.8308.15195.7
Publisher’s Note: MDPI stays neutral with regard to jurisdictional claims in published maps and institutional affiliations.

