Efficiency Improvement of Miniaturized Heat Exchangers


1
Safetec Entsorgungs- und Sicherheitstechnik GmbH, Kurpfalzring 98a, 69123 Heidelberg, Germany
2
Institute for Thermal Process Engineering, Karlsruhe Institute of Technology KIT, CS, Kaiserstrasse 12, 76131 Karlsruhe, Germany
3
Institute of Microstructure Technology IMT, Karlsruhe Institute of Technology KIT, CN, Hermann-von-Helmholtz-Platz 1, D-76344 Eggenstein-Leopoldshafen, Germany
*
Author to whom correspondence should be addressed.
Fluids 2021, 6(1), 25; https://0-doi-org.brum.beds.ac.uk/10.3390/fluids6010025
Submission received: 18 November 2020
/
Revised: 18 December 2020
/
Accepted: 2 January 2021
/
Published: 6 January 2021
(This article belongs to the Special Issue Recent Advances in Single and Multiphase Flows in Microchannels)
Abstract
:Micro heat exchangers have been revealed to be efficient devices for improved heat transfer due to short heat transfer distances and increased surface-to-volume ratios. Further augmentation of the heat transfer behaviour within microstructured devices can be achieved with heat transfer enhancement techniques, and more precisely for this study, with passive enhancement techniques. Pin fin geometries influence the flow path and, therefore, were chosen as the option for further improvement of the heat transfer performance. The augmentation of heat transfer with micro heat exchangers was performed with the consideration of an improved heat transfer behaviour, and with additional pressure losses due to the change of flow path (pin fin geometries). To capture the impact of the heat transfer, as well as the impact of additional pressure losses, an assessment method should be considered. The overall exergy loss method can be applied to micro heat exchangers, and serves as a simple assessment for characterization. Experimental investigations with micro heat exchanger structures were performed to evaluate the assessment method and its importance. The heat transfer enhancement was experimentally investigated with microstructured pin fin geometries to understand the impact on pressure loss behaviour with air.
1. Introduction
Energy efficiency with respect to thermal management is an important factor in many areas of industry and technology. An improvement in heat transfer enables options for intensifying processes and reducing energy losses, as well as the wasting of energy.
The continuous demand for heat transfer enhancement in the last decades was addressed by, amongst other techniques, the development of micro heat exchangers. Micro heat exchangers provide an efficient and flexible tool, depending on the technical application. In 1981 Tuckerman and Pease [1] were amongst the first researchers to perform heat transfer with microstructures. They showed that micro heat exchangers are efficient devices for improved heat transfer due to several reasons, amongst which are short heat transfer distances and increased surface-to-volume ratios. In general, the performance of miniaturized heat exchangers in terms of heat transfer is superior to macroscopic devices [2,3,4]. However, there is always room for improvement, especially due to the fact that enhanced heat transfer in miniaturized devices mostly comes along with increased pressure losses, resulting in a reduced total performance of the heat transfer systems [5,6,7,8,9,10,11]. Due to this, there is a need for a precise characterization and comparison of micro heat exchangers to obtain assessment methods which take into account the effects on pressure loss behavior and heat transfer behavior simultaneously. The impact of geometric aspects, as well as fluid properties, on the pressure loss should be considered, especially when using gas flows. Using gas flows results in the stronger influence of effects, such as compressibility and axial heat conduction, which have to be taken into account [12,13,14]. To assess the ratio between a possible gain in heat transfer performance and a loss in pressure, the overall exergy loss method can be applied to micro heat exchangers, and serves as a simple method for heat exchanger characterization and comparison [15,16]. Dealing with all the named effects a more comprehensive definition of the overall heat exchanger efficiency can be provided, leading to a well-defined comparability of the devices in terms of their thermal and fluidic capacities. Thus, the applicability of microstructure heat exchanger designs to certain processes can be decided easily.
2. Materials and Methods
Micro heat exchangers are generally characterized by small characteristic dimensions, below 0.001 m, which is the reason for their high heat transfer capabilities. A commonly used characteristic dimension, namely the hydraulic diameter (dh) is calculated as follows [17]
where A is the cross sectional area in (m2) and C is the perimeter in (m) of a single micro channel. The impact of the hydraulic diameter on the heat transfer performance can be demonstrated with the overall heat transfer coefficient, h in []. This is a function of the heat transfer coefficients of the hot and the cold side (αh, αc), and the wall thickness and thermal conductivity of the separation wall (s, λ):
The wall thickness (s) and thermal conductivity (λ) are, in general, valid for a flat surface only, but can be used as a good approximation for miniaturized heat exchangers due to the small value of s. The thermal contact resistance from the fluid to the separation sheet shows in the considered case no significant impact on the overall heat transfer coefficient.
The heat transfer coefficients are affected by physical properties of the fluids and the flow conditions, such as the flow velocity and laminar or turbulent flow behavior. Another influence is the geometric characteristic of the flow path. The heat transfer coefficient (α) is presented in the following equation:
with Nu as Nusselt number, λ as the thermal conductivity of the fluid, and dh as hydraulic diameter, defined in Equation (1). Nu gives the ratio of the characteristic length to the thermal boundary layer thickness, and can be assumed to be nearly constant under laminar flow conditions. With Equation (3), the overall heat transfer coefficient (h) under laminar flow conditions becomes a function of geometric parameters, namely dh, and the separation thickness, s:
The heat transfer rate in (W) is determined by three parameters, namely the temperature difference (ΔT) in (K), the heat transfer surface (Aht) in (m2) and the overall heat transfer coefficient, h:
From Equation (5) it is easy to see that the heat transfer rate increases with higher temperature difference. However, ΔT is, in most cases, fixed by the process fluids running through the heat exchanger. The heat transfer area (Aht) is limited by the design of the heat exchanger and the integrated (micro-) structures. Hence, shrinking dh and s is the easiest way to increase the heat transfer rate.
On the other hand, this is a critical point because the pressure loss is strongly related to this parameter, and increases with decreasing dh. This becomes obvious when, e.g., looking at the Hagen–Poiseuille law for calculating pressure loss (Δp) in a channel with a circular cross sectional area and laminar flow conditions, as given in Equation (6):
with μ as the dynamic viscosity of the fluid in (), as volumetric flow rate in (), L as the micro channel length in (m), and u as flow velocity in (). The figure of (6) indicates clearly that dh has a high impact on the pressure losses of heat exchangers.
Further limitations, like the increased impact of corrosion and the fouling or blocking of micro channels due to particles shall not be discussed here, as they are widely considered in the literature [10,18]. Regularly, the surface quality of the microstructures has to be taken into account, as well as the possibilities for manufacturing the microstructures. Example descriptions can be found in [4,19,20]. Many kinds of materials, like polymers, metals, ceramics, or glass are possible for generating microstructure heat exchangers [20,21]. During the operation of microstructure heat exchangers the access for measurement is difficult because sensors such as temperature or pressure sensors will in general influence the fluidic behavior. Therefore, computational fluid dynamics is widely used to predict the heat transfer behavior inside microstructure heat exchangers. These issues shall also not be part of the present discussions, they are described sufficiently well in the literature.
2.1. Fluids
Heat transfer behavior can moreover be drastically influenced by the choice of fluid, due to its properties. In this study we will focus on one compressible fluid, namely air. The temperature under investigation ranges from approximately T = 273.15 K up to T = 373.15 K, with a pressure range from approximately p = 100 kPa (rel) up to a maximum p = 1000 kPa (rel). Table 1 presents the properties of air at T = 293.15 K and p = 100 kPa (rel).
As mentioned, air is a compressible gas, i.e., the fluid properties are temperature and pressure dependent. Air has a much lower specific heat capacity and thermal conductivity in comparison to water or other liquids. These thermal properties and the effect of compressibility result in deviations of gas flows in microstructures compared to liquid, incompressible fluid flows. The simplest way to handle gas is using the ideal gas law. However, this is not truly correct, since several specific considerations on rarefaction and compressibility have to be made, which are intensified when the characteristic dimensions of the heat exchanger become small [22,23]. Rarefaction is a condition which deviates from continuum flow, described by the Knudsen number (Kn). With increasing Kn the Navier–Stokes equations become less valid, and the collisions of gas molecules with the walls gain increased impact [22].
A strong influence of temperature can be detected for thermal conductivity and the dynamic viscosity of air. This will be taken into account in the following. The deviation of the specific heat capacities is less than 1.8% for both, the temperature and pressure influence. Therefore, the influences will be neglected. This result can be underscored by the compressibility factor (Z), which is defined according to the ideal gas law, as follows:
with p and T as pressure and temperature, υ as the specific volume, and Rs as the specific gas constant of the fluid. The compressibility factor considers the deviation of a real gas from an ideal gas behavior.
For air flow in the investigated temperature and pressure ranges the compressibility factor deviates by less than 0.8%. Therefore, air in the above mentioned temperature and pressure ranges can be assumed to be an ideal gas, and the following equation for ideal gases is valid:
with cv as the specific isochoric heat capacity, cp as the specific isobaric heat capacity, and R as the universal gas constant. Finally, the density shows a strong influence of temperature and pressure. With the validity of air as an ideal gas, the density will be considered with the ideal gas law. Table 2 shows the deviations from standard values of the fluid properties at the maximum of the investigated temperature and pressure ranges.
The consideration of gas-to-gas heat transfer in micro heat exchangers is the topic of only a few literature sources, as has been observed previously by Yang et al. [12]. They summarized the existing literature references until 2012. The cited references detected strong axial heat conduction along the solid walls, which led the authors to the assumption of isothermal behavior in the investigated micro heat exchangers [13,14,24,25].
The influence of axial heat conduction has also been previously investigated by Yang et al. [13]. Among the few literature sources, only Kee et al. [26] examined the behavior of heat transfer in a ceramic micro heat exchanger, with an improved flow path providing none-channel microstructures. Depending on the material used for a micro heat exchanger, Rac describes the thermal resistance to axial heat conduction, and can be calculated as follows:
with Rpw and Rwall as thermal resistance of the partitioning wall and the channel wall or the thermal resistance of the pins. s, W, and λp-w describe the thickness, the total width, and the thermal conductivity of the partitioning wall. swall, Hwall, λwall, and Lwall describe the thickness, the total height, the thermal conductivity, and the length of the channel wall or the pin fins. In the case of microchannels, L equals LWall, in the case of pin fin arrangements the two values differ from each other. The parameter Y varies for each microstructure arrangement.
2.2. Microstructure Designs
In this study, we investigated three different microstructures, namely a channel structure and two pin-fin-array microstructures, one with parallel pins, another with staggered pins. Table 3 shows the parameter Y depending on the number of channels or the number of pin fins in parallel or in a row; nchannel, nparallel, and nrow.
Fluid dynamic aspects like the flow regime have to be considered when dealing with heat transfer enhancement by different microstructure geometries. A measure for the flow regime is the Reynolds number, Re, which is defined by
with u as the flow velocity (), dh as hydraulic diameter (m) and, therefore as the characteristic length, and ν as the kinematic viscosity (). In general, simple linear soft micro channels result in laminar flow conditions unless the flow speed is very high. Thus, heat transfer is limited here. The flow disruption and, therefore, transition from laminar flow regime to turbulent flow regime depends on different parameters; based on the definition of the Reynolds number, increased flow velocities or increased characteristic dimensions cause a transition. In addition, the fluid is an important parameter to be considered, i.e., higher viscosities promote laminar flow behavior. The compressible effect of gases leads to strong pressure losses along the flow path due to flow friction and, therefore, density variations which result in increased flow velocities.
Another option for generating a flow disruption and to change the flow behavior of the laminar flow regime is to produce artificially induced local turbulences. The artificially induced local turbulences can be generated due to external power or a specific flow path design. As an example, a first artificially induced local turbulence is an increased roughness of the surrounding surface. Further methods, which generate the transition of flow regime and increase heat transfer behavior, are named heat transfer enhancement techniques. External or active enhancement techniques have been described by Steinke and Kandlikar [27]. In the named review they moreover classified passive enhancement techniques in terms of surface roughness, flow disruptions (pin fin), channel curvature, and others [27]. The authors presented a summary of enhancement techniques for active and passive techniques in comparison to conventional, mini channel, and micro channel implementation. The combination of both techniques is an option for a third method group [28]. Although it was published for the first time over 25 years ago, in 1994, this classification is still valid.
In conclusion, the decision of which enhancement technique is appropriate regarding heat transfer and pressure losses for maximizing overall heat exchanger efficiency, is difficult to make and should be decided considering each case separately. In addition, the applicability of the enhancement techniques to micro heat exchangers has to be evaluated and verified. Manufacturing techniques, material, and fluid properties have to be considered in designing enhanced micro heat exchangers.
The emphasis of the present study is the use of passive techniques, especially of modified surface geometries for micro heat exchangers. We will furthermore focus on flow disruptions, the so-called pin fin geometries.
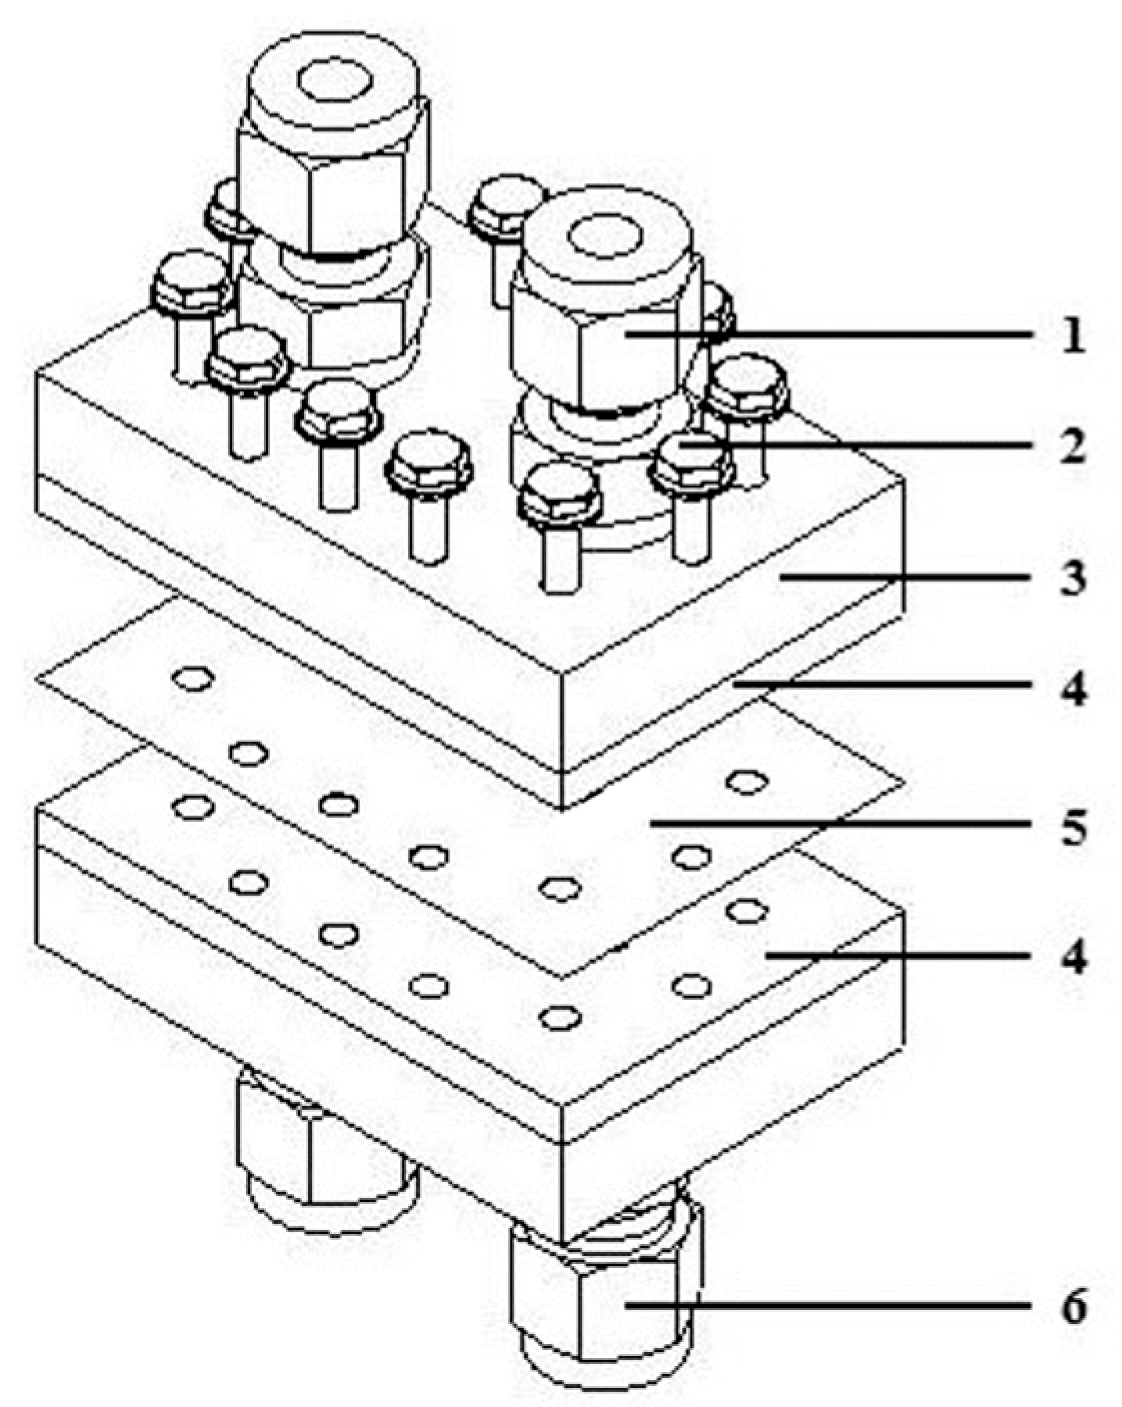
To examine the effects of different pin fin geometries, a specific clamped microstructure heat exchanger was designed and manufactured (see Figure 1). The core of the clamped micro heat exchanger consists of two plates with microstructures (labelled 4 in Figure 1) that are divided by a partitioning foil (labelled 5 in Figure 1). This microstructure test section was assembled with screws and seals between a cover plate (labelled 3 in Figure 1) and a bottom plate (same as the cover plate). The cover and the bottom plates enable access to conventional pipe connections (labelled 1 in Figure 1) in each case for gas inlet and gas outlet. The simple composition of the device provides the possibility to exchange the material of the cover and bottom plates. In addition, the partitioning foil material and thickness can be exchanged, and the plates with the microstructures can be easily replaced. The experimental device is shown in Figure 1 as an exploded view CAD drawing.
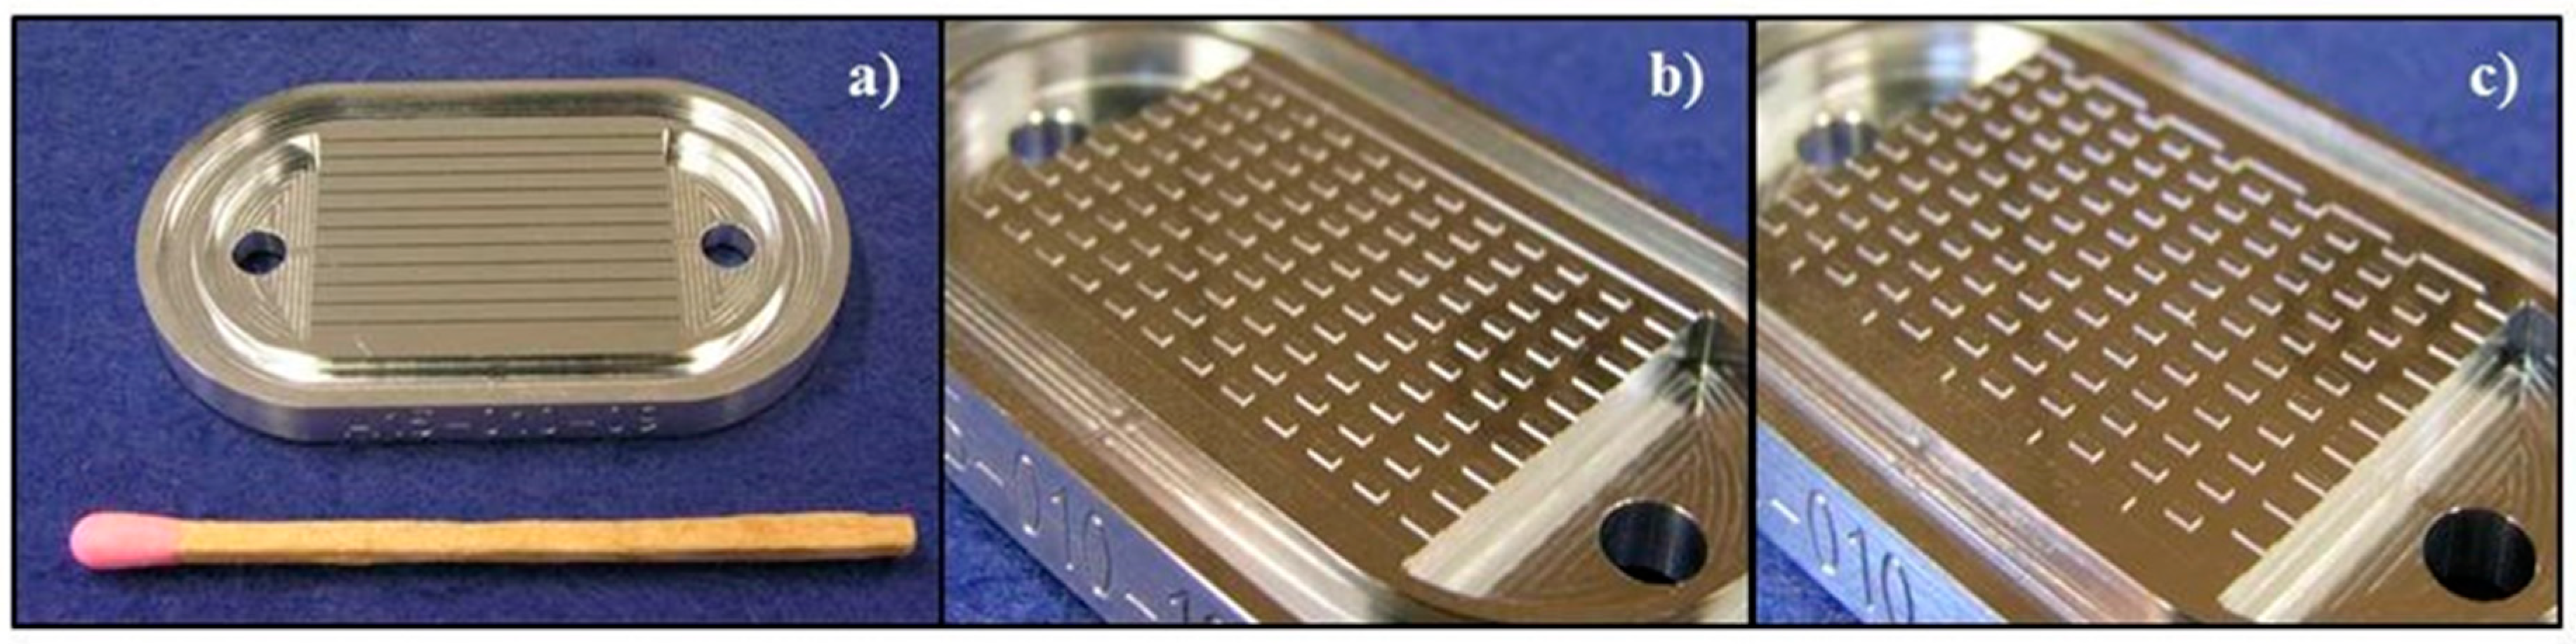
The plates with microstructures were generated with mechanical micro machining from aluminum. Rectangular pin fin shapes in parallel and staggered arrangement were compared with straight micro channels, as shown in Figure 2.
The microstructures were positioned on an area of W × L = 0.0173 m × 0.0235 m with a height of H = 0.0001 m. The active volume was calculated based on the total free flow area, namely the volume in front, behind, and in between each pin fin was summed to estimate the active volume. Similar calculations were used to estimate the total heat transfer area of each device based on the area through which the heat is transferred. Due to the varying number of pin fins and their arrangement, the active volume and the heat transfer area are different for each microstructure arrangement.
The geometric data of each microstructure is summarized in Table 4.
A stainless steel partitioning foil with a thickness of δ = 0.001 m was clamped between the foils with microstructures. The clamped micro heat exchanger was investigated with counter current flow arrangement and balanced mass flow rates for hot and cold fluid flow, i.e., with mass flow rates of = 1 up to = 3 . The inlet pressure level of both flows was fixed to the inlet pressure of p = 700 kPa (rel). Table 5 summarizes the operating conditions.
The impact of different inlet temperature ranges on the overall heat exchanger performance was investigated, and is summarized in Table 6. At first, different inlet temperature ranges (Tin = 363.15 K–288.15 K; Tin = 34.153 K–288.15 K; Tin = 328.15 K–308.15 K) were studied with a straight micro channel arrangement. Parallel pins and staggered pins were compared with the straight micro channels, with aluminum as the microstructure material and a temperature range of Tin = 363.15 K–288.15 K. Three cases were distinguished and named by the inlet temperature of each case, taken in °C (which makes it easier to write). This led to the names: case 90, case 70, and case 55, respectively.
The influence of rarefaction effects was neglected due to Knudsen numbers (Kn) for the straight micro channels of Kn < 0.001. More precisely, the Kn of the investigated cases of straight micro channels did not exceed 10% of the critical Knudsen number. The Kn number as a function of Reynolds number (Re) and Mach number (Ma) is difficult to obtain for enhanced microstructures, due to the hydraulic diameter problem (i.e., it is not clear which is the correct and valid hydraulic diameter or characteristic dimension for an overall calculation due to the fact that the cross sectional area and the perimeter of the enhanced microstructures vary along the flow path). However, the results can be expected to not exceed the critical Knudsen number and, therefore, rarefaction effects were not considered.
Compressibility effects need to be taken into account due to high Mach numbers and high pressure ratios. Table 7 shows the maximum Mach numbers and maximum pressure ratios for the investigated cases.
It can be recognized that the pin fin arrangements increased the effect of compressibility due to additional high Mach numbers. High Mach numbers are characteristic for high flow velocities and large Reynolds numbers. In the investigated mass flow range, Reynolds numbers up to Re = 6021 were calculated for straight micro channels and case 90.
2.3. Assessment Method
An overall assessment method of micro heat exchangers should consider heat transfer behavior as well as pressure drop behavior. Heat transfer behavior is related to the amount of heat that is transferred from fluid to fluid in addition to the heat loss to the surroundings (fundamentals of this are given in Equations (1), (6) and (9). Pressure loss behavior describes the pressure difference that is required to overcome the inner friction of fluid flowing through a tube or channel, which is directly related to the pumping power applied (fundamentals of this are given in Equations (7) and (8). Both behaviors are influenced by fluid properties and the flow path, i.e., the choice of fluid and the heat transfer enhancement technique in microstructured devices. The overall assessment can be performed in comparison to a reference heat exchanger geometry or in direct comparison of different augmented devices, e.g., Webb and Kim or Bejan [15,16].
For the study presented here an assessment method based on the second law of thermodynamics was used. The second law of thermodynamics describes irreversibility occurring during a real/non-ideal process, e.g., due to heat and mass transfer. Irreversibility means that the process cannot be restored to its initial condition without additional energy input. Process entropy describes this irreversibility. Although the entropy in a thermodynamic process can only be increased or decreased, the published literature refers to the entropy changes as “entropy generation” or “entropy production”. This nomenclature is retained here. Irreversibility resulting from heat transfer and fluid flow during the heat transfer process both reduce exergy and increase of anergy accordingly. Exergy is the content of energy which can be changed into useful work, whereas the complimentary part of the energy is anergy. Therefore, entropy generation is always connected to a loss of exergy. With the calculation of entropy generation or exergy loss a characteristic number can be used to directly compare micro heat exchangers regarding pressure loss behavior and heat transfer behavior.
Besides the general goal of decreasing the overall entropy generation of a process, the aim with micro heat exchangers is to minimize the entropy generation due to pressure loss, and to maximize the heat transfer, i.e., decrease the exergy loss due to pressure loss. In recent years the amount of studies considering the second law of thermodynamics in heat exchanger analysis has increased, which is recognized by reviews on this topic [29,30]. For the presented study, we tried to find the easiest parameter for directly assessing the overall efficiency of micro heat exchangers. Thus, the method of calculating the overall exergy loss (DE) was chosen, previously published by Wu and Li [31]:
with DET being the thermal exergy loss and DEP the fluidic exergy loss due to pressure loss behavior. DET is given by
with and cP,H as hot mass flow rate and hot specific heat capacity. T0 is the ambient temperature, c is the ratio of inlet temperatures (Tin), and Rhcr is the ratio of heat capacity rates ( ∙ cp):
for hot fluid flow (H) and cold fluid flow (C). The thermal efficiency (εTh) compares the actual heat transfer rate of the hot fluid flow (), the cold fluid flow (), or the average heat transfer rate of the hot fluid flow and the cold fluid flow () to the maximum (ideal) possible heat transfer rate ().
with T as temperature, as mass flow rate, and cP as the specific heat capacity at the inlet (in) and outlet (out) for hot (H) or cold (C) fluid flow. Min is related to the smallest value of the product of the mass flow rate and specific heat capacity in comparison to the hot and cold fluid flow. The fluidic exergy loss due to pressure loss (ΔEP) depends on the fluid. Assuming an ideal gas, it is obtained as follows:
with T0 as the ambient temperature, Rs as specific gas constant, and , Δp, and pin as mass flow rate, pressure loss, and inlet pressure for hot fluid flow (H) and cold fluid flow (C).
2.4. Experimental Procedure
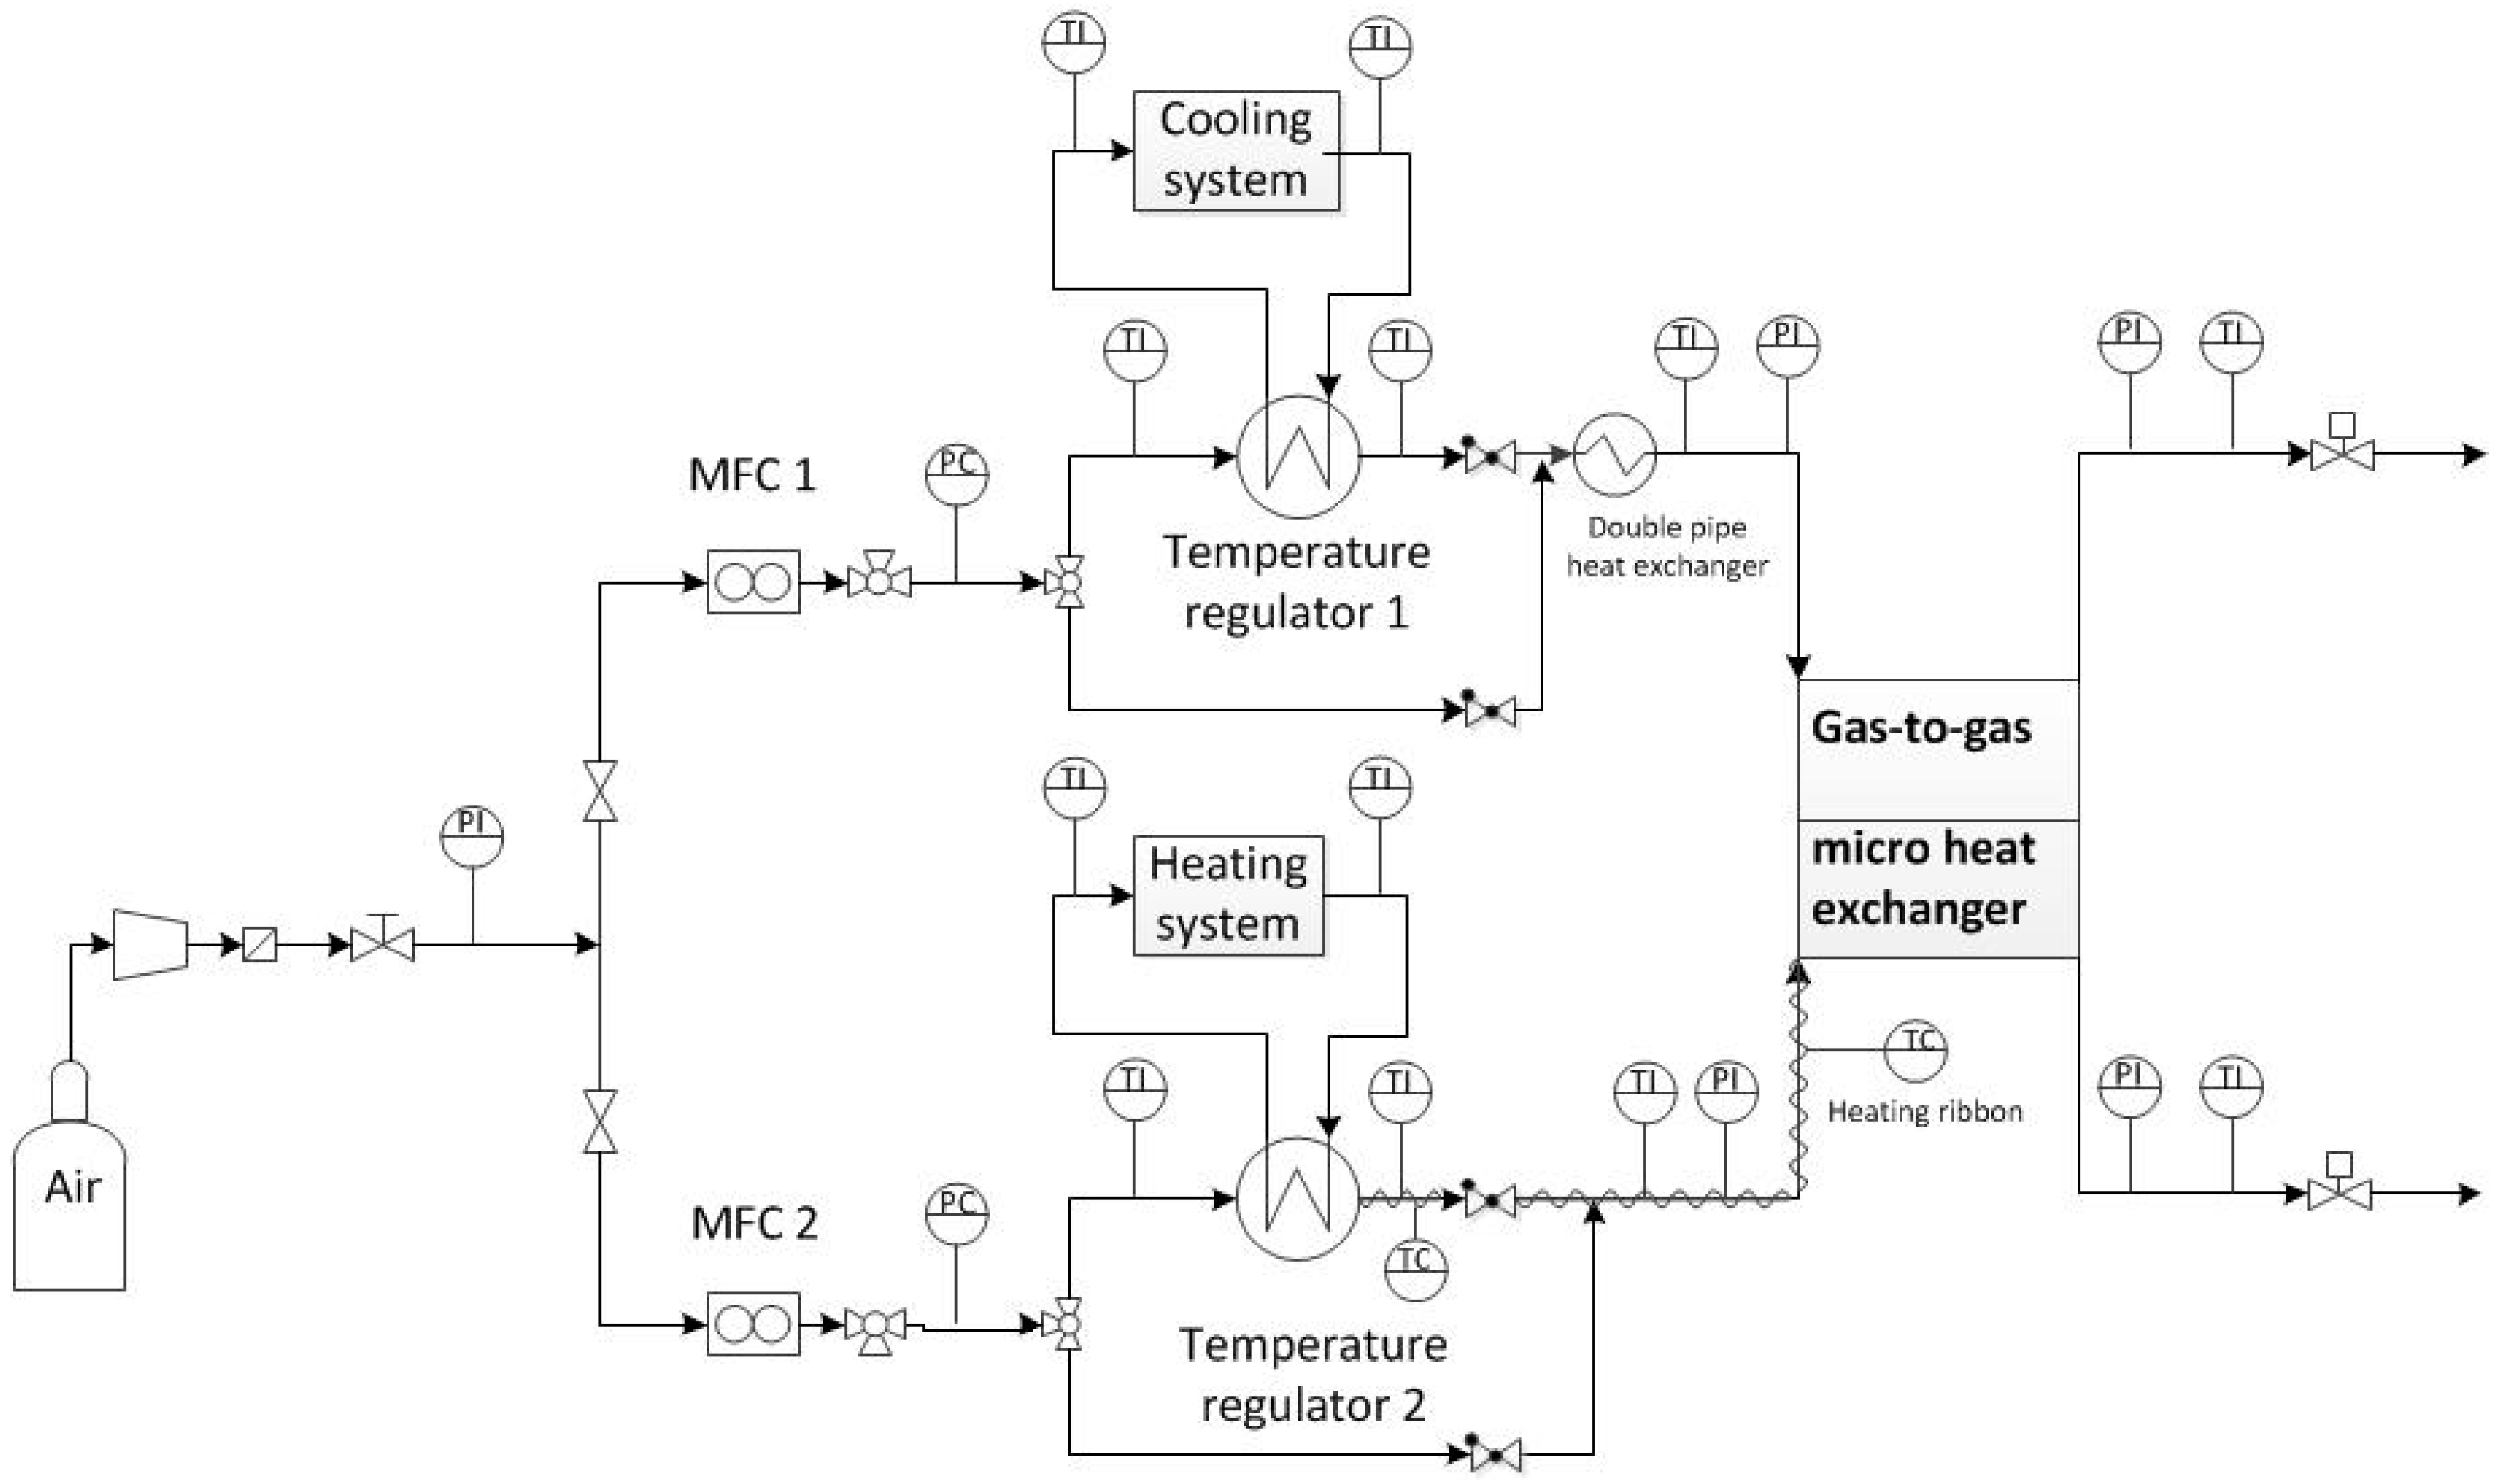
An experimental setup and device developed by Yang et al. [13] to investigate the effects of different partitioning foil materials and different flow arrangements was optimized for the present study. Air flow at a pressure level of p = 600 kPa (rel) was elevated in pressure up to p = 1000 kPa (rel) and stored in a tank at room temperature. The air flow from the tank was filtered by a sintered metal cartridge filter. After the filter, the gas pressure was adjusted by a pressure regulator in order to reach the optimum pressure requirements of the mass flow controllers for different mass flow rates. The flow was split into two branches that supplied the gas-to-gas micro heat exchanger as hot and cold fluid flows, respectively.
The flow rate of each branch was controlled by a mass flow controller. The temperature was adjusted by a temperature regulator, which was supported by a heating ribbon for hot fluid flow or an additional double pipe heat exchanger for cold fluid flow to offer a certain temperature in front of the micro heat exchanger and to reduce heat losses. The gas-to-gas micro heat exchanger was surrounded by an insulation material to minimize the influence of radiation. In front of and behind the gas-to-gas micro heat exchanger, the temperature and pressure of each flow branch was measured. The exiting gas was vented to the surroundings. A schematic of the experimental setup is shown in Figure 3.
3. Results
Measurement was performed with the structures previously shown in Figure 2. The pressure loss as well as the thermal behavior was measured. Different cases of the inlet/outlet temperature were examined (Tin = 363.15 K–288.15 K; Tin = 343.15 K–288.15 K; Tin = 328.15 K–308.15 K) and compared.
An uncertainty analysis was performed based on the law of propagation of uncertainty, and according to the “Guide to the expression of uncertainty in measurement” (GUM, see [32]). The calculation of pressure loss and thermal efficiency, as well as the calculation of the exergy loss were based on the measurements. The law of propagation of uncertainty combines the errors by the accuracy of measuring instruments, and enables a calculation of the uncertainty of a measurement result.
3.1. Straight Microchannels
3.1.1. Pressure Loss Behavior
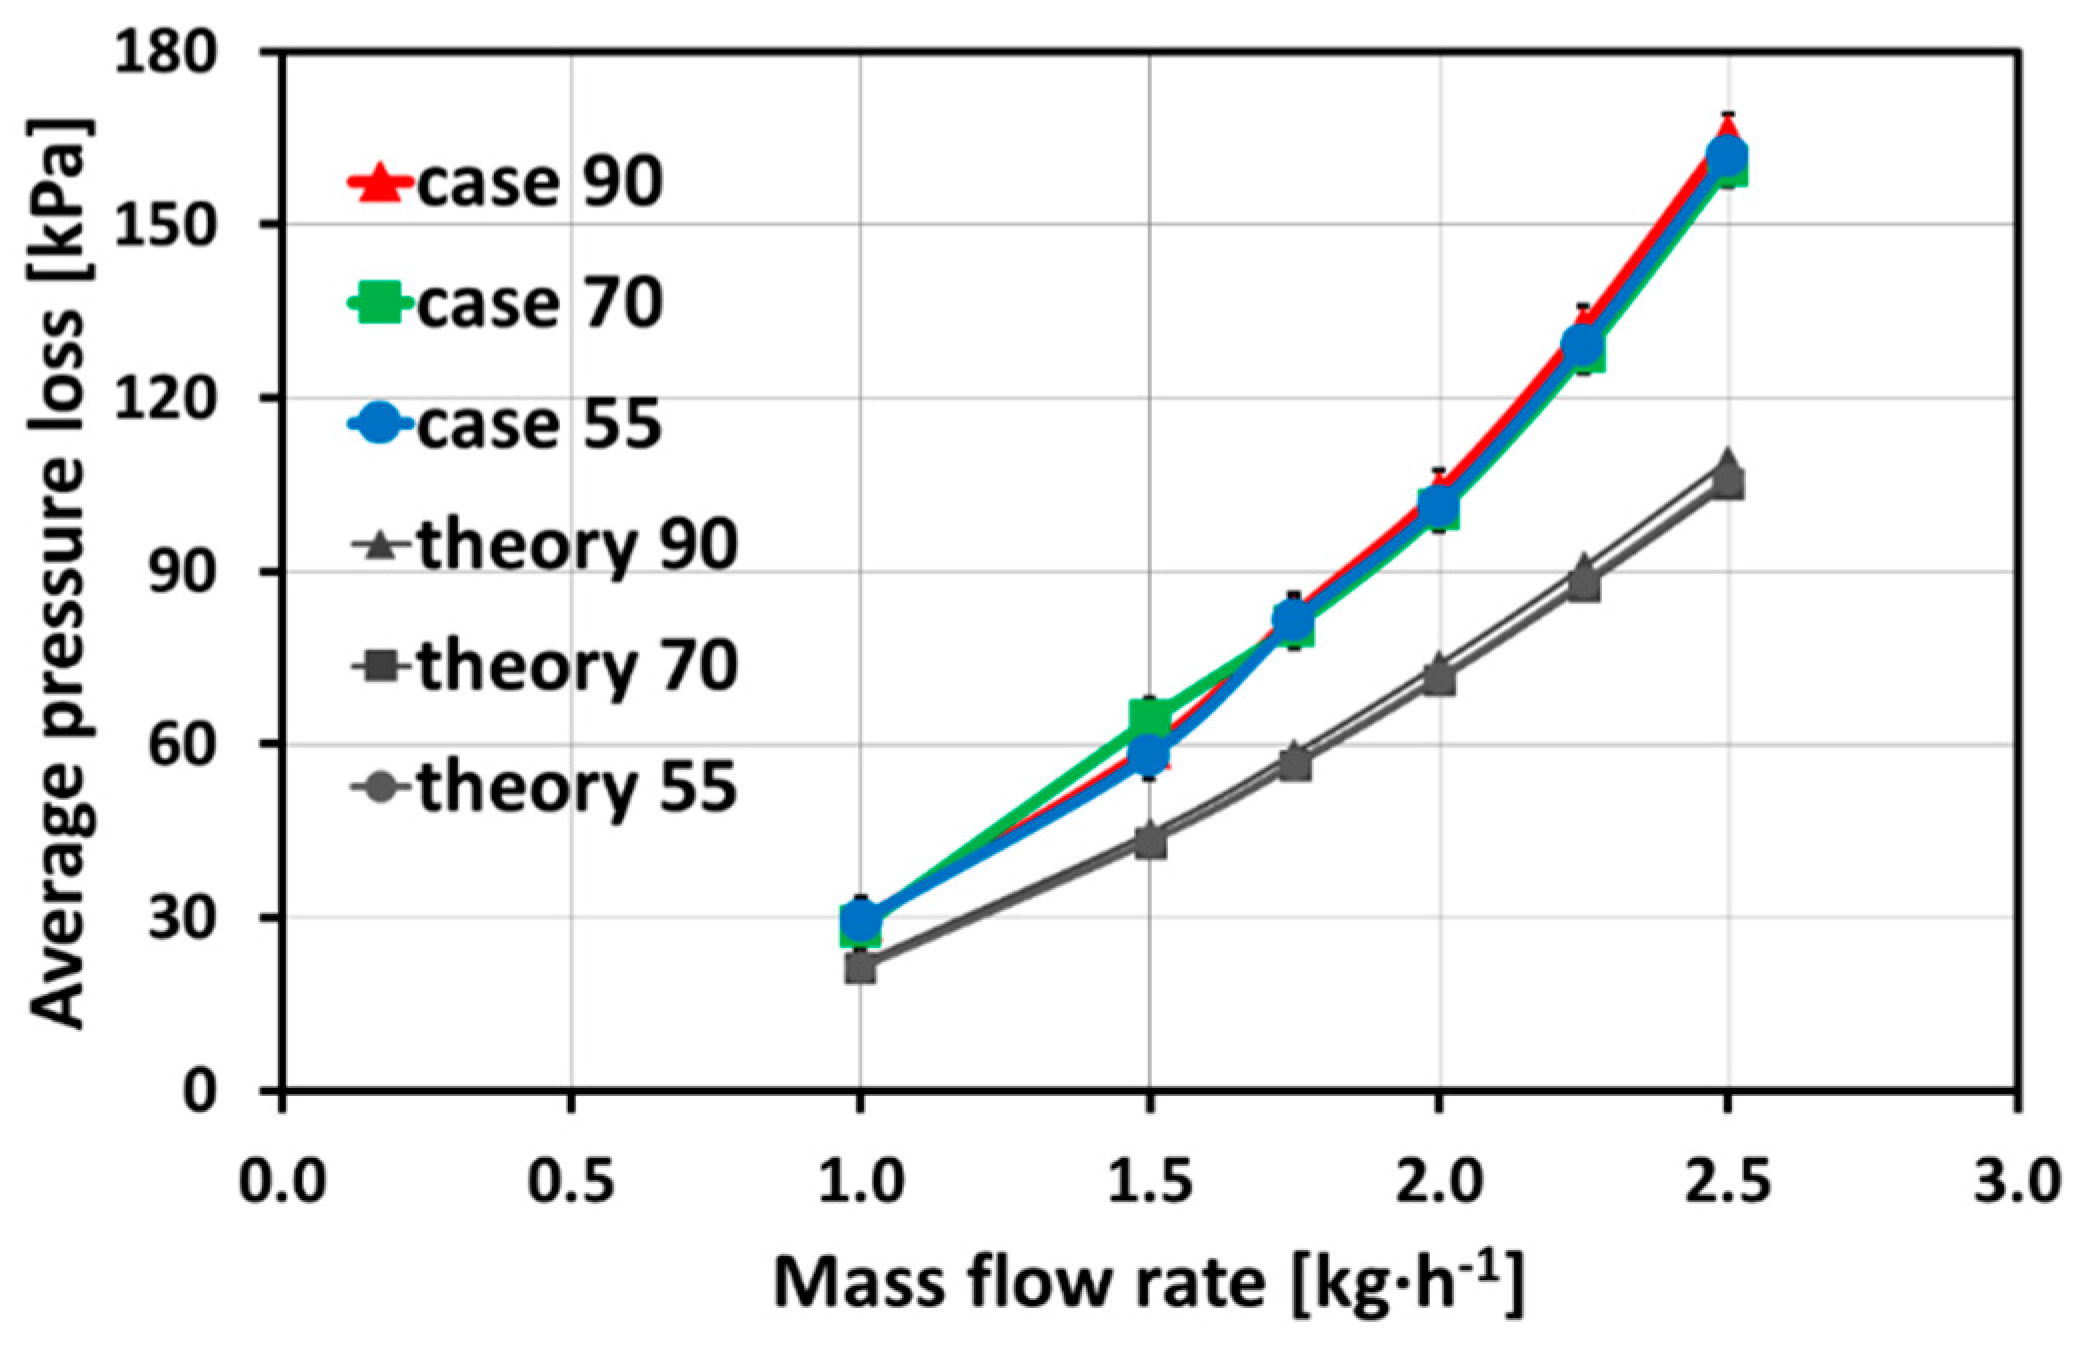
Figure 4 shows the average pressure losses for different inlet temperatures. Overlapping experimental average pressure losses can be seen for the different investigated cases, and which reveal the low impact of the temperature on the pressure loss behavior. A maximum uncertainty of Δ(Δp) = ±4.0 kPa was detected for the investigated cases.
A comparison with conventional theory (see Equations (7) and (8) and [17]) was performed, and is presented in Figure 4. The conventional theory is based on the equation of Blasius (see [17]), due to Reynolds numbers up to Re = 6021 indicating a transition to turbulent flow regime. Strong deviations of conventional theory and experimental results can be detected, which increase with increasing mass flow rate. The deviations might occur due to the compressibility effects of the fluid flow (see Equation (8)). The conventional theory does not take into account pressure losses due to the inlet and outlet distribution chambers, i.e., the pressure loss calculation is focused on the micro channels. As already mentioned, the conventional theory is based on set inlet parameters and, therefore, does not consider influences such as temperature changes on the pressure losses along the flow path. The experimental results, as well as the conventional theory, demonstrate a low impact of temperature on the pressure loss behavior due to overlapping results.
3.1.2. Heat Transfer Behavior
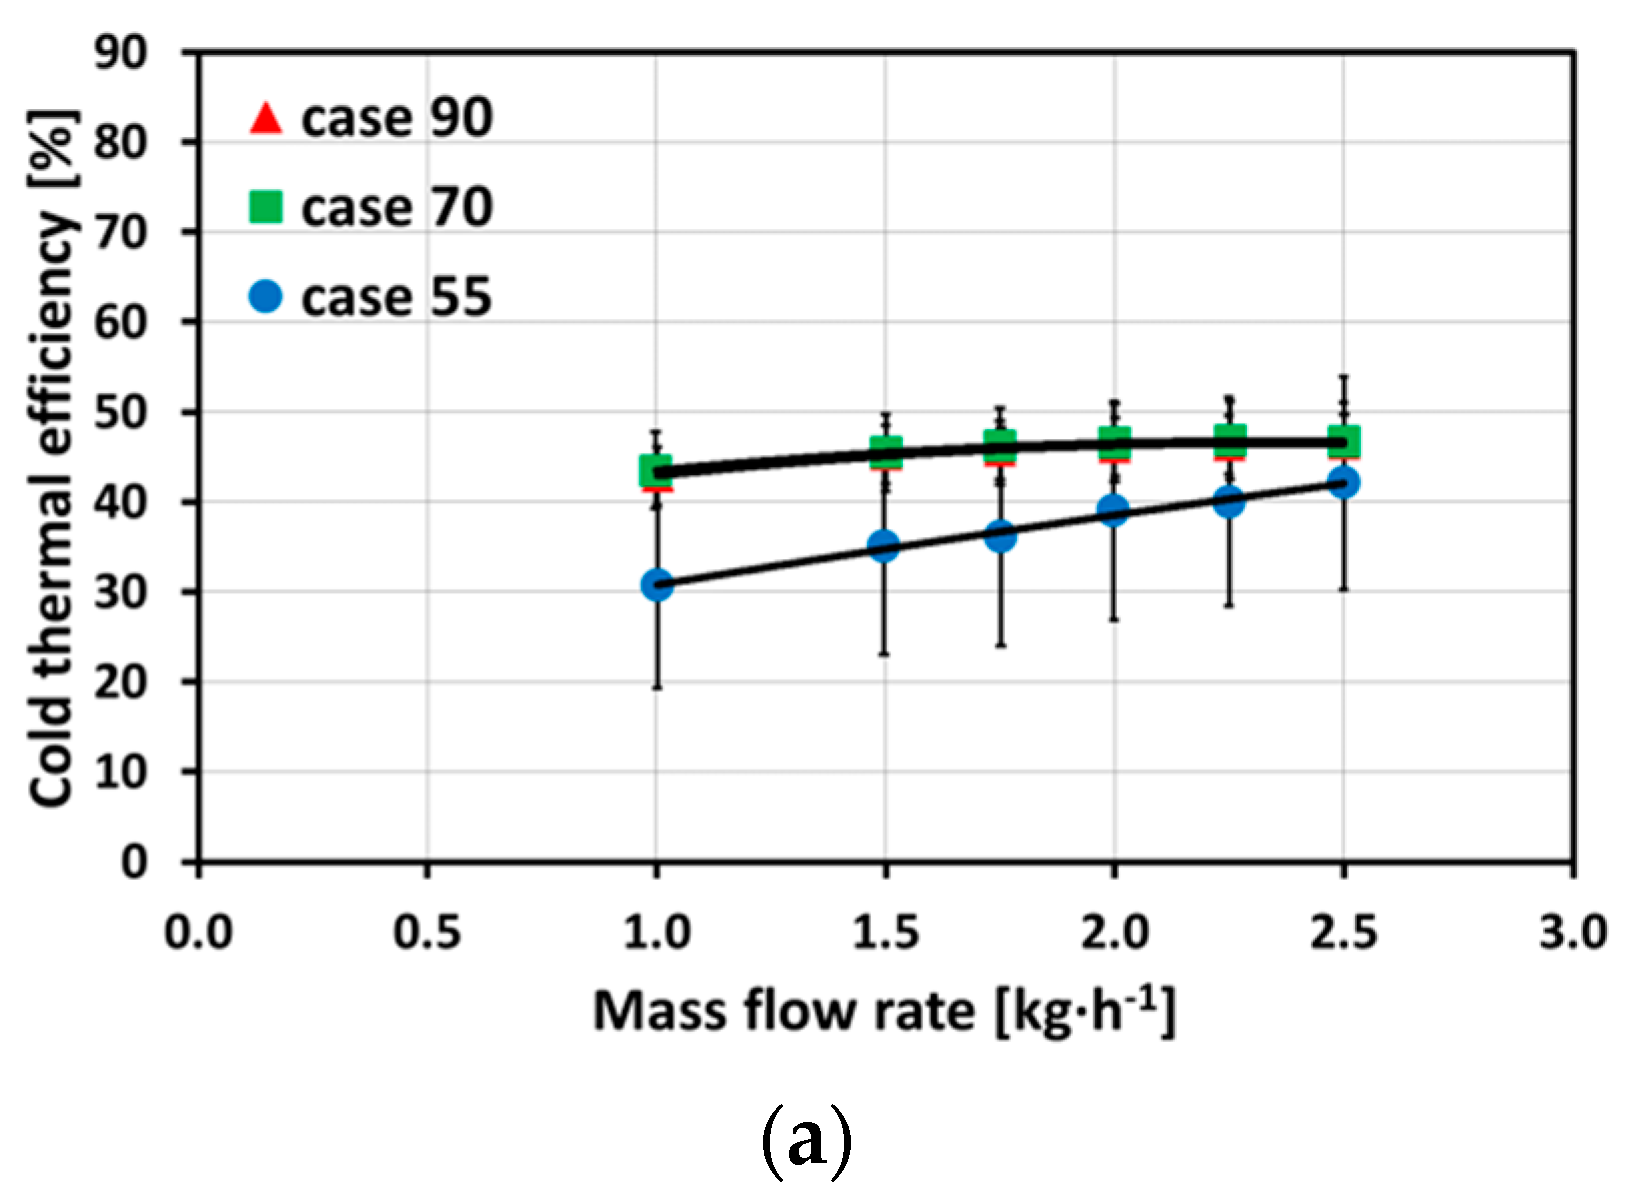
Figure 5a,b show the differences of thermal efficiency for different inlet temperatures and hot and cold mass flow rates. Case 90 and case 70 show similar results in comparison to each other for cold and hot mass flow rates. Case 55 was strongly influenced by the ambient temperature, leading to a stronger increase and decrease of the outlet temperatures compared to case 90 and case 70. The comparison of both plots shows the impact of hot and cold fluid flow, i.e., the temperature difference from inlet to outlet for the cold fluid flow is lower than for the hot fluid flow and, therefore, the thermal efficiency is lower for the cold fluid flow. The uncertainty reaches a maximum for case 55 and the hot thermal efficiency with a value of ΔεTh = ±13.6%.
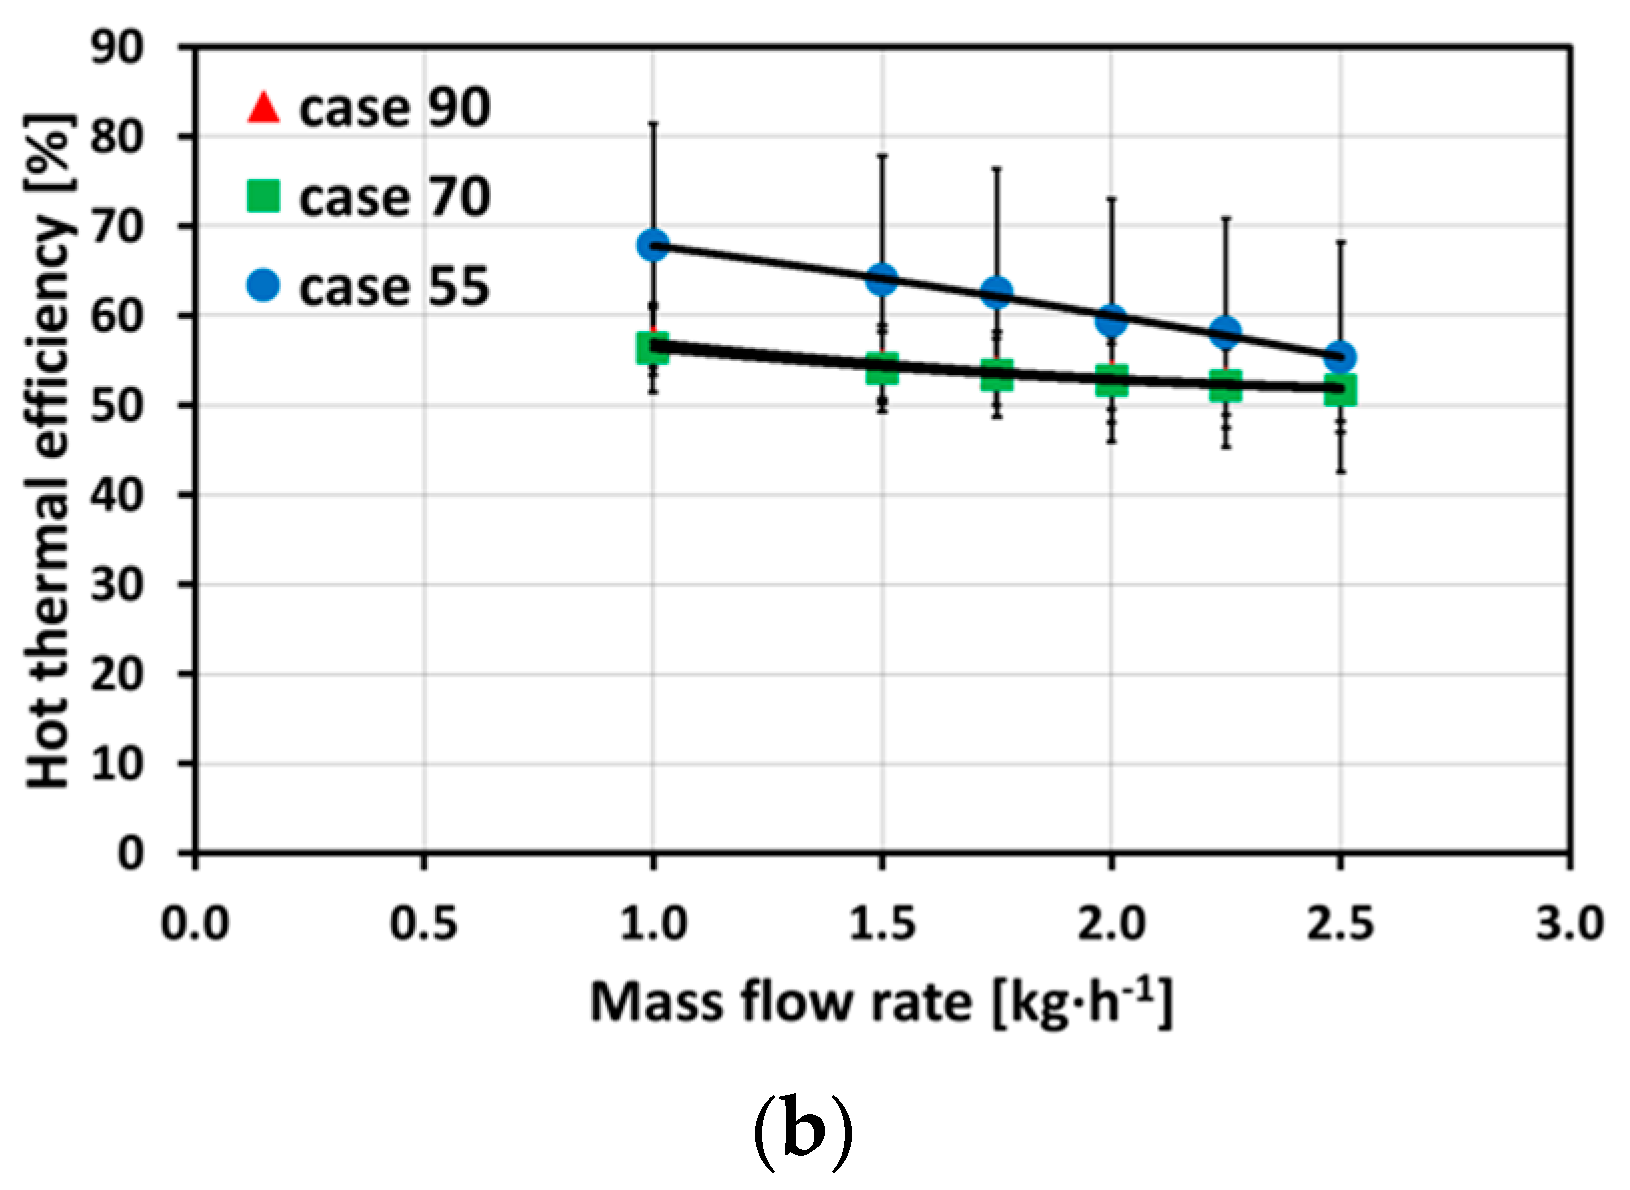
The average thermal efficiency and the heat loss are shown in Figure 6. The average thermal efficiency shows no differences between the three investigated cases, which can be confirmed by a stronger heat loss to the surroundings for case 90. The uncertainty of hot thermal efficiency leads to a maximum uncertainty of the average thermal efficiency of ΔεTh = ±10.0% and a maximum uncertainty of the heat loss of Δ = ±2.4 W. A comparison with conventional theory is added to Figure 6. The conventional theory is based on transitional to turbulent flow regime, and calculated with the ε-NTU method for counter current micro heat exchangers (see [17]). The Nusselt number needed for the ε-NTU method is based on approximate calculations for Prandtl numbers of 0.5 ≤ Pr ≤ 1.5 from VDI Heat Atlas ([17], Chapter Ga). The results for the conventional theory show slightly higher values compared to all three cases. This could be due to the assumption of no heat loss to the surrounding with the conventional theory. In addition, further effects along the flow path were not considered due to the calculation with set inlet conditions.
3.1.3. Overall Heat Exchanger Efficiency
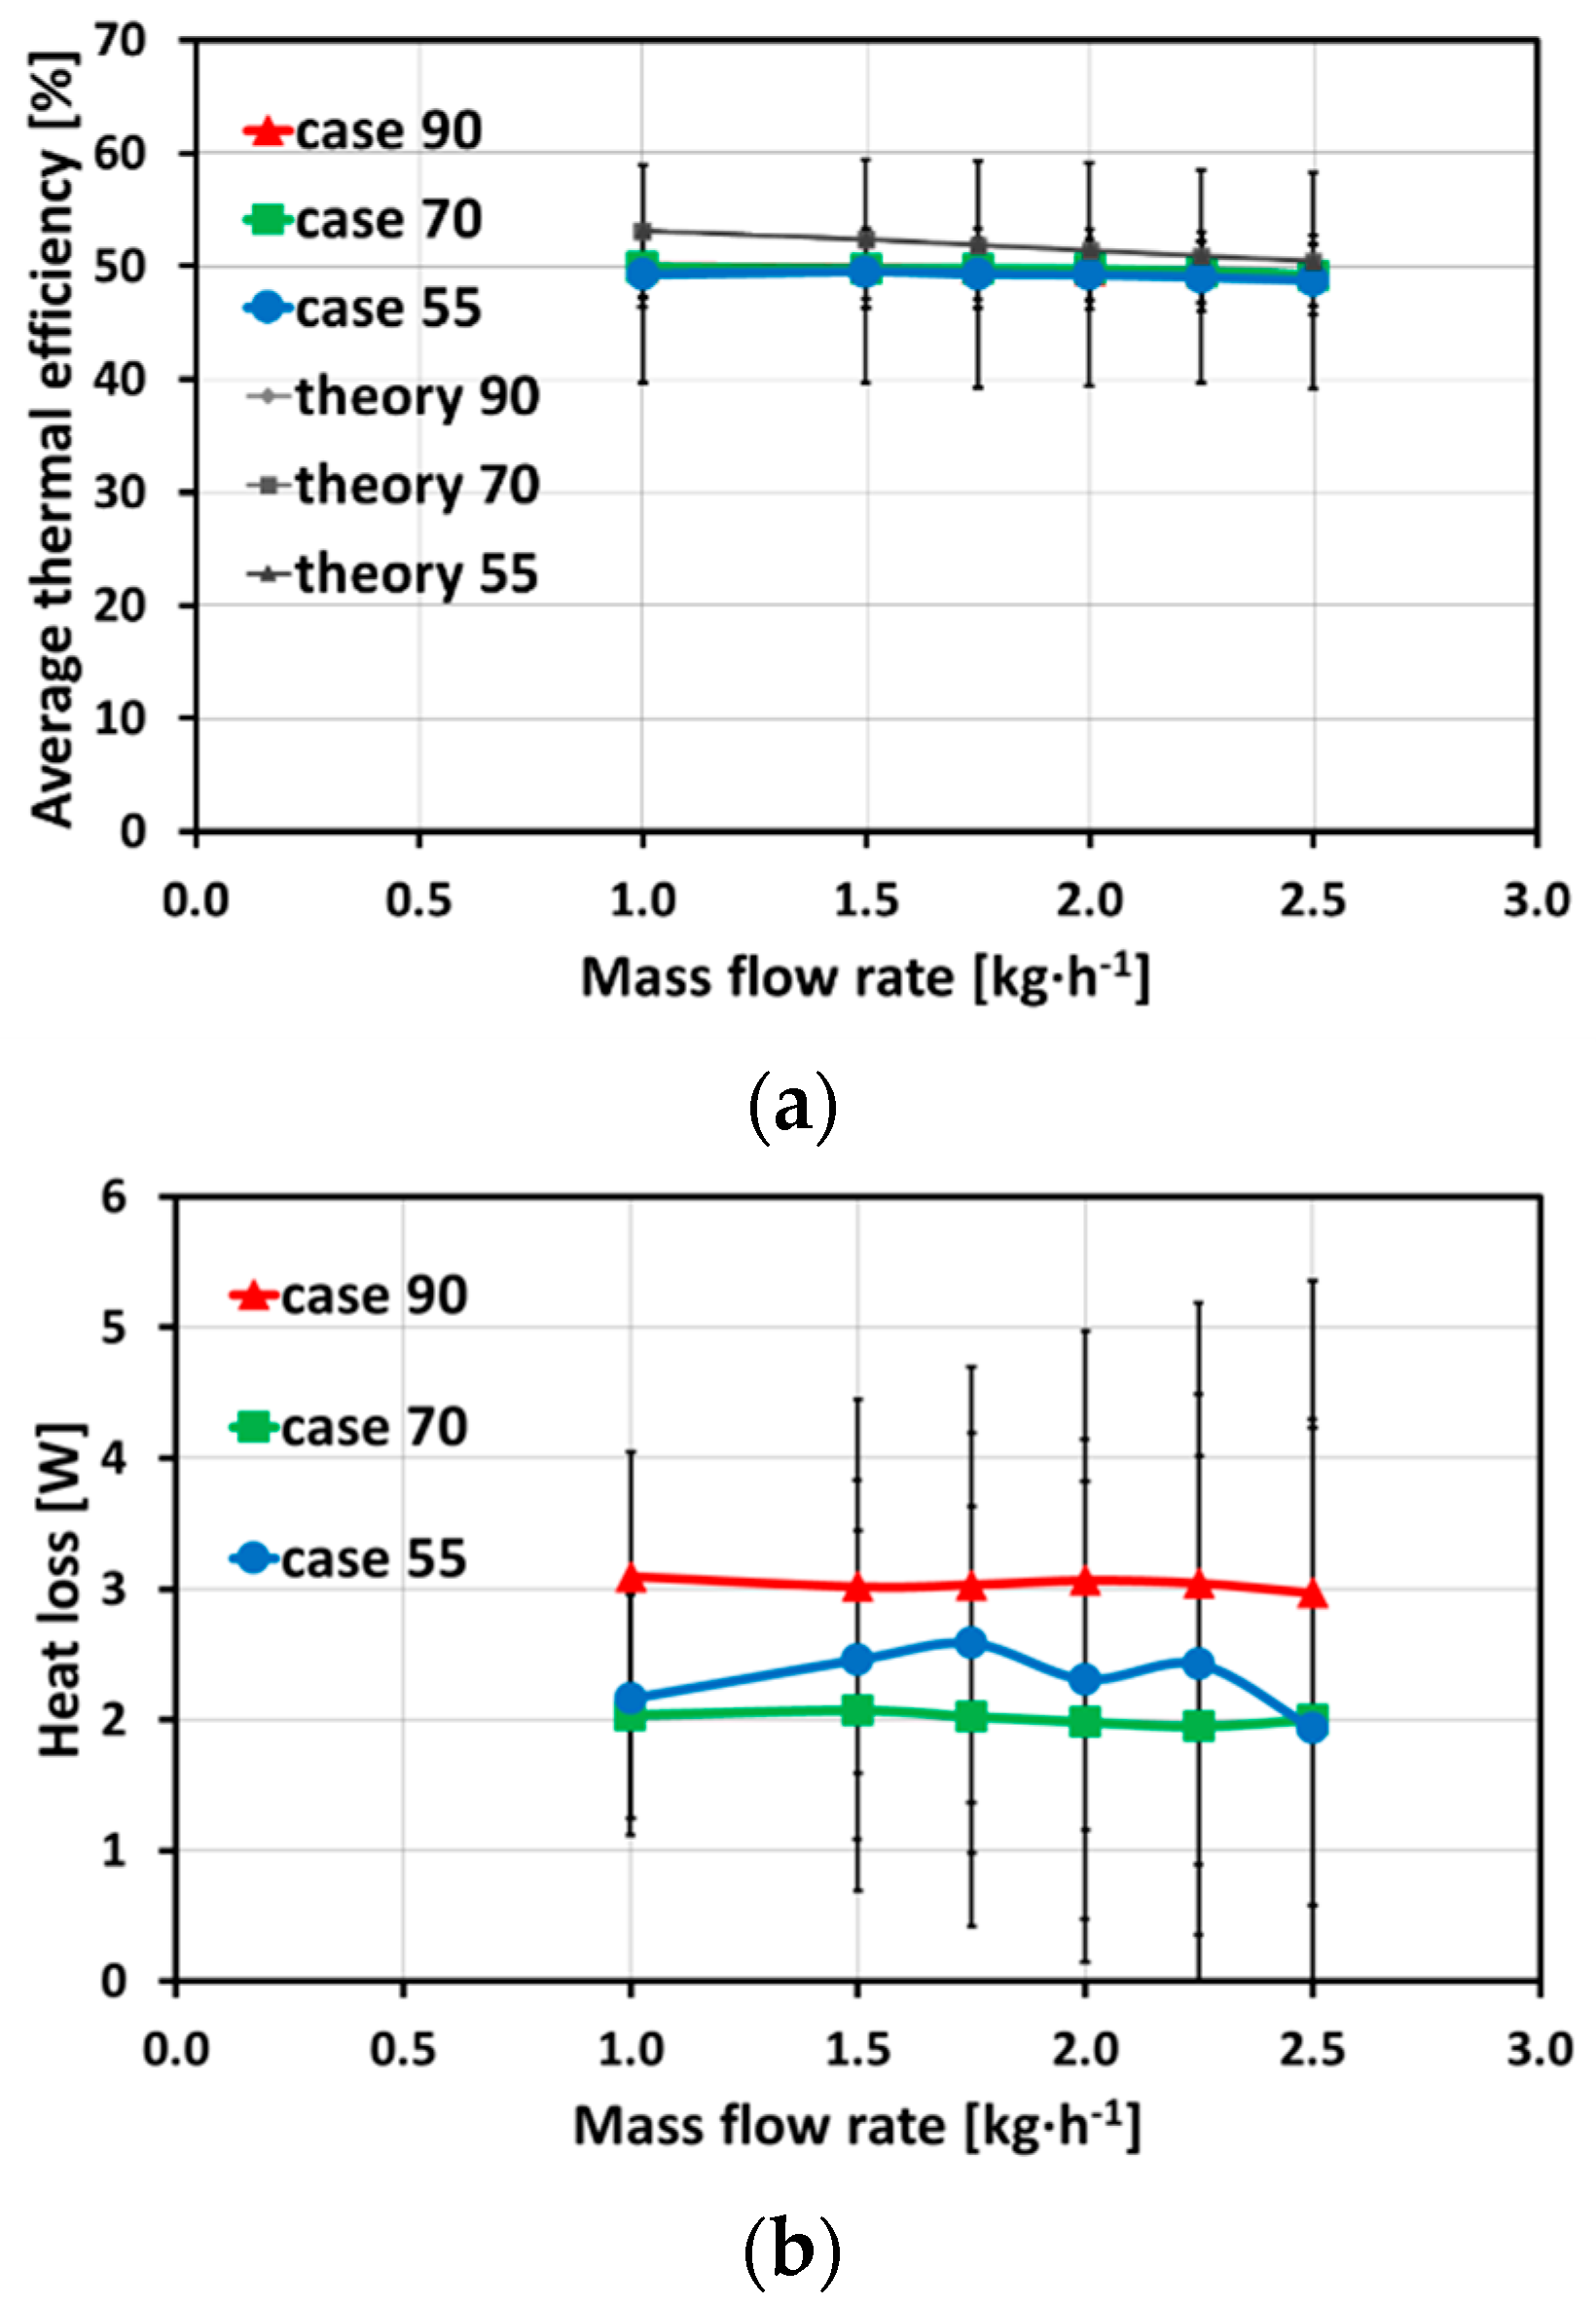
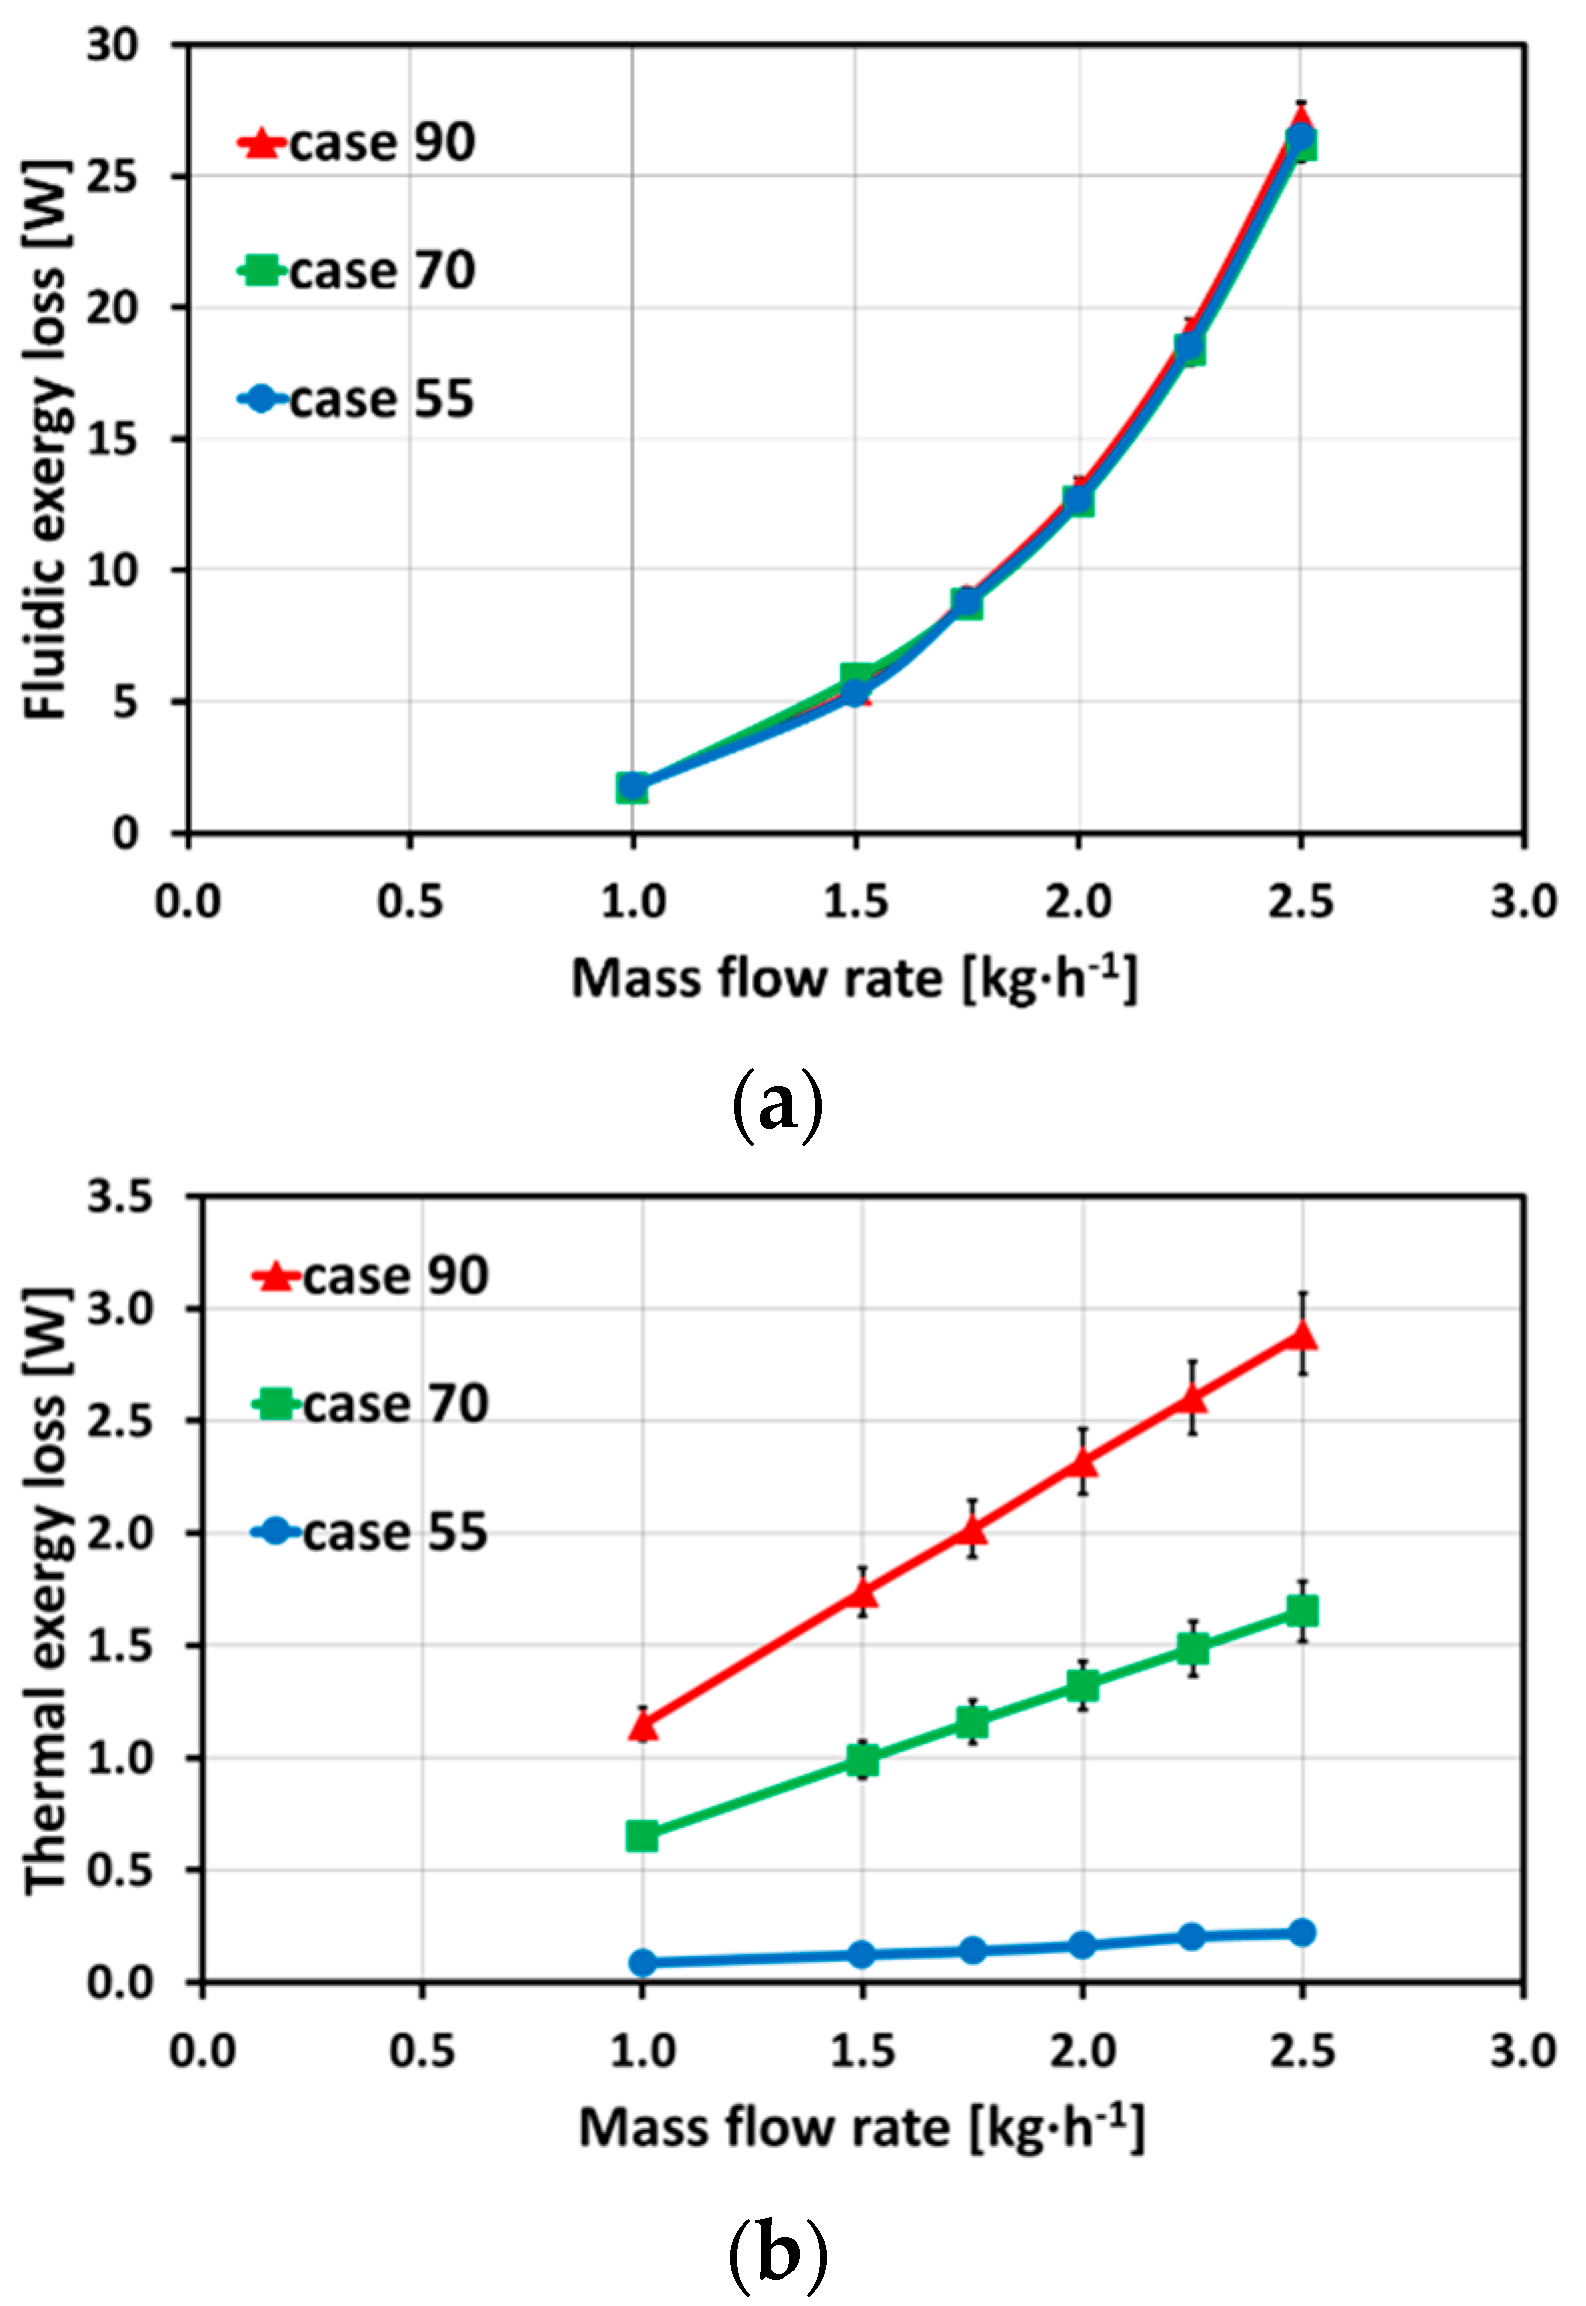
With the pressure loss behavior and the heat transfer behavior known, an overall heat exchanger assessment and comparison of different inlet temperatures can be performed. Figure 7 demonstrates the results of fluidic exergy loss (Figure 7a) and thermal exergy loss (Figure 7b). The plot of fluidic exergy loss is similar to the plot of average pressure losses. The overlapping trends of average pressure losses for different inlet temperatures result in an overlapping fluidic exergy loss, confirming a low impact of inlet temperature on the pressure loss behavior. The thermal exergy loss shows a strong impact on the temperature differences between cold and hot inlet temperature, i.e., a higher temperature difference leads to higher entropy and, therefore, to higher thermal exergy losses. The comparison of fluidic exergy loss and thermal exergy losses shows a strong impact of fluidic exergy loss due to the order of magnitudes of both exergy losses. The uncertainties for fluidic exergy loss and thermal exergy loss were calculated based on the law of propagation of uncertainty. Therefore, increased uncertainties for the thermal exergy loss could be detected due to higher uncertainties for the average thermal efficiency compared to the fluidic exergy loss and the average pressure loss.
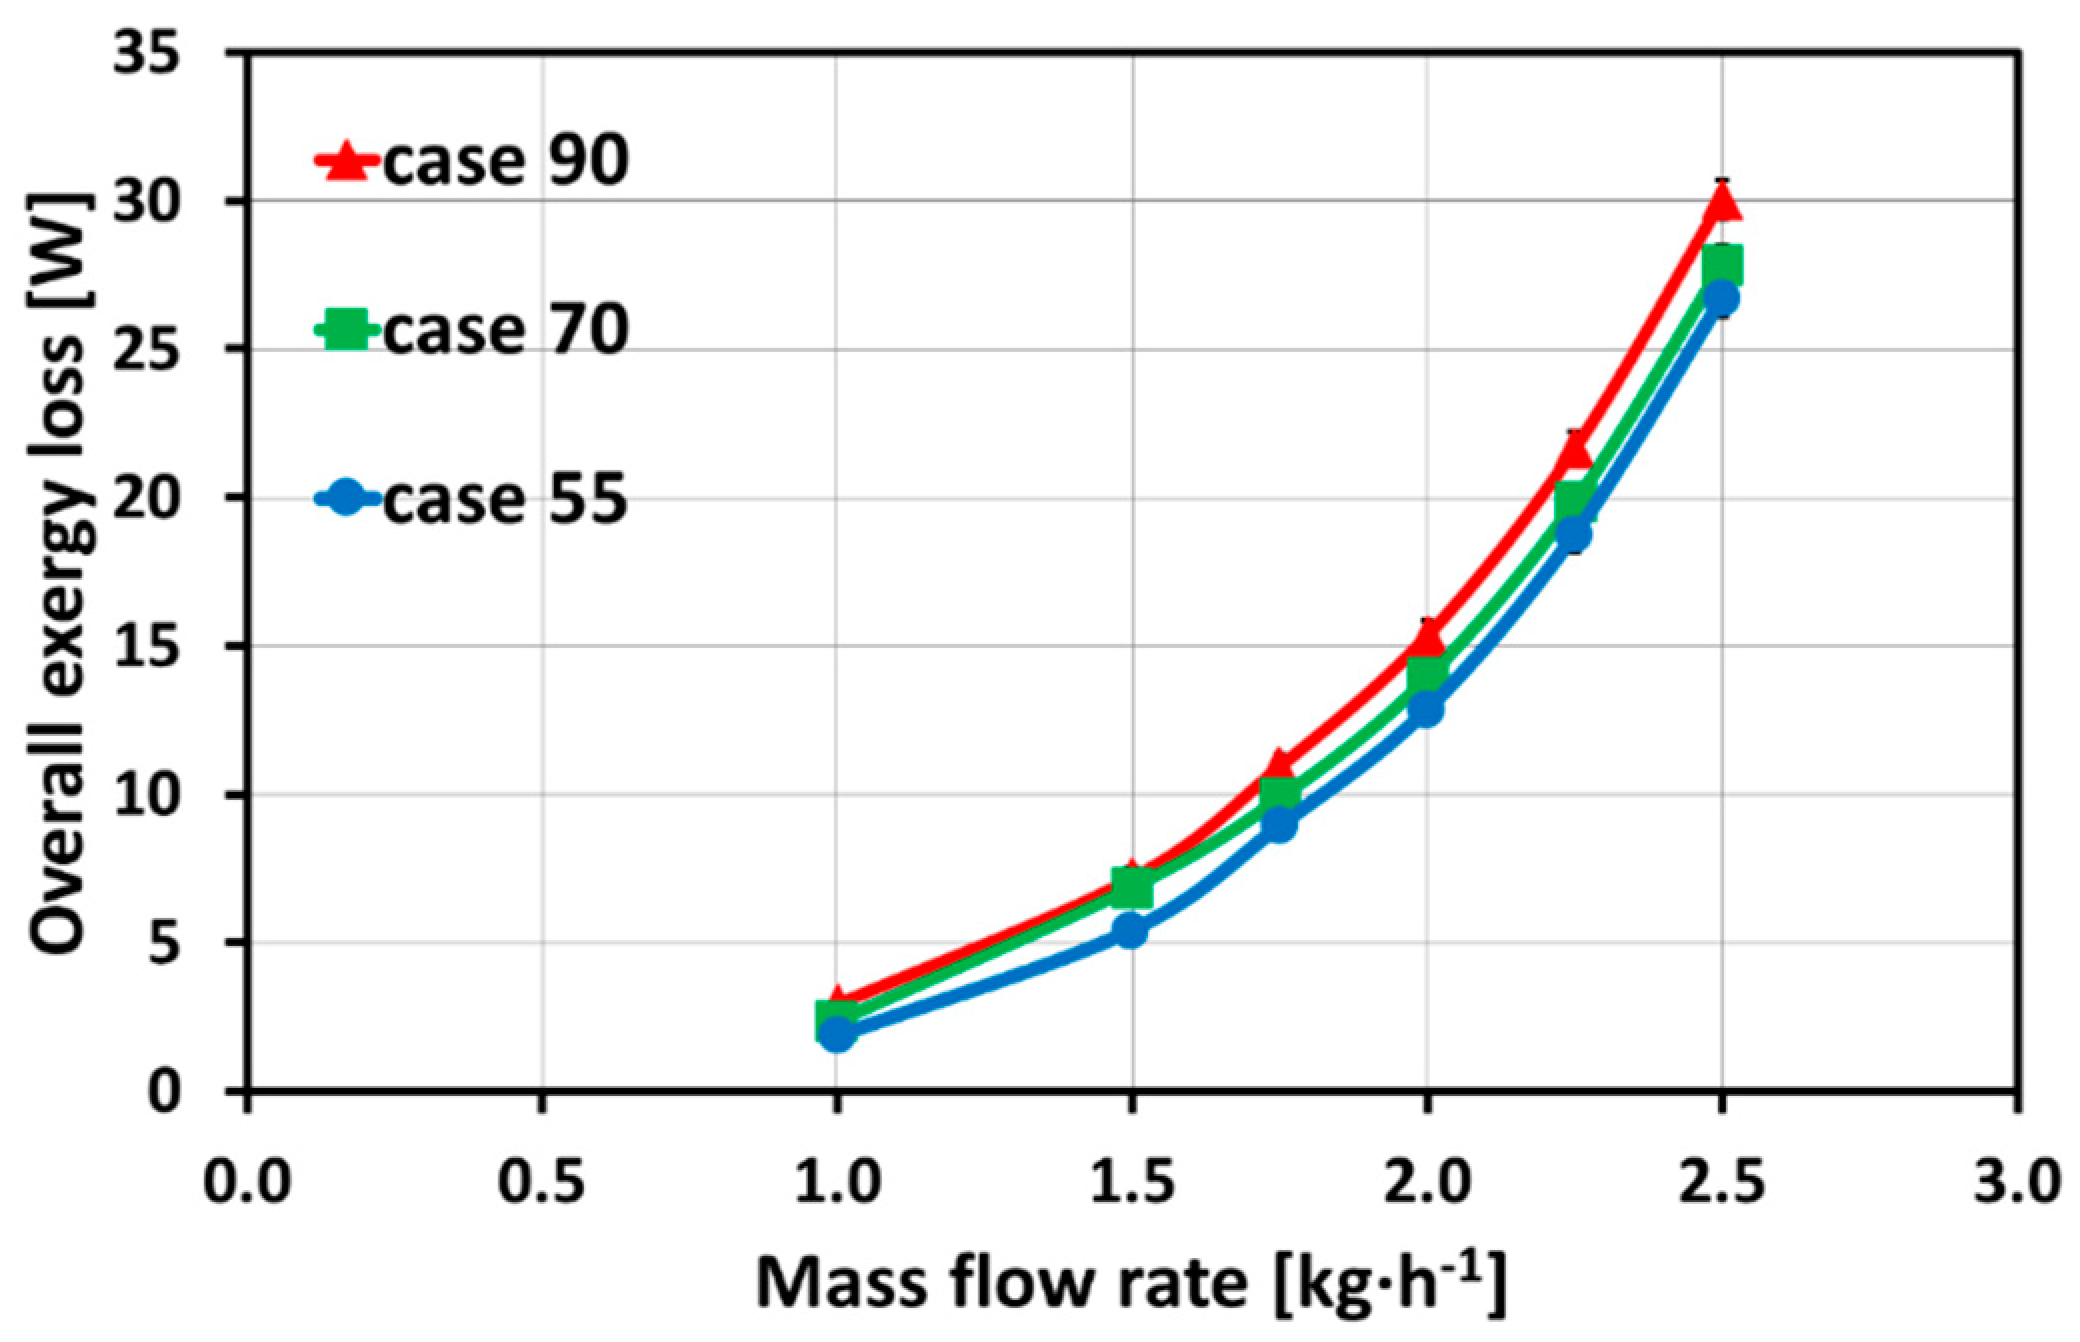
The overall exergy loss, presented in Figure 8, shows the same trends as can be seen for the fluidic exergy loss. A slight deviation can be detected due to the addition of thermal exergy loss. This is quite clear, because the influence of the fluidic exergy loss is ten times higher than that of the thermal exergy loss, as can be seen from the scales of the ordinate axis. A maximum uncertainty of the overall exergy loss of Δ(ΔE) = ±0.7 W was reached based on the uncertainties of fluidic exergy loss and thermal exergy loss.
For an overall energy efficient micro heat exchanger with these straight micro channels a high inlet temperature leads to a better overall exergy loss due to a low impact of inlet temperature on pressure loss behavior. Hence, in the following investigations case 90 is compared for different microstructures.
3.2. Enhanced Microstructures
Enhanced microstructures were investigated in terms of parallel rectangular pins (“parallel pins”) and staggered rectangular pins (“staggered pins”). A comparison with straight micro channels is added. The microstructures were made of aluminum and a hot inlet temperature of T = 363.15 K and a cold inlet temperature of T = 288.15 K were chosen as set inlet conditions.
3.2.1. Pressure Loss Behavior
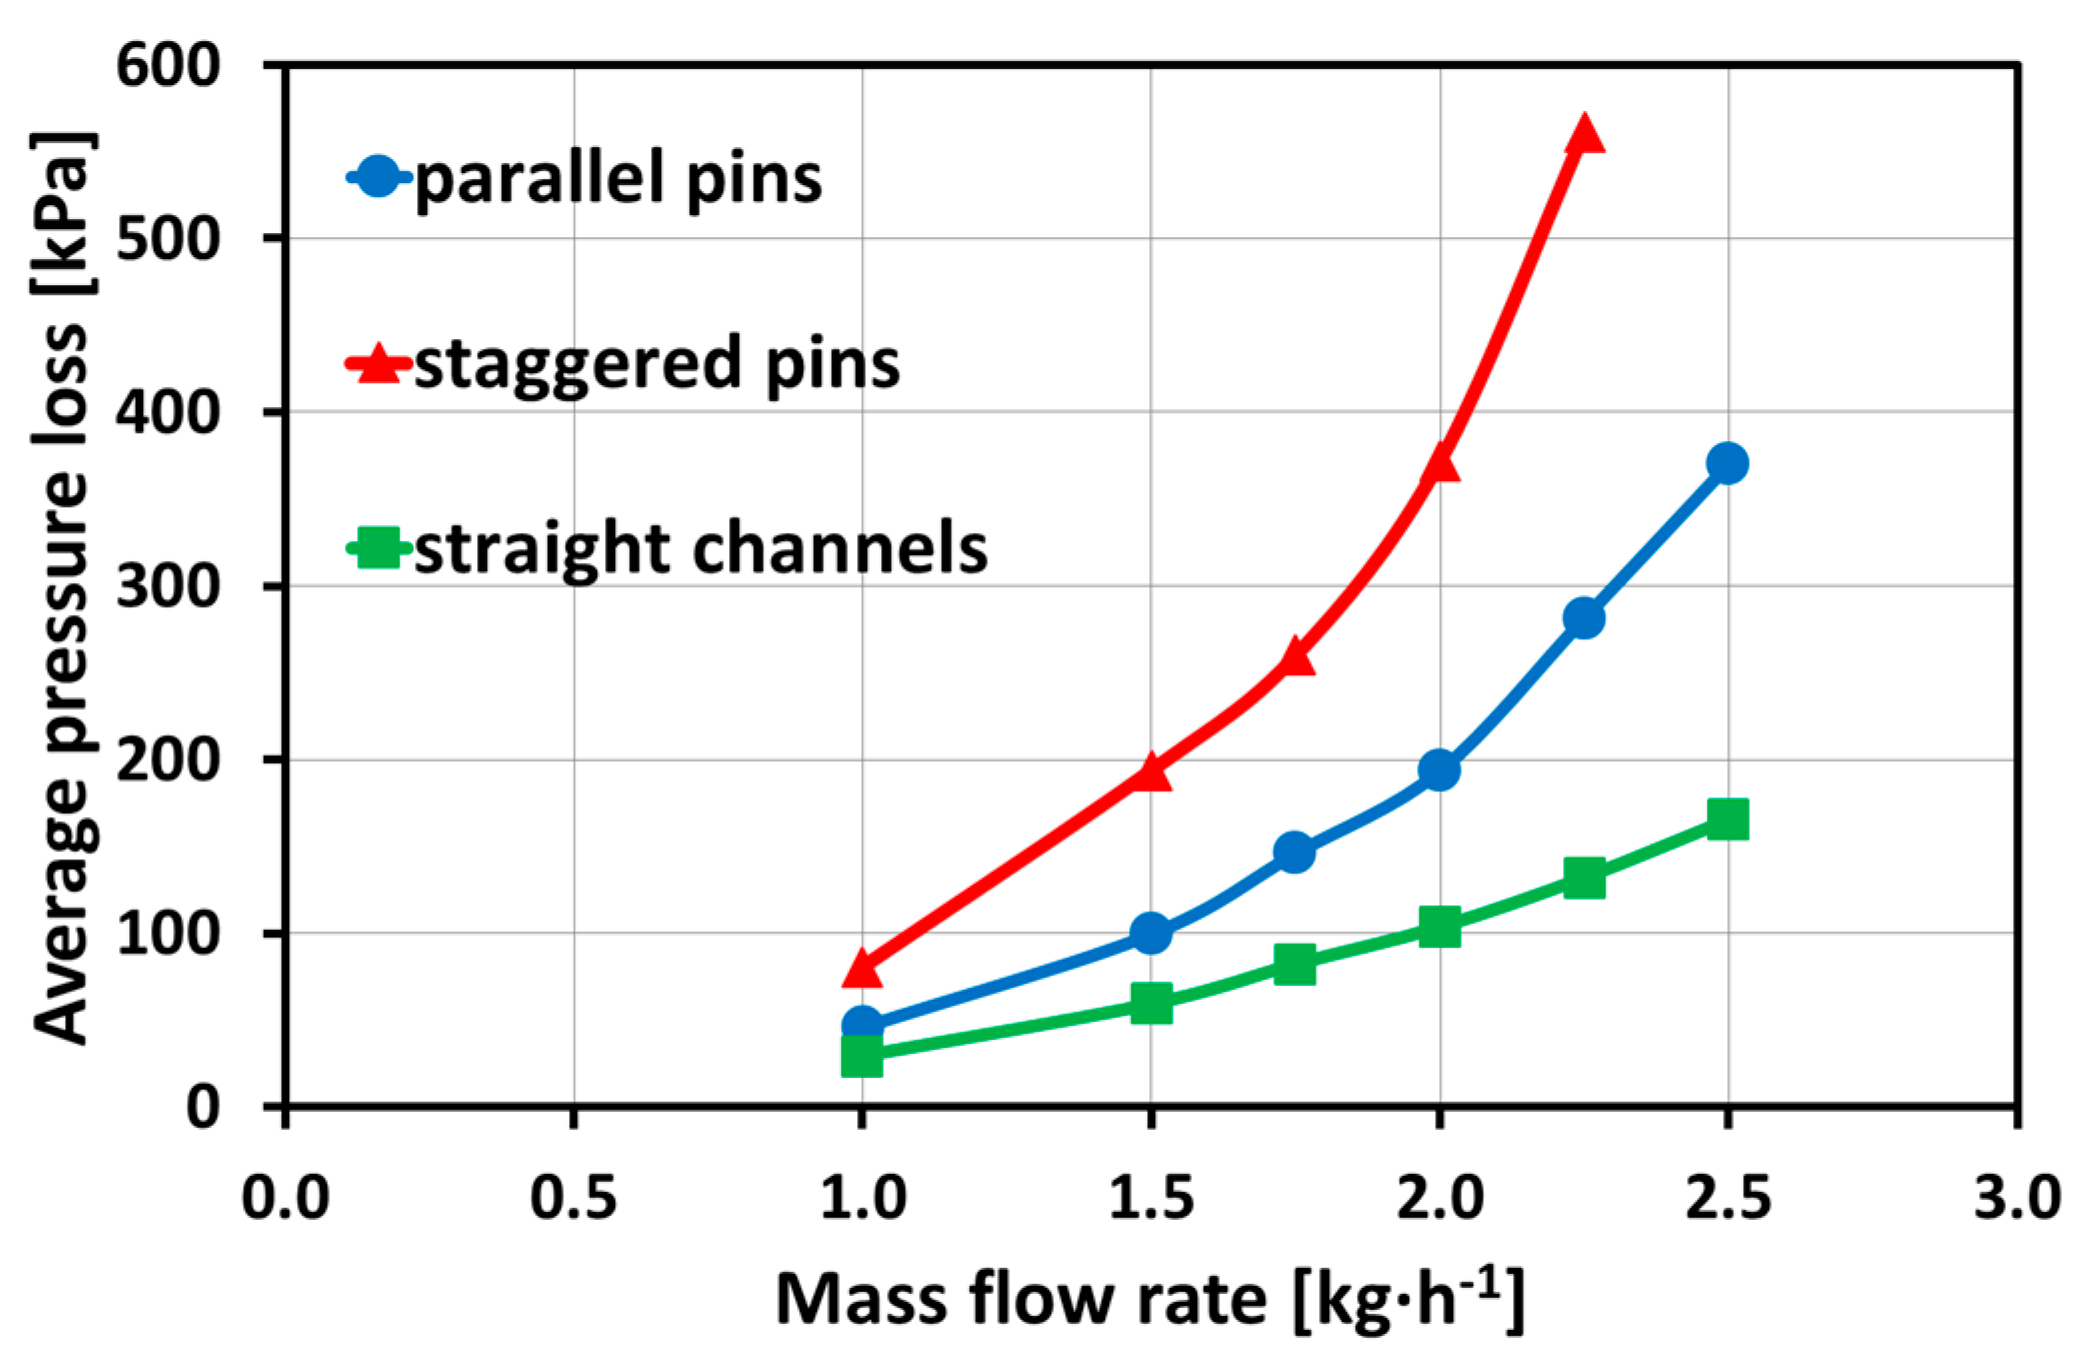
The pressure loss behavior is presented in Figure 9 as the average pressure loss of hot and cold fluid flow. The pressure loss behavior shows the expected trends of increasing average pressure losses with increasing mass flow rates. In addition, highest average pressure loss can be detected for staggered pins, whereas the lowest average pressure loss is presented for straight micro channels. The average pressure loss for staggered pins strongly increases until a measurement at a mass flow rate of = 2.5 1 could not be investigated because the experimental setup reached its limits. As described above, a nonlinear behavior could be detected for the pin fin arrangements due to the possibility of flow transition from laminar to turbulent flow regimes. This behavior was strongest for the staggered pins, where the highest Reynolds number can be expected due to high flow velocities and artificially induced local turbulences. The arrangement of staggered pins influences the pitches between the pins and leads to higher flow velocities. The exact Reynolds number could not be determined because of the unknown value of the hydraulic diameter. The pressure ratio of Δp/pin > 0.05 was exceeded with a mass flow rate of = 1.5 1, leading to the conclusion of the compressibility effect. Similarly to the investigated different inlet temperatures, a maximum uncertainty of Δ(Δp) = ±4.0 kPa becomes negligible compared to the resulting range of average pressure loss.
3.2.2. Heat Transfer Behavior
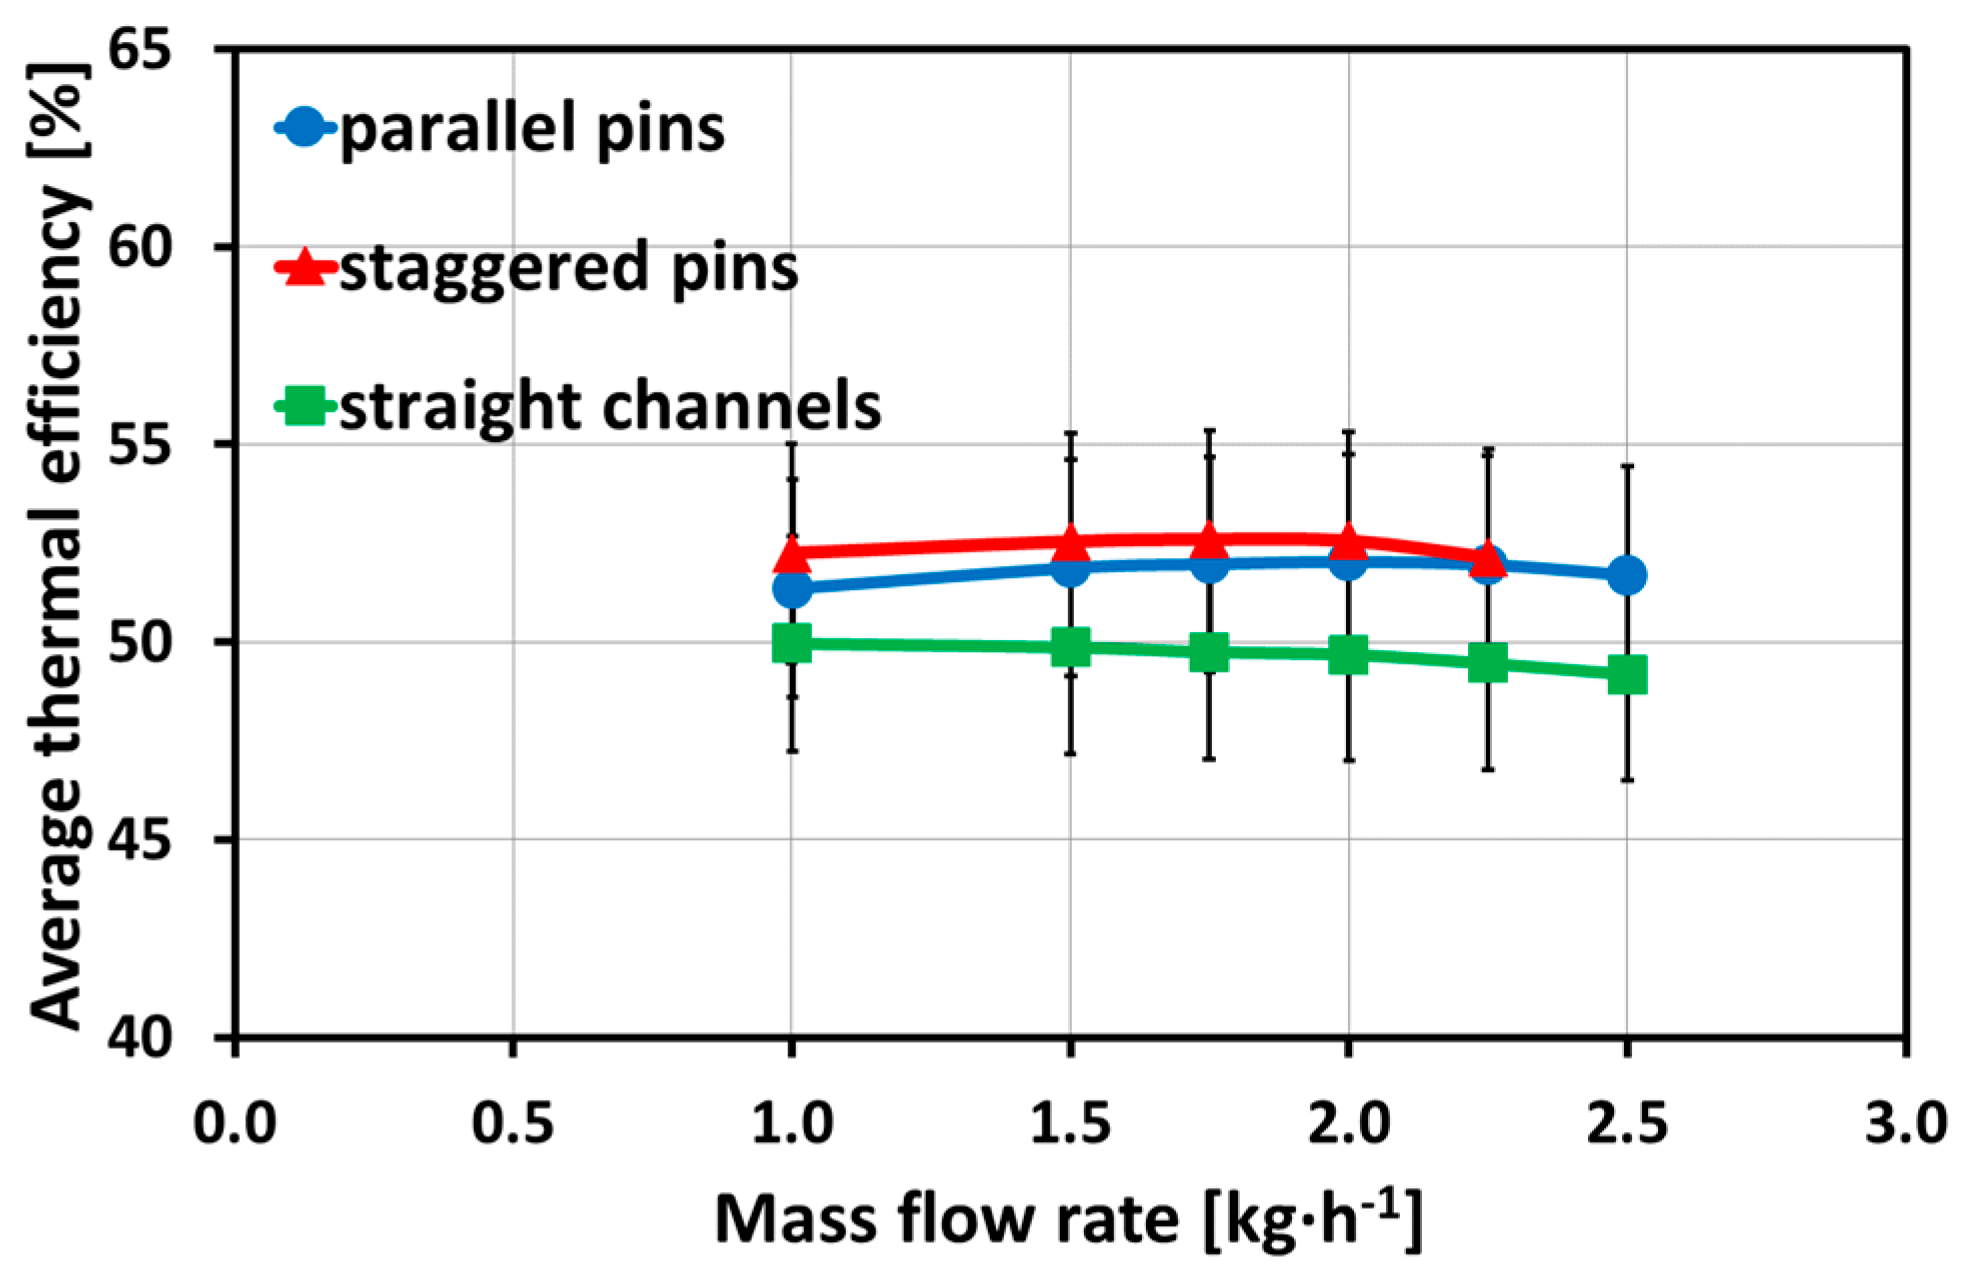
The heat transfer behavior with different enhanced microstructures is shown in Figure 10, with a zoom in on the ordinate (εTh = 40%–65%). Although the differences between the average thermal efficiencies are small, the expected behavior of highest average thermal efficiency for staggered pins and lowest average thermal efficiency for straight micro channels is depicted. The average thermal efficiency for staggered pins shows a decrease for the highest mass flow rate. Due to the overlapping error bars and a strong impact of temperature measurements on the results, a slight deviation of inlet temperatures and slight differences of the outlet temperatures resulted in the presented decrease of all plots. The set inlet temperatures of T = 288.15 K and T = 363.15 K deviated up to a maximum of ΔT = 0.66 K of the measured inlet temperatures for the staggered pins and varying mass flow rates. The temperature differences between the hot and cold outlet temperatures reached a minimum value for the straight micro channels of ΔT = 0.12 K. For comparison, the temperature difference of the parallel pins was lowest at ΔT = 1.91 K, and ΔT = 3.19 K for the staggered pins.
The hot temperature difference between inlet and outlet was slightly lower at the highest mass flow rate compared to lower mass flow rates for the staggered pins. The average thermal efficiencies showed an increasing and decreasing trend that can be related to the impact of temperature differences. In this case, the temperatures at the outlet did not have an intense change in comparison to the different mass flow rates, which could be due to additional frictional heating that leads to a lower decrease of hot temperature along the flow path, especially with microstructures, and leading to high flow velocities such as pin fin geometries. The impact of the surroundings might have had an effect on the temperatures due to heat losses. A maximum uncertainty of ΔεTh = ±2.8% was detected for the average thermal efficiency.
3.2.3. Overall Heat Transfer Efficiency
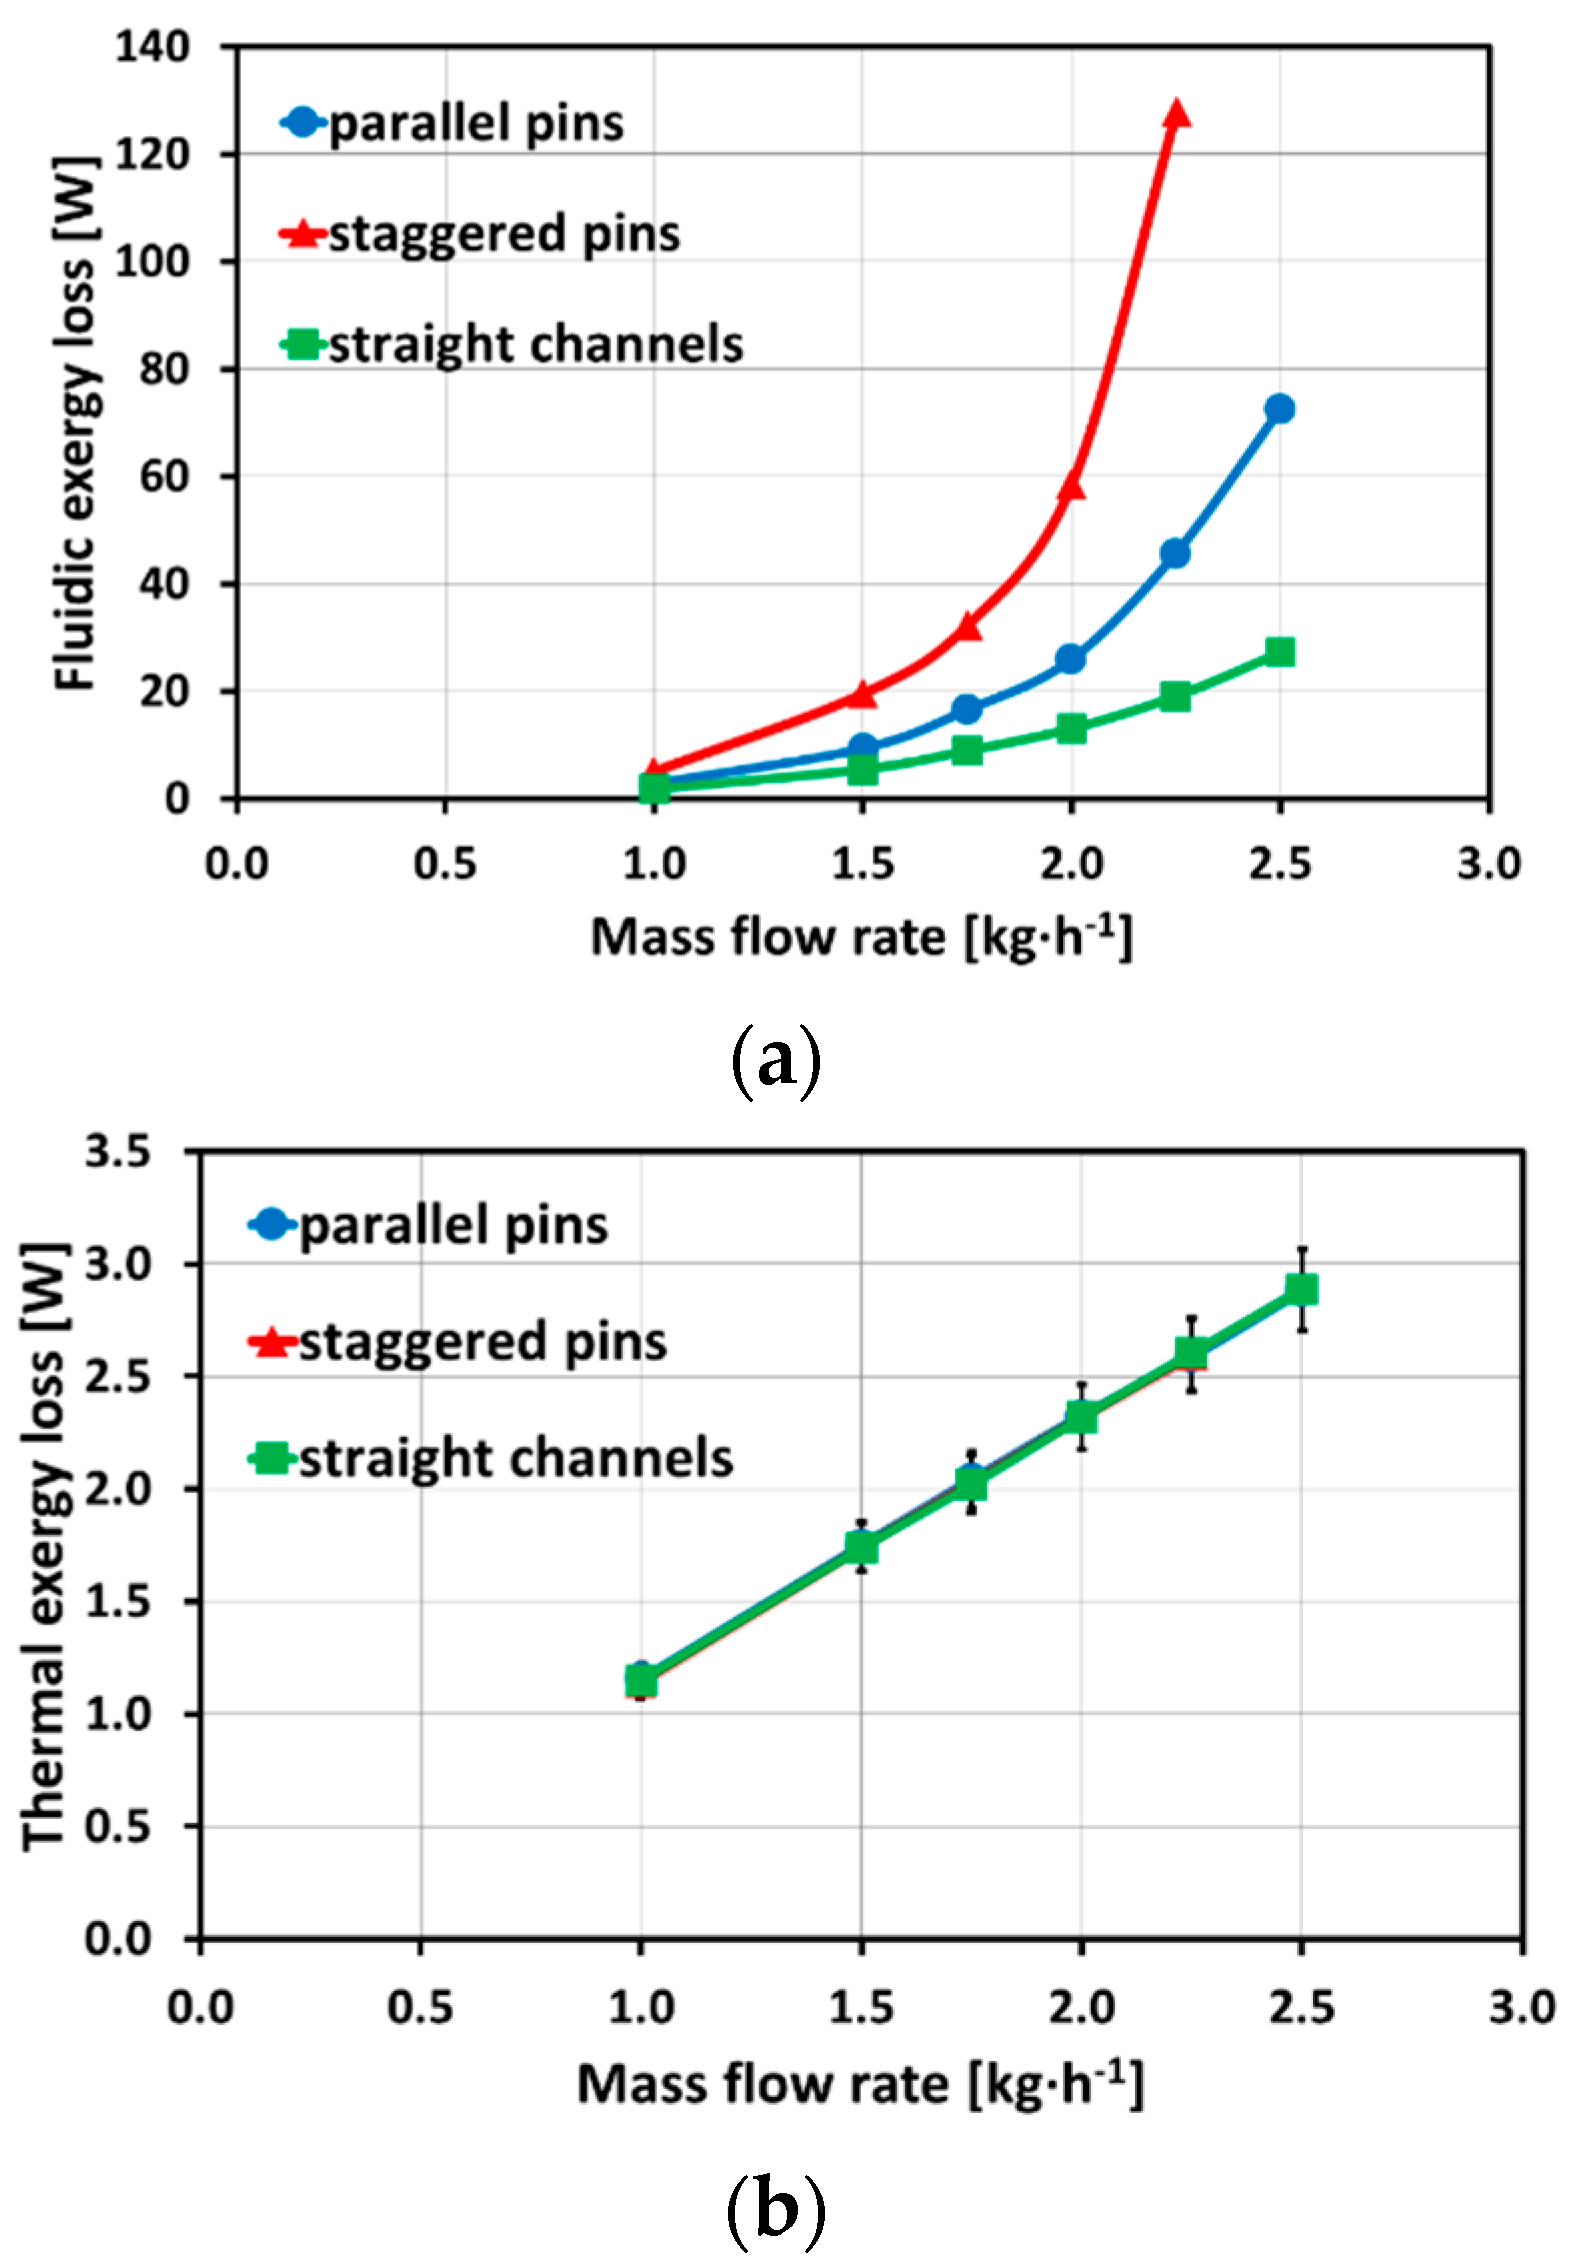
The fluidic exergy loss and the thermal exergy loss are presented in Figure 11a,b, respectively. The fluidic exergy loss presents the same behavior as the average pressure losses. Due to a strong impact of inlet temperature on the thermal exergy loss, and because of similar values for the average thermal efficiency, the thermal exergy loss is overlapping for all microstructures. Connecting the uncertainties of average pressure loss and average thermal efficiency to the fluidic exergy loss and the thermal exergy loss leads to a maximum uncertainty of Δ(ΔEP) = ±1.2 W for the fluidic exergy loss, and a maximum uncertainty of thermal exergy loss of Δ(ΔET) = ±0.2 W. Comparing the magnitudes for fluidic exergy loss and thermal exergy loss leads to the conclusion of a strong impact of fluidic exergy loss on the overall heat exchanger efficiency.
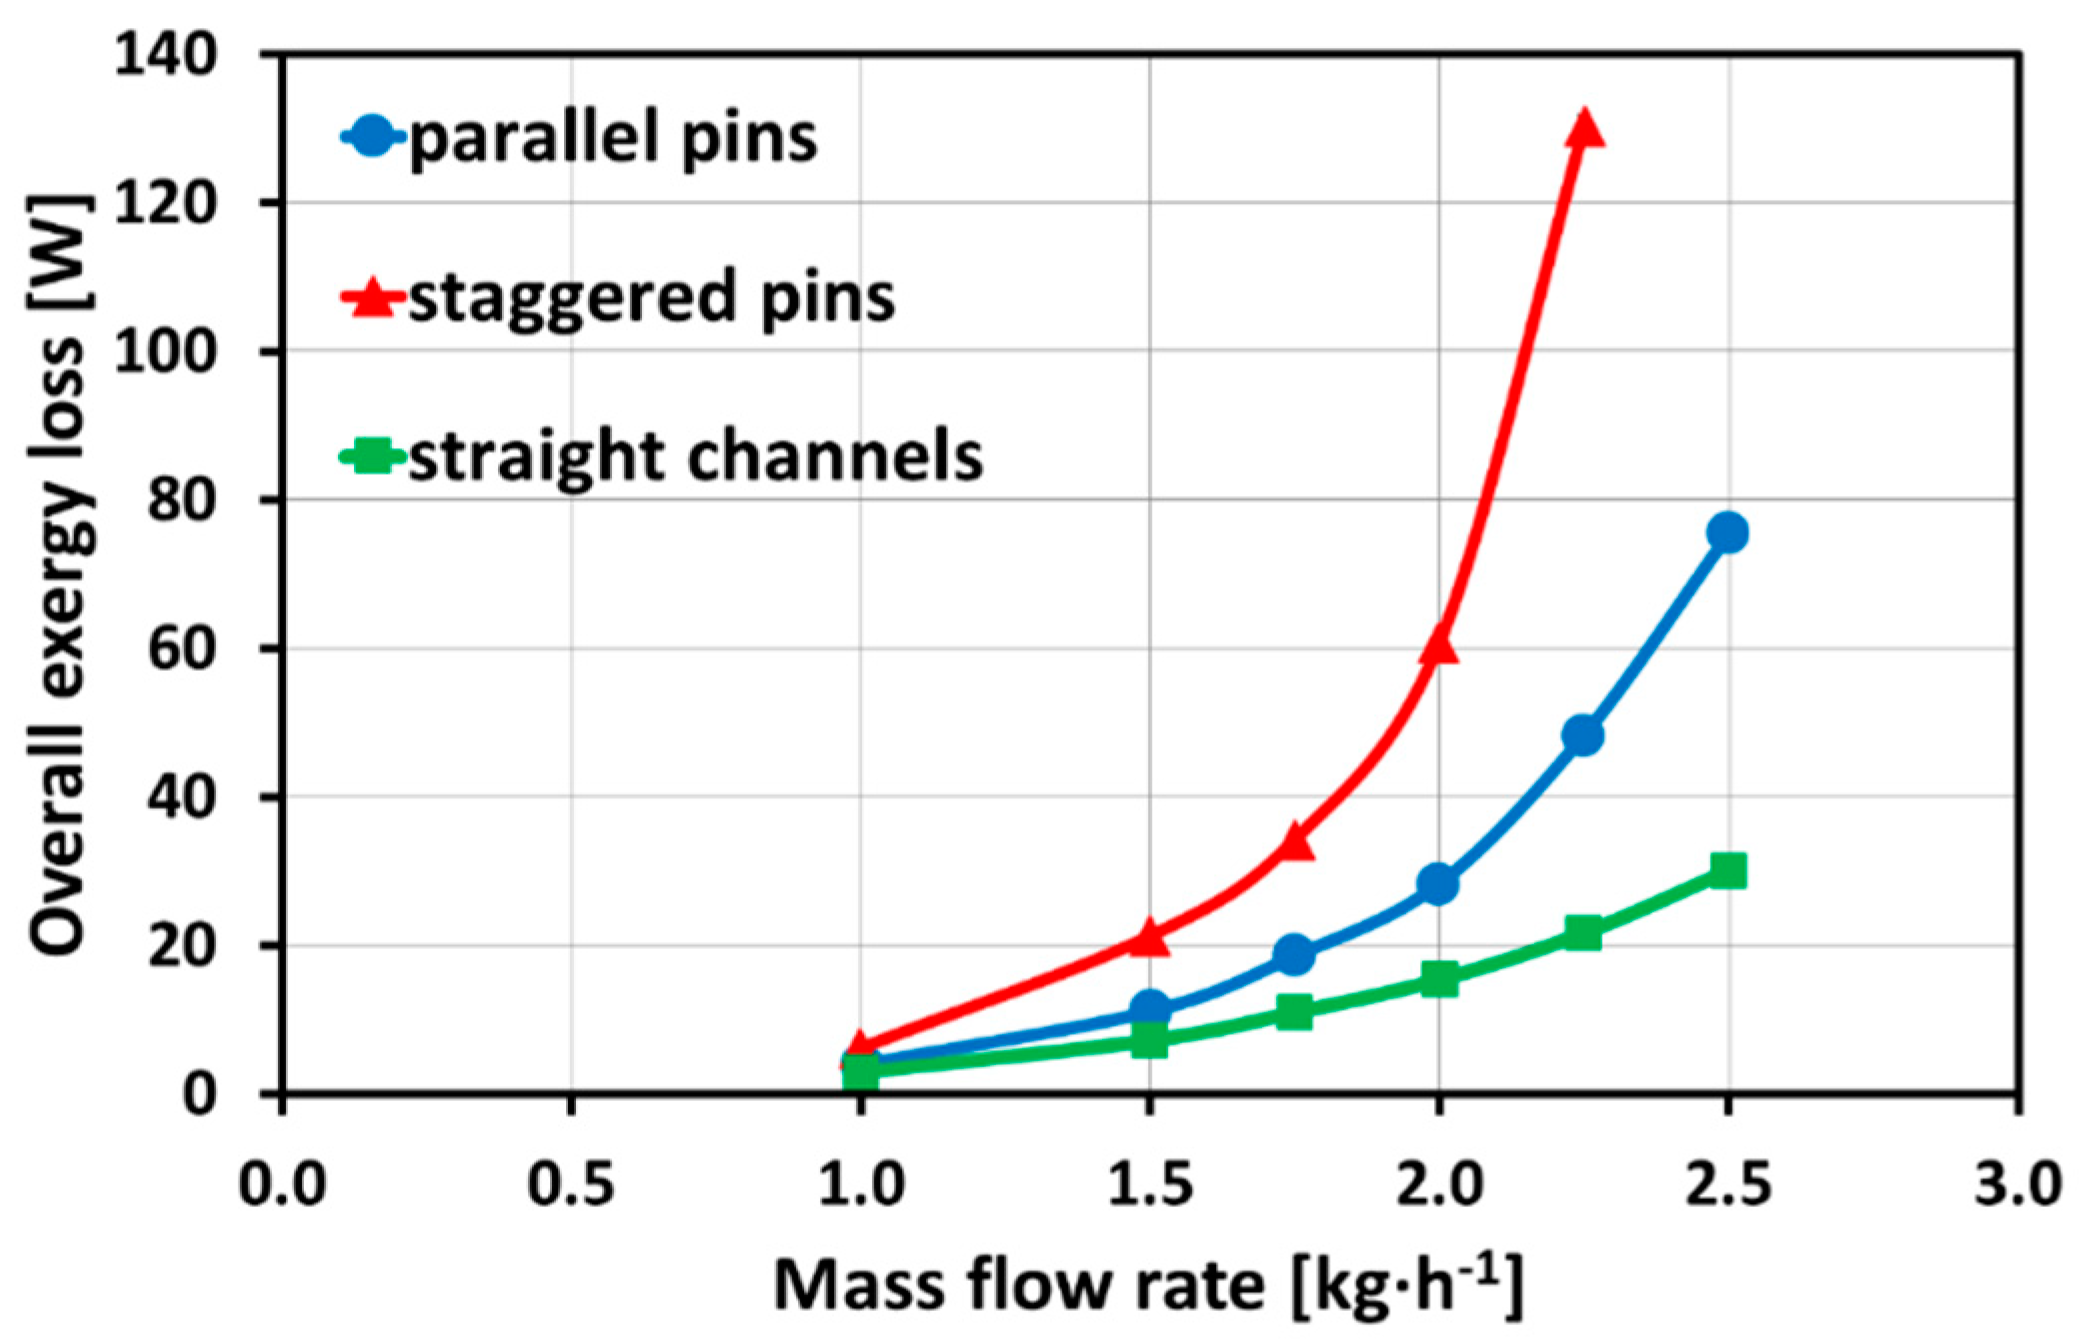
The results shown in Figure 11 are also reflected in Figure 12, illustrating that the overall exergy losses are dominated by the fluidic exergy loss. A maximum uncertainty of Δ(ΔE) = ±1.3 W was detected for the overall exergy loss.
In conclusion, the impact of average pressure loss is the main influence on the overall heat exchanger efficiency. The average pressure loss is influenced by the compressibility and flow transition from laminar to turbulent flow, which generate a strong increase of average pressure losses, especially with staggered pins. At a mass flow rate of = 2 kg·h−1 the fluidic exergy loss of the parallel pins was twice the value compared to the straight micro channel design. The fluidic exergy loss of the staggered pins was four times the value of the straight micro channels. The difference of the thermal exergy loss was negligible for the different pin fins and straight micro channels as an overall heat exchanger assessment with the presented arrangements.
4. Discussion
Microstructure heat exchangers are well known for their superior heat transfer capabilities [3]. However, there has not been very much reported about their use with air as the fluid. In any case, obviously it is of major importance to decide which microstructure can be incorporated into an air heat exchanger device to reach the best possible performance, as indicated by [3,13,22,24,25,33]. For this, the assessment method described in detail in Section 2.3 and earlier by [31], using a combination of the thermal and the fluidic exergy was applied.
The present study focuses on passive techniques of heat transfer enhancement with microstructure designs disturbing linear flow paths by adding local perturbances (pin-fin-arrays). Thus, only for the simple microchannel reference system can a closed description of the hydraulic diameter as characteristic length be assumed, following Equation (1). No description like this can be taken for similar calculations of a characteristic length for pin-fin-array designs. Thus, a simple pre-calculation for the heat transfer capability using the e-NTU-method [17], and the pressure loss behavior with the equation of Hagen–Poisseuille or Blasius [17] cannot be performed. The designs have either to be numerically modeled, or measured, and the experimental values compared afterwards.
From the measurement plots shown in Figure 4 it is obvious that experiment and theory do not match for the pressure losses in straight micro channel heat exchangers. It was mentioned before that the conventional theory does not take into account the pressure losses of the inlet and outlet distribution/collecting systems, as well as possible compressibility effects, thus, the mismatch is not a surprise here.
As can be seen in Section 3, the results indicate that in general the thermal exergy losses are one order of magnitude smaller than the fluidic exergy losses. For each of the tested designs, the plots obtained for the fluidic exergy loss and the total exergy loss look very similar, leading, combined with the above mentioned ratio of the thermal and fluidic exergy losses, to the conclusion that the total exergy loss of the micro heat exchanger system was determined by the pressure loss behavior of the microstructure design. The present study did not include a detailed measurement of the flow distribution and collecting systems at the inlet and the outlet, since they were built symmetrically for both the hot and the cold fluid side. Thus, the contributions of these should be, more or less, the same.
In addition to the investigations with aluminum as material for the plates with microstructures, further investigations with polycarbonate were performed to analyze the impact of thermal conductivity on the overall heat exchanger efficiency. However, from these results it could be seen that the impact of the pressure loss behavior remains the strongest influence on the overall heat exchanger efficiency, and thus is the focus of the presented study. To keep the presented study concise, and although there is more to explore about the impact of different materials on the overall heat exchanger efficiency, the results for polycarbonate structures have not been integrated.
5. Conclusions
In the present study, different microstructure designs were investigated for their capacity to act as efficient countercurrent flow heat exchangers using air as fluid. Straight micro channels were chosen as a reference, and compared to pin-fin array microstructures acting as flow obstacles to enhance the heat transfer. An assessment method for comparison, based on the overall heat exchanger efficiency, taking the thermal and fluidic exergy losses into account, was presented.
The measurement results and discussion provided here show that the named assessment method is a good choice for comparing different microstructure devices in terms of their use for efficient heat transfer. However, the prediction of a microstructure design is not feasible with this method, because it is either based on measurement results or on calculations using a characteristic dimension, i.e., the hydraulic diameter. As long as there is no consistent definition of this characteristic length for any design the presented method fails to predict results for comparison. Thus, a definition of the characteristic dimension is needed that is generally valid for any microstructure design and arrangement. Having this, the assessment method used in the present study could be easily used to predict the best possible microstructure design for the considered case, depending on temperature range and fluid. However, the presented study showed that the thermal efficiency could be increased due to the change from straight micro channels to pin fin array microstructures. Nevertheless, this increase was overruled by the increase of fluidic exergy loss with higher mass flow rates. Thus, the total exergy losses are increased as well. Optimization of this is work for the future.
Microstuctured heat exchangers are one option for improving heat transfer. The presented study focuses on the effects of enhancement of microstructured heat exchangers, namely with a passive enhancement method (pin fin arrangements). Besides the effect of higher heat transfer rates of pin fin geometries in microstructured heat exchangers, the study shows that the overall heat exchanger efficiency is strongly affected by the pressure loss, which is connected to the heat transfer due to artificially induced turbulences. Of course, this trend of increasing heat transfer efficiency with increasing pressure loss is expected, however, it is quite pronounced in the specific microstructured heat exchangers investigated here.
With regard to the presented results one question can be raised: are pin-fin-structures more or less useless because they create higher pressure losses but (almost) no gain in heat transfer compared to micro channel structures? There is no general answer to this question, because it has to be given in direct relation to the requested objective. If the main objective is to transfer as much heat as possible regardless of the pressure losses, any increase in heat transfer efficiency is a gain and welcome. If the task is to minimize the pressure losses at a certain limited heat transfer, pin-fin microstructures may not be the best choice.
For the pin fin structures at the operating conditions considered in this investigation the answer to the raised question is truly that they have no significant use. However, the pin fin structures can be, and may need to be, optimized and application-specific. Doing so, more favorable ratios of pressure loss increase to heat transfer improvement can be achieved. The methods shown here and in [34] provide a means of finding such application-specific optimums. Additionally, the pin fin structures may also be useful in this case to obtain a well-defined flow and residence time distribution by increased pressure loss (see i.e., [35]). Anyway, each of those cases have to be decided separately.
Author Contributions
Conceptualization, I.G. and J.J.B.; methodology, I.G., T.W. and J.J.B.; software, I.G.; validation, I.G., T.W. and J.J.B.; formal analysis, I.G., T.W. and J.J.B.; investigation, I.G.; resources, J.J.B.; data curation, I.G., T.W. and J.J.B.; writing—original draft preparation, I.G. and J.J.B.; writing—review and editing, T.W. and J.J.B.; visualization, I.G.; supervision, T.W. and J.J.B.; project administration, J.J.B.; funding acquisition, J.J.B. All authors have read and agreed to the published version of the manuscript.
Funding
This research received no external funding.
Acknowledgments
This work was partly carried out with the support of the Helmholtz Research Area Information, Materials Systems Engineering, Topic 5 Materials Information Discovery at the Karlsruhe Institute of Technology (KIT, www.kit.edu). We acknowledge support by the KIT-Publication Fund of the Karlsruhe Institute of Technology.
Conflicts of Interest
The authors declare no conflict of interest.
References
- Tuckerman, B.D.; Pease, R.F. High performance heat sinking for VLSI. IEEE Electron. Device Lett. 1981, EDL-2, 126–129. [Google Scholar] [CrossRef]
- Brandner, J.J.; Bohn, L.; Henning, T.; Schygulla, U.; Schubert, K. Microstructure heat exchanger applications in laboratory and industry. Heat Transf. Eng. 2007, 28, 761–771. [Google Scholar] [CrossRef]
- Kandlikar, S.G.; Colin, S.; Peles, Y.; Garimella, S.; Pease, R.F.; Brandner, J.J.; Tuckerman, D.B. Heat Transfer in Microchannels—2012 Status and Research Needs. J. Heat Transf. 2013, 135, 091001. [Google Scholar] [CrossRef] [Green Version]
- Schubert, J.B.K. Microstructure devices for applications in thermal and chemical process engineering. Microscale Thermophys. Eng. 2001, 5, 17–39. [Google Scholar] [CrossRef]
- Joseph, J.; Delanaye, M.; Nacereddine, R.; Giraldo, A.; Rouabah, M.; Korvink, J.; Brandner, J.J. Numerical and experimental investigation of a wire-net compact heat exchanger performance for high-temperature applications. Appl. Therm. Eng. 2019, 154, 208–216. [Google Scholar] [CrossRef]
- Joseph, J.; Delanaye, M.; Nacereddine, R.; Giraldo, A.; Rouabah, M.; Korvink, J.G.; Brandner, J.J. Numerical Study of Perturbators Influence on Heat Transfer and Investigation of Collector Performance for a Micro-Combined Heat and Power System Application. Heat Transf. Eng. 2020, 1–23. [Google Scholar] [CrossRef]
- Joseph, J.; Nacereddine, R.; Delanaye, M.; Korvink, J.G.; Brandner, J.J. Advanced Numerical Methodology to Analyze High-Temperature Wire-Net Compact Heat Exchangers for a Micro-Combined Heat and Power System Application. Heat Transf. Eng. 2019, 41, 934–946. [Google Scholar] [CrossRef]
- Rehman, D.; Morini, G.L.; Hong, C. A comparison of data reduction methods for average friction factor calculation of adiabatic gas flows in microchannels. Micromachines 2020, 11, 218. [Google Scholar] [CrossRef] [Green Version]
- Brandner, J.J. Microstructure devices for process intensification: Influence of manufacturing tolerances and design. Appl. Therm. Eng. 2013, 59, 745–752. [Google Scholar] [CrossRef]
- Brandner, J.; Anurjew, E.; Bohn, L.; Hansjosten, E.; Henning, T.; Schygulla, U.; Wenka, A.; Schubert, K. Concepts and realization of microstructure heat exchangers for enhanced heat transfer. Exp. Therm. Fluid Sci. 2006, 30, 801–809. [Google Scholar] [CrossRef]
- Gerken, I.; Brandner, J.J.; Dittmeyer, R. Heat transfer enhancement with gas-to-gas micro heat exchangers. Appl. Therm. Eng. 2016, 93, 1410–1416. [Google Scholar] [CrossRef] [Green Version]
- Yang, Y.; Brandner, J.J.; Morini, G.L. Hydraulic and thermal design of a gas microchannel heat exchanger. J. Phys. Conf. Ser. 2012, 362, 362. [Google Scholar] [CrossRef]
- Yang, Y.; Gerken, I.; Brandner, J.J.; Morini, G.L. Design and Experimental Investigation of a Gas-to-Gas Counter-Flow Micro Heat Exchanger. Exp. Heat Transf. 2014, 27, 340–359. [Google Scholar] [CrossRef]
- Yang, Y.; Morini, G.; Brandner, J.J. Experimental analysis of the influence of wall axial conduction on gas-to-gas micro heat exchanger effectiveness. Int. J. Heat Mass Transf. 2014, 69, 17–25. [Google Scholar] [CrossRef]
- Bejan, A. General criterion for rating heat-exchanger performance. Int. J. Heat Mass Transf. 1978, 21, 655–658. [Google Scholar] [CrossRef]
- Bejan, A. The thermodynamic design of heat and mass transfer processes and devices. Int. J. Heat Fluid Flow 1987, 8, 258–276. [Google Scholar] [CrossRef]
- VDI Gesellschaft fuer Verfahrenstechnik und Chemieingenieurwesen, V.G.V. VDI Heat Atlas; Springer: Berlin/Heidelberg, Germany, 2010. [Google Scholar]
- Hessel, V.; Renken, A.; Schouten, J.C.; Yoshida, J.I. Micro Process Engineering: A Comprehensive Handbook; John Wiley & Sons: Hoboken, NJ, USA, 2009; Volume 1. [Google Scholar]
- Brandner, J.J. Microfabrication in metals, ceramics and polymers. Russ. J. Gen. Chem. 2012, 82, 2025–2033. [Google Scholar] [CrossRef]
- Kockmann, N. Micro Process Engineering: Fundamentals, Devices, Fabrication, and Applications; Wiley-VCH: Weinheim, Germany, 2006. [Google Scholar]
- Madou, M.J. Fundamentals of Microfabrication: The Science of Miniaturization, 2nd ed.; CRC Press: Boca Raton, FL, USA, 2002. [Google Scholar]
- Colin, S. Gas Microflows in the Slip Flow Regime: A Critical Review on Convective Heat Transfer. J. Heat Transf. 2011, 134, 020908. [Google Scholar] [CrossRef]
- Turner, S.E.; Lam, L.C.; Faghri, M.; Gregory, O.J. Experimental Investigation of Gas Flow in Microchannels. J. Heat Transf. 2004, 126, 753–763. [Google Scholar] [CrossRef]
- Bier, W.; Keller, W.; Linder, G.; Seidel, D.; Schubert, K.; Martin, H. Gas to gas heat transfer in micro heat exchangers. Chem. Eng. Process. Process Intensif. 1993, 32, 33–43. [Google Scholar] [CrossRef]
- Morini, G.L.; Lorenzini, M.; Salvigni, S. Friction characteristics of compressible gas flows in microtubes. Exp. Therm. Fluid Sci. 2006, 30, 733–744. [Google Scholar] [CrossRef]
- Kee, R.J.; Almand, B.B.; Blasi, J.M.; Rosen, B.L.; Hartmann, M.; Sullivan, N.P.; Zhu, H.; Manerbino, A.R.; Menzer, S.; Coors, W.G.; et al. The design, fabrication, and evaluation of a ceramic counter-flow microchannel heat exchanger. Appl. Therm. Eng. 2011, 31, 2004–2012. [Google Scholar] [CrossRef]
- Steinke, M.; Kandlikar, S. Review of single-phase heat transfer enhancement techniques for application in microchannels, minichannels and microdevices. Int. J. Heat Technol. 2004, 22, 3–11. [Google Scholar]
- Webb, R.L.; Kim, N.-H. Principles of Enhanced Heat Transfer; Informa UK Limited: Colchester, UK, 2004. [Google Scholar]
- Sciacovelli, A.; Verda, V.; Sciubba, E. Entropy generation analysis as a design tool—A review. Renew. Sustain. Energy Rev. 2015, 43, 1167–1181. [Google Scholar] [CrossRef]
- Awad, M. A review of entropy generation in microchannels. Adv. Mech. Eng. 2015, 7, 1687814015590297. [Google Scholar] [CrossRef]
- Wu, S.; Li, Y. Exergy-economic criteria for evaluating heat exchanger performance. J. Therm. Sci. 2001, 10, 218–222. [Google Scholar] [CrossRef]
- International Bureau of Weights and Measures; International Federation of Clinical Chemistry and Laboratory Medicine; ISO. IUPAP and OIML. 2008, pp. 1–134. Available online: https://www.bipm.org/en/publications/guides/gum.html (accessed on 18 December 2020).
- Colin, S. Rarefaction and compressibility effects on steady and transient gas flows in microchannels. Microfluid. Nanofluidics 2004, 1, 268–279. [Google Scholar] [CrossRef]
- Gerken, I. Efficiency Improvement of Miniaturized Heat Exchangers. Ph.D. Thesis, Karlsruhe Institute of Technology (KIT), Karlsruhe, Germany, 2020. [Google Scholar]
- Renault, C.; Colin, S.; Orieux, S.; Cognet, P.; Tzedakis, T. Optimal design of multi-channel microreactor for uniform residence time distribution. Microsyst. Technol. 2011, 18, 209–223. [Google Scholar] [CrossRef] [Green Version]
Figure 1.
Exploded view CAD drawing of the gas-to-gas micro heat exchanger: (1) gas inlet, (2) screws, (3) cover plates, (4) plates with microstructures, (5) partitioning foil, and (6) gas outlet.
Figure 1.
Exploded view CAD drawing of the gas-to-gas micro heat exchanger: (1) gas inlet, (2) screws, (3) cover plates, (4) plates with microstructures, (5) partitioning foil, and (6) gas outlet.

Figure 2.
Microstructures made of aluminum: (a) straight micro channels, (b) parallel pins, and (c) staggered pins.
Figure 2.
Microstructures made of aluminum: (a) straight micro channels, (b) parallel pins, and (c) staggered pins.

Figure 3.
Schematic view of the experimental setup for the investigations with gas.

Figure 4.
Average pressure loss for straight micro channels with different inlet temperatures in comparison with conventional theory (with a maximum uncertainty of Δ(Δp) = ±4.0 kPa).
Figure 4.
Average pressure loss for straight micro channels with different inlet temperatures in comparison with conventional theory (with a maximum uncertainty of Δ(Δp) = ±4.0 kPa).

Figure 5.
Thermal efficiency for cold fluid flow (a) and hot fluid flow (b) for case 90, case 70, and case 55 (with a maximum uncertainty of ΔεTh = ±13.6% for the hot thermal efficiency and case 55).
Figure 5.
Thermal efficiency for cold fluid flow (a) and hot fluid flow (b) for case 90, case 70, and case 55 (with a maximum uncertainty of ΔεTh = ±13.6% for the hot thermal efficiency and case 55).


Figure 6.
Average thermal efficiency (a) and heat loss (b) for straight micro channels with different temperature conditions (with a maximum uncertainty of the average thermal efficiency of ΔεTh = ±10.0% and a maximum uncertainty of ΔQ = ±2.4 W for case 90).
Figure 6.
Average thermal efficiency (a) and heat loss (b) for straight micro channels with different temperature conditions (with a maximum uncertainty of the average thermal efficiency of ΔεTh = ±10.0% and a maximum uncertainty of ΔQ = ±2.4 W for case 90).

Figure 7.
Fluidic exergy loss (a) and thermal exergy loss (b) for case 90, case 70, and case 55 (with a maximum uncertainty of fluidic exergy loss of Δ(ΔEP) = ±0.6 W and a maximum uncertainty of thermal exergy loss of Δ(ΔET) = ±0.2 W).
Figure 7.
Fluidic exergy loss (a) and thermal exergy loss (b) for case 90, case 70, and case 55 (with a maximum uncertainty of fluidic exergy loss of Δ(ΔEP) = ±0.6 W and a maximum uncertainty of thermal exergy loss of Δ(ΔET) = ±0.2 W).

Figure 8.
Overall exergy loss for straight micro channels with different temperature conditions (with a maximum uncertainty of Δ(ΔE) = ±0.7 W).
Figure 8.
Overall exergy loss for straight micro channels with different temperature conditions (with a maximum uncertainty of Δ(ΔE) = ±0.7 W).

Figure 9.
Average pressure losses as a function of mass flow rate for different microstructures (with a maximum uncertainty of Δ(Δp) = ±4.0 kPa).
Figure 9.
Average pressure losses as a function of mass flow rate for different microstructures (with a maximum uncertainty of Δ(Δp) = ±4.0 kPa).

Figure 10.
Average thermal efficiency as a function of mass flow rate for parallel pins, staggered pins, and straight channels; zoom in on the ordinate (40%–65%) to highlight the different behaviors (with a maximum uncertainty of ΔεTh = ±2.8%).
Figure 10.
Average thermal efficiency as a function of mass flow rate for parallel pins, staggered pins, and straight channels; zoom in on the ordinate (40%–65%) to highlight the different behaviors (with a maximum uncertainty of ΔεTh = ±2.8%).

Figure 11.
Fluidic exergy loss (a) and thermal exergy loss (b) for different microstructures (with a maximum uncertainty of fluidic exergy loss of Δ(ΔEP) = ±1.2 W and a maximum uncertainty of thermal exergy loss of Δ(ΔET) = ±0.2 W).
Figure 11.
Fluidic exergy loss (a) and thermal exergy loss (b) for different microstructures (with a maximum uncertainty of fluidic exergy loss of Δ(ΔEP) = ±1.2 W and a maximum uncertainty of thermal exergy loss of Δ(ΔET) = ±0.2 W).

Figure 12.
Overall exergy loss for parallel pins and staggered pins in comparison with straight channels (with a maximum uncertainty of Δ(ΔE) = ±1.3 W).
Figure 12.
Overall exergy loss for parallel pins and staggered pins in comparison with straight channels (with a maximum uncertainty of Δ(ΔE) = ±1.3 W).


Table 1.
Fluid properties of air [17].
Table 1.
Fluid properties of air [17].
| Property (at 293.15 K and p = 100 kPa (rel)) | Unit | Air |
|---|---|---|
| Density | 1.19 | |
| Dynamic viscosity | Pa·s | 0.000018 |
| Kinematic viscosity | 0.000015 | |
| Specific heat capacity | 1006 | |
| Heat conductivity | 0.03 | |
| Prandtl number | – | 0.71 |
Table 2.
Deviations of fluid properties of air in relation to lowest investigated condition (T = 273.15 K or p = 100 kPa (rel)).
Table 2.
Deviations of fluid properties of air in relation to lowest investigated condition (T = 273.15 K or p = 100 kPa (rel)).
| Thermal Conductivity | Dynamic Viscosity | Specific Heat Capacity | Compressibility Factor | Density | ||
|---|---|---|---|---|---|---|
| (%) | (%) | Isobaric (%) | Isochoric (%) | (%) | (%) | |
| Maximum deviation from temperature of T = 273.15 K | 43.68 | 39.55 | 1.09 | 1.76 | 0.76 | 35.95 |
| Maximum deviation from pressure of p = 100 kPa (rel) | 1.40 | 0.81 | 1.79 | 0.39 | 0.50 | 904.70 |
Table 3.
Parameter Y depending on the microstructured arrangement for the calculation of the thermal resistance to axial heat conduction.
Table 3.
Parameter Y depending on the microstructured arrangement for the calculation of the thermal resistance to axial heat conduction.
| Microstructure Arrangement | Y |
|---|---|
| Straight channels | nchannel − 1 |
| Parallel pins | |
| Staggered pins |
Table 4.
Dimensions of the experimentally tested microstructures.
| Straight Micro Channels | Parallel Pins | Staggered Pins | |
|---|---|---|---|
| Height (m) | 0.0001 | 0.0001 | 0.0001 |
| Dimensions of pins | |||
| Length (m) | 0.0235 | 0.0010 | 0.0010 |
| Width (m) | 0.0005 | 0.0005 | 0.0005 |
| Dimensions of pitch | |||
| Length (m) | 0.0235 | 0.0010 | 0.0010 |
| Width (m) | 0.0010 | 0.0010 | 0.0010 |
| Number of rows per column | 11 channels | 11 columns, 11 rows per column | 11 columns, 6 rows per column 10 columns, 5 rows per column |
| Heat transfer area (m2) | 0.00057 | 0.00067 | 0.00066 |
| Active volume (m3) | 2.6 × 10⁻⁸ | 3.1 × 10⁻⁸ | 3.1 × 10⁻⁸ |
Table 5.
Operating conditions for the clamped microstructure heat exchanger examined with air.
| Operating Condition | Unit | Clamped Micro Heat Exchanger |
|---|---|---|
| Mass flow rate | 1.00, 1.50, 1.75, 2.00, 2.25, 2.50 | |
| Inlet pressure (hot and cold fluid flow) | kPa (rel) | 700 |
Table 6.
Operating conditions for the clamped microstructure heat exchanger examined with air.
| Heat Exchanger | Fluid | Object of Investigation | Case Name | |
|---|---|---|---|---|
| Clamped micro heat exchanger | Air | Straight micro channel, different inlet temperatures: | ||
| Hot fluid flow (K) | Cold fluid flow (K) | |||
| 363.15 | 288.15 | Case 90 | ||
| 343.15 | 288.15 | Case 70 | ||
| 328.15 | 308.15 | Case 55 | ||
| Pin fin geometries and rectangular channel (case 90, aluminum) | Parallel pins | |||
| Staggered pins | ||||
| Straight channels | ||||
Table 7.
Operating conditions for the clamped microstructure heat exchanger examined with air.
| Maximum Mach Number (-) Macritical > 0.3 | Maximum Pressure Ratio (-) (Δp/pin)critical > 0.05 | |
|---|---|---|
| Straight micro channels (Aluminum) | ||
| 0.25 | 0.21 |
| 0.25 | 0.20 |
| 0.25 | 0.20 |
| Parallel pins (Case 90, Aluminum) | 0.38 | 0.48 |
| Staggered pins (Case 90, Aluminum) | 0.70 | 0.74 |
Publisher’s Note: MDPI stays neutral with regard to jurisdictional claims in published maps and institutional affiliations. |
© 2021 by the authors. Licensee MDPI, Basel, Switzerland. This article is an open access article distributed under the terms and conditions of the Creative Commons Attribution (CC BY) license (http://creativecommons.org/licenses/by/4.0/).
Share and Cite
MDPI and ACS Style
Gerken, I.; Wetzel, T.; Brandner, J.J. Efficiency Improvement of Miniaturized Heat Exchangers. Fluids 2021, 6, 25. https://0-doi-org.brum.beds.ac.uk/10.3390/fluids6010025
AMA Style
Gerken I, Wetzel T, Brandner JJ. Efficiency Improvement of Miniaturized Heat Exchangers. Fluids. 2021; 6(1):25. https://0-doi-org.brum.beds.ac.uk/10.3390/fluids6010025
Chicago/Turabian StyleGerken, Iris, Thomas Wetzel, and Jürgen J. Brandner. 2021. "Efficiency Improvement of Miniaturized Heat Exchangers" Fluids 6, no. 1: 25. https://0-doi-org.brum.beds.ac.uk/10.3390/fluids6010025