
Static Pressure Distribution on Long Cylinders as a Function of the Yaw Angle and Reynolds Number

1
Department of Aerospace Engineering, University of Michigan, Ann Arbor, MI 48109, USA
2
Department of Mechanical Engineering, Northwestern University, Evanston, IL 60208, USA
*
Author to whom correspondence should be addressed.
†
Deceased author.
Fluids 2021, 6(5), 169; https://0-doi-org.brum.beds.ac.uk/10.3390/fluids6050169
Submission received: 1 April 2021
/
Revised: 16 April 2021
/
Accepted: 19 April 2021
/
Published: 22 April 2021
(This article belongs to the Special Issue Turbulent Flows at Solid and Free Surface Boundaries in Memory of William W. Willmarth)
Abstract
:This paper addresses the challenges of pressure-based sensing using axisymmetric probes whose axes are at small angles to the mean flow. Mean pressure measurements around three yawed circular cylinders with aspect ratios of 28, 64, and 100 were made to determine the effect of changes in the yaw angle, γ, and freestream velocity on the average pressure coefficient, , and drag coefficient, . The existence of four distinct types of circumferential pressure distributions—subcritical, transitional, supercritical, and asymmetric—were confirmed, along with the appropriateness of scaling and on a streamwise Reynolds number, , based on the freestream velocity and the fluid path length along the cylinder in the streamwise direction. It was found that there was a distinct difference in the values of and at identical values for cylinders yawed between 5° and 30°, and for cylinders at greater than a 30° yaw. For γ < 5°, there did not appear to be any large-scale vortices in the near wake, and and pN appeared to become independent of . Over the range of 5° ≤ γ ≤ 30°, there was a complex interplay of freestream speed, yaw angle, and aspect ratio that affected the formation and shedding of Kármán-like vortices.
1. Introduction
The problem addressed in this investigation was that of the static pressure distribution that developed on the surface of a long circular cylinder immersed in a laminar flow at small angles of yaw, γ. The interest in this problem lies in the direct applicability to the measurement of local static pressures using a static pressure probe. In situations where the flow is not aligned with the probe axis, asymmetries in the flow may affect the circumferential pressure distribution and measurement errors may result. There are also hydrodynamic applications related to towed sensor arrays when there is a small cross-current or when the towing vessel is turning. When this happens, the pressure field along the array becomes even more complex with added noise due to the cable wake.
Another important application is the aeroacoustics generated by yawed cylinders at high speeds. One such example is the pantographs on high-speed electric trains, i.e., the spring-loaded connector to the power lines. This can be a major noise source [1] with all the associated environmental and health concerns.
Because the cylinder disturbs the flow, even for γ = 0°, it is important to understand the relationship between the measured pressure at the cylinder surface and the actual static pressure of the flow. It is well known that the flow over a circular cylinder that is oriented perpendicular to the flow is not at all simple. However, the flow over a yawed cylinder is further complicated by the lack of symmetry of the geometry.
The axial symmetry of the boundary layer formed on a cylinder aligned with the flow was shown to be highly sensitive to small yaw angles [2,3]. This, in turn, affects the average pressure readings by the pressure probe. Thus, unless the attitude of the probe relative to the flow direction is known, the static pressure developed on the surface of the probe may not be characteristic of the static pressure in the flow. This investigation aimed to determine the effect of changes in yaw angle and freestream velocity on the average pressure coefficient around the circumference of a circular cylinder.
The problem of flow over yawed cylinders at an angle of attack first attracted attention in the 1950s. At that time, research was carried out to determine the lift and drag characteristics of an aircraft fuselage in supersonic flight. Since then, several significant works have been published for cylinders that are yawed at relatively large angles to the flow direction.
Bursnall and Loftin [4] conducted exhaustive studies of pressure distributions around cylinders in subsonic air flows. They investigated a range of 30° ≤ γ ≤ 90° over a Reynolds number range of 6 × 10⁴ ≤ ≤ 6 × 10⁵, where the Reynolds number, , is based on cylinder diameter, D, and the component of velocity normal to the cylinder axis. With the obtained distributions, Bursnall and Loftin [4] identified three types of local pressure profile shapes, vs. θ, and related them to similar profiles obtained around a cylinder oriented perpendicular to the flow, i.e., with γ = 90°. Each profile shape was characteristic of a different type of cylinder boundary layer separation, i.e., laminar separation, laminar separation with turbulent reattachment, and turbulent separation.
Bursnall and Loftin [4] used their data to calculate the normal drag coefficients, , and plotted their results against . However, it was argued [4] that the characteristic length of the cylinder should be D/sinγ, thereby leading to the definition of a streamwise Reynolds number, :
where is the freestream velocity and ν is the kinematic viscosity. It was further shown [5] that the use of allowed the normal drag coefficient, , to collapse onto a single curve. This suggests that inviscid sweepback theory, the idea that only the flow normal to the axis of a yawed cylinder affects the transverse and drag forces, may be applicable for yawed cylinder flows. Accordingly, when integrating pressures around the cylinder to calculate the drag, the axial flow pressure contributions will cancel, leaving only the contributions from the normal flow. When inviscid sweepback theory is valid, it is physically reasonable to define the drag and pressure coefficients as follows:
and
where , , , and L are the drag force, freestream velocity, velocity normal to the cylinder, and cylinder length, respectively. Furthermore, it is expected that plots of each of these coefficients against should collapse onto a single curve that is identical to that obtained from a cylinder oriented perpendicular to the flow.
One of the earliest studies [6] of yawed cylinder wakes used the flow over an impulsively started cylinder as a model. The idea was that the flow field at a particular position along the length of the yawed cylinder will have a one-to-one correspondence with the flowfield at some instant of time in the impulsively started cylinder case. However, vorticity measurements in the wake of yawed cylinders [7], led to the conclusion that this model is not correct. It was suggested that a combination of impulse flow theory with the dynamics of a Kármán vortex street would provide a quantitatively more accurate description.
More recently, there have been several studies on flow past yawed cylinders [8,9,10,11,12,13] addressing a variety of aspects of the flow. Wall pressure spectra [8] were of interest in the context of flow noise associated with towed sensor arrays. A detailed computational study [9] examined the time-dependent flow past an infinite cylinder, i.e., one with periodic end conditions, for 30° < γ < 90° (using the present convention that γ = 0° corresponds to the cylinder axis aligned with the flow). Studies around slotted [10] and rectangular [11] cylinders were also examined.
There are two recent studies [12,13] that are closely related to the present work, both of which focused on the transverse or normal forces acting on cylinders with a small γ. Divaret et al. [12] conducted both computational and experimental studies of flows around cylinders for γ from 0° to 15°. They measured and computed flow fields at several stations along a cylinder’s length from the nose to an L/D of 29. They also measured pressure distributions around a cylinder’s circumference at L/D = 23. In the context of this present study, the limitation of the paper by Divaret et al. [12] is that only the γ = 5° case was presented.
Ersdal and Faltinsen [13] examined the normal forces on stationary and oscillating cylinders with aspect ratios from 10.5 to 31.3 for γ between 0° and 20° for stationary cases and 4° and 50° for cases where the cylinder was subjected to harmonic oscillation normal to its axis. They developed a set of empirical normal drag coefficient models based on their measurements for a fixed γ at = 2 × 10⁵ and 3.4 × 10⁵. In addition, they examined the effect on drag coefficient when the cylinder boundary layer transitioned from laminar to turbulent. They showed that decreased from ≈1.2 to 0.8 as a result of this transition.
It is widely understood that for small γ, something analogous to a Kármán vortex street forms on the leeward side of the cylinder. The key difference is that the vortices actually remain attached to the cylinder close to the nose. This is discussed in detail in Thomson and Morrison [5]. What is unclear is how far along the length of the cylinder this attached vortex phenomenon extends and over what range of yaw angles. For very small angles, the development of any type of organized shed vorticity will be affected by the boundary layer developing along the cylinder’s length. These effects will depend not only on the sweep angle but also on the flow speed and cylinder aspect ratio.
Clearly, there are many unexplored areas of investigation in the study of yawed cylinder flow. Therefore, this investigation aimed to develop further insight into this complex flow. Specifically, the research objectives of this investigation were as follows:
- -
- Test whether inviscid sweepback theory, combined with the vs. Re and vs. Re curves for cylinders aligned perpendicular to the flow are sufficient to predict and at various values of for a wide range of γ.
- -
- Determine a lower limit where the sweepback formulae are no longer valid, i.e., to explore whether it is possible to extend the current limit of γ = 30° down to an as yet undetermined lower limit.
2. Materials and Methods
2.1. Wind Tunnel and Model
Mean pressure measurements were made separately on three yawed circular cylinders in The University of Michigan closed-circuit wind tunnel. The test section measured 2.13 m wide, 1.52 m high, and 7.62 m long. The maximum wind speed in the tunnel was approximately 76 m/s. A 15:1 contraction ratio diffuser accelerated the flow from a settling chamber fitted with a series of screens to ensure a centerline turbulence intensity of less than 0.6%.
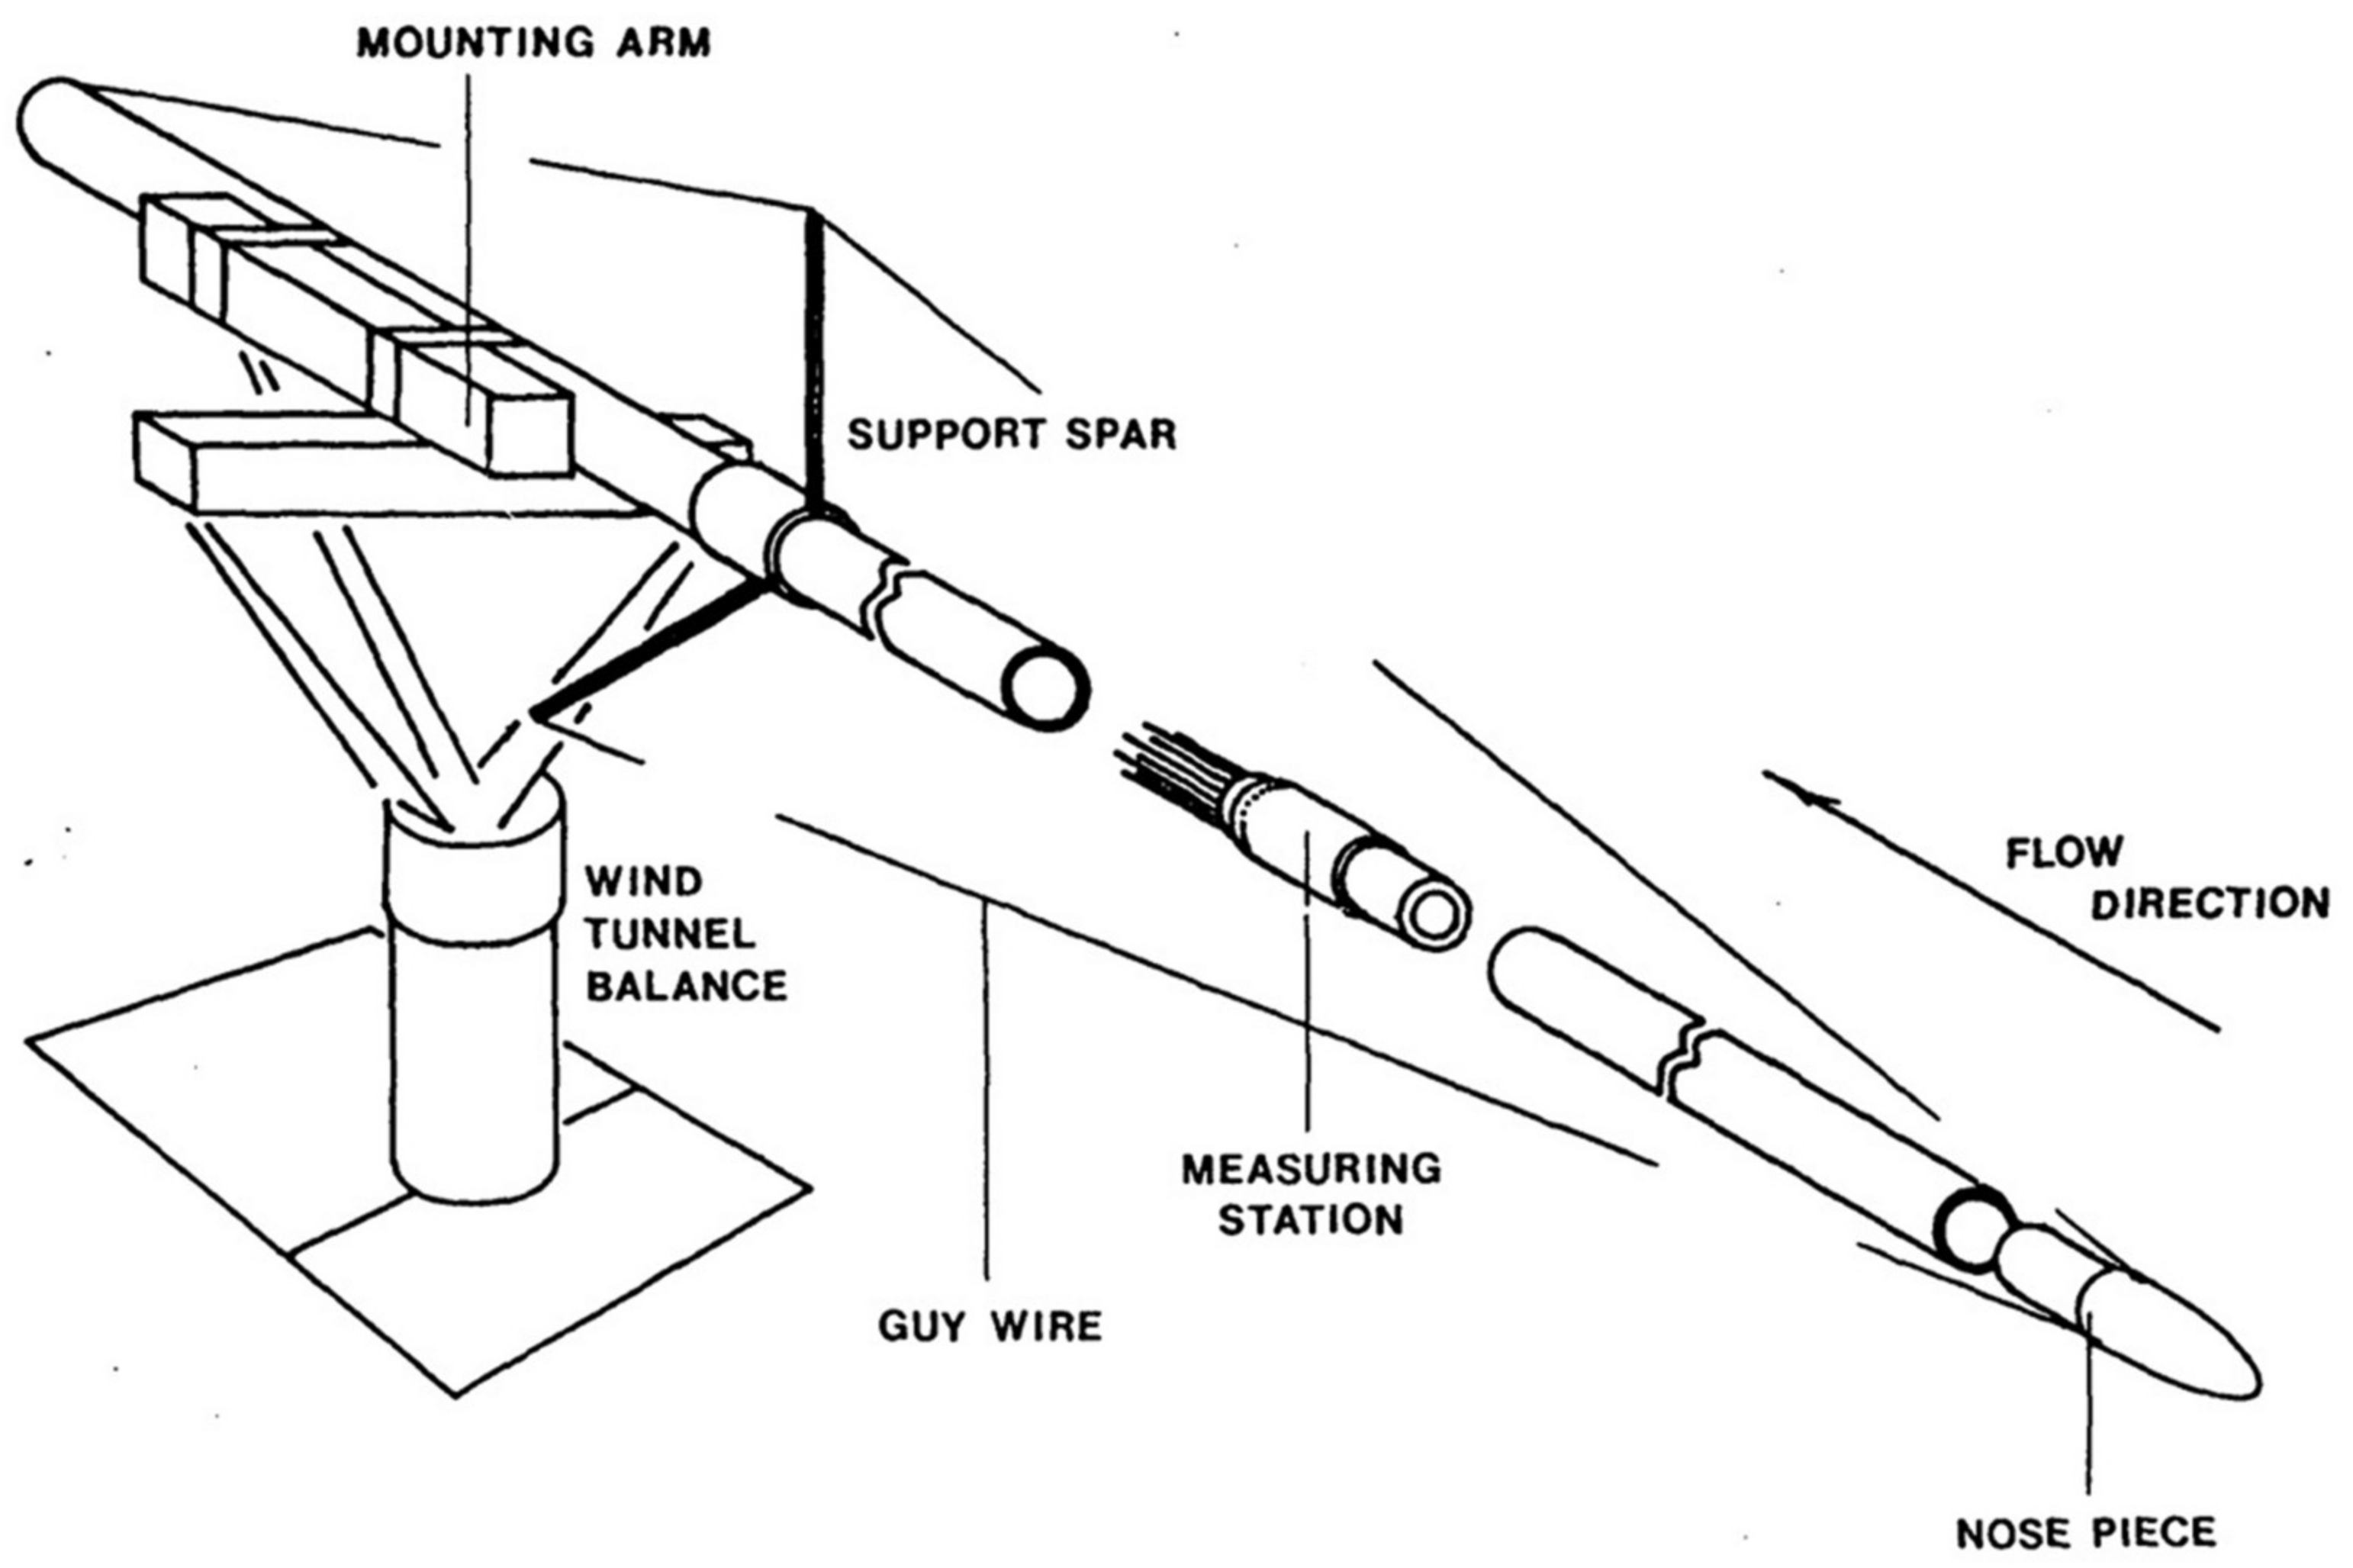
The cylinders were assembled from two lengths of aluminum tubing on either end of a cylindrical pressure tap segment and an elliptical nose piece. An assembly drawing appears in Figure 1. The nose piece was machined from a section of a 2.54 cm diameter cylindrical aluminum bar stock to form one half of an ellipsoid of revolution with a major-to-minor axis ratio of 4.5.
The measuring station, i.e., the cylindrical pressure tap segment, was machined from a 12.7 cm length of 2.54 cm O.D. brass tube. Twenty-four 0.16 cm diameter pressure taps were drilled radially into the tube at 15° intervals at a fixed distance from one end. Clear plastic tubing was used to connect the pressure taps to a transducer. Both ends of the measuring station were machined to fit snugly inside the aluminum tubes.
Three interchangeable sections of aluminum tubing—60 cm, 152 cm, and 243 cm long and 2.54 cm in diameter, D—were placed upstream of the measuring station. An additional 137 cm length of aluminum tube was placed downstream of the measuring station. The distances from the tip of the elliptical nose to the pressure taps, L, for the three cylinders were 71.1 cm, 163 cm, and 254 cm, to provide aspect ratios, L/D, of 28, 64, and 100, respectively. These will be referred to as the ‘short,’ ‘medium,’ and ‘long’ cylinders. The overall cylinder lengths were 208 cm, 300 cm, and 291 cm.
To eliminate sagging of the medium and long cylinders, three 30.5 cm long spars were placed 61 cm downstream of the pressure taps were spaced circumferentially 120° apart. These are shown in Figure 1. A length of steel piano wire, 0.04 cm in diameter, was pulled in tension from the elliptical nose over each spar and attached to the downstream end of the cylinder, as shown in Figure 1. The tension could be adjusted using turnbuckles fixed at the downstream attachment point. The straightness, yaw, and angle of attack were checked by measuring the distance from the cylinder to the wind tunnel wall and floor for several streamwise locations.
2.2. Pressure Measurements
Pressure data were collected for the twenty-four circumferential pressure taps on each cylinder as a function of γ and . Pressure taps can be seen as a ring of dots around the measuring station in the schematic in Figure 1. In addition, a pitot-static probe was positioned close to the cylinder mounting point in the test section in order to determine the wind tunnel speed in the vicinity of the pressure measurement station. In total, there were twenty-six separate pressure measurements.
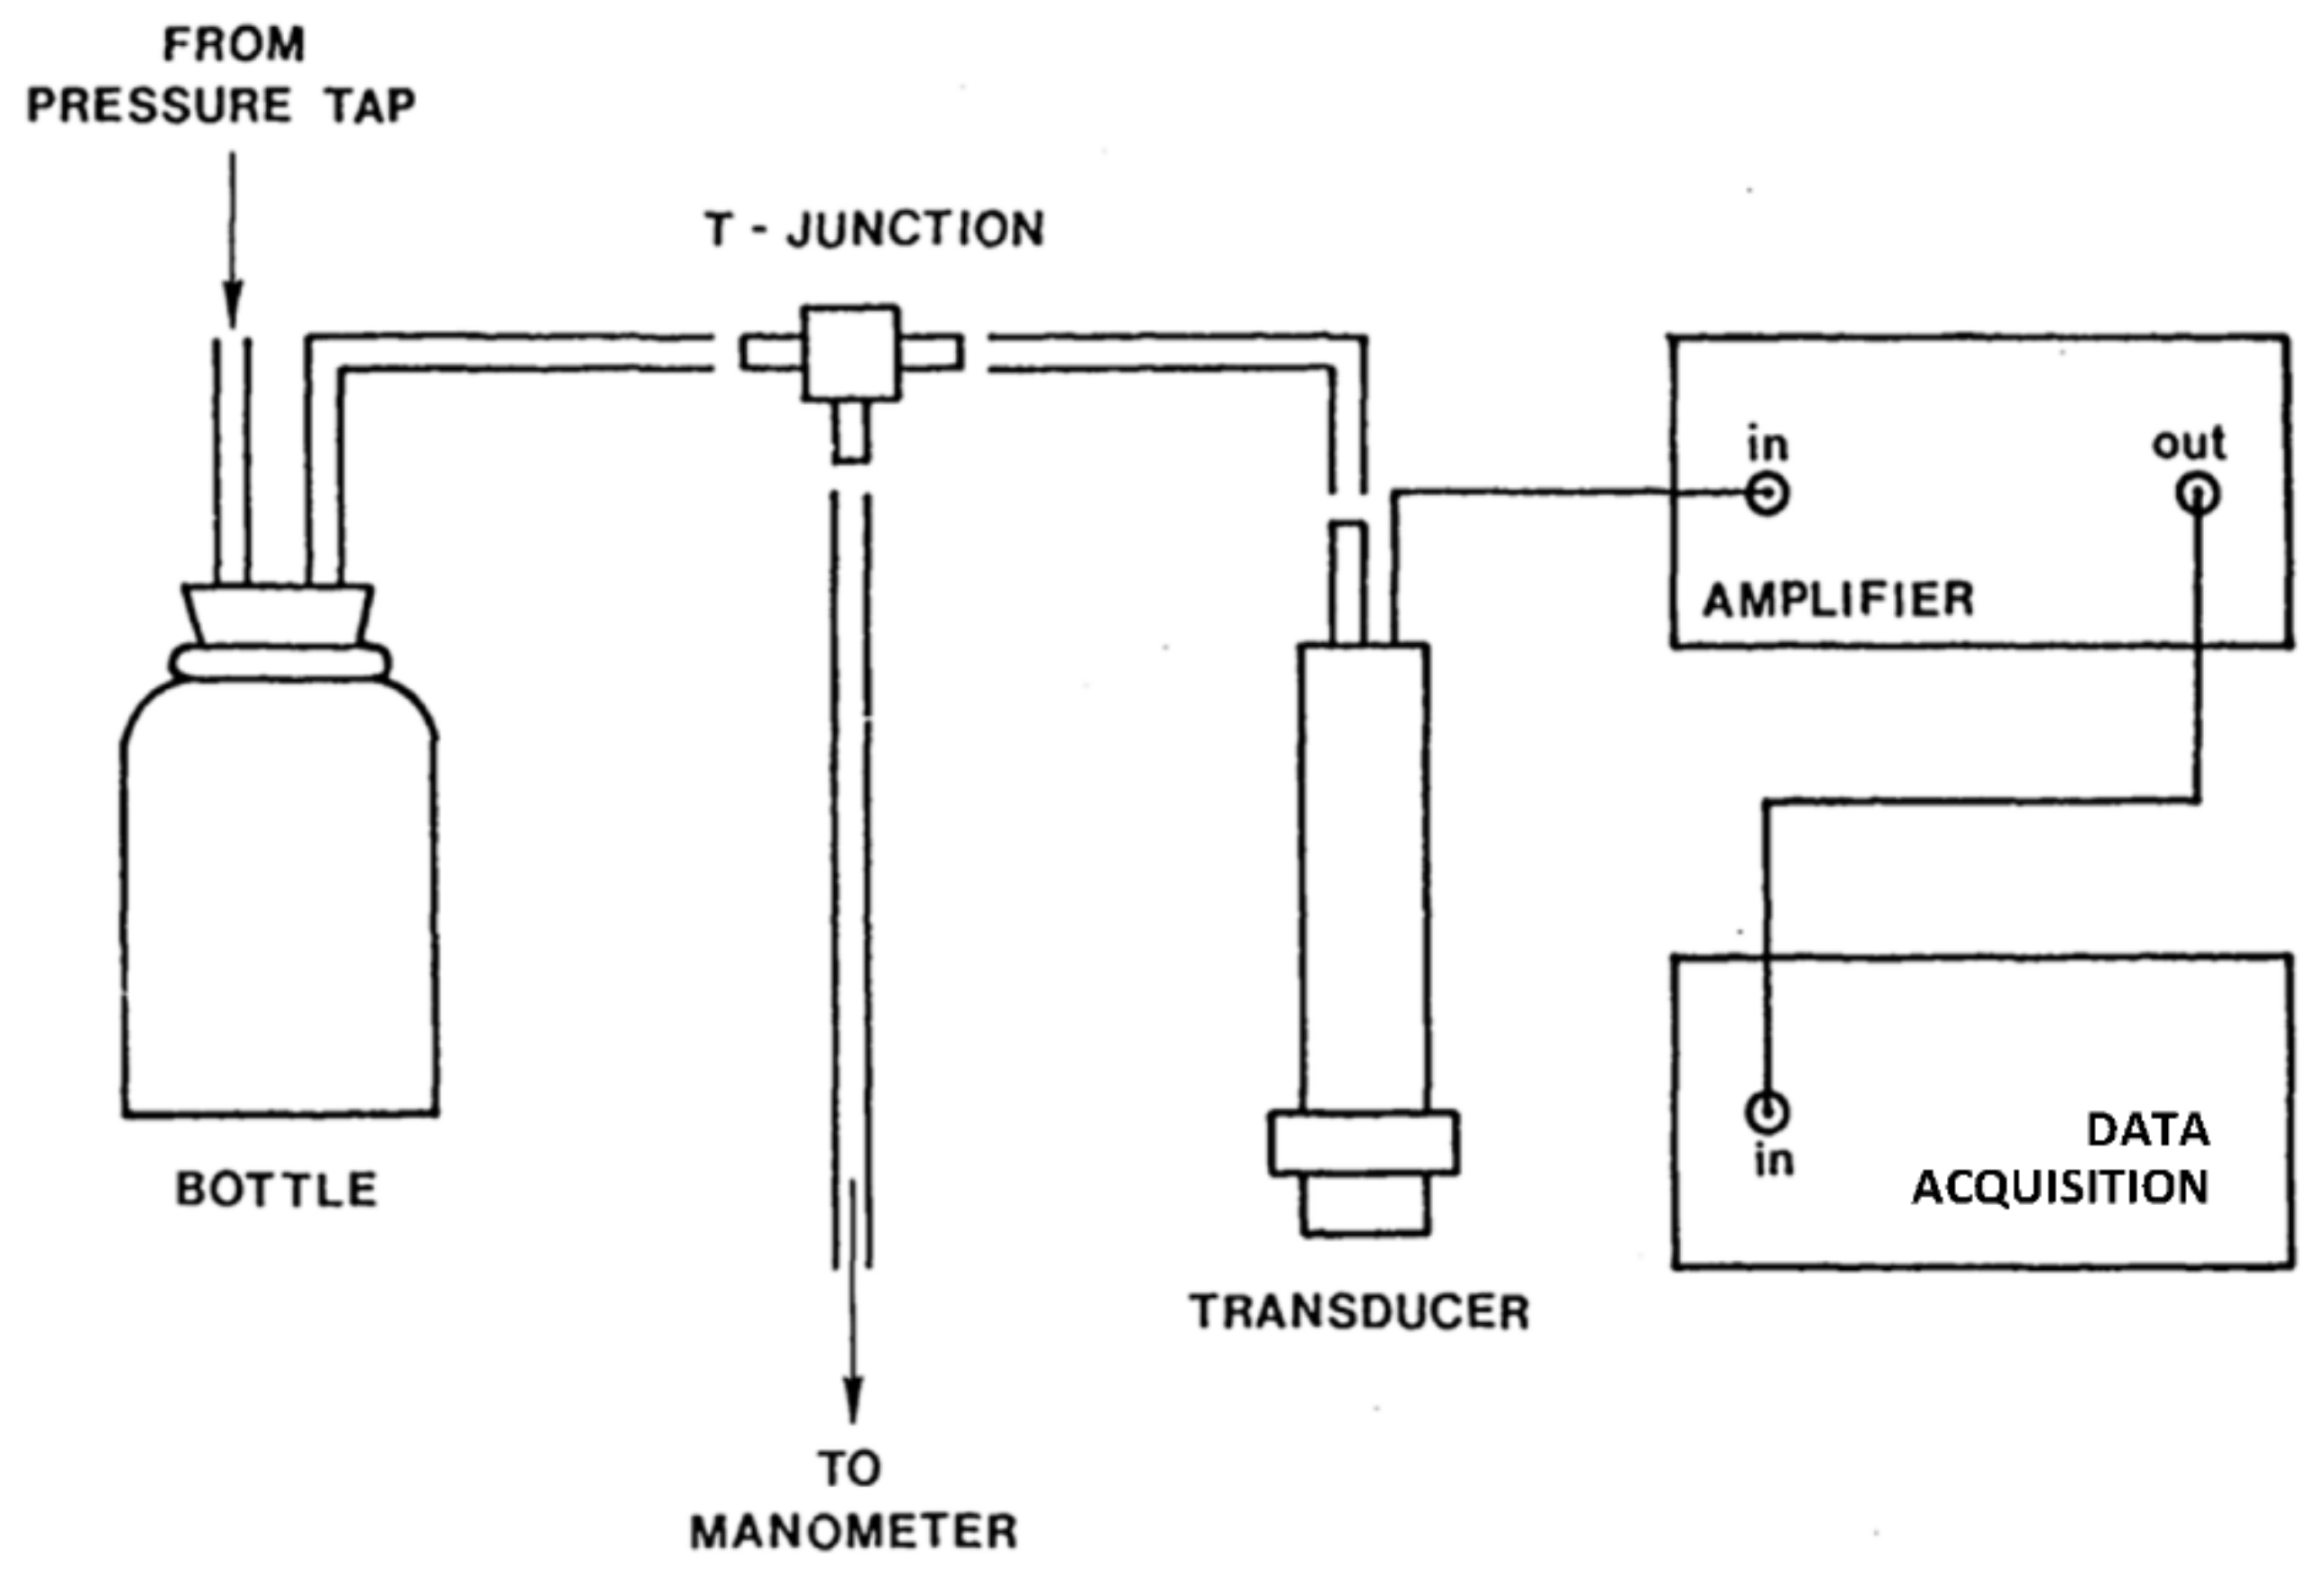
Pressure measurements were made using a Setra Systems Model 237 low-range pressure transducer mounted to an in-house scanivalve. This is illustrated in Figure 2. Each of the twenty-six pressure lines was connected to 236 mL glass pharmaceutical bottles to mechanically filter the pressure fluctuations [14]. These lines were connected to both the scanivalve and a bank of oil manometers (S.G. = 0.826). Visual observation of the manometers indicated that pressure fluctuations above 0.2 Hz were effectively filtered by the volume of air in the pharmaceutical bottles. As such, transducer measurements were averaged over 3 to 5 s by leaving the scanivalve connected to each line for that amount of time. To place this sampling time in context, the Kármán vortex shedding frequency for the lowest speed was over 150 Hz. With a sampling time of 5 s for this lowest speed, the pressure was averaged over 750 vortex shedding periods. The mean pressure measurements were highly resolved.
3. Results
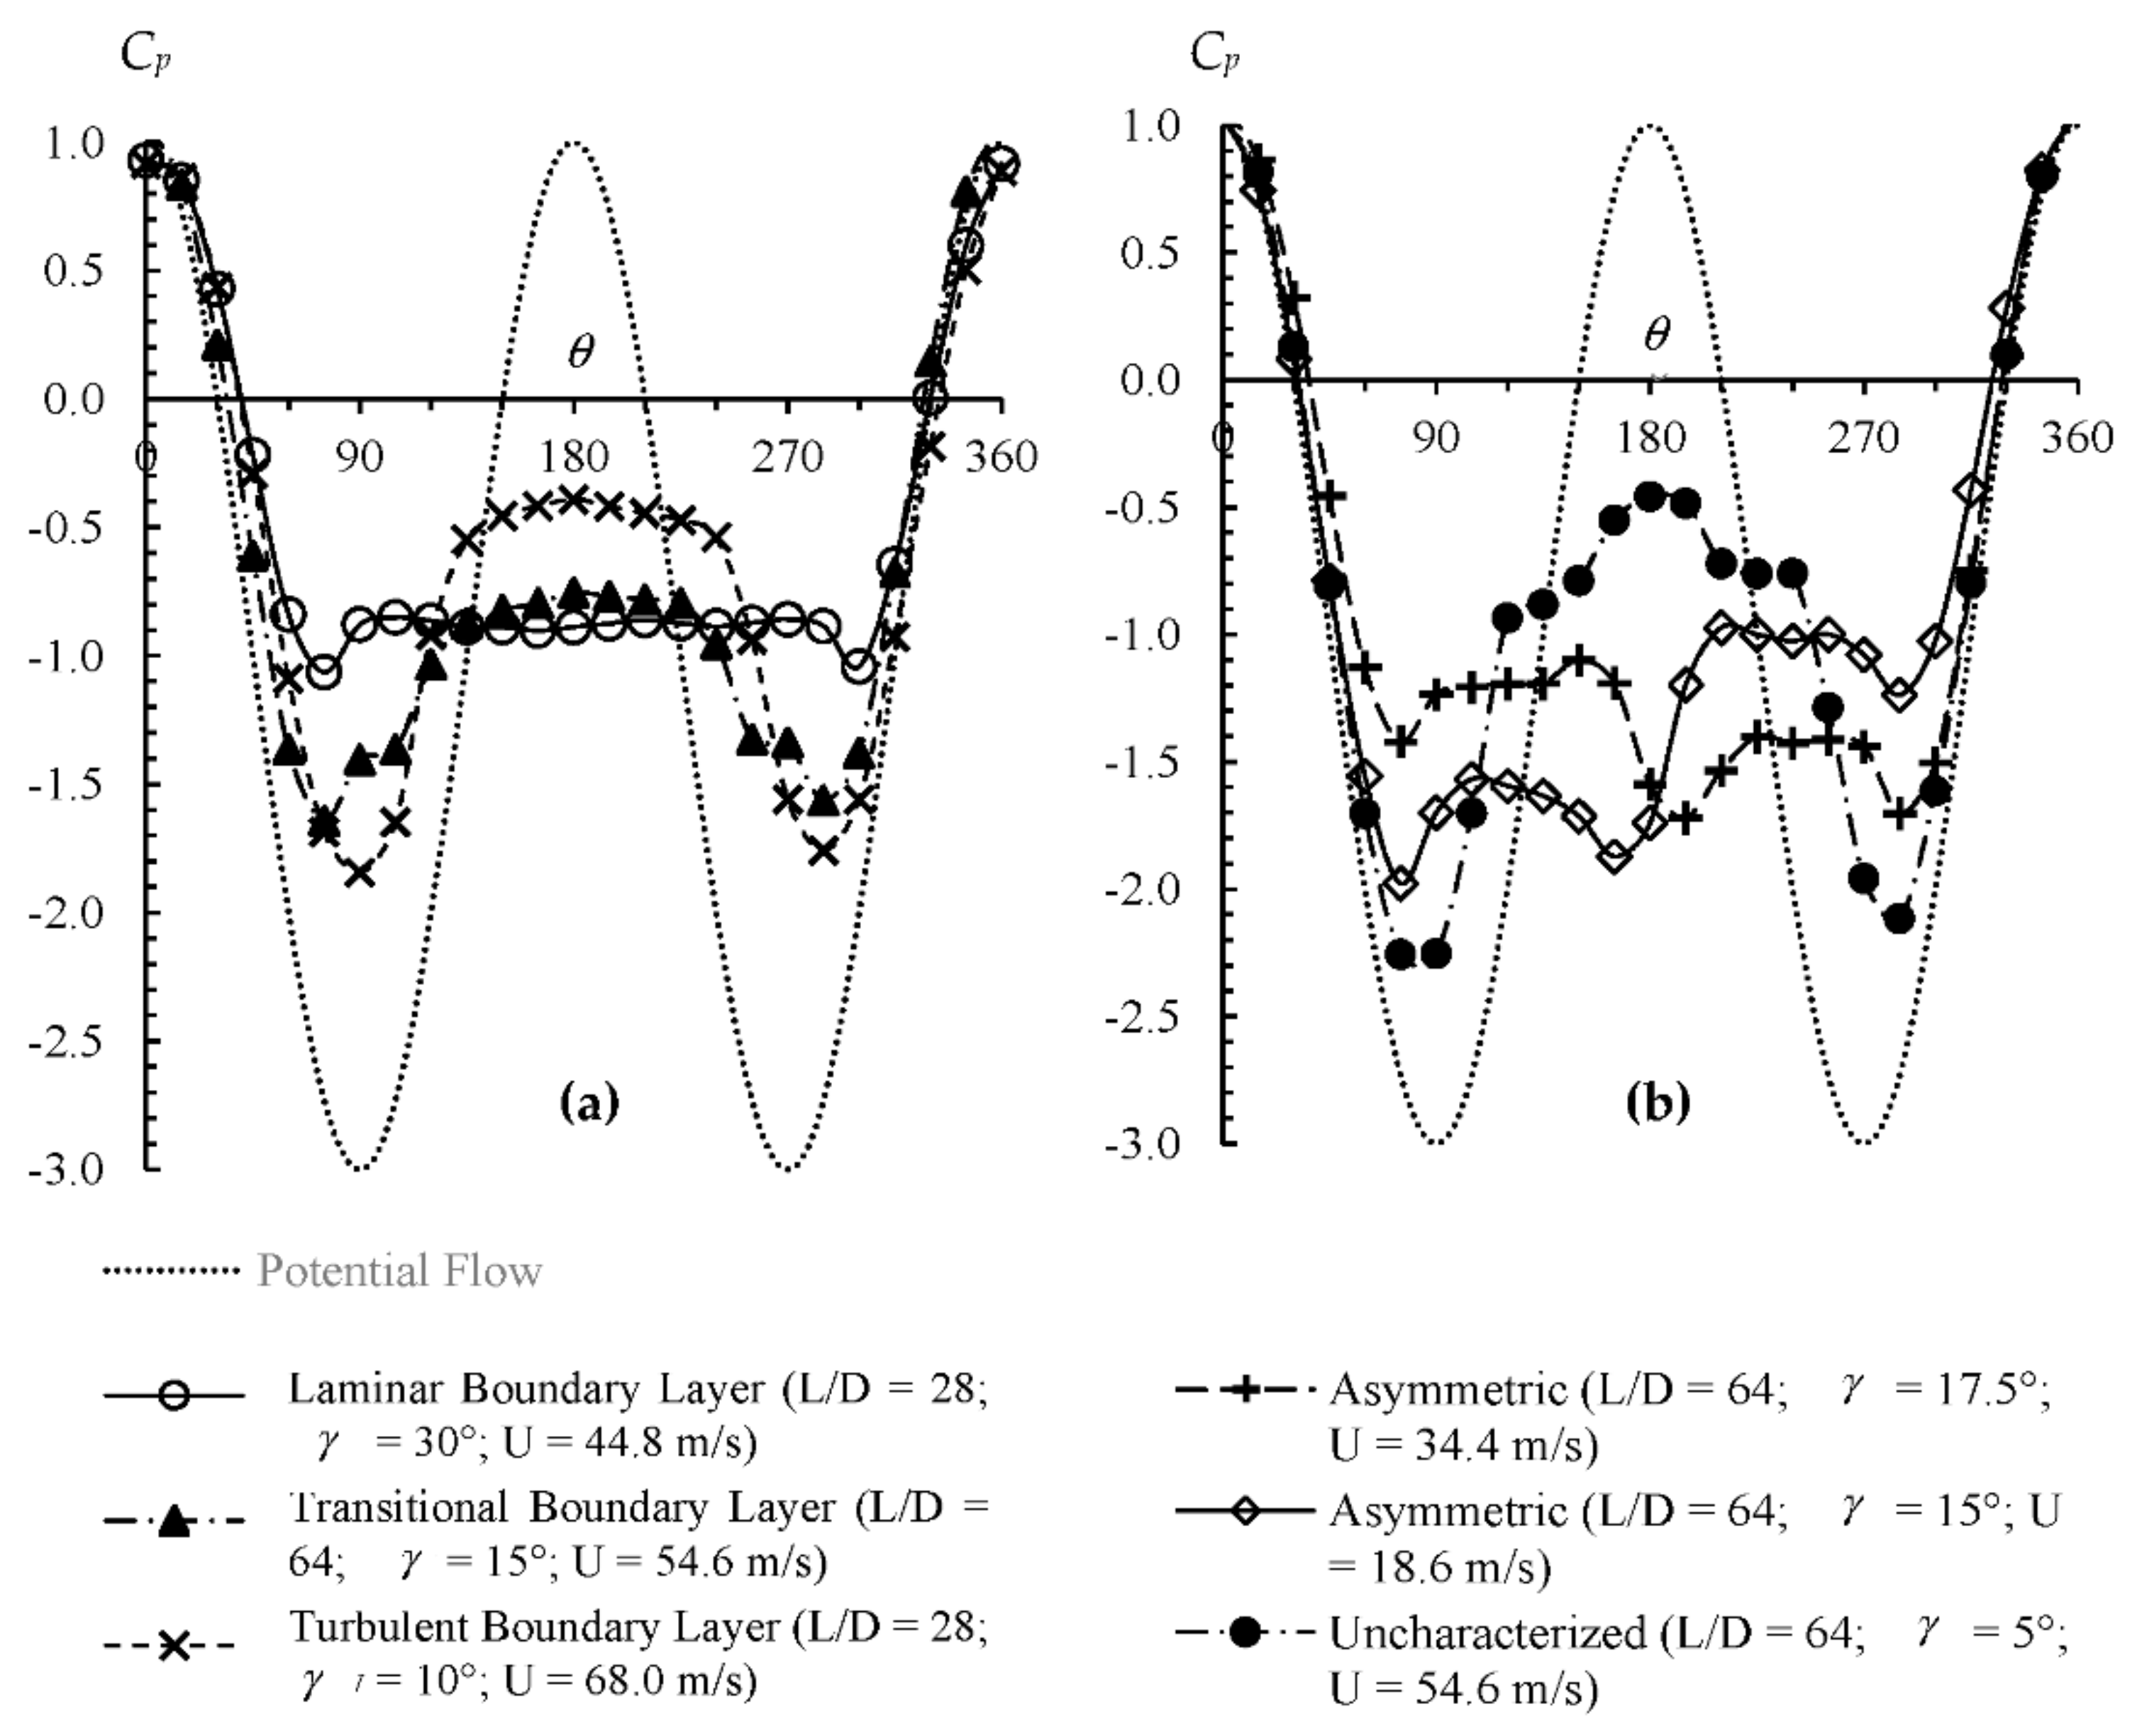
The base data for this study were the pressure distributions around the circumference of the cylinder as a function of yaw angle, flow speed, and axial position along the cylinder. When examining these distributions, six different types of Cp vs. θ curves emerged, examples of which appear in Figure 3. Note that the circumferential angle, θ = 0°, is located on the horizontal symmetry plane of the cylinder (i.e., the plane in which the cylinder is yawed) on what becomes the windward side when the cylinder is yawed.
According to inviscid sweepback theory, Cp vs. θ curves should resemble those observed around circular cylinders that are aligned normal to the flow. Specifically, as the Reynolds number increases, the cylinder boundary layer should progress from laminar to turbulent with the mean separation forward of the cylinder vertical midplane for the laminar boundary layer and aft of the cylinder midplane after the boundary layer becomes turbulent. There should, of course, be an intermediate profile when the boundary layer is transitional. Examples of these three pressure distributions are shown in Figure 3a. One can see that as the cylinder boundary layer transitioned from laminar to turbulent, the separation point moved from the front of the cylinder, θ < 90° and θ > 270°, to the back, and the pressure minima at the top and bottom of the cylinder decreased while the base pressure behind the cylinder increased.
However, several profiles did not fit these descriptions. Examples are shown in Figure 3b. As can be seen, two of the profiles were asymmetric, with one having lower pressures on the top half of the cylinder, while the other had lower pressures on the bottom half. The third profile, plotted using solid circles, did not fit into any category. The two asymmetric profiles were consistent with the observations of Thompson and Morrison [5], among others, of a series of Kármán-like vortices attached to the cylinder, which alternated from side to side down the length of the yawed cylinder.
The third profile in Figure 3b was from the medium length cylinder at = 54.6 m/s and γ = 5°, plotted with solid circles. There are similarities between this profile and the profile identified as transitional in Figure 3a; that profile was from the same medium length cylinder and speed but at a higher γ of 15°. However, the pressure minima were lower than even the turbulent boundary layer case and the base pressure in the range of ≈120° ≤ θ ≤ ≈240° had a distinct ‘hump’ between ≈150° ≤ θ ≤ ≈210°. These features highlight the complexity of the near-cylinder flow field. For yawed cylinders, particularly at low γ, there was a strong axial component to the flow that allowed for a thickened boundary layer along the length of the cylinder that may or may not be blown off by the crossflow. As a result, the flow and pressure distributions could be difficult to interpret. This will be discussed in Section 4.
For a cylinder aligned with the flow, the pressure around the cylinder, averaged circumferentially and over time, should be zero. With increasing γ, the magnitude of the average pressure coefficient, , should increase until the cylinder is perpendicular to the flow. This behavior is visible in Figure 4 which shows the average pressure coefficient as a function of the freestream speed, , for the three different length cylinders over the range of 0° ≤ γ ≤ 30°. While there was a clear dependence on γ, the aspect ratio, L/D, appeared to be an important parameter as well. There also appeared to be a weak dependence on speed, but there were no consistent observable trends from this particular figure.
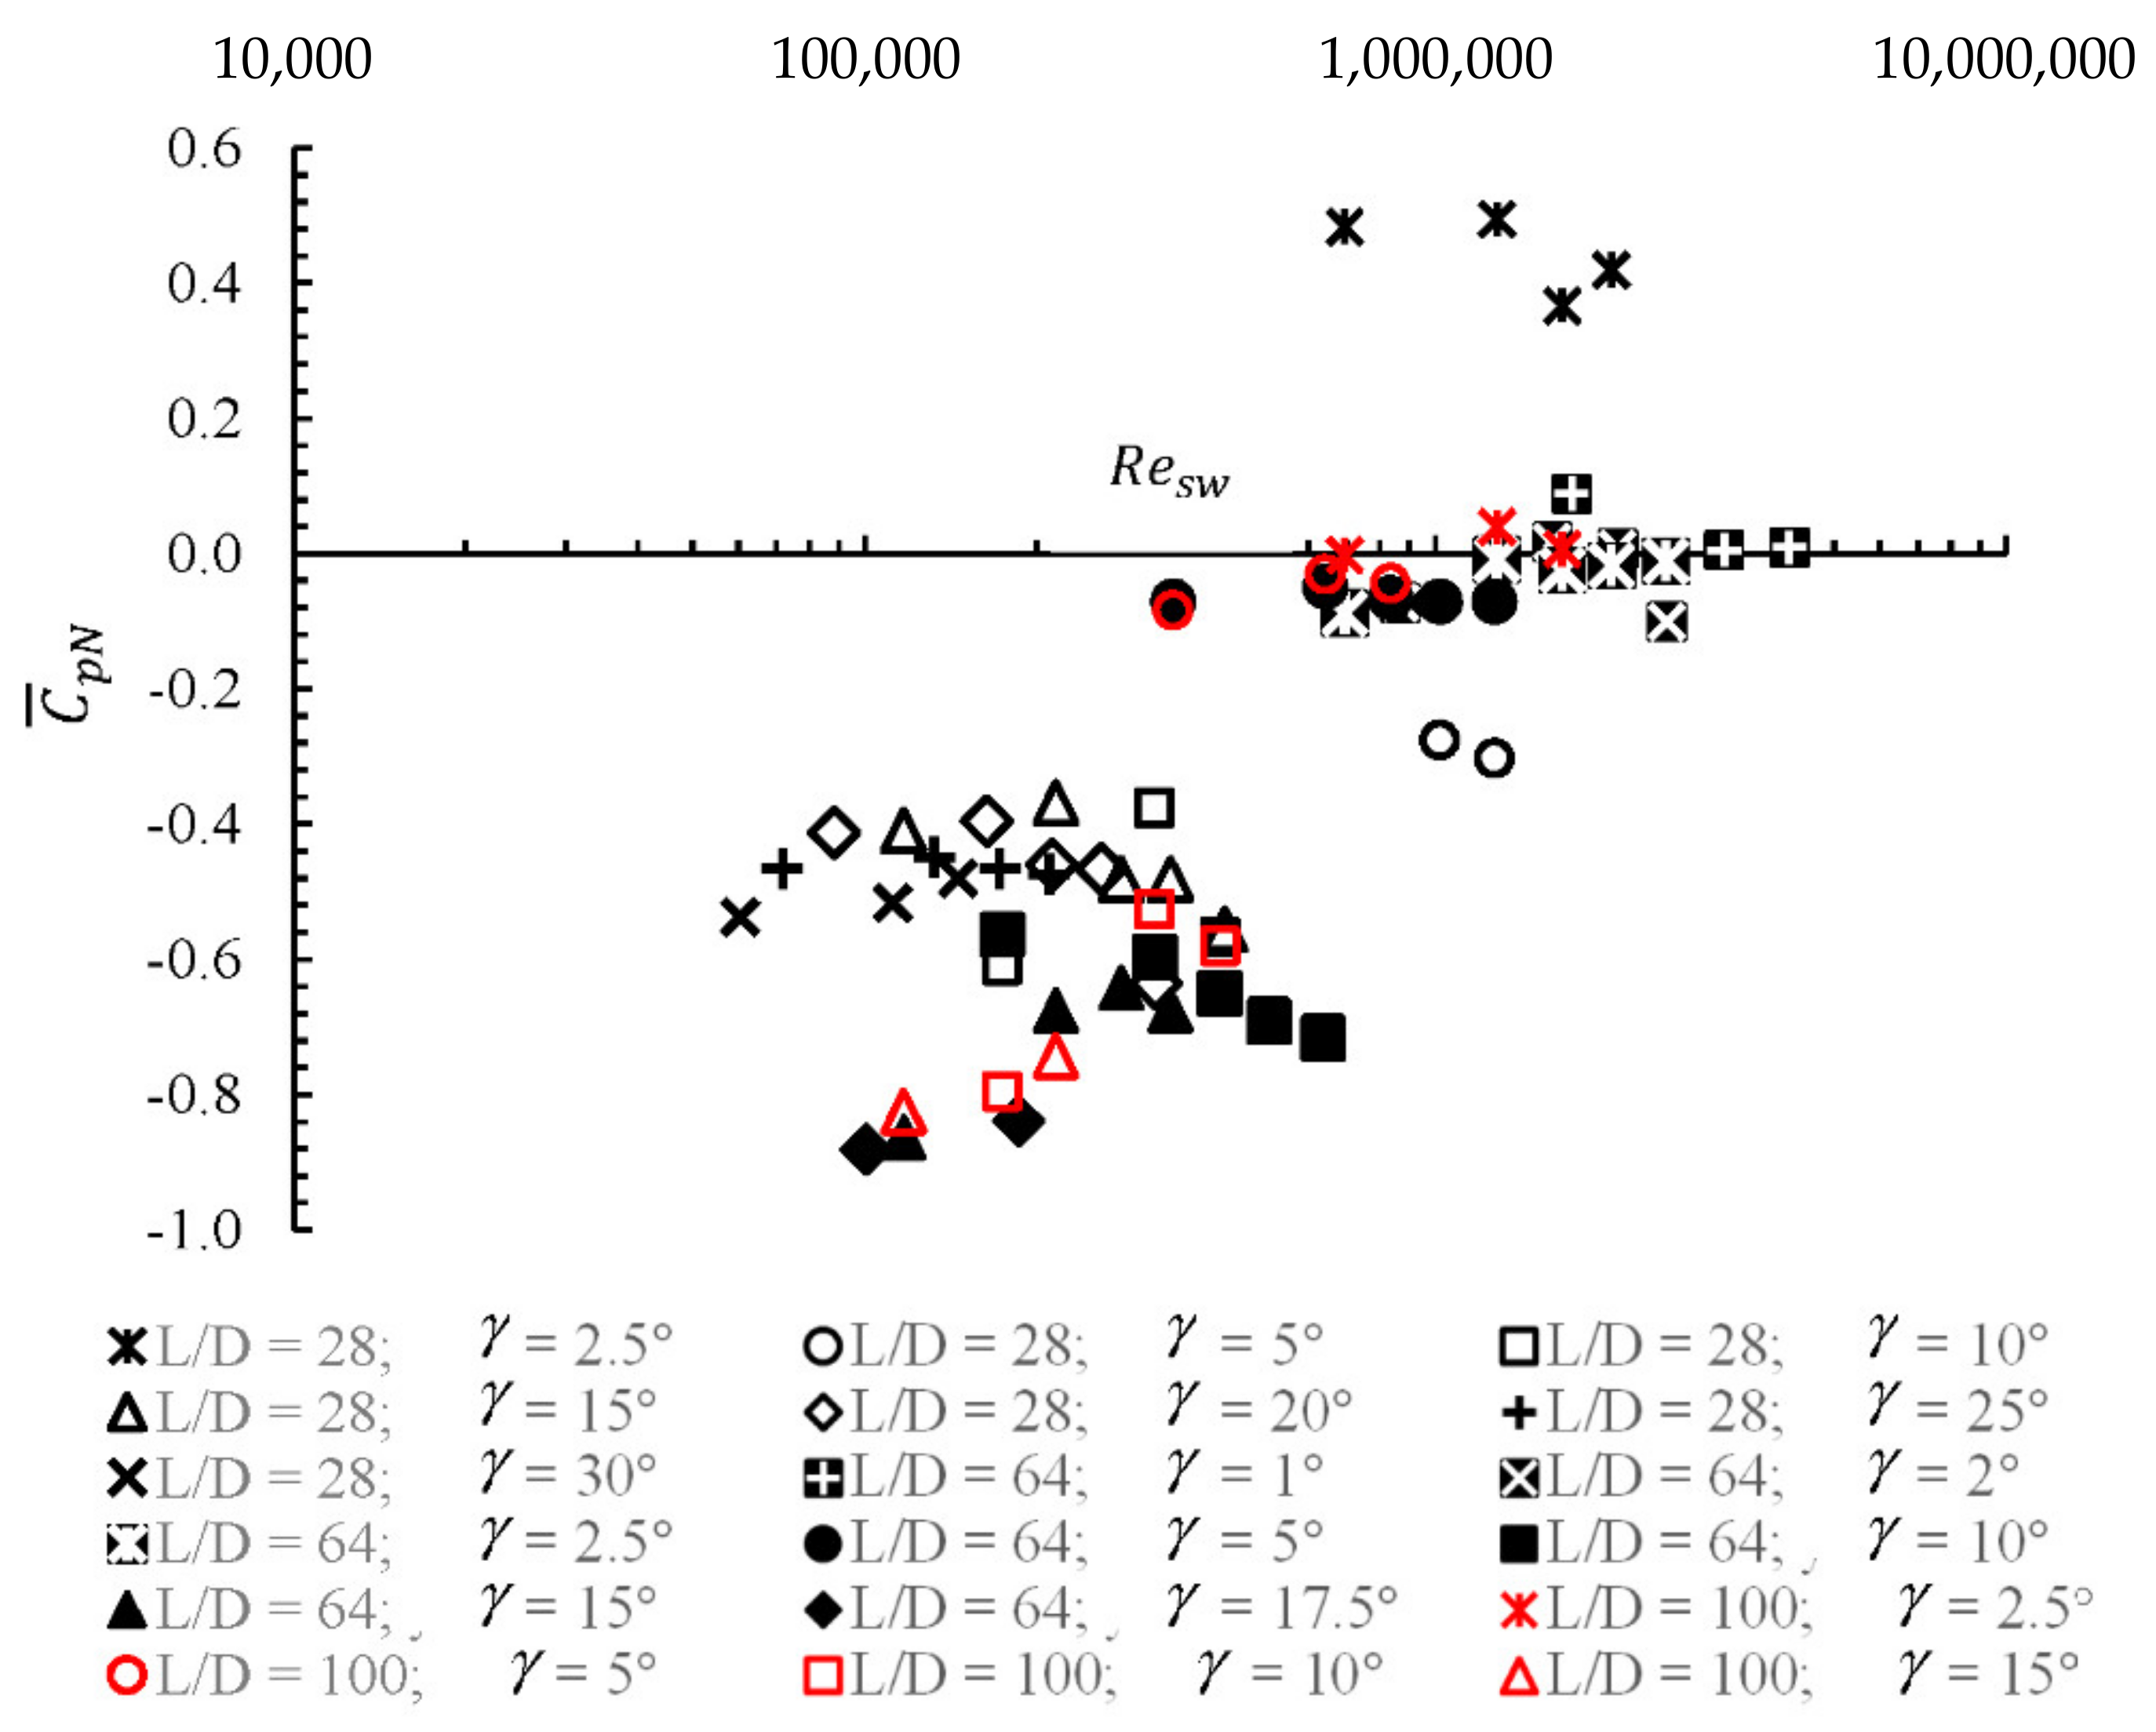
If inviscid sweepback theory were to apply for all of the conditions in this study, it would be expected that the average pressure coefficient data, normalized by the cross-stream dynamic pressure, , would collapse onto a single curve when plotted as a function of the streamwise Reynolds number, . This was not the case, as seen in Figure 5.
An examination of Figure 5 revealed roughly two groupings of data. The first grouping was found in the region bounded by −1.0 ≤ ≤ −0.3 and 4 × 10⁴ < < 106. The second grouping lay in the upper-right-hand portion of the plot that was roughly defined by > −0.4 and > 3 × 10⁵; however, it is important to keep in mind that the large values of were because of the dependence and not because of actual high speeds. All of the larger yaw angle cases, i.e., γ > 5°, were found in the first grouping. Furthermore, within that grouping, data from the shortest cylinder, L/D = 28, appeared to follow one trend line, roughly along a line of ≈ −0.45, while the two higher aspect ratio cylinders, L/D = 64 and L/D = 100, appeared to collapse toward a more negative trend line. This indicated a dependence on the aspect ratio and was consistent with a similar observation made regarding Figure 4.
All of the cases in the second grouping were for the smallest yaw angles, γ ≤ 5°. All of the data for the two longer cylinders fell between ±0.1, irrespective of the Reynolds number and γ. The two cases for the shortest cylinder, at γ = 2.5° and 5°, exhibited markedly different behavior. At the lowest yaw angle, γ = 2.5°, was positive with values around +0.4, while for the γ = 5° case, became negative with values around −0.3. As noted previously, for γ ≥ 10°, the normal averaged pressure coefficient for the L/D = 28 cylinder appeared to collapse toward a single curve with values averaging approximately −0.45. However, it is perhaps worth noting that the trend toward increasingly negative values with increasing γ seemed to continue, albeit very weakly. However, for all practical purposes, it seemed that inviscid sweepback theory applied for γ 10° for this shortest cylinder case. Moreover, as noted previously, the L/D = 28 cylinder data appeared to collapse onto a different trend line than the two longer cylinders.
The notion of the applicability of the inviscid sweepback theory collapsing pressure coefficient measurements onto a single curve for γ 10° appeared to apply for the two longer cylinders as well. However, the fact that there seemed to be a dependence on the cylinder aspect ratio indicates that this may be too simplistic a conclusion. This will be discussed in greater detail in the following section.
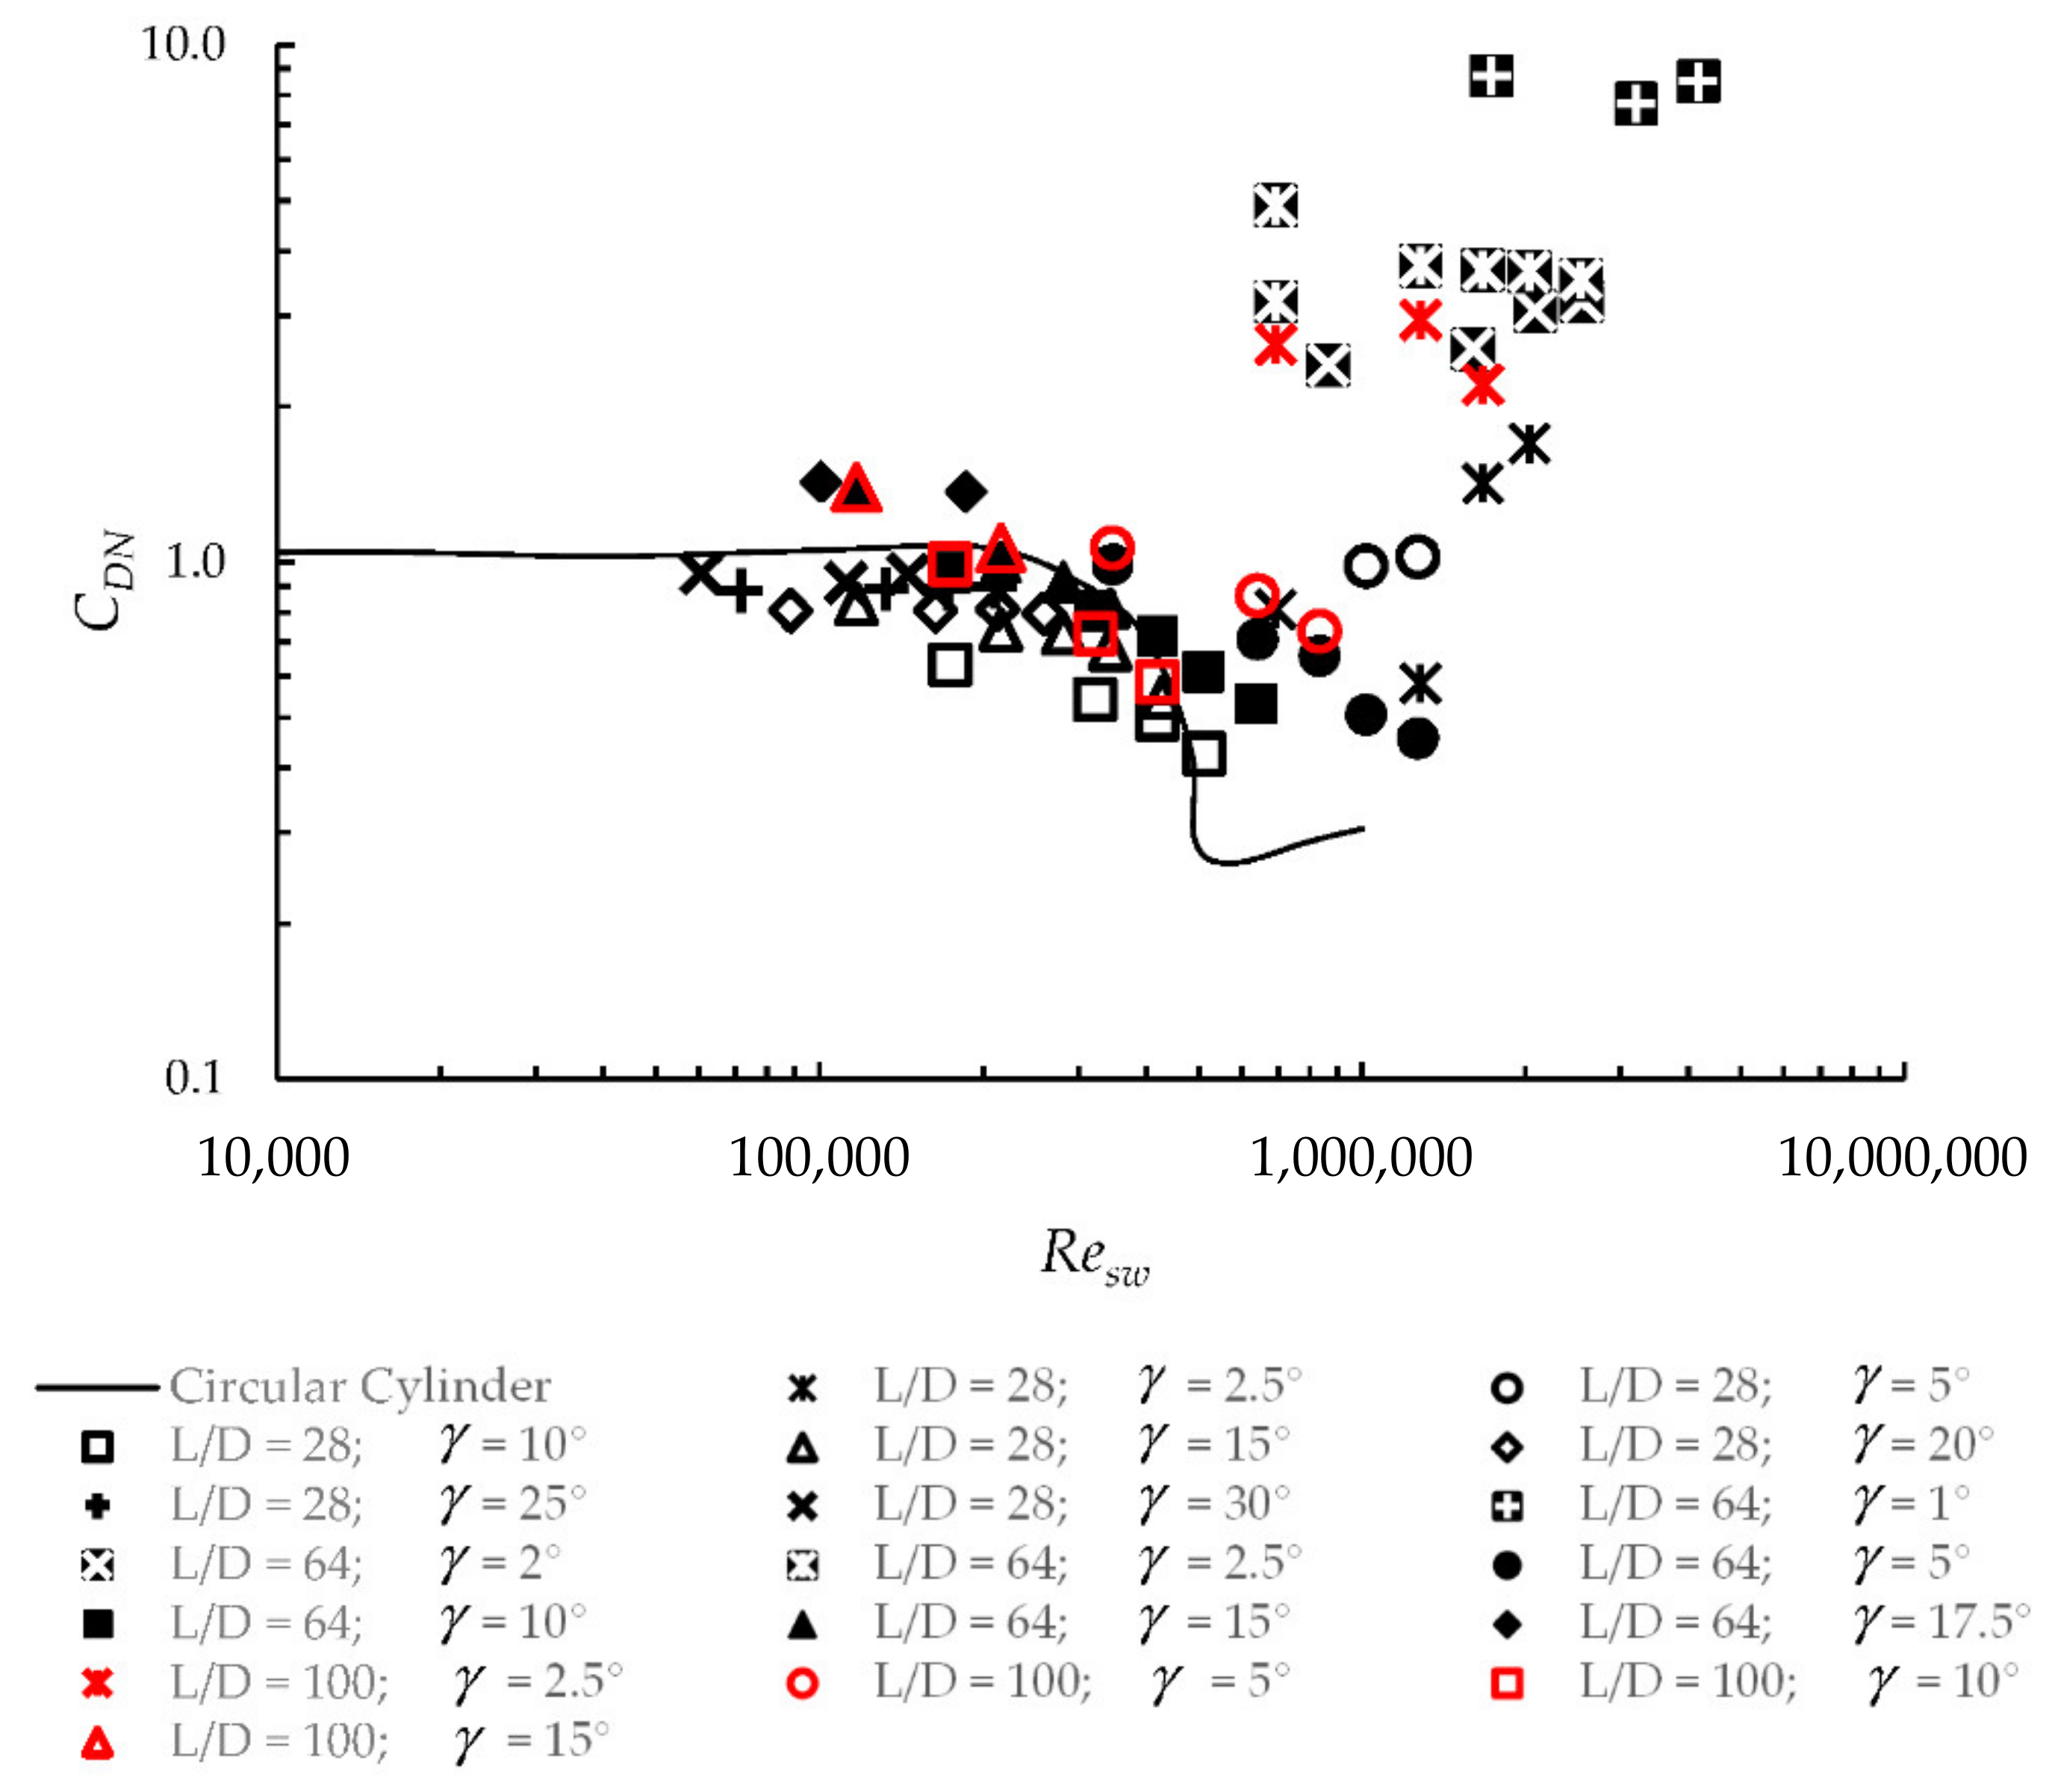
Similar trends can be seen in the drag coefficient perpendicular to the cylinder, . This is shown in the vs. plot in Figure 6 for the range of γ and the three different cylinder lengths. Both values are shown on logarithmic scales, as is standard. For this plot, the net pressure force that was normal to the cylinder in the horizontal plane was computed and nondimensionalized using the cylinder-normal component of the velocity. The solid line in the figure is a reproduction of the drag coefficient curve for a cylinder that is oriented perpendicular to the flow. Key features of this curve are (i) the extended Reynolds number range, from ~100 to ~300,000, where the drag coefficient was nominally constant with a value of 1.0, and (ii) the drag crisis around a Reynolds number of 500,000, where the boundary layer for the cylinder aligned perpendicular to the flow transitioned from laminar to turbulent.
As with the data that is shown in Figure 5, the drag coefficient data in Figure 6 could also be roughly divided into two groupings. The first grouping included cases where γ 5°. The small yaw angle data, γ 5°, comprised the second grouping. The important difference between the two groupings was that the first was clustered around the canonical cylinder drag coefficient curve, while the second grouping was above and to the right. For the cases where γ ≥ 10°, the data appeared to follow the canonical vs. Re curve reasonably well, including the drag crisis. Similarly, like the data in Figure 5, the data for the cases where γ < 5° were all well separated from the canonical curve. More detailed observations appear in the following section.
4. Discussion
Data presented in the preceding section demonstrated the complexity and richness of yawed cylinder flows. Where previous studies have focused heavily on the effects of the yaw angle alone, the present work indicated that flow speed and the cylinder aspect ratio are significant parameters as well. The focus of this discussion, then, will be on parsing where and how these different parameters are important.
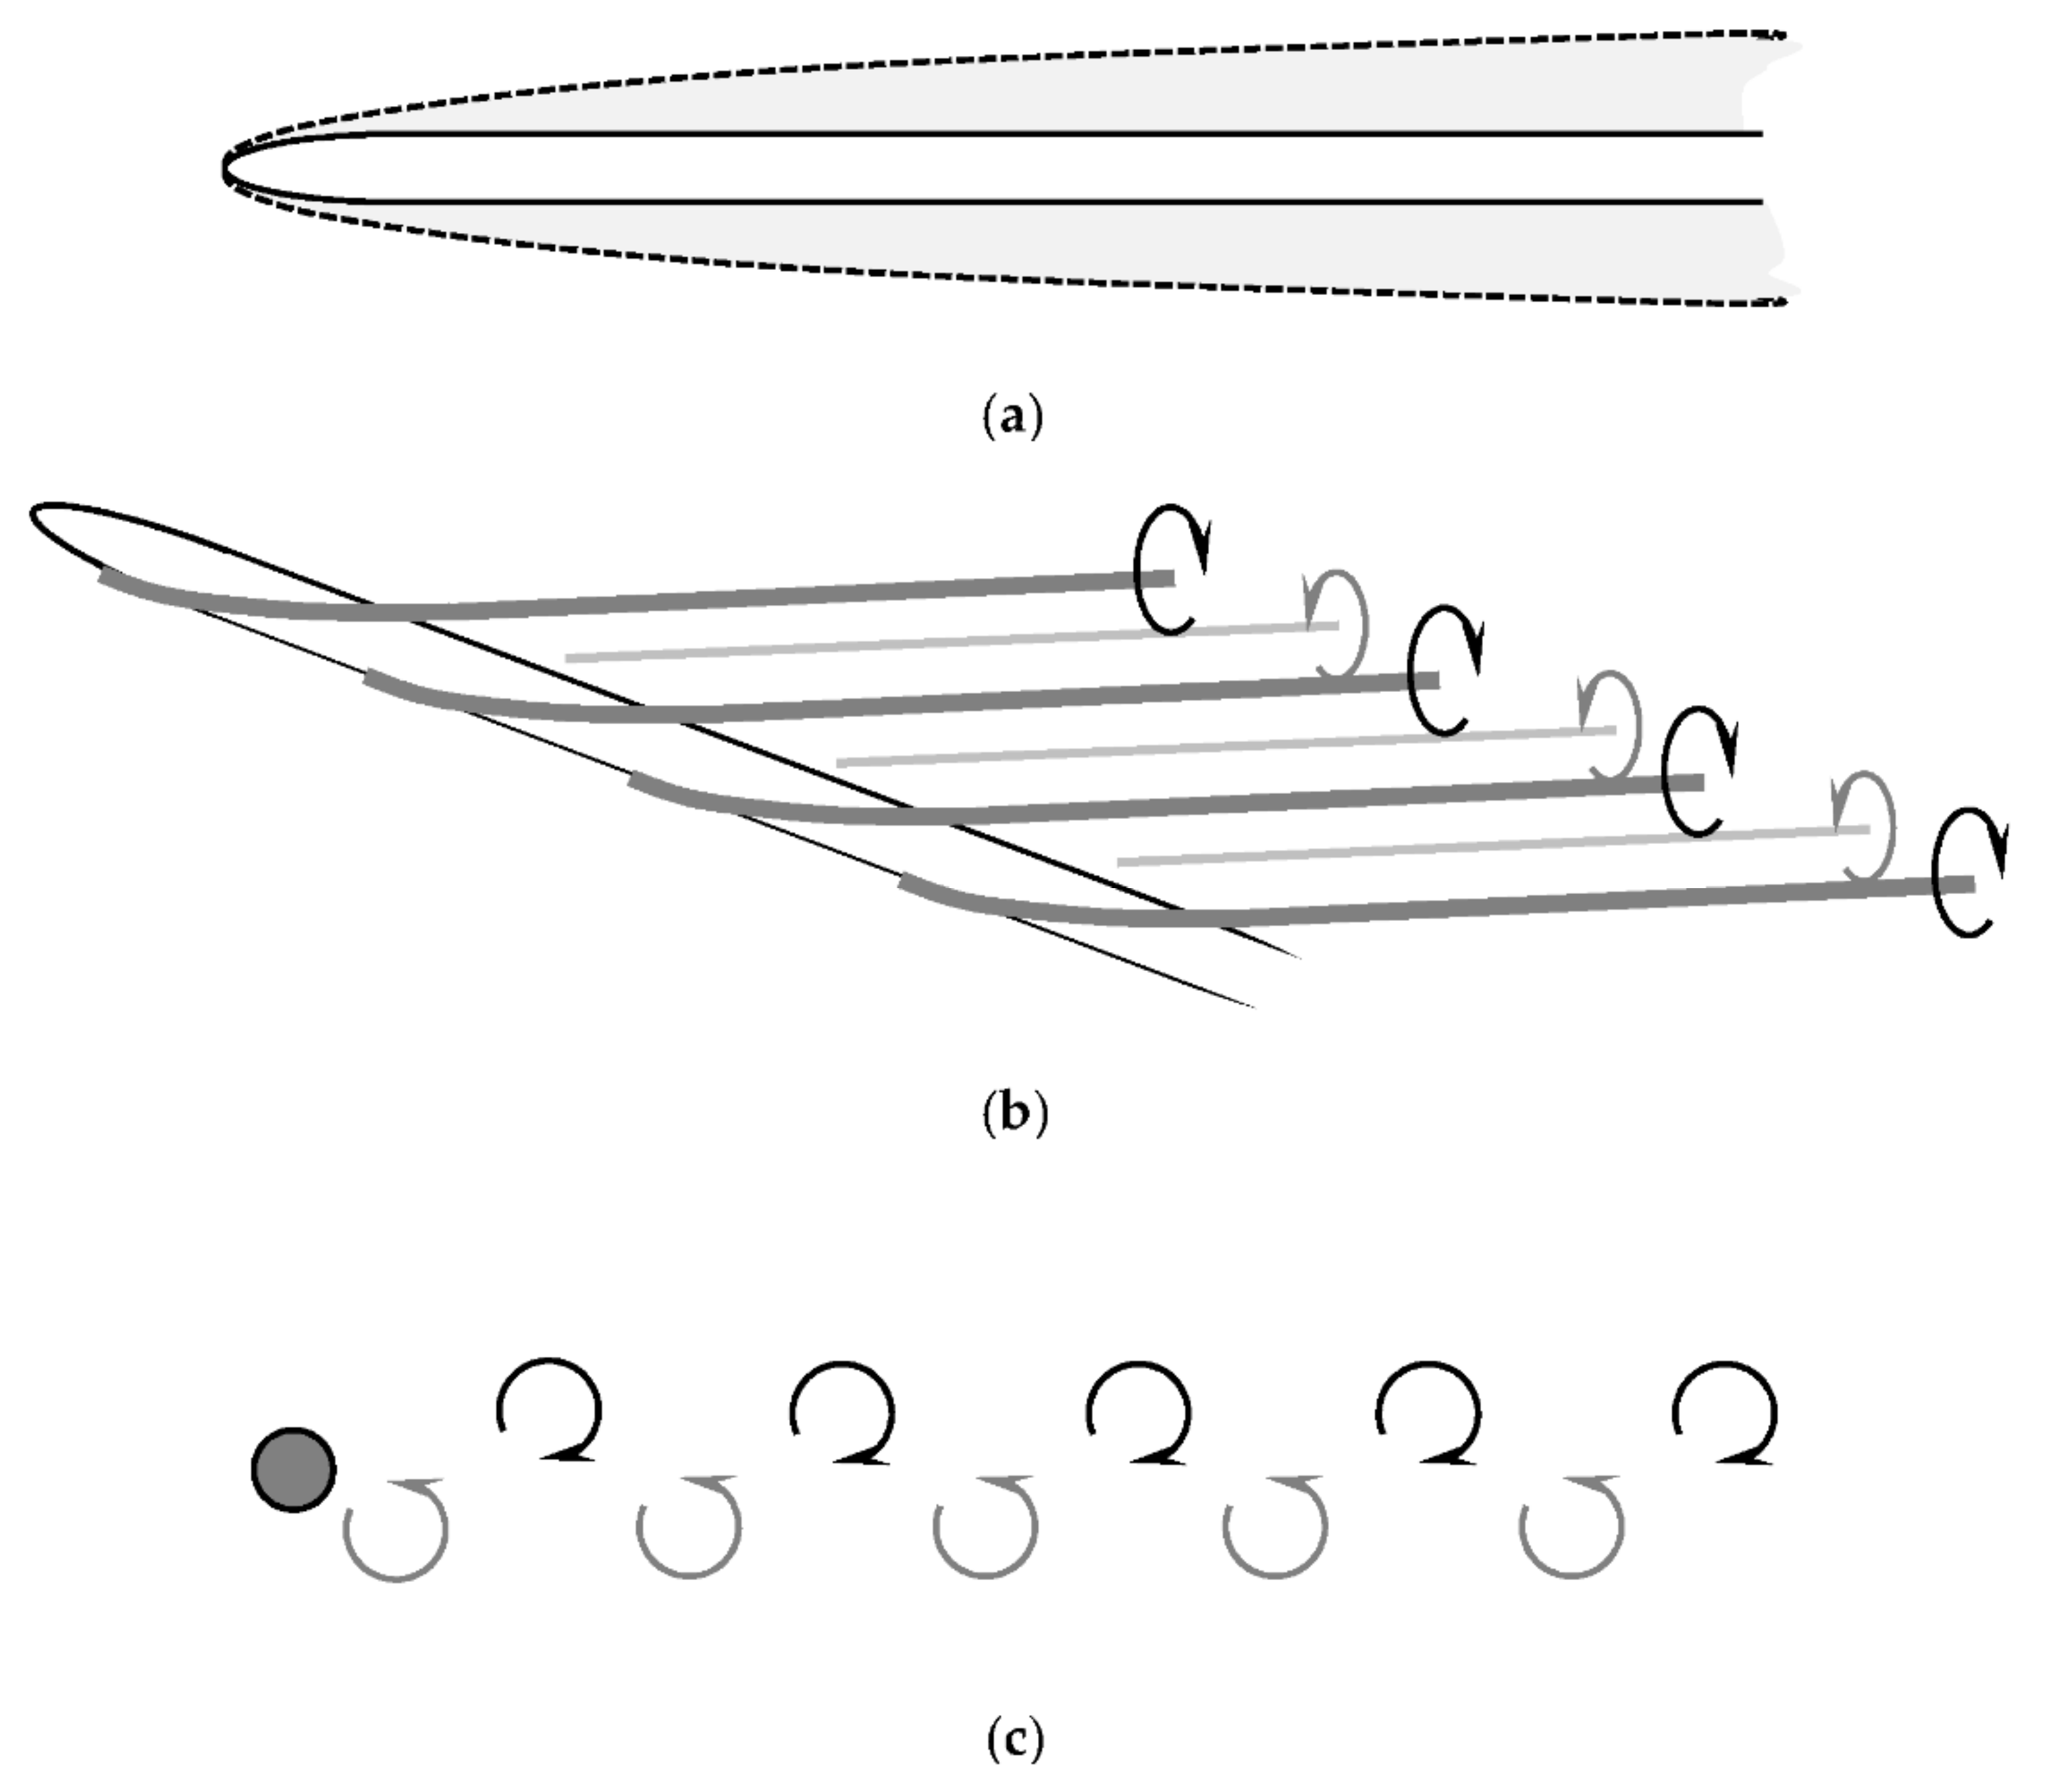
Figure 7 shows schematic drawings of the three nominal types of flow as γ increases from 0°, i.e., cylinder aligned with the flow, to 90° when the cylinder is orthogonal to the flow. At γ = 0°, an axisymmetric boundary layer develops. This is shown in Figure 7a. This boundary layer may become turbulent where the character of the turbulence will depend on the flow speed, cylinder length, and radius [3]. With increasing γ, a system of attached vortices develops on the leeward side of the cylinder [4,7], as shown in Figure 7b. Streamwise vortices of opposite sign vorticity are alternatively arrayed down the length of the cylinder. At a fixed location downstream of the cylinder, visualization in a cross-stream will look like a still image of a Kármán vortex street. For γ > 60°, opposite-signed vortices are shed alternately from either side of the cylinder with each vortex being nominally parallel to the cylinder axis. This is the classical Kármán vortex street shown in the side view in Figure 7c. The open question is where the interstices are between these different regimes. This will be examined by looking at the data with increasing γ.
An inherent assumption in inviscid sweepback theory is that the circumferential vorticity, , that is associated with an axial flow along the cylinder is negligible. As γ increases, this assumption would be increasingly valid. However, it is unreasonable to think that this would be true for small yaw angles.
The data, particularly in Figure 5 and Figure 6, indicated that the axial component of the flow, i.e., the axial boundary layer, played an important role for γ less than 5°. As noted in Section 3, was approximately zero for all small values of γ for the two longer cylinders. It was also pointed out that the data for the shortest cylinder, L/D = 28, were approximately +0.4 for γ = 2.5°. It is worth noting that for this cylinder and yaw angle, the pressure taps were roughly aligned behind the cylinder nose: . For all other cases studied, except for the γ = 1° case for the L/D = 64 cylinder, the cylinder nose was outboard of the pressure taps.
The corresponding low yaw angle drag coefficient data, , also appeared to be in a grouping that was separate from the γ > 5° data. Contrary to , the values were large. However, this was because , appearing in the coefficient’s denominator (i.e., the cylinder-normal velocity component squared), is very small for small γ. The key points here are that for γ < 5°, the effects of the axial flow had a strong effect on the pressure distribution around the cylinder, and that for aspect ratios L/D 30, the wake of the cylinder nose could be important.
It then appeared that γ = 5° was significant for all three aspect ratio cylinders. These data appear in Figure 5 and Figure 6 as open black, solid black, and open red circles for L/D = 28, 64, and 100, respectively. In Figure 5, these cases are clearly together with the γ < 5° cases. However, in Figure 6, this distinction is not as clear; all three of these data sets lay between the first and second groupings. Specifically, they appeared to be close to the canonical drag coefficient curve, but the values of were consistently larger than the canonical values at the corresponding Reynolds numbers. Furthermore, with an increasing Reynolds number, the data did not appear to exhibit the sudden decrease in at ≈ 500,000 that is characteristic of the drag crisis.
A clue regarding why this was happening can be found in the Cp vs. θ curve in Figure 3b for the γ = 5°, L/D = 64 case, which was plotted using solid circles. As noted, this pressure profile did not match any of those that are typically observed around cylinders at high yaw angles. Those can be seen in Figure 3a. At the same time, it was very different from what one would expect for an axisymmetric boundary layer flow. One possibility is that this is the signature of a symmetric pair of vortices that trailed back from farther forward on the cylinder. Alternatively, there might be some sort of complex ‘braiding’ of vortices on each side of the cylinder into a single pair of vortices that required some length along the cylinder to develop. Unfortunately, mean pressure measurements alone are not sufficient to resolve this question.
In Figure 6, it can be seen that the γ = 5° data for L/D = 64 and 100 collapsed onto a single curve. The L/D = 28 cylinder data at this yaw angle were taken only for the two fastest speeds. At the corresponding Reynolds numbers, the values of for the L/D = 28 cylinder were roughly twice that for the L/D = 64 cylinder. It appeared that L/D ≈ 1/ may be an important parameter because measurements at smaller aspect ratios will be in the shadow of the cylinder nose. This is a point for further investigation. The key point is that there seemed to be transitions around both γ = 5° and L/D ≈ 28.
The interesting complexity of this flow continued to manifest with increasing yaw angle in the range 10° ≤ γ ≤ 30°. The dependence on the aspect ratio can again be seen in Figure 5 and Figure 6 as both and the for the shortest cylinder were different than for the two longer cylinders. This was most evident in the data in Figure 5. However, close examination of Figure 6 revealed that for equivalent values of , was smaller for the L/D = 28 cylinder than for the two longer ones. However, there was perhaps a more interesting observation regarding flow speed.
Two circumferential pressure distributions for the medium length cylinder, L/D = 64, at γ = 15° are shown in Figure 3. The first distribution was measured at the second-highest speed, = 54.6 m/s, and is shown in Figure 3a with solid triangles. The second, seen in Figure 3b as open diamonds, was obtained at the lowest speed, = 18.6 m/s. Observe that the distribution for the lower speed was asymmetric. It was pointed out that this is consistent with the model [7] of opposite-signed vortices attached one after the other down the length of the yawed cylinder. In that situation, circumferential pressure measurements would exhibit asymmetric distributions when an attached vortex was in close proximity to the measurement station.
In comparison, observe that the corresponding pressure distribution in Figure 3a, measured at the higher speed, was symmetric. Furthermore, it was noted that the distribution was consistent with that seen around a cylinder aligned orthogonal to the flow in which its boundary layer was transitional. While this is, of course, a Reynolds number effect, it is not clear that the streamwise Reynolds number, , is the appropriate parameter with which to characterize this particular phenomenon. As such, it is probably more appropriate to say here that this is a flow speed or cross-stream momentum effect. It is hypothesized that at the lower speed, a stable system of attached vortices formed on the leeward side of the cylinder, but at higher speeds, the cross-stream momentum became large enough to sweep the vortices off the cylinder, resulting in something more akin to a Kármán vortex street.
It is this interplay of yaw angle, aspect ratio, and flow speed that governed the dynamics of the flow up to γ ≈ 60°, where it is widely accepted that a Kármán street comprises the cylinder wake. Evidence of this can be seen in the circumferential pressure distribution for the shortest cylinder at γ ≈ 30° in Figure 3a and the normal drag coefficient data for that case in Figure 6. In Figure 3a, the pressure distribution was consistent with that which would be measured around a cylinder aligned perpendicular to the flow in the Reynolds number range where Kármán vortex shedding occurs. Similarly, in Figure 6, the drag coefficient data aligned very well with the drag curve for a cylinder aligned perpendicular to the flow. What is abundantly clear is that the study of yawed cylinder flows is not simply a function of the yaw angle.
5. Conclusions
A series of circumferential pressure measurements were made in a wind tunnel around a circular cylinder over a range of yaw angles, freestream speeds, and aspect ratios. Data were used to compute the average pressure coefficients and drag coefficients. The primary objective of the study was to further define the parameter space in which inviscid sweepback theory was valid and to better understand the dynamics that determine those parameters. As such, the significant contribution of this work lies in identifying the aspect ratio and flow speed in addition to the yaw angle as key parameters. New insights into where and how those parameters might affect the flow can also be put forward. In particular, detailed analysis of the measurements led to the following conclusions:
- (1)
- Boundary-dominated flow, γ < 5°
- -
- For γ < 5°, the flow was strongly influenced by the axisymmetric boundary layer.
- -
- The cylinder aspect ratio is an important parameter for . This is the angle at which the nose had a direct upstream influence on the rest of the body.
- (2)
- Transition to wake-dominated flow, 5° ≤ γ ≤ 30°
- -
- For γ = 5°, there appeared to be a transition to vortex-dominated flow irrespective of the aspect ratio.
- -
- Over the range 5° ≤ γ ≤ 30°, the flow was dominated by a system of strong, coherent, alternating sign vortices; there was a complex interplay between γ, , and L/D that determined whether the vortices were attached or shed to form a Kármán vortex street.
- -
- For a fixed yaw angle and aspect ratio, increasing the freestream speed increased the cross-stream momentum, which in turn helped to cause the attached vortices to shed.
In closing, it should be noted that this is an incredibly rich problem. The observations made here need to be confirmed with simultaneous flow measurements or computations.
Author Contributions
Conceptualization, W.W.W. and T.W.; Data curation, T.W.; Formal analysis, T.W.; Funding acquisition, W.W.W.; Investigation, W.W.W. and T.W.; Methodology, W.W.W. and T.W.; Project administration, W.W.W. and T.W.; Supervision, W.W.W.; Writing—original draft, W.W.W. and T.W.; Writing—review and editing, T.W. All authors have read and agreed to the published version of the manuscript.
Funding
This research was originally supported by the Office of Naval Research under contract number N00014-76-C-0571.
Institutional Review Board Statement
Not applicable.
Informed Consent Statement
Not applicable.
Data Availability Statement
Data from this study may be found in the original report [14] at: https://apps.dtic.mil/dtic/tr/fulltext/u2/a182355.pdf.
Acknowledgments
Experiments in this study were conducted by the authors in 1983. The data were put into a report but never published. They have been re-examined to make the work and analysis current with progress in the field since that time. This paper is dedicated to the memory of Bill Willmarth, an amazing colleague, mentor, and friend.
Conflicts of Interest
The authors declare no conflict of interest.
References
- Sueki, T.; Ikeda, M.; Takaishi, T. Aerodynamic noise reduction using porous materials and their application to high-speed pantographs. Q. Rep. RTRI 2009, 50, 26–31. [Google Scholar] [CrossRef] [Green Version]
- Willmarth, W.W.; Sharma, L.K.; Inglis, S. The effect of Cross Flow and Isolated Roughness Elements on the Boundary Layer and Wall Pressure Fluctuations on Circular Cylinders; University of Michigan, Department of Aerospace Engineering: Ann Arbor, MI, USA, 1997. [Google Scholar]
- Krane, M.H.; Grega, L.M.; Wei, T. Structure of the near-wall region of a boundary layer over a wall with large transverse curvature. J. Fluid Mech. 2010, 664, 33–50. [Google Scholar] [CrossRef]
- Bursnall, W.J.; Loftin, L.K. Experimental Investigation of the Pressure Distribution around a Yawed Cylinder in the Critical Reynolds Number Range; NACA Technical Notes 2463; NACA (precursor to NASA): Washington, DC, USA, 1951. [Google Scholar]
- Lamont, P.J.; Hunt, B.L. Pressure and force distributions on a sharp-nosed circular cylinder at large angles of inclination to a uniform subsonic stream. J. Fluid Mech. 1976, 76, 519–559. [Google Scholar] [CrossRef]
- Allen, H.J.; Perkins, E.W. A Study of the Effects of Viscosity on Flow over Slender Inclined Bodies of Revolution; NACA Report 104; NACA (precursor to NASA): Washington, DC, USA, 1951. [Google Scholar]
- Thomson, K.D.; Morrison, D.F. The spacing, position and strength of vortices in the wake of slender cylindrical bodies at large incidence. J. Fluid Mech. 1971, 50, 751–783. [Google Scholar] [CrossRef]
- Snarski, S. Flow over yawed circular cylinders: Wall pressure spectra and flow regimes. Phys. Fluids 2004, 16, 344–359. [Google Scholar] [CrossRef]
- Wang, R.; Cheng, S.; Ting, D.S.-K. Effect of yaw angle on flow structure and cross-flow force around a circular cylinder. Phys. Fluids 2019, 31. [Google Scholar] [CrossRef]
- Gao, D.-L.; Chen, W.-L.; Li, H.; Hu, H. Flow around a slotted circular cylinder at various angles of attack. Expts. Fluids 2017, 58, 132. [Google Scholar] [CrossRef]
- Norberg, C. Flow around rectangular cylinders: Pressure forces and wake frequencies. J. Wind Eng. Ind. Aerodyn. 1993, 49, 187–196. [Google Scholar] [CrossRef]
- Divaret, L.; Moussou, P.; Berland, J.; Berro, H.; Cadot, O.; Doaré, O. Forces exerted on a cylinder in a near-axial flow. ASME J. Pressure Vessel Technol. 2014, 136. [Google Scholar] [CrossRef] [Green Version]
- Ersdal, S.; Faltinsen, O.M. Normal forces on cylinders in near-axial flow. J. Fluids Struct. 2006, 22, 1057–1077. [Google Scholar] [CrossRef]
- Wei, T.; Willmarth, W.W. Static Pressure Distribution on Long Cylinders a Function of Angle of Yaw and Reynolds Number; University of Michigan, Department of Aerospace Engineering: Ann Arbor, MI, USA, 1983. [Google Scholar]
Figure 1.
Schematic diagram of the cylinder assembly. The flow was obliquely right-to-left as indicated. Pressure taps appeared as a ring of dots toward the aft of the measuring station; the lines extending back from the measuring station represent the connectors to which the flexible pressure lines were attached.

Figure 2.
Schematic drawing of the pressure data acquisition system. The bottle was used as a large reservoir to mechanically dampen the pressure fluctuations. The pressure could be monitored using an oil manometer bank.
Figure 2.
Schematic drawing of the pressure data acquisition system. The bottle was used as a large reservoir to mechanically dampen the pressure fluctuations. The pressure could be monitored using an oil manometer bank.

Figure 3.
Representative pressure coefficient distributions around the circular cylinder over a range of conditions. The races include those that are (a) characteristic of those measured around cylinders normal to the flow and (b) asymmetric or uncharacterized.
Figure 3.
Representative pressure coefficient distributions around the circular cylinder over a range of conditions. The races include those that are (a) characteristic of those measured around cylinders normal to the flow and (b) asymmetric or uncharacterized.

Figure 4.
Average pressure coefficient around the cylinder, , as a function of the freestream velocity, , for the three different cylinders and range of γ examined.
Figure 4.
Average pressure coefficient around the cylinder, , as a function of the freestream velocity, , for the three different cylinders and range of γ examined.

Figure 5.
Average pressure coefficient based on the cross-stream dynamic pressure, , plotted as a function of the streamwise Reynolds number, .
Figure 5.
Average pressure coefficient based on the cross-stream dynamic pressure, , plotted as a function of the streamwise Reynolds number, .

Figure 6.
Plot of CDN vs. Resw for the three different aspect ratio cylinders and range of yaw angles. The solid line represents the drag coefficient for a circular cylinder that was aligned perpendicular to the flow.
Figure 6.
Plot of CDN vs. Resw for the three different aspect ratio cylinders and range of yaw angles. The solid line represents the drag coefficient for a circular cylinder that was aligned perpendicular to the flow.

Figure 7.
Schematic drawings of the three categories of flow for cylinders across the range of yaw angles: (a) boundary layer forming on a cylinder aligned with the flow, γ = 0°; (b) top view of the attached vortices alternating from one side of the cylinder to the other; (c) side view of the classic Kármán vortex street for a cylinder that is oriented perpendicular to the flow, γ = 90°.

Publisher’s Note: MDPI stays neutral with regard to jurisdictional claims in published maps and institutional affiliations. |
© 2021 by the authors. Licensee MDPI, Basel, Switzerland. This article is an open access article distributed under the terms and conditions of the Creative Commons Attribution (CC BY) license (https://creativecommons.org/licenses/by/4.0/).
Share and Cite
MDPI and ACS Style
Willmarth, W.W.; Wei, T. Static Pressure Distribution on Long Cylinders as a Function of the Yaw Angle and Reynolds Number. Fluids 2021, 6, 169. https://0-doi-org.brum.beds.ac.uk/10.3390/fluids6050169
AMA Style
Willmarth WW, Wei T. Static Pressure Distribution on Long Cylinders as a Function of the Yaw Angle and Reynolds Number. Fluids. 2021; 6(5):169. https://0-doi-org.brum.beds.ac.uk/10.3390/fluids6050169
Chicago/Turabian StyleWillmarth, William W., and Timothy Wei. 2021. "Static Pressure Distribution on Long Cylinders as a Function of the Yaw Angle and Reynolds Number" Fluids 6, no. 5: 169. https://0-doi-org.brum.beds.ac.uk/10.3390/fluids6050169