
Switching Action of a Bistable Fluidic Amplifier for Ultrasonic Testing


1
Institute of Fluid Dynamics and Technical Acoustics, Technische Universität Berlin, Müller-Breslau-Straße 8, 10623 Berlin, Germany
2
FDX Fluid Dynamix GmbH, Rohrdamm 88, 13629 Berlin, Germany
3
Bundesanstalt für Materialforschung und -prüfung (BAM), Division 8.2 “Non-Destructive Testing Methods for Civil Engineering”, Unter den Eichen 87, 12205 Berlin, Germany
*
Author to whom correspondence should be addressed.
Fluids 2021, 6(5), 171; https://0-doi-org.brum.beds.ac.uk/10.3390/fluids6050171
Submission received: 26 February 2021
/
Revised: 12 April 2021
/
Accepted: 15 April 2021
/
Published: 25 April 2021
(This article belongs to the Special Issue Fluidic Oscillators-Devices and Applications)
Abstract
:Air-coupled ultrasonic testing is widely used in the industry for the non-destructive testing of compound materials. It provides a fast and efficient way to inspect large concrete civil infrastructures for damage that might lead to catastrophic failure. Due to the large penetration depths required for concrete structures, the use of traditional piezoelectric transducer requires high power electric systems. In this study, a novel fluidic transducer based on a bistable fluidic amplifier is investigated. Previous experiments have shown that the switching action of the device produces a high-power broadband ultrasonic signal. This study will provide further insight into the switching behaviour of the fluidic switch. Therefore, parametric CFD simulations based on compressible supersonic RANS simulations were performed, varying the inlet pressure and velocity profiles for the control flow. Switching times are analyzed with different methods, and it was found that these are mostly independent of the slope of the velocity profile at the control port. Furthermore, it was found that an inversely proportional relationship exists between flow velocity in the throat and the switching time. The results agree with the theoretical background established by experimental studies that can be found in the literature.
1. Introduction
The recent collapse of the Caprigliola-Bridge [1,2] in northern Italy and Genoa’s Morandi-Bridge [3] have shown the need for comprehensive testing and health-monitoring systems for concrete civil infrastructures. Ultrasonic inspections are state-of-the-art methods of detecting damage and providing insight into the inner structures and reinforcements present in an object [4]. Standard industrial practice is the use of the pulse-echo-method with contact-based systems [5,6]. However, these measurements are time-consuming and, therefore, only financially feasible for small areas where damage is expected. Air-coupled ultrasonic (ACU) testing can alleviate these issues and provide fast and efficient scanning of large areas. However, the currently available systems use piezoelectric transducers in through-transmission setups and have small penetration depths in concrete [7,8]. They also require high-powered electrical supplies and other sensitive equipment to generate the ultrasound signal.
To provide robust means of testing large concrete structures a fluidic transducer based on a bistable fluidic amplifier was developed. Initial research conducted in [9] have shown that the generation of a broadband ultrasonic signal between 30 kHz and 80 kHz is possible. Fluidic devices also include fluidic oscillators [10,11] that have offered many solutions to modern engineering problems. However, fluidic amplifiers have not seen as much use. Bobusch and Tesar [12,13] have shown their application as high-speed gas valves in harsh environments. They are also used to create high-frequency oscillators by establishing a feedback, either by attaching a resonator to one of the control ports [14] or by connecting each output channel with the corresponding control port [15]. Roger and Chan presented a parametric numerical study in 2003 [16] that varied different geometrical values and showed the validity of computational fluid dynamics (CFD) for the design of bistable fluidic amplifiers. To the authors knowledge, no further research has been published on the subject. An extensive overview of the early development and research can be found at Kirschner and Katz [17,18].
In comparison with traditional actuators, fluidic devices are virtually maintenance-free due to the lack of moving parts. They are also insensitive to radiation and temperature changes, can be run from a simple pressure reservoir and are not affected by dust or dirty environments. This makes them ideal for the rough conditions of outdoor testing that often make the use of piezoelectric or alternative ACU transducers challenging. Furthermore, most kinds of working fluid, either liquid or gaseous, can be used.
Additional information on the functioning and application of fluidic devices may be found in the works of Gregory [19], Tesar [20], Foster [21], Raghu [22], and Bobusch [12].
In this study, parametric CFD simulations based on compressible supersonic Reynolds averaged Navier–Stokes (RANS) simulations will be performed to investigate parameters influencing the switching time. Experimental investigations have shown that the acoustic field of the transducer can be modeled as a rectangular piston in a rigid baffle. This renders the switching time as the main influence on the gradient of the model piston speed and the resulting pressure wave. To determine the effect of different switching valves on the performance of the amplifier, varying control flow profiles will be used. Furthermore, to investigate the influence of flow velocity, different inlet pressures will be applied. Lastly, the inlet pressure will be set to a constant value and the size of the amplifier will be varied.
2. The Fluidic Transducer
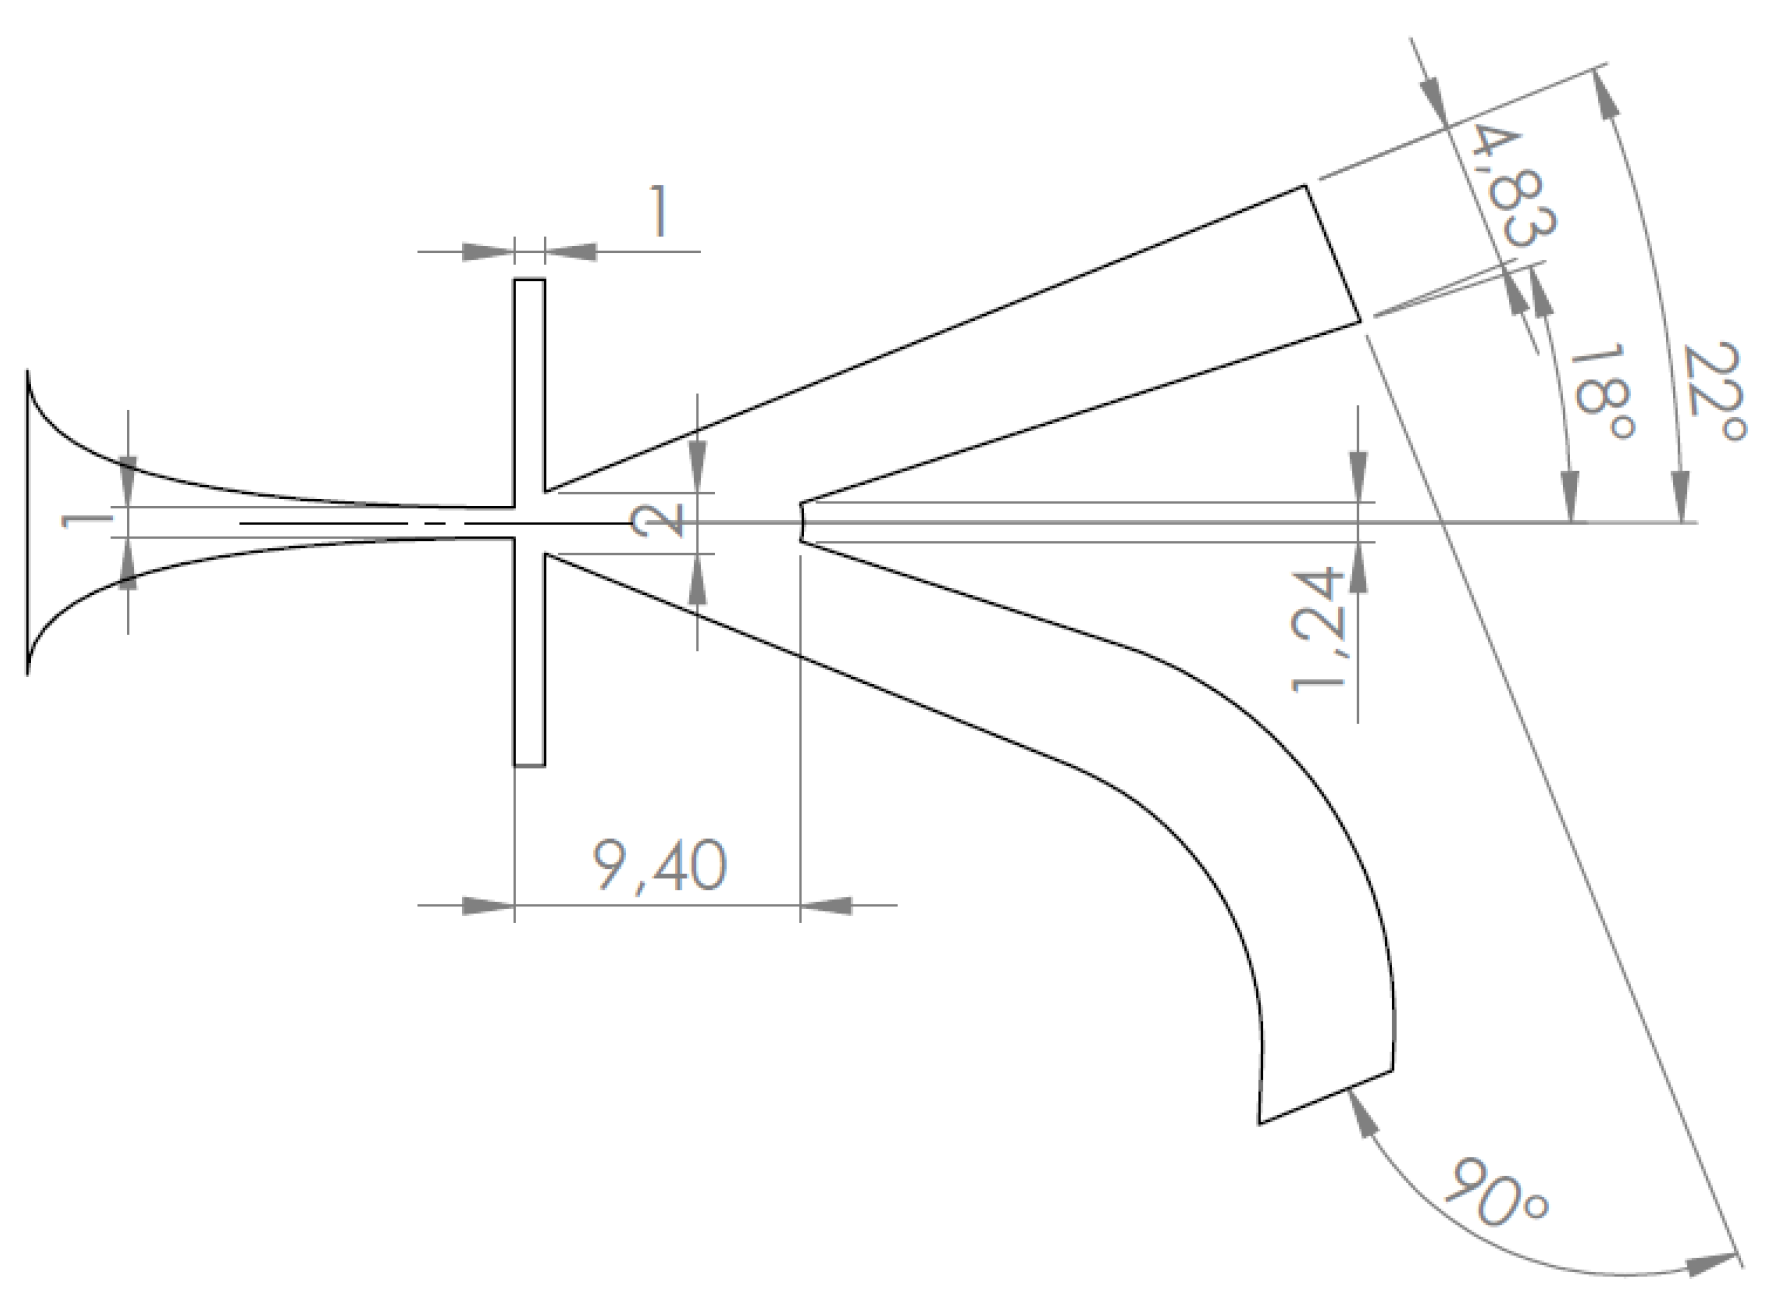
The fluidic transducer is based on a bistable fluidic amplifier. The dimensions are shown in Figure 1 and are mainly based on the fluidic switch used by Bobusch [12]. The system was scaled down to greatly reduce the switching time and allow the excitation of ultrasonic waves. Furthermore, to allow for better acoustic shielding, the lower output channel was curved to a 90° angle from the upper outlet.
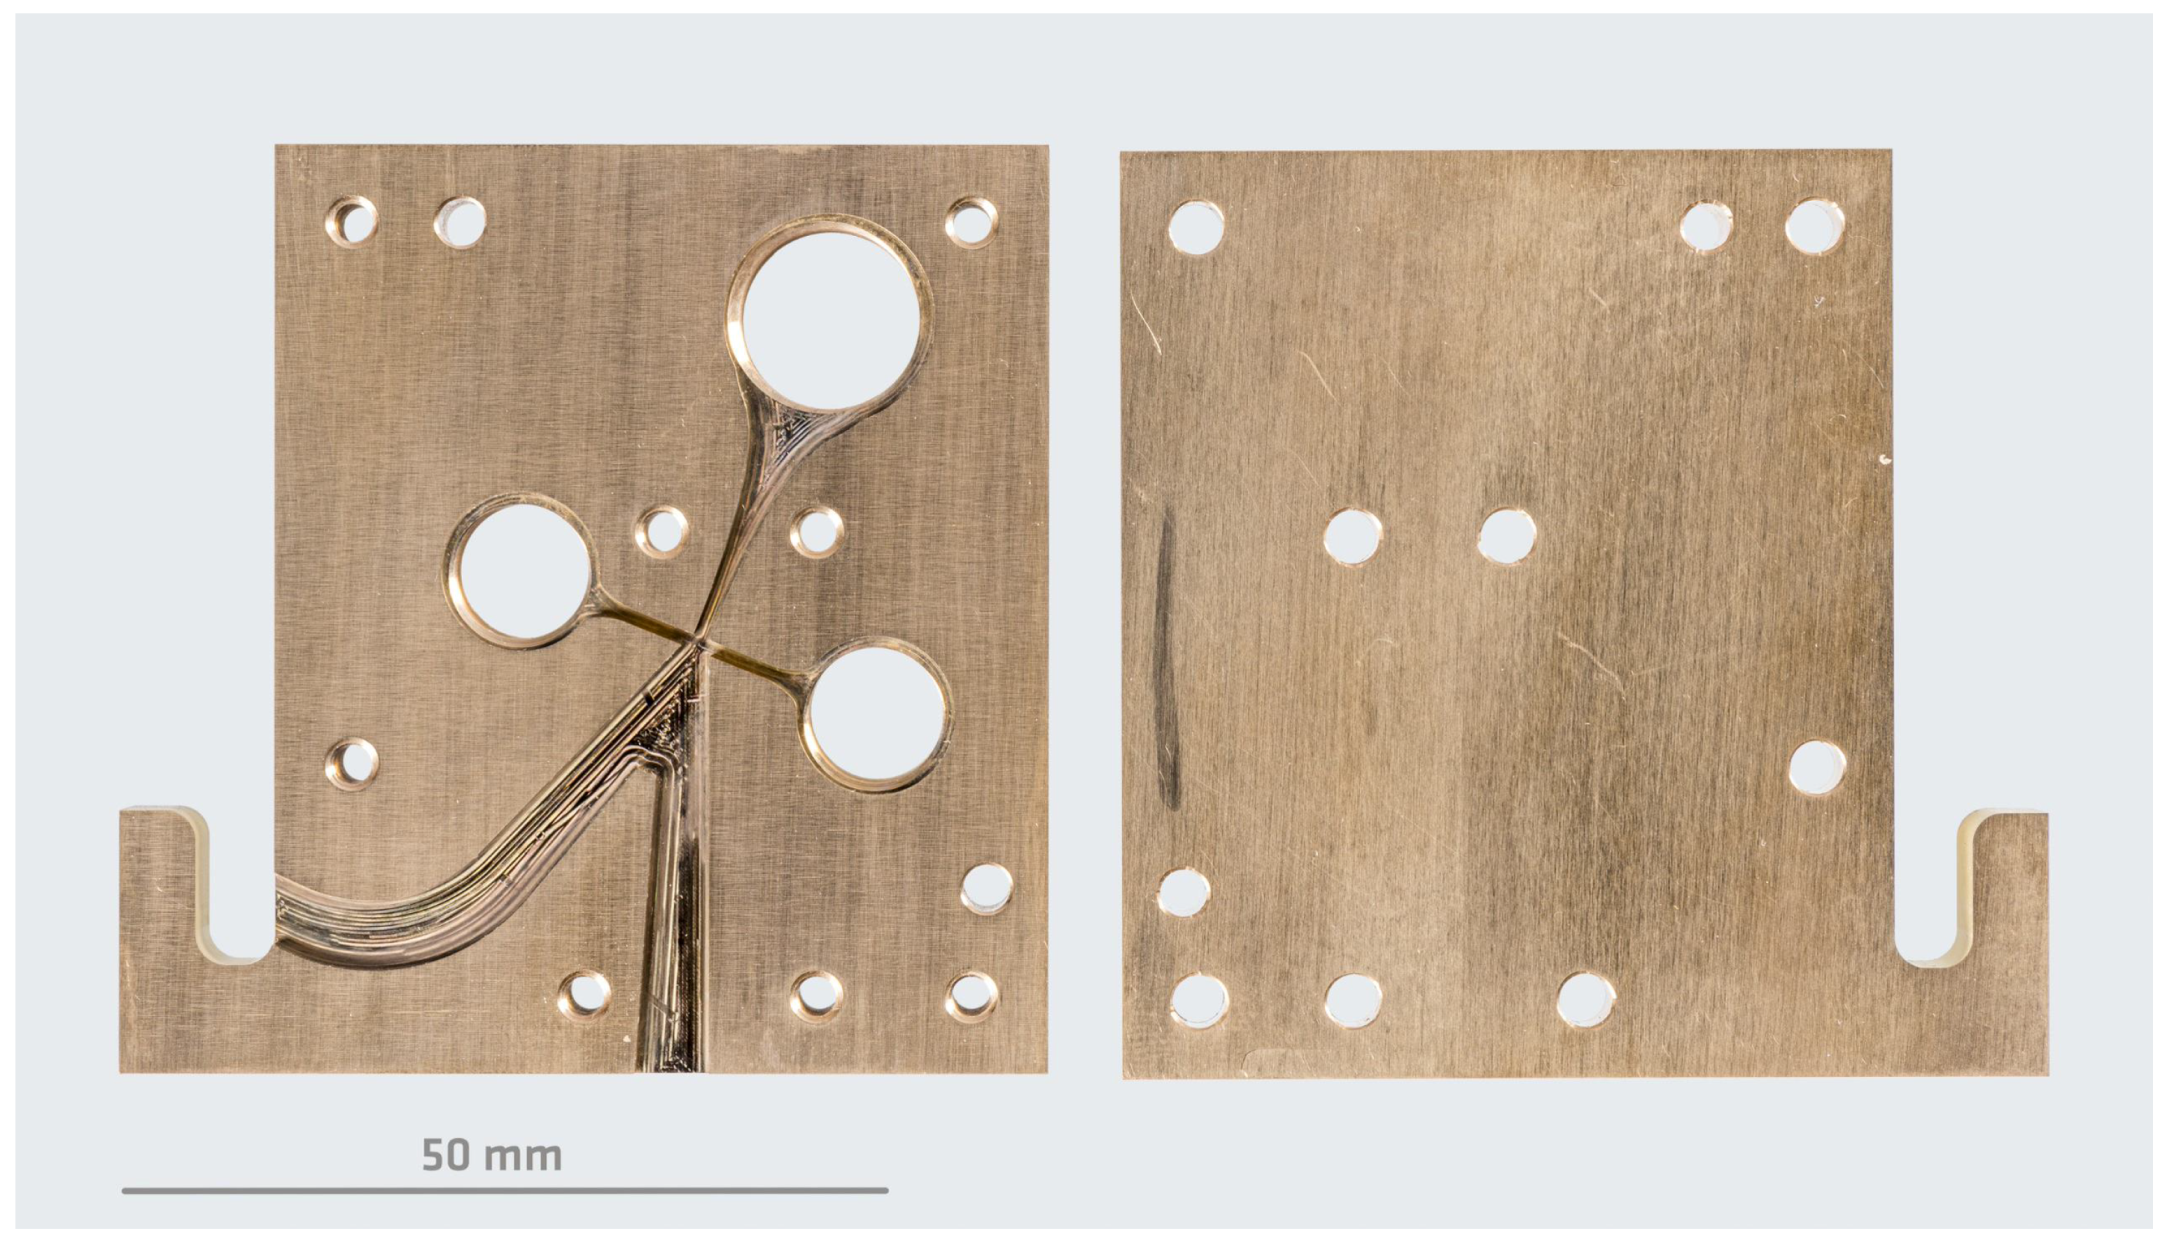
Figure 2 shows the prototype that was built from brass. It has an extrusion depth of 1mm and was CNC-milled in the workshop of the Bundesanstalt für Materialforschung und -prüfung (BAM).
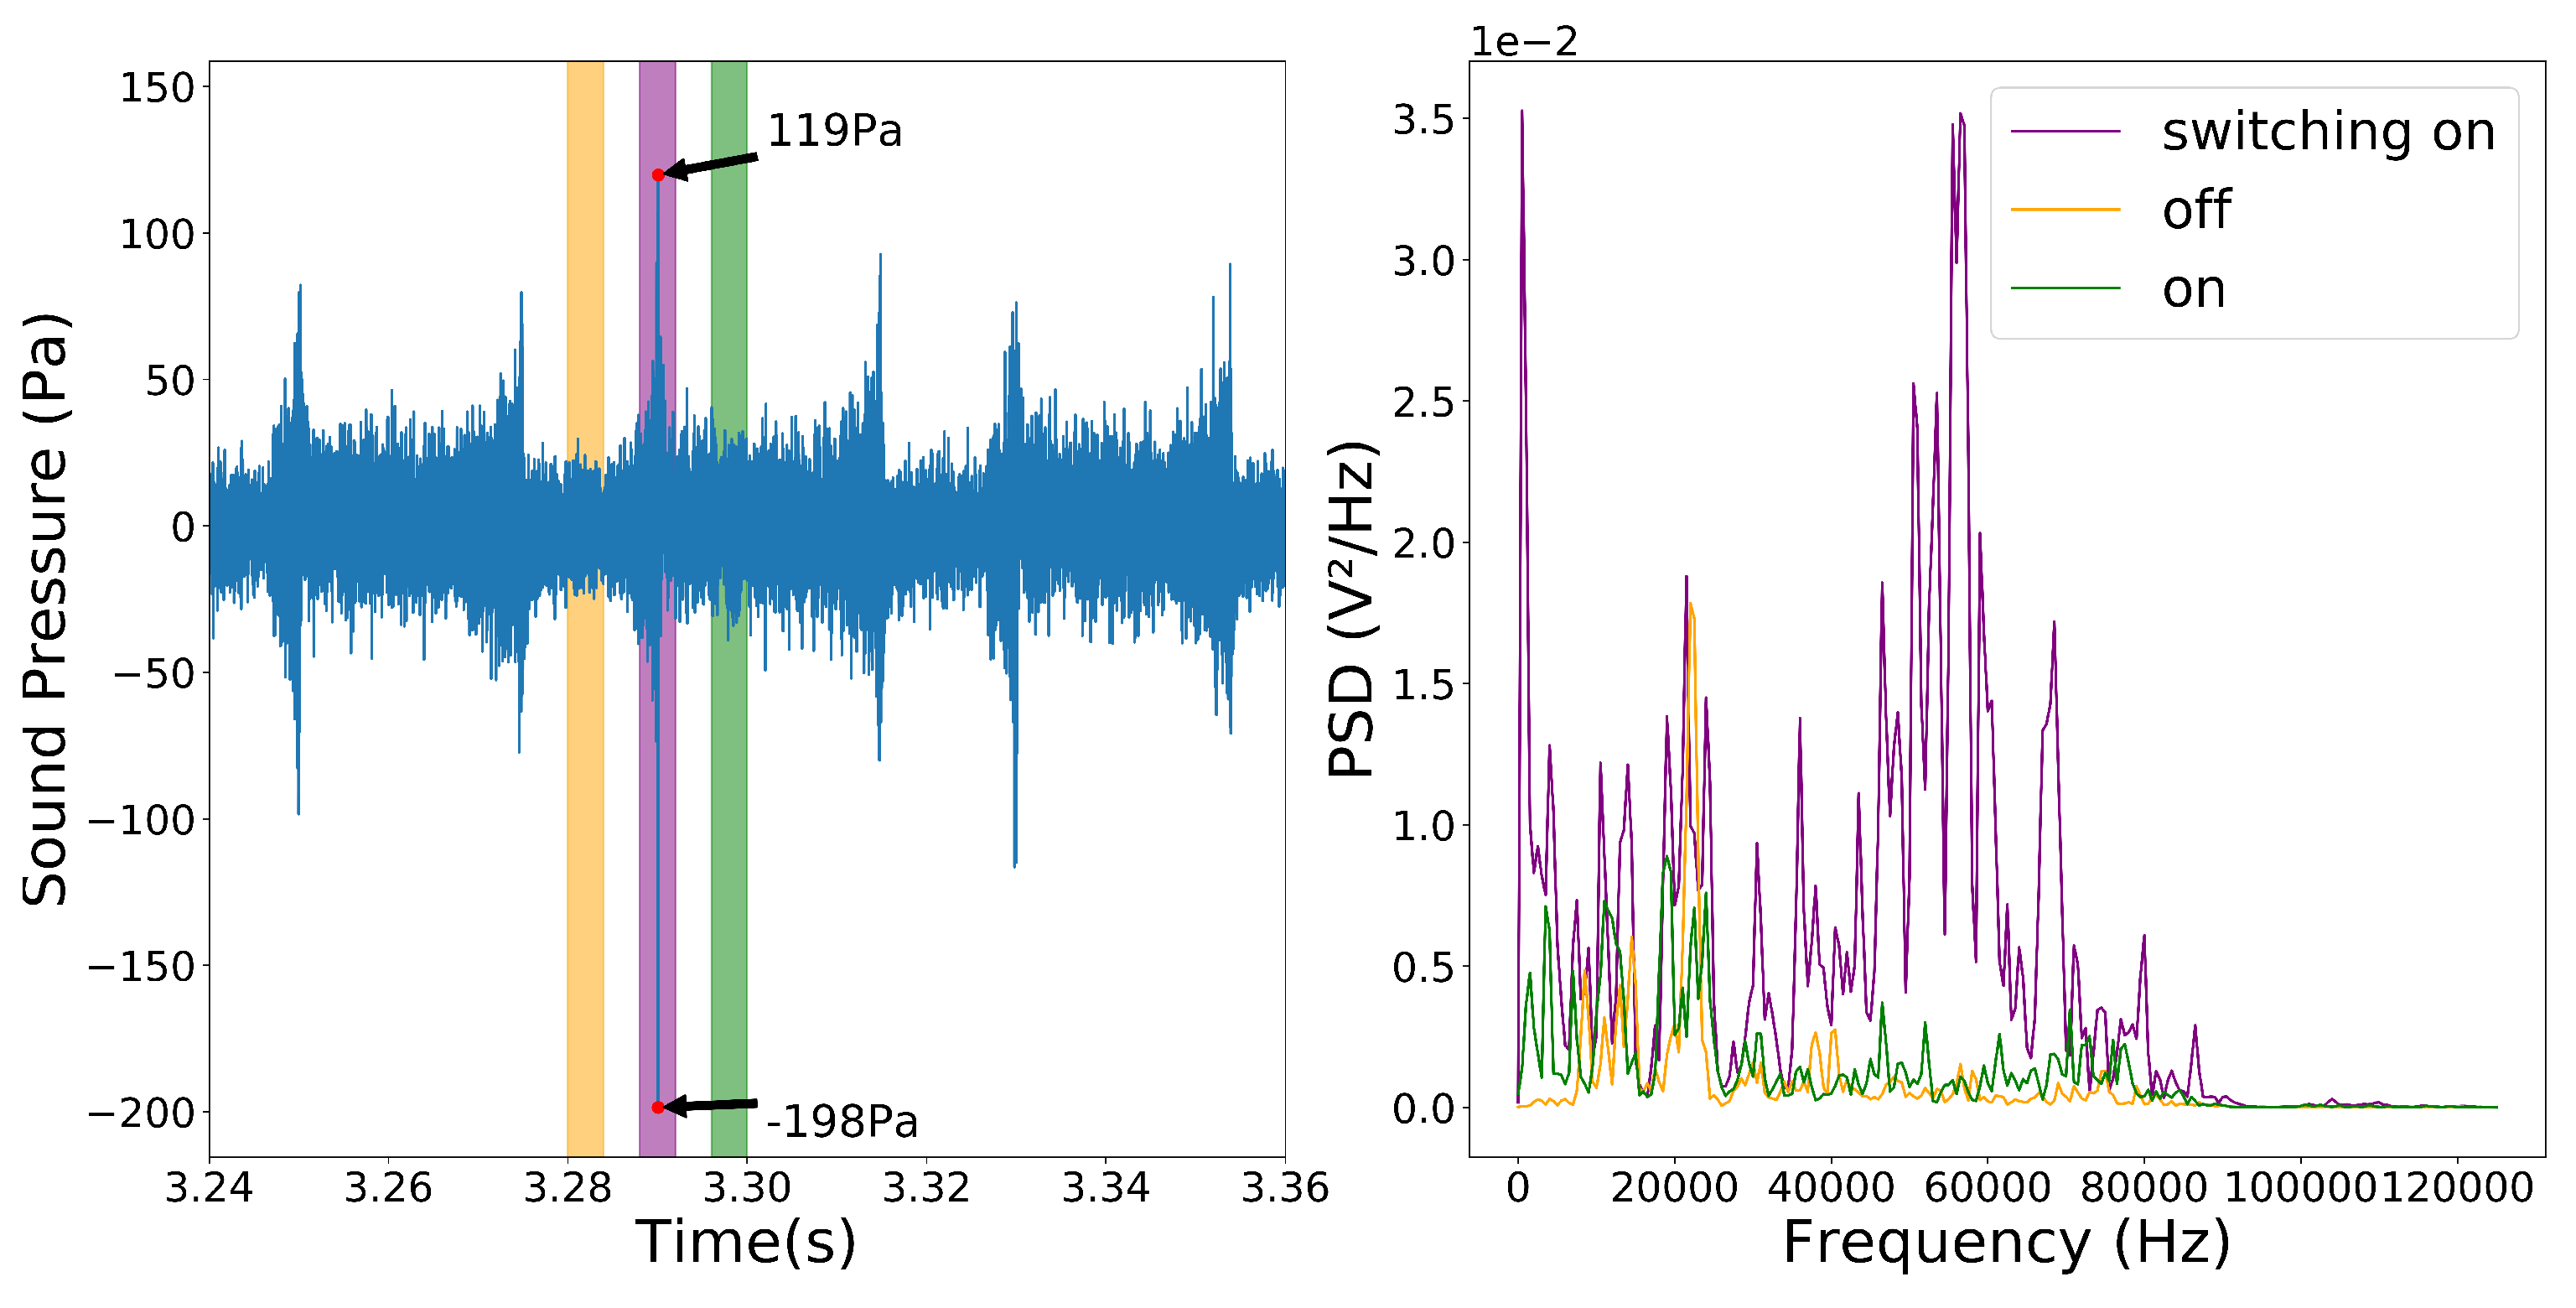
Figure 3 on the left shows a time series that was obtained with the measurement microphone Microtech Gefell MV301 in combination with a MV302 pre-amplifier about 20 mm from the outlet and the resulting spectrum. The coloured sections in the left plot mark the different states of the fluidic transducer and the corresponding spectra are shown in the right plot. The switching action of the device, signified by the pink area, produces a strong pulse of about 138 dB with a broadband ultrasonic spectrum between 30 kHz and 80 kHz.
3. Methods
3.1. Governing Equations
The motion of a compressible flow is described by the conservation of momentum, mass and energy. OpenFOAM uses the hyperbolic form of the conservation laws, with as the flux function. With the Reynolds decomposition, we arrive at the Unsteady Reynolds Averaged Navier Stokes equations (URANS). In hyperbolic form, these are
u, p and T are the density, velocity, pressure and temperature, respectively. I desribes the unit tensor and the specific total energy E is the combination of the specific internal energy e and the specific kinetic energy described by . The coupling of density and pressure is achieved by the ideal gas law with and as the specific heat capacity. describes the vicious-turbulent stress tensor and is given by
is calculated as a function of temperature with the Sutherland transport model while is modeled by the chosen turbulence model.
3.1.1. Numerical Setup
Mesh
Ansys ICEM CFD was used to construct the 2D mesh. The mesh is a tetrahedron dominant unstructured mesh, with seven prism layers along the walls. A mesh independence study was performed using four different mesh sizes from 120.202 to 572.666 elements. The mesh with 355.432 nodes showed no significant differences in flow characteristics and, therefore, was used. Characteristic values are a maximum skewness of 3.7 and a maximum non-orthogonality of 50.1. The farfield has a characteristic cell size (CCS) of 1 mm.
The mesh includes two refinement levels. The first one covers the inside of the switch and the near field with a CCS of 0.1 mm, the second one improves resolution at prominent structures where high gradients are expected, like the splitter with a ccs of 0.025 mm. These three size levels are visualized in the illustration of the mesh in Figure 4.
Solver
To allow for reproduction of the achieved results, the URANS equations are solved using the rhoCentralFoam solver of the open source software OpenFOAM 6.0 However, the accuracy of numerical results is heavily dependent on the numerical scheme employed, especially for the supersonic flow regime in the presented transducer. Shock systems can have significant impact on the flow behavior and need to be appropriately resolved. To improve the resolution of shocks, significant research has been done in the last 30 years. Some examples can be found in Barton et al. [23], Zoltak et al. [24] and Harten [25]. Toro [26] provides the theoretical background of different schemes and an extensive comparison between them. rhoCentralFoam is a density-based compressible flow solver based on the central-upwind schemes of Kurganov and Tadmor. Kurganov and Tadmor expanded on the Nessyahu and Tadmor central scheme [27], based on the Lax–Friedrich method [28], severely improved the numerical dissipation behaviour and showed good accuracy for shock simulations [29]. Furthermore, Marcantoni et al. [30] showed a better agreement for supersonic flows for rhoCentralFoam than the alternative sonicFoam solver, which is based on the PISO algorithm. The basic settings of the solver, such as the discretization types, were used. A first-order implicit Euler scheme is used for the temporal discretization and a second-order scheme is used for the local discretization. To ensure stability, the maximum time step was set by enforcing the Courant–Friedrichs–Lewy (CFL) number to stay below 0.4. The two-equation model k--SST [31] is used to model the turbulence.
Boundary Conditions
A mixture of fixed pressures and velocity inlets was used for the boundary conditions. The flow rate is specified at the main inlet via a fixed pressure to emulate the previous experimental setup. At the two control ports, time-varying velocities are specified due to the unknown pressure in the non-active states. Furthermore, pressure inlets would allow an inflow due to entrainment by the main jet, which does not accurately represent the experimental conditions. The walls are no-slip walls with characteristic wall functions for each turbulent quantity. Due to limited computing capacity, the far field was shaped according to the expected jet path and the corresponding outlets are set to a wave transmissive pressure boundary condition to eliminate the influence of wave reflection in the compressible case. The rest of the outlet areas are set to a fixed ambient pressure. To allow free entrainment by the jet in the far field, the outlet velocity condition is set to inletOutlet. The top and bottom patches of the domain are set to an empty boundary condition to realize a 2D case in OpenFOAM. All remaining boundary conditions are taken from the basic setup for the solver.
3.2. Switching Times
Two methods will be used to characterize the switching times. First, the averaged pressure over the top output channel will be analysed. The corresponding probe is marked in green in Figure 4. Since the bistable fluidic amplifier will be used as an ultrasonic transducer, pressure-based evaluation is an obvious choice. Even though compressible URANS simulations are not able to accurately predict acoustics, the pressure distribution provides valuable insight into the switching action.
Subsequently the local wall shear stress is analysed along the blue probe. This method is inspired by [32] who used the movement of the reattachment point, and, therefore, the movement of the zero-crossing of the wall shear stress behind the recirculation bubble, as a criterium for the switching time. Three distinct areas can be defined:
- Increasing size of the recirculation bubble—the reattachment point moves downstream;
- Maximum size of the recirculation bubble—the reattachment point stops moving downstream;
- Rapid Decreasing Size of the recirculation bubble due to switching—the reattachment point moves back upstream.
4. Simulations and Results
The parameters that are used for this study are based on experimental challenges involved in the usage of the fluidic transducer.
describes the length of the control flow slope and simulates the influence of solenoid valves with different switching times. As a baseline case, ms is chosen. This switching time is based on the commercially available fast switching valve Festo MHJ10-MF, with ms switching time at bar and 1 ms switching time at 4 bar, which was also used for the initial experiments.
p is the inlet pressure of the amplifier. This is chosen to investigate the sensitivity of the transducer to different pressure reservoirs and determine the influence of flow velocity on the switching time. The bar is chosen as the baseline pressure for p.
Lastly, (Power Nozzle) describes the size of the main nozzle and, therefore, the scale of the amplifier. Forster [21] describes the switching time as a function of the average residence time of fluid particles inside the system. For the same inlet pressure and, therefore, the same average flow velocity, this residence time increases linearly with the size of the system. The chosen baseline size for is 1 mm. Table 1 gives an overview of the different parameters that were used in this study.
To better visualize the different shapes of the recorded data, the plots are also overlapped in a characteristic starting point, resulting in the overlayed time and the scaled pressure . The first maximum pressure after the initial slope is chosen for the output pressure. For the wall shear stress plot, the maximum size of the recirculation bubble and, therefore, the maximum downstream position of the reattachment point is chosen.
4.1. Switching
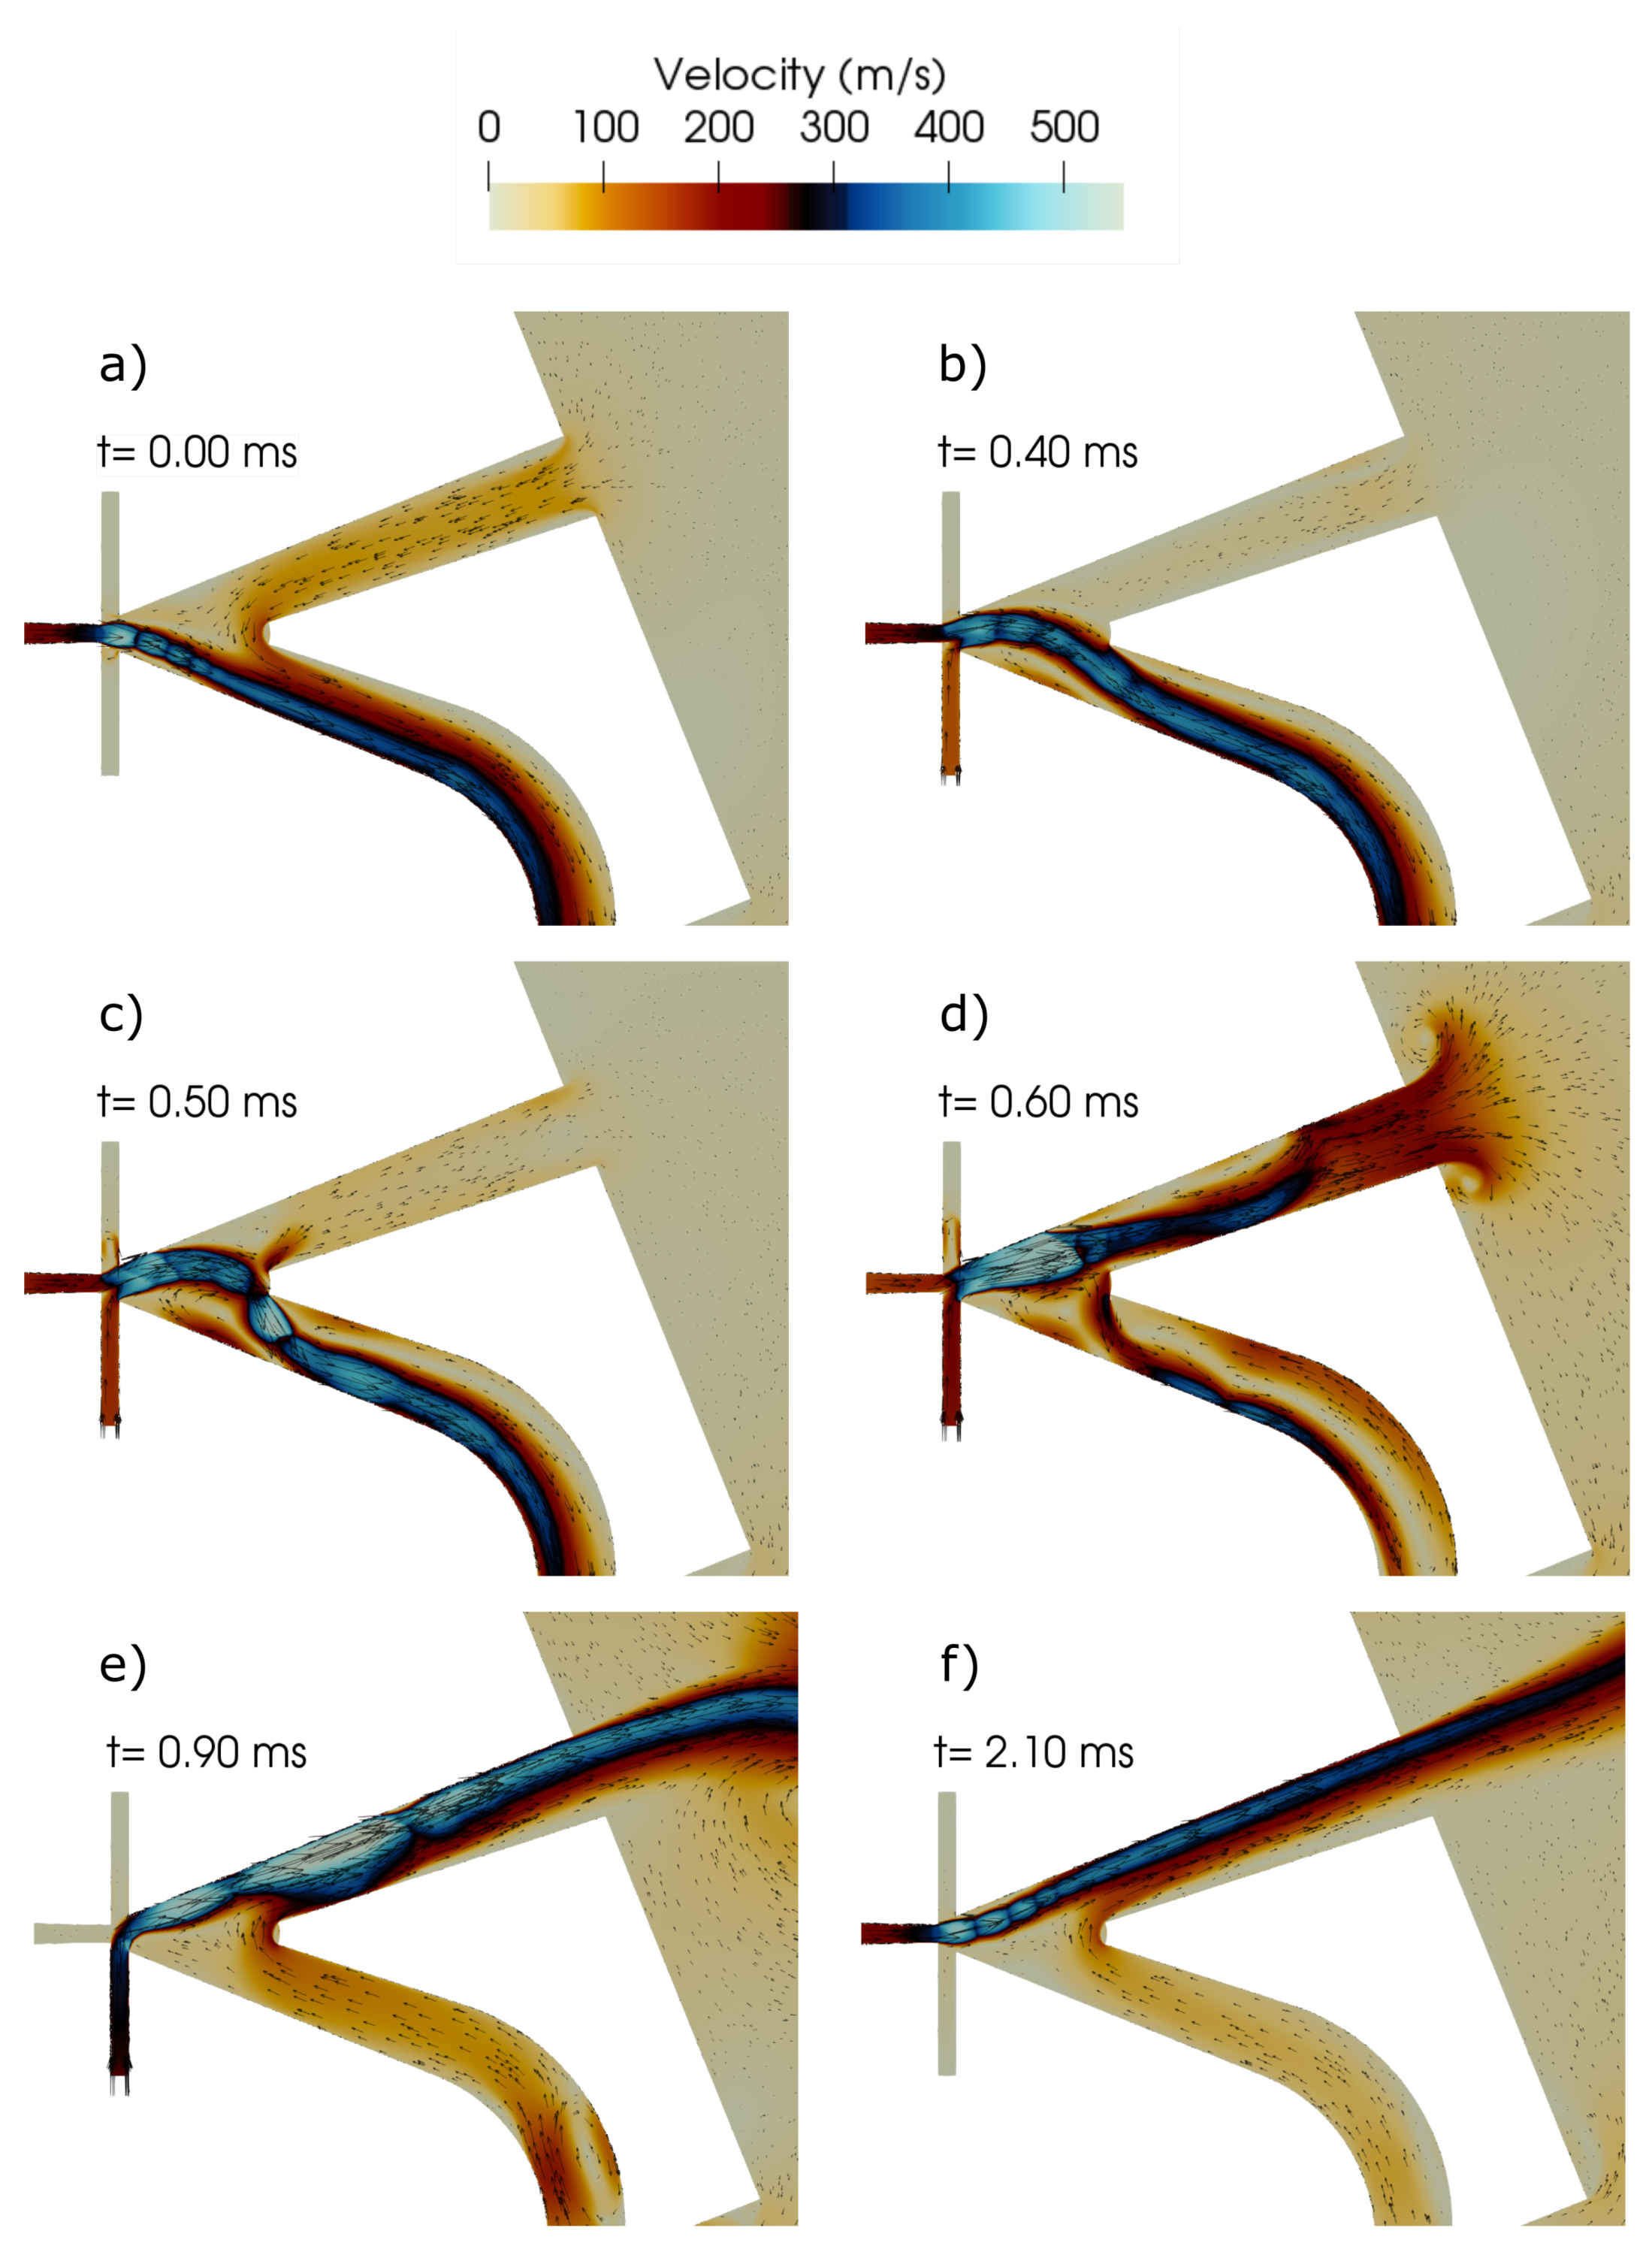
In addition to the parametric study, the supersonic switching behaviour of the fluidic bistable amplifier is also investigated. Figure 5 shows different phase angles of the system during switching with a fully choked power nozzle. After the startup of the system, the jet begins to form a flow instability. The combination of this instability and the coanda effect lead to the attachment of the jet to either one of the walls and a stable flow condition (Figure 5a). Both walls are equally likely to be the initial attachment wall, which is highlighted by the name bistable fluidic amplifier. When a control flow is applied to this stable condition, the jet detaches from the wall directly behind the control port and forms a recirculation bubble (Figure 5b). The control flow "fills up" the recirculation bubble until the jet hits the splitter (Figure 5c). Consecutively, the jet attaches to the opposite wall and completes the switching process (Figure 5d). The jet assumes a new stable position that is maintained after the control flow is cut (Figure 5e,f). The minimum switching flow was determined to be approximately of the main flow and is in good agreement with Lush [33] who experimentally determined a minimal required massflow between and . Even though supersonic underexpanded structures are clearly visible inside the main jet, they do not appear to be interfering with the switching action of the device. Figure 5e) shows a choked flow condition right before the attachment walls, clearly restricting the inflow through the power nozzle. Furthermore, a sizable inflow through the inactive outlet can be observed due to entrainment by the large shear layer the main jet forms.
4.2. Control Flow Slope
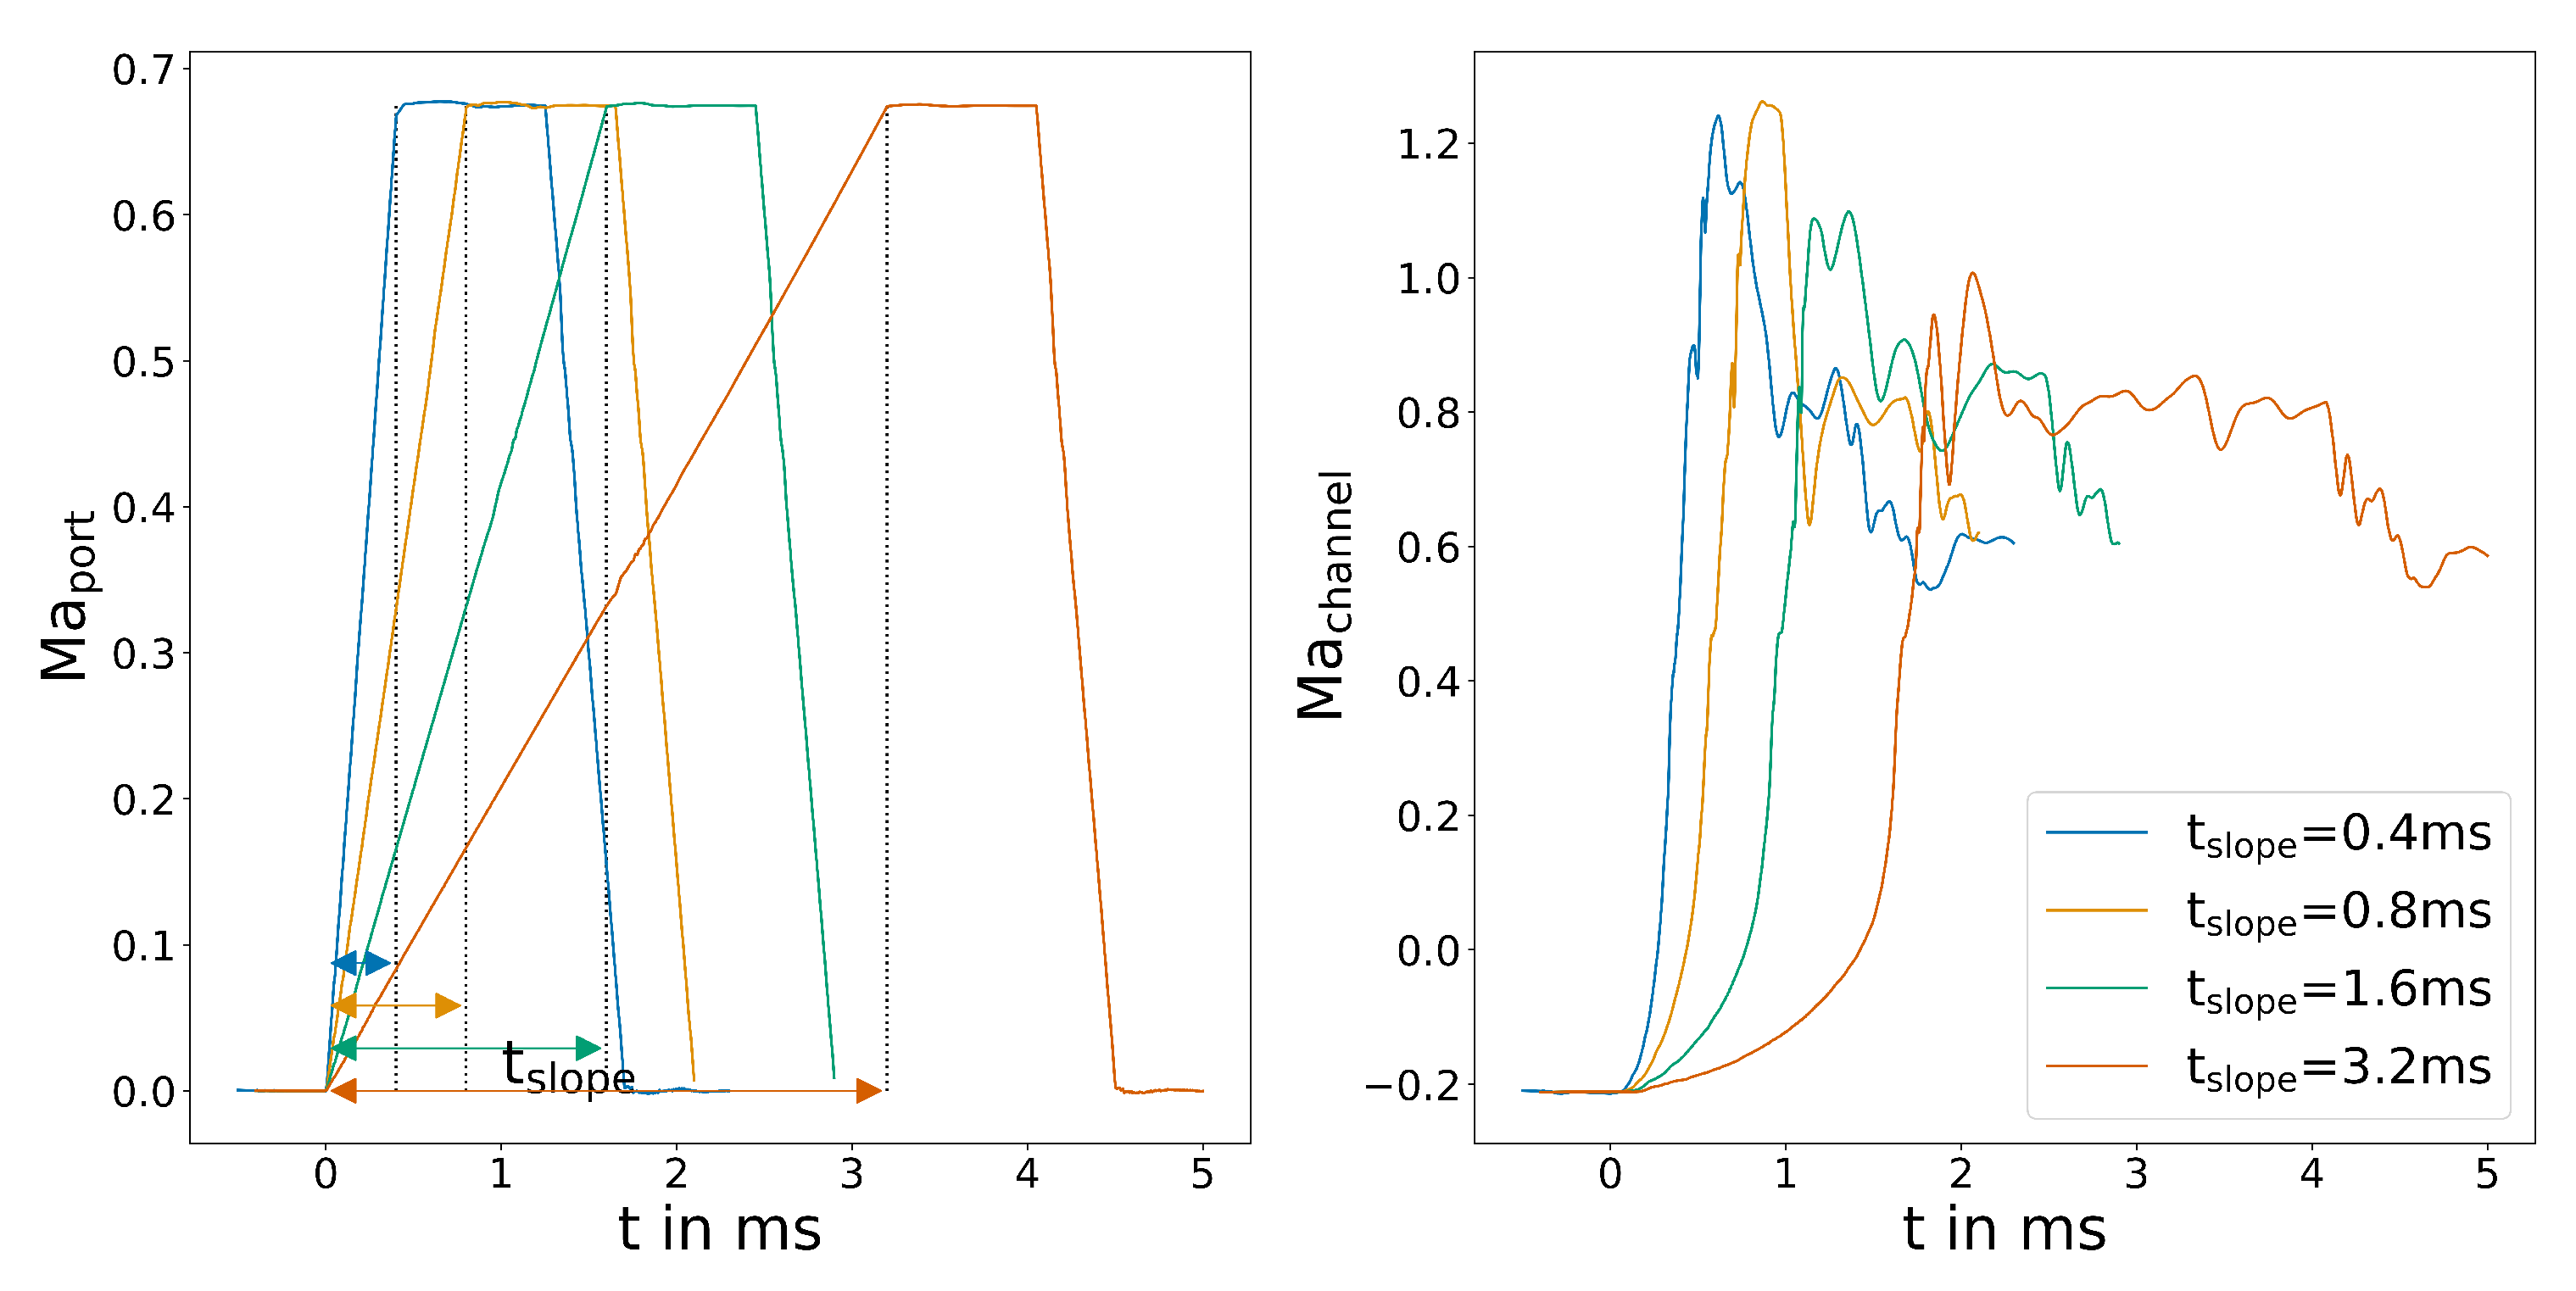
First the different slopes of the control flow are investigated. The switching time is expected to be mostly independent of . Figure 6 shows the different control flow distributions used for the study.
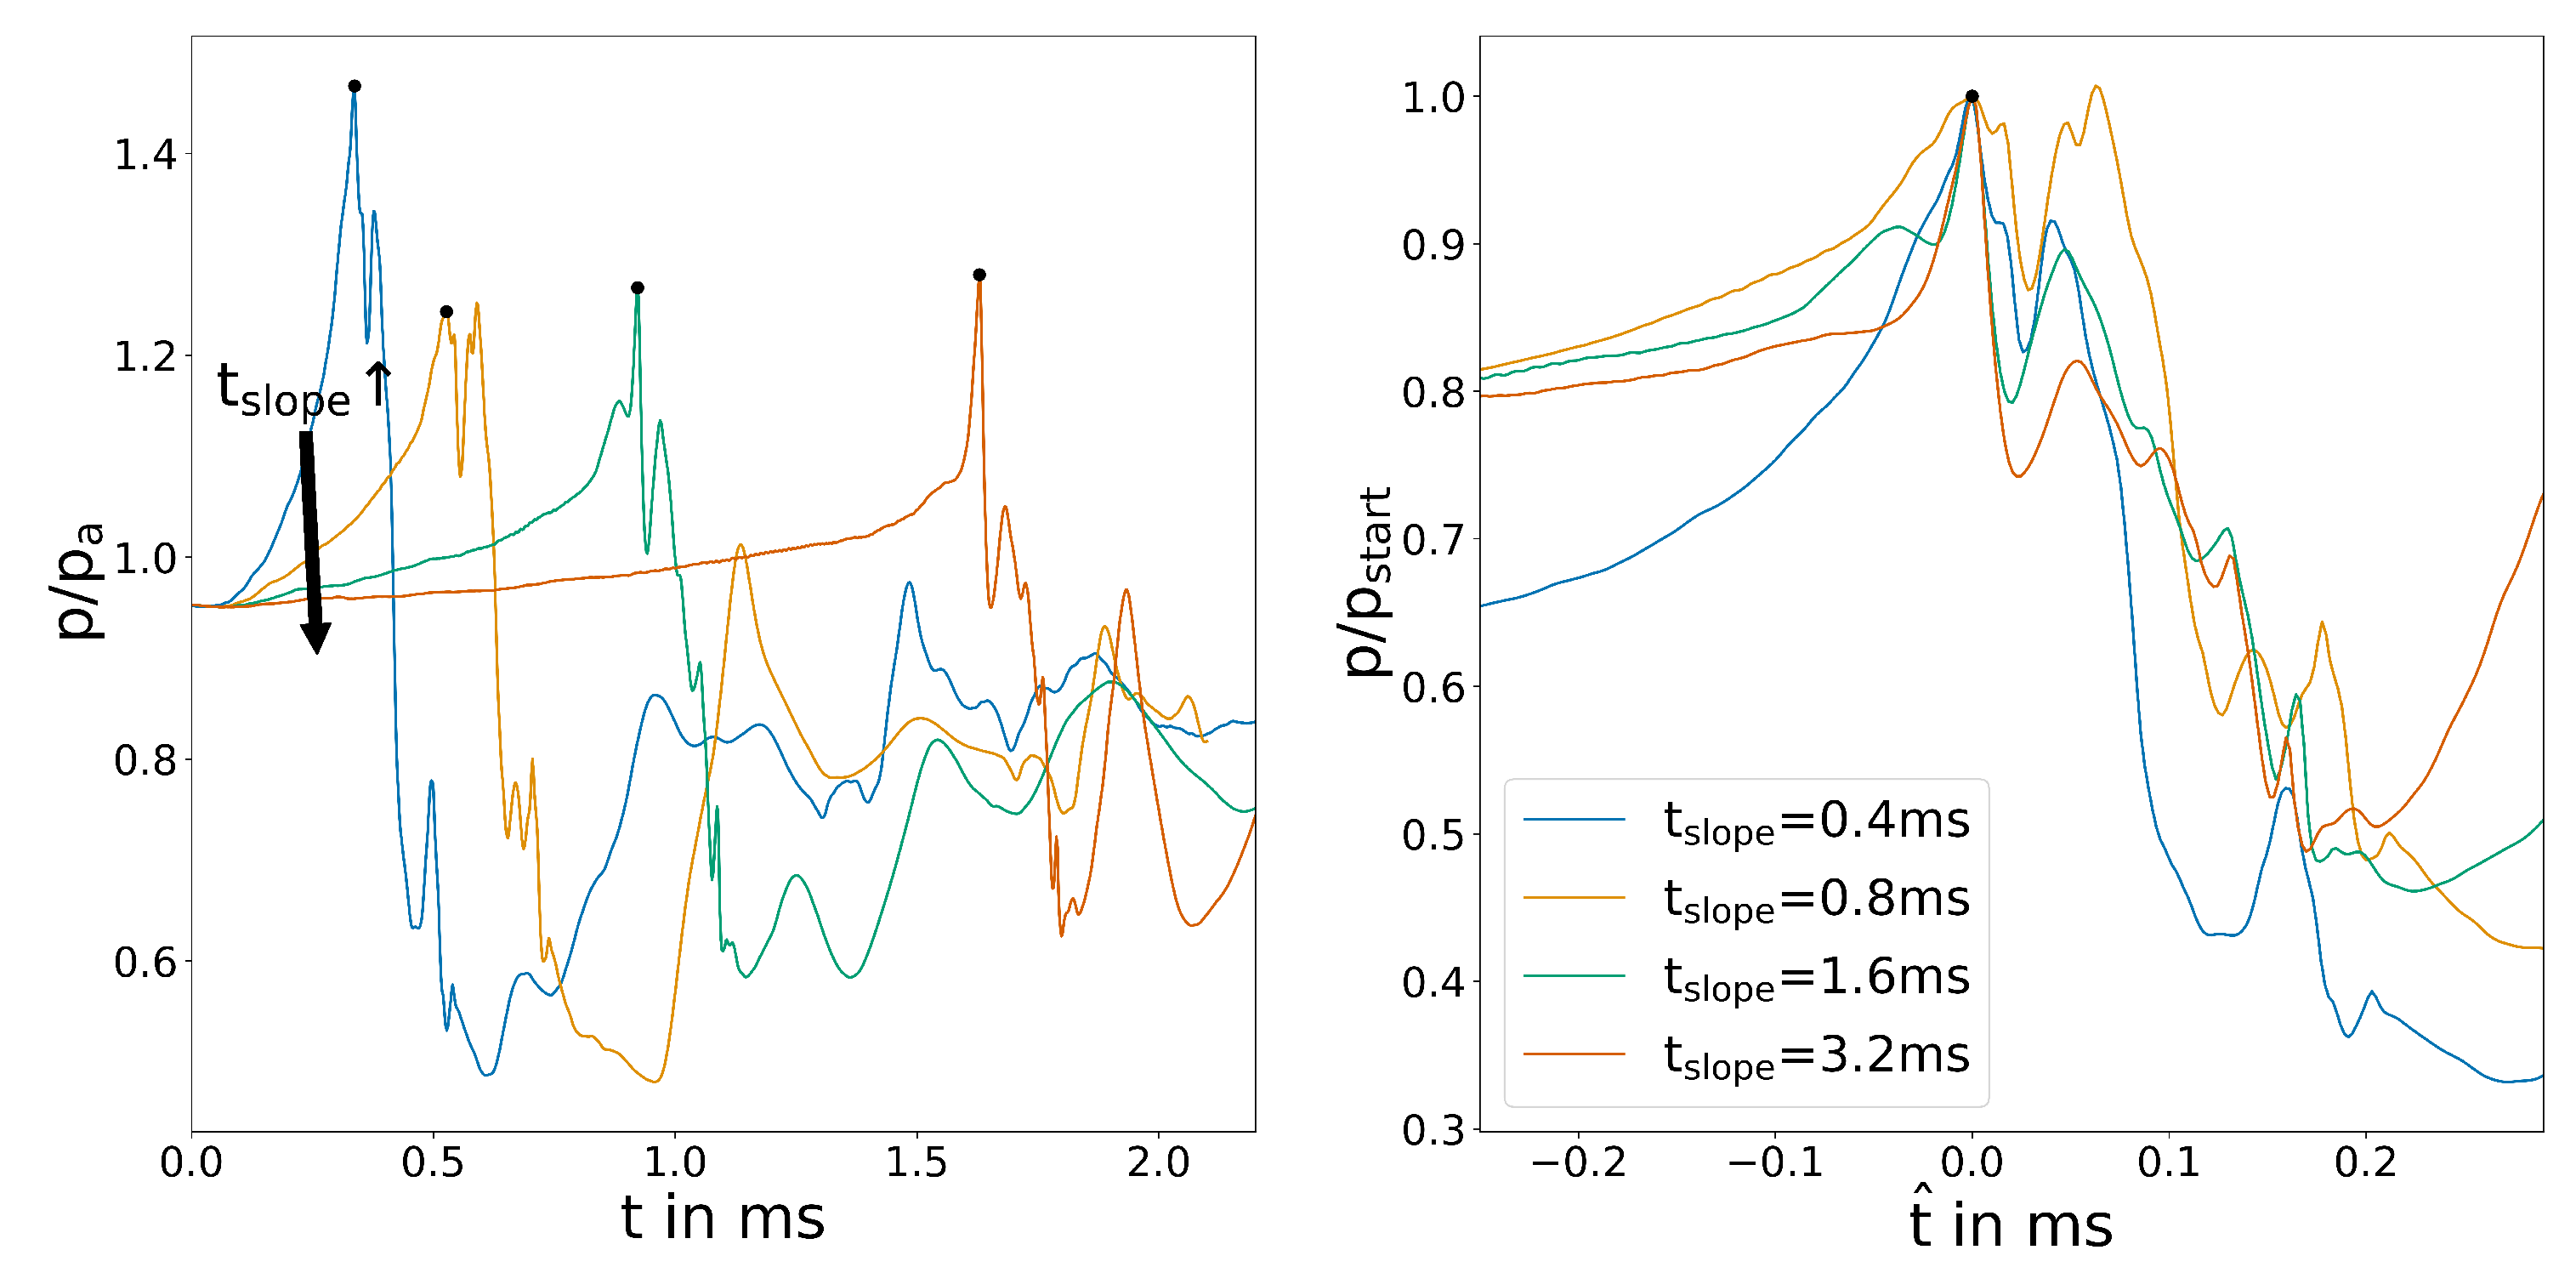
The outlet pressure shows a clear characteristic for all cases, as can be seen in Figure 7. Initially, the pressure rises slowly because the aforementioned inflow in the inactive outlet is restricted. Before switching, the pressure peaks in one or two maxima and rapidly decreases during switching. After a short period, the pressure adjusts to the outflow conditions and stabilizes. The plot also shows the difficulty of determining a characteristic endpoint for switching. Since the pressure probe is crossed by several shock systems in the supersonic flow, the temporal pressure distribution shows secondary peaks that might overlap a characteristic minimum after switching. Therefore, only the wall shear stress plots will be used to determine a defined switching time. When overlaying the starting point, these secondary peaks become even more apparent and make evaluation of the plots difficult. of ms shows faster switching, while the others are only slightly different.
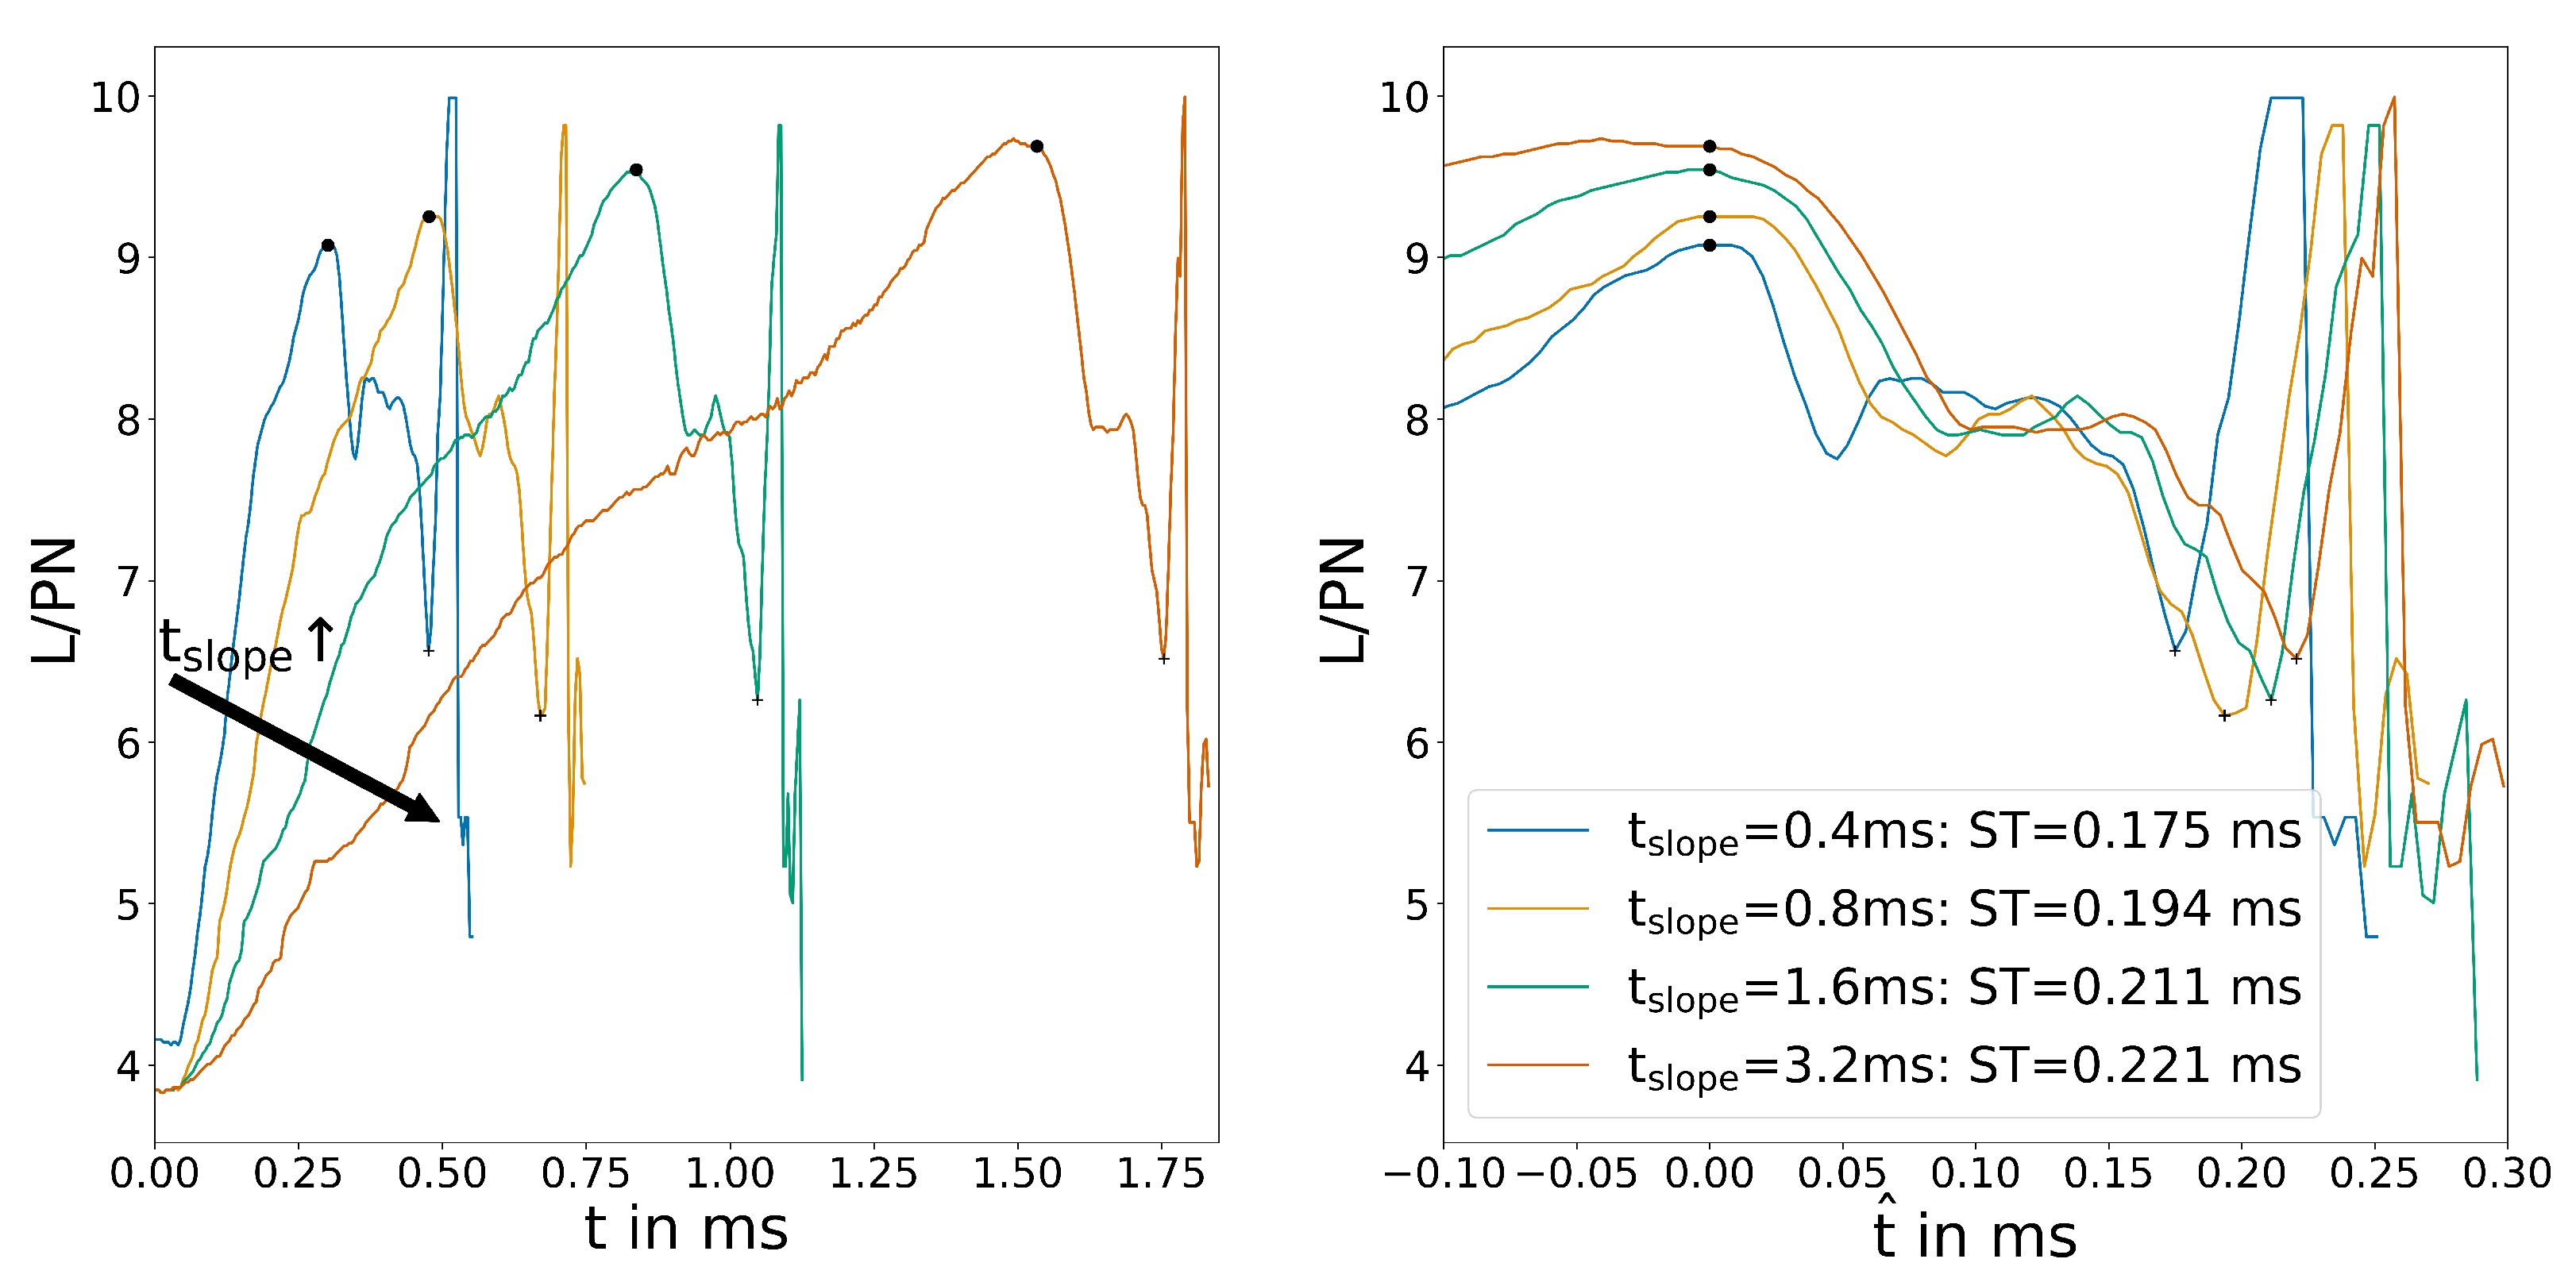
This is supported by the wall shear stress plots in Figure 8.
All four plots follow the behaviour laid out in Section 3.2. First, the reattachment point (signified by the zero crossing of the wall shear stress) moves downstream, creating a maximum in the plot. Subsequently, the recirculation bubble shrinks to a minimum in the plot when switching is complete. The plot clearly shows a small but noticeable difference in switching time. This is even more apparent for the overlayed plots. The differences are most likely a result of the higher velocity that is present in the system due to control flow velocity overshoot. Figure 6 show this on the right side. ms seems to be an exception, which might be explained by a shift in switching regime from mass-flow-dominated to pressure-dominated. To the authors knowledge, this effect has not been published before and will require further investigation. Furthermore, even though solenoid valves with these switching times are available, they are expensive and the additional volume of the pipe between the valve and the control port slows down the pressure build-up significantly, resulting in a longer slopes for the control flow velocity.
4.3. Pressure
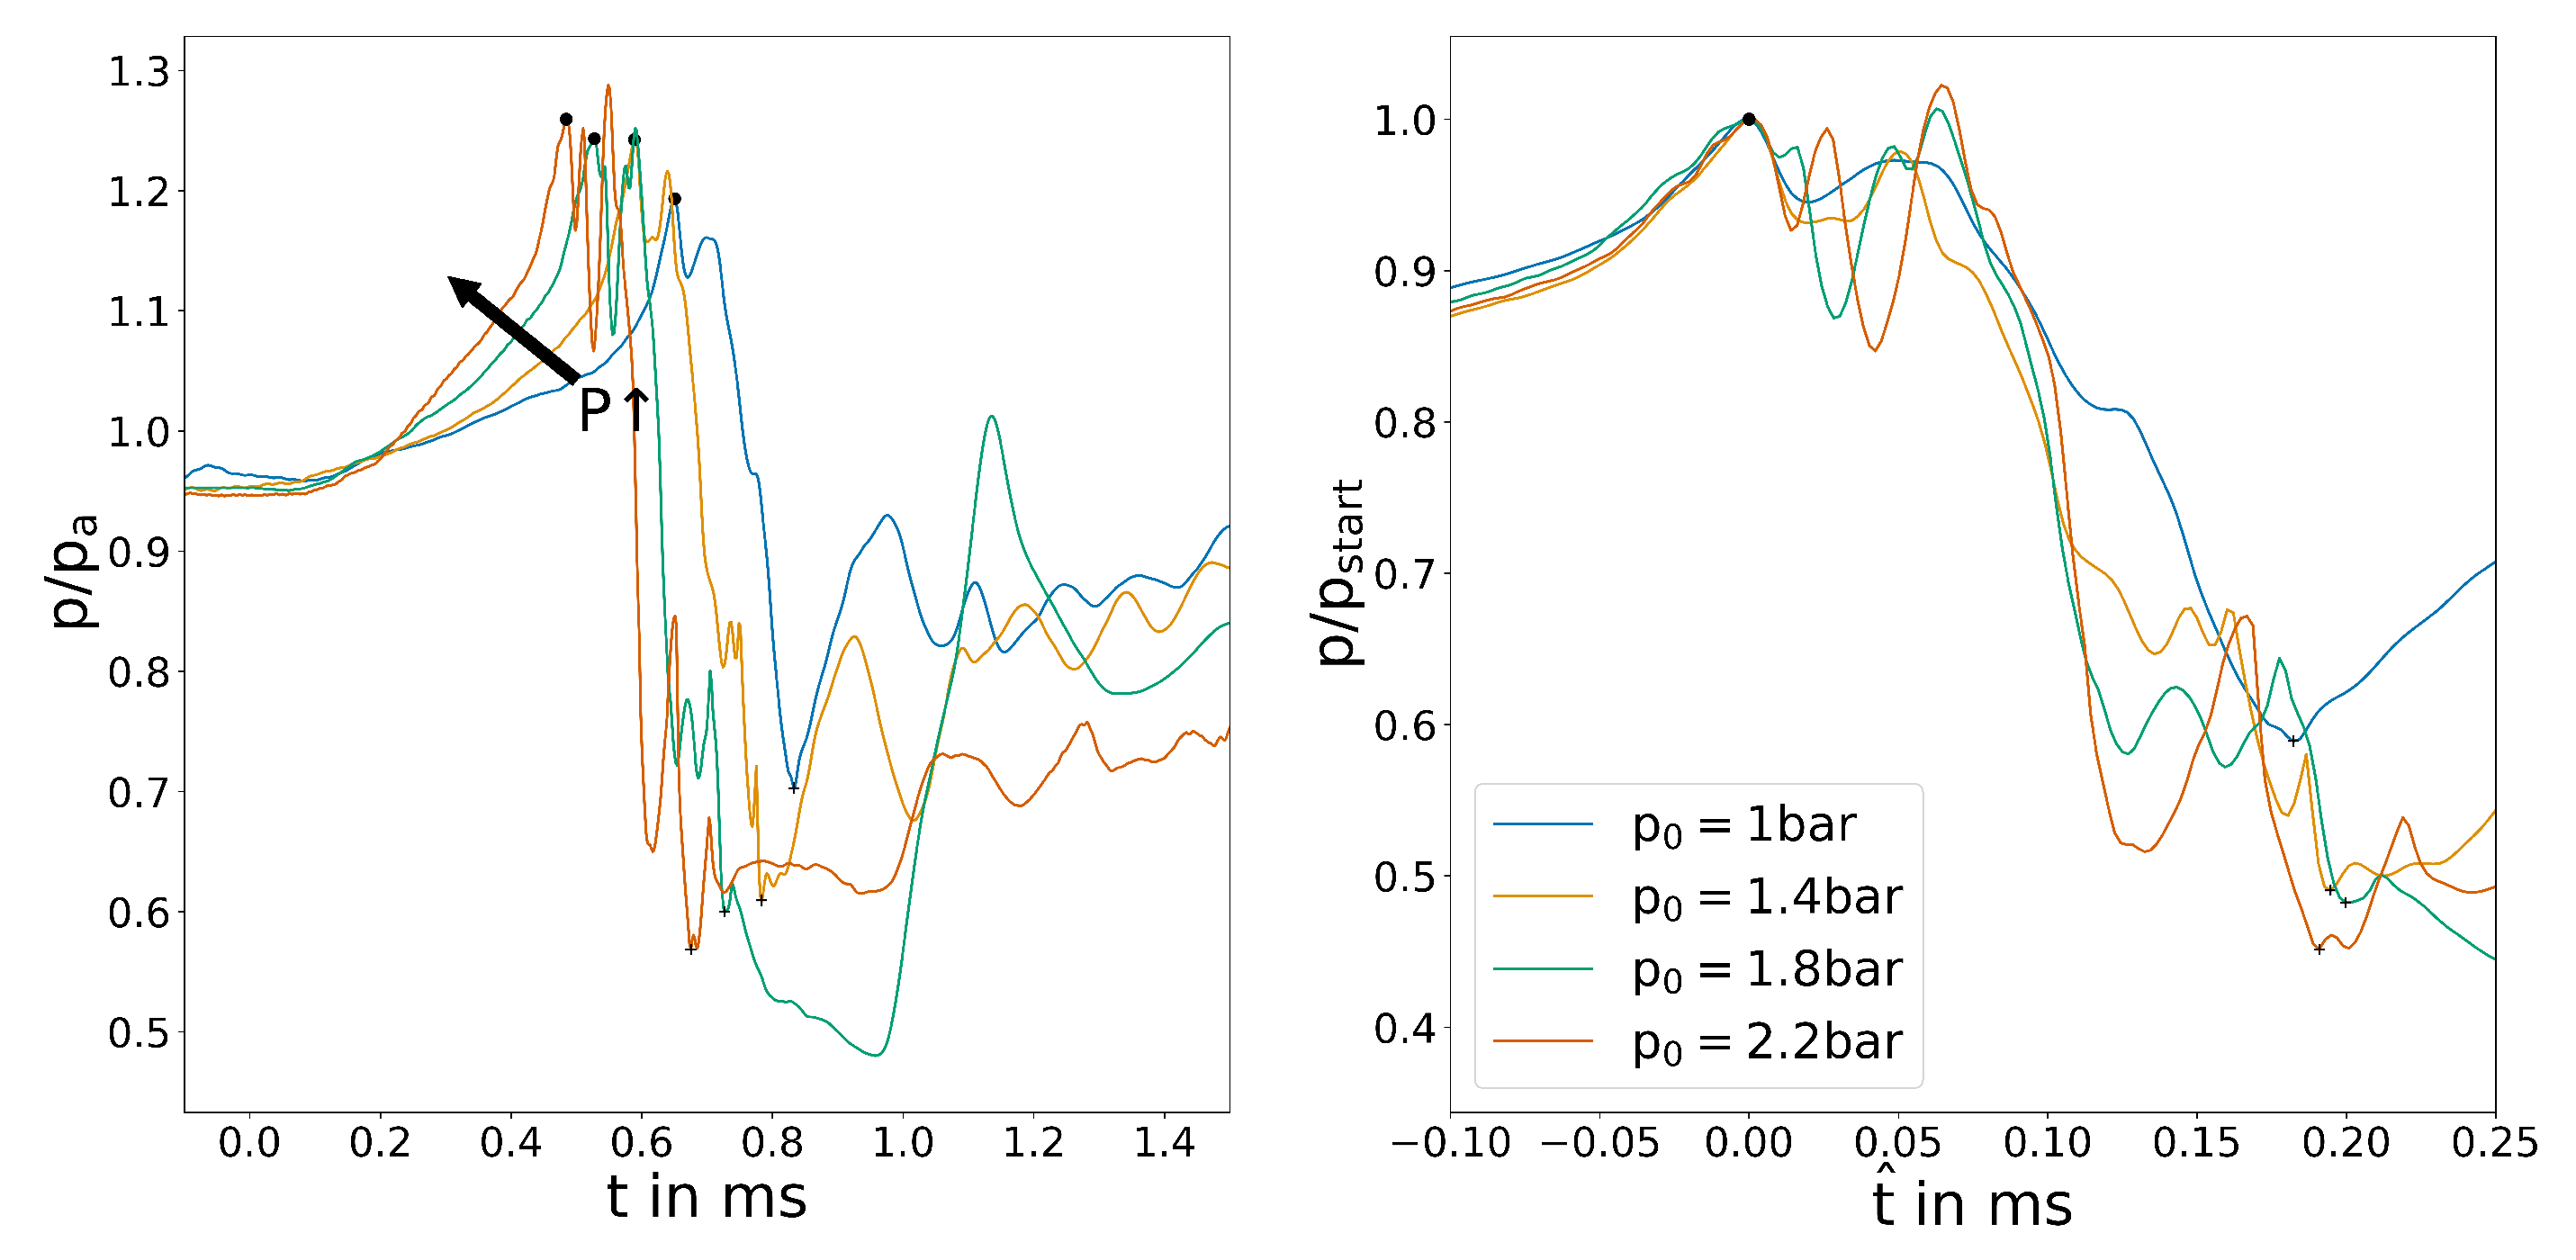
Second the variations in the inlet pressures are analysed. The different pressure levels are expected to increase the overall flow velocity inside the system and, therefore, decrease the switching time based on Forster [21]. The output pressure plot in Figure 9 shows a clear picture of this fact. Towards higher pressures, the increase in velocity most likely starts to fall off due to compression effects and backpressure restricting the acceleration after the choked nozzle, leading to a small decrease in switching time. A similar explanation can be found for the large difference that can be observed at bar. The flow at this pressure is barely critical, so no significant acceleration occurs after the choked nozzle, explaining the increase in switching time.
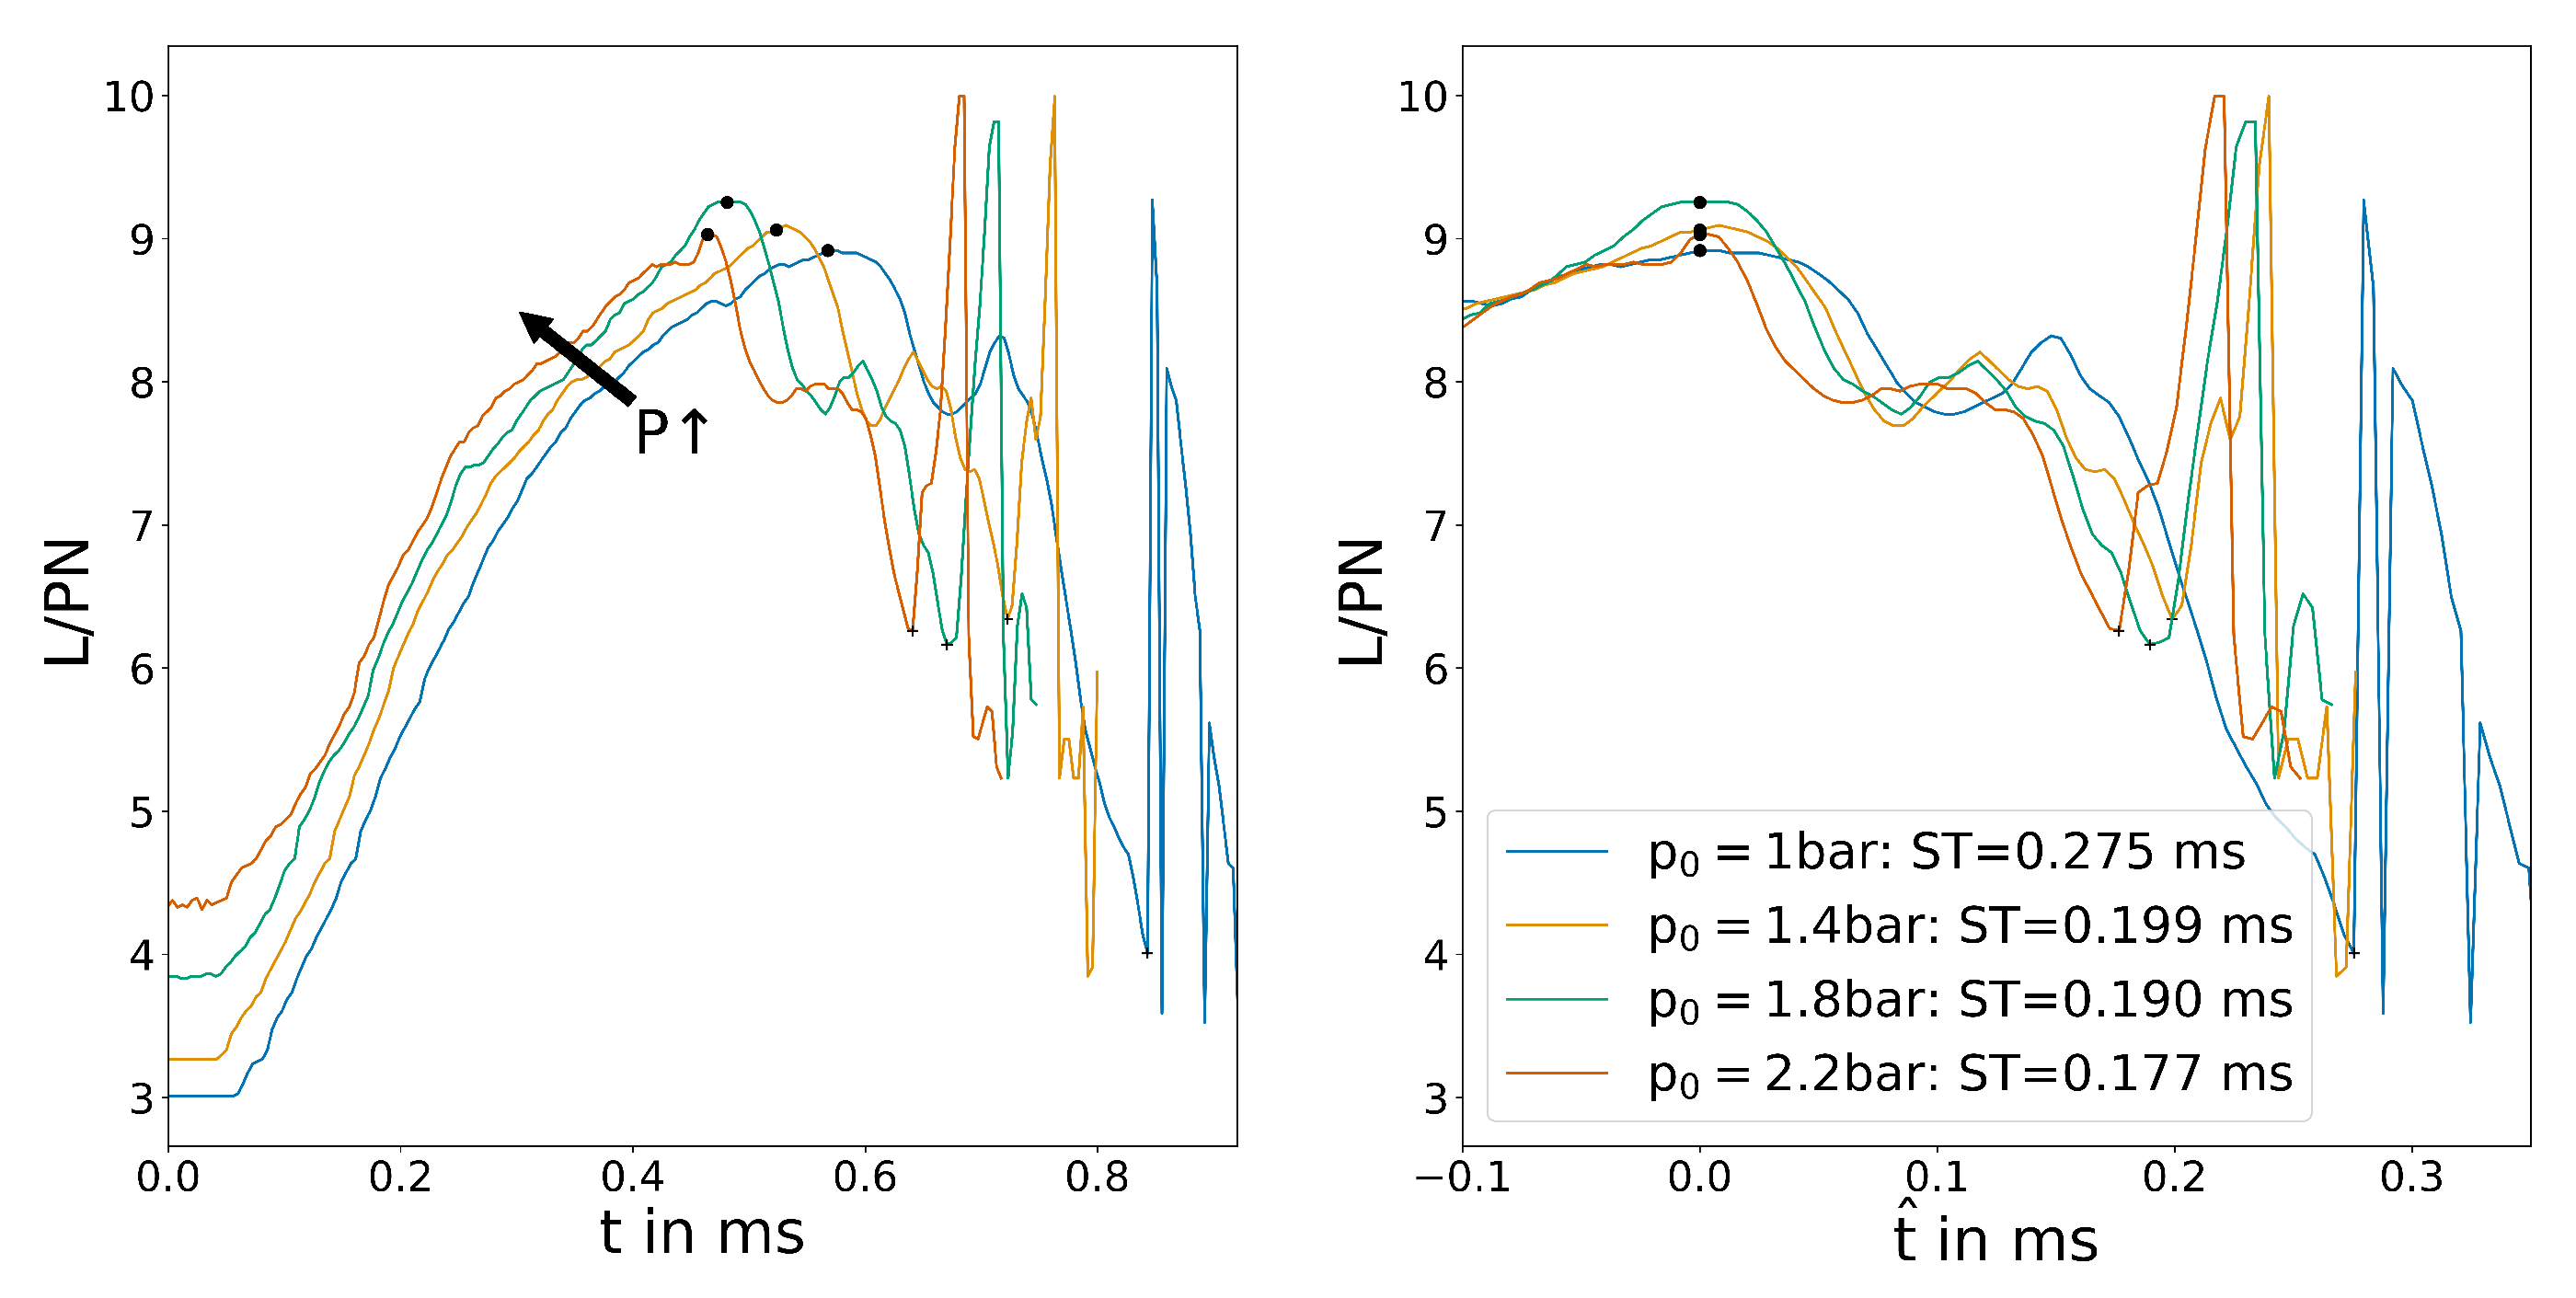
The wall shear stress plot in Figure 10 shows a slightly different behaviour. Between bar and bar, it almost shows a linear relationship between pressure and decrease in switching time that cannot be easily explained. The large difference between bar and the rest of the plots is also clearly visible.
4.4. Nozzle Diameter
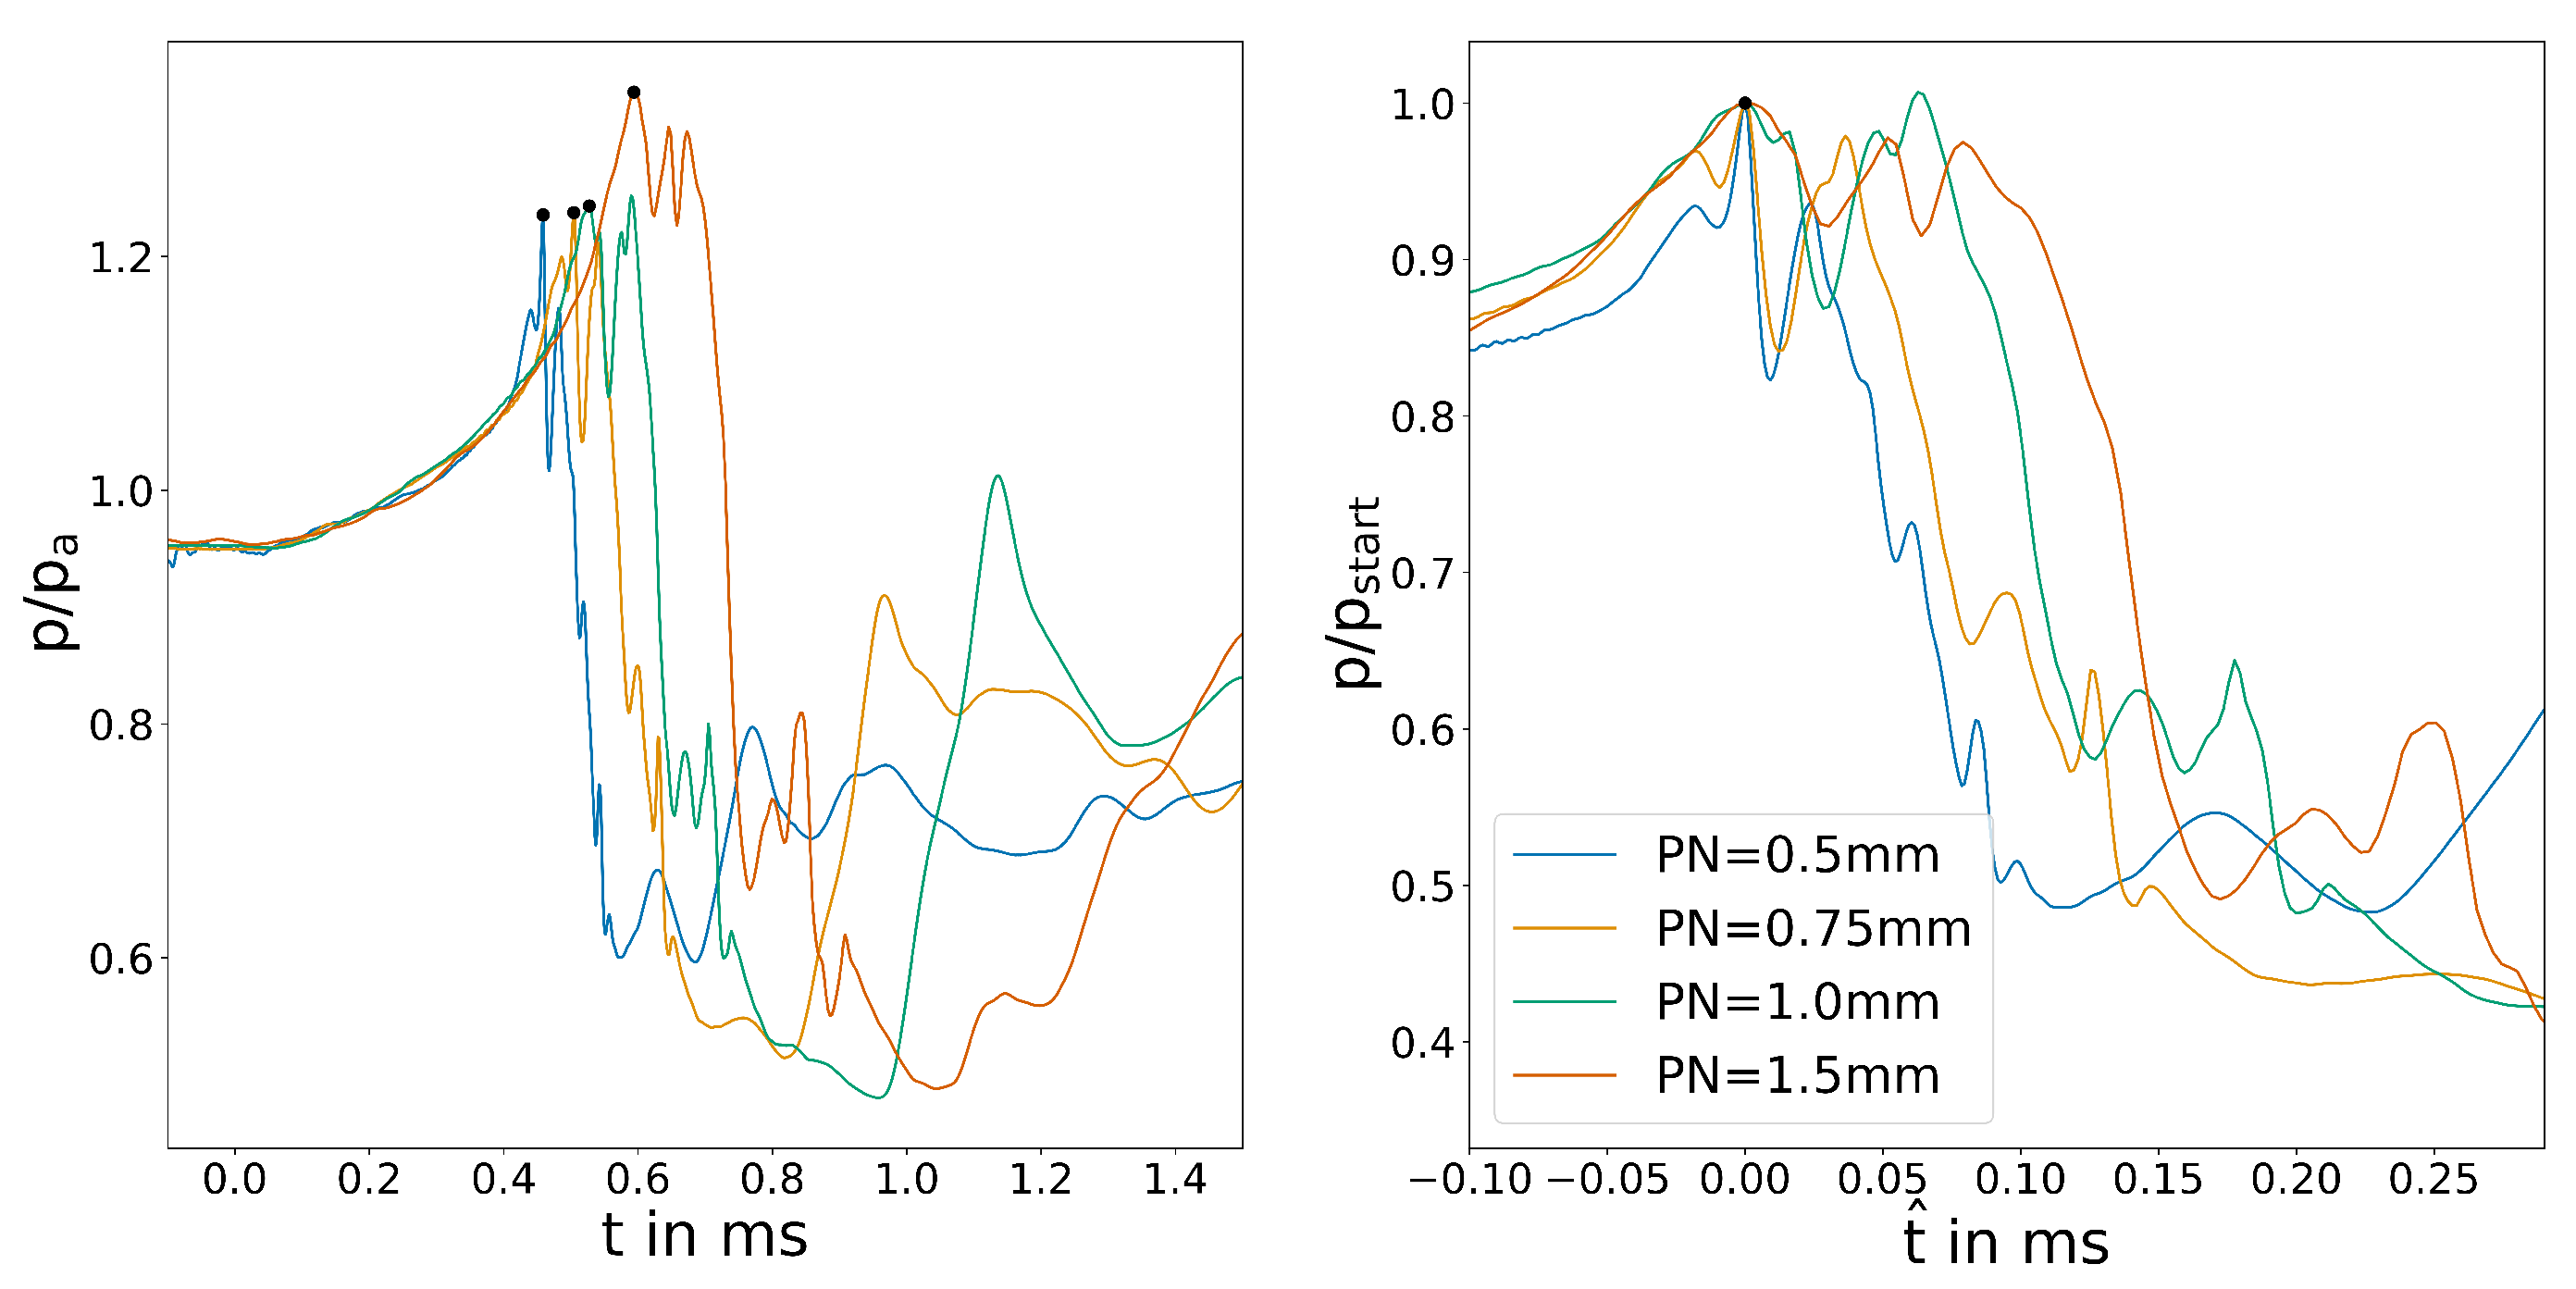
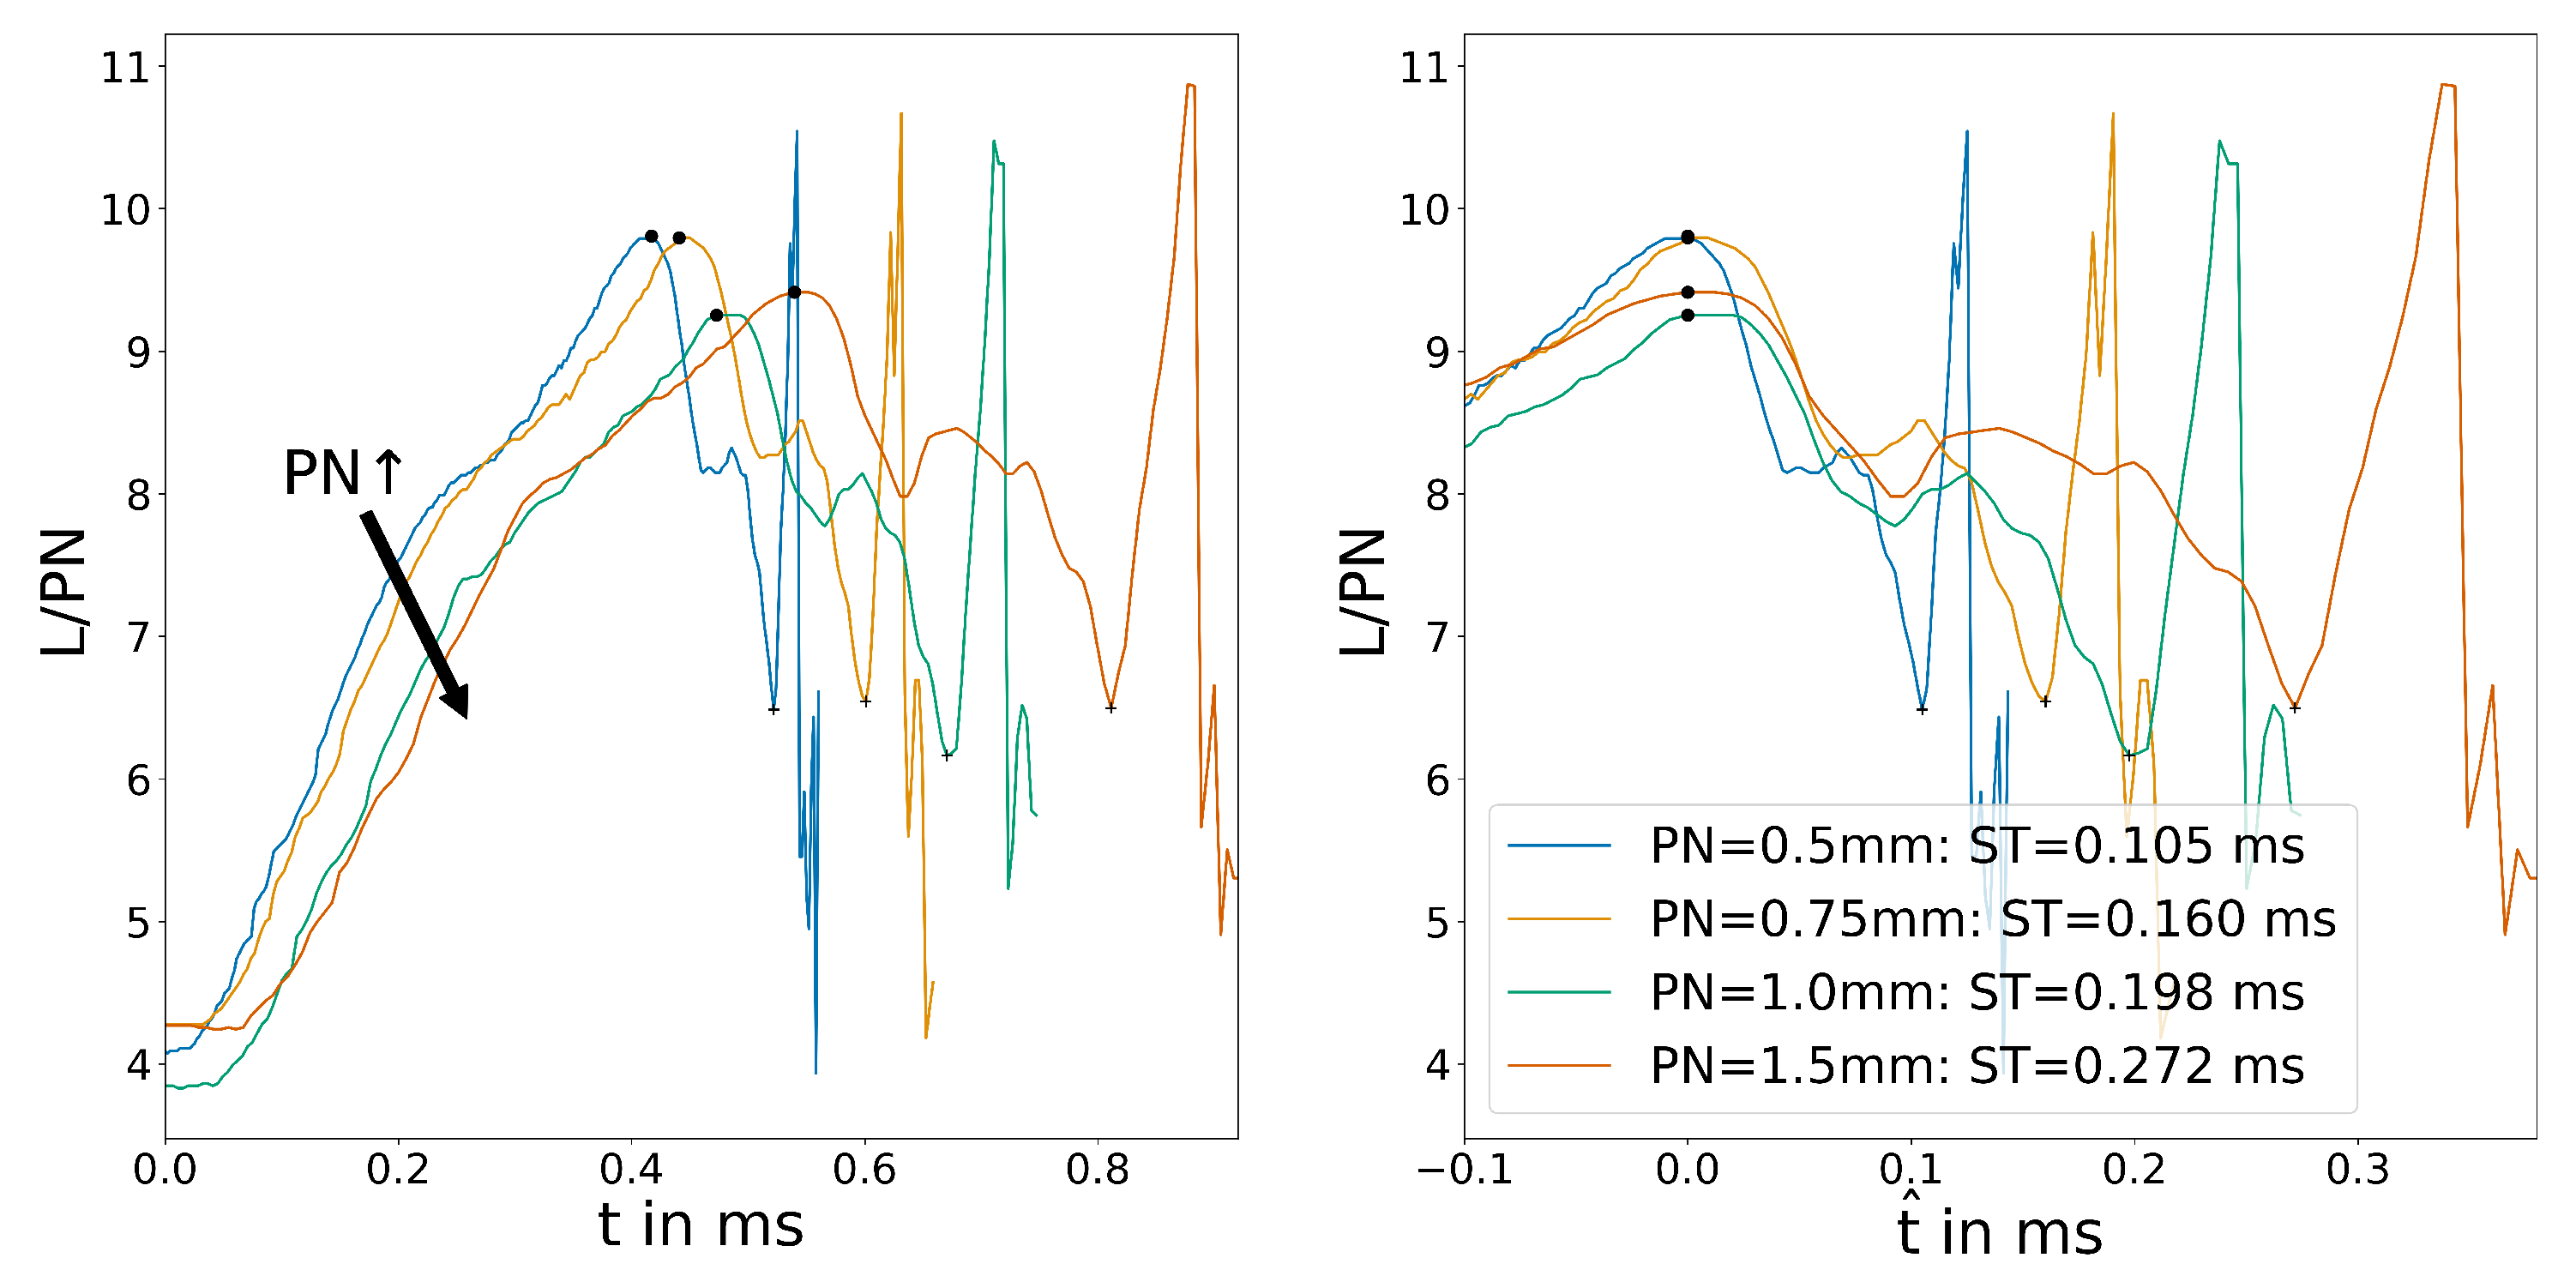
Lastly, the different nozzle diameter and, therefore, the different scales of the switches will be investigated. While the other parameters provided some challenges in the interpretation of the results, the pressure plot in Figure 11 shows a clear trend. With increasing scale of the fluidic transducer, the switching time changes according to the scaling quotient.
The wall shear stress plot in Figure 12 shows the same effect. Within a certain margin of error, the calculated switching times fit the scaling factors for the fluidic switch. The slight deviation in the time for the largest fluidic switch can be explained by smaller internal friction, resulting in slightly higher velocities. Additionally, the same amount of wall shear stress sample points were used for all sizes, resulting in a lower spatial resolution for the larger transducer. This might also affect the accuracy of the results.
5. Summary and Discussion of the Results
In this study parametric, CFD simulations were performed for a novel fluidic transducer based on bistable fluidic amplifier. The rhoCentralFoam solver of OpenFOAM was used and three different parameters were investigated. The results show the functionality of the bistable fluidic amplifier in supersonic flow conditions. It was observed that, with high control flows present during switching, the choked cross-section moves downstream between the attachment walls, resulting in a blockage of the input flow. This effect could be used as a trigger signal for the ultrasonic pulse generation by the transducer and was previously unknown to the authors. The parameters that were used during the study are , describing the velocity profile of the control flow, p describing the inlet pressure and describing the nozzle diameter and, therefore, the size of the complete system. Table 2 lists the achieved switching times.
For variation in , a mostly independent switching action was found. Small influences of the control flow overshoot were observed, which are an effect of the setup. For most industrially available valves, an independence can be assumed. Larger inlet pressures p resulted in different internal velocities that were also influenced by compressible effects and back pressure. The resulting switching times follow the initial assumption that higher pressure leads to lower switching times; however, the results showed neither a linear nor a square root relationship. Lastly, the variation in and, therefore, the scale of the amplifier were investigated. The results mostly match the initial assumption that larger switches have higher switching times. However, mm showed a slight deviation from the linear relationship of the other three sets. This is most likely an effect of the used setup and slightly higher velocity due to lower friction inside the Transducer.
6. Conclusions
The findings of this study have shown the utility that CFD can bring to the design of novel fluidic components. The resulting switching times, however, do not directly relate to the ultrasonic frequency created by the prototype shown in Figure 3. As described in Section 3.1.1, the numerical schemes employed can lead to inaccuracies in the simulation, especially in supersonic flows. Therefore, the results should be considered qualitately rather than quantatively. To further investigate the effects of the switching times, the acoustic field generation needs to be simulated as well. To this end, LES-simulations and a far-field reconstruction through the Lighthill- or Curle-analogy might provide a solution and be investigated in a later publication. Nonetheless, the study uncovered important facts for the future development of an ultrasonic fluidic transducer. Firstly, switching times are mostly independent of the used control flow slope, so inexpensive solenoid-based valves are an option for a later production system. Secondly, the uncovered increase in input pressure after switching might provide an inexpensive means of creating the necessary trigger signal for the ultrasonic pulse echo method. Lastly, scaling of the fluidic transducer influences the switching times according to the scale factor. Assuming the switching time is in any way connected to the generated frequency, simple scaling can provide a way to develop different transducers for higher and lower frequencies.
Author Contributions
Conceptualization, T.S.; methodology, T.S.; software, T.S. and M.H.; validation, T.S. and M.H.; formal analysis, T.S.; investigation, T.S., M.H. and B.B. (Benjamin Bühling); resources, T.S., B.B. (Bernhard Bobusch); data curation, T.S. and M.H.; writing—original draft preparation, T.S. and M.H.; writing—review and editing, T.S., M.H., B.B. (Benjamin Bühling); visualization, T.S. and M.H.; supervision, B.B. (Bernhard Bobusch); project administration, T.S., B.B. (Bernhard Bobusch); funding acquisition, B.B. (Bernhard Bobusch). All authors have read and agreed to the published version of the manuscript.
Funding
This research was funded by the German Federal Ministry of Economics and Technology (BMWi) under the ZIM (Zentrales Innovationsprogramm Mittelstand) grant ZF4044222WM7.
Institutional Review Board Statement
Not applicable.
Informed Consent Statement
Not applicable.
Conflicts of Interest
The authors declare no conflict of interest.
References
- BBC-News. Italy Bridge Collapse: Two Drivers Survive. 2020. Available online: https://www.bbc.com/news/world-europe-52213898 (accessed on 3 February 2021).
- Reuters. Lockdown Keeps Casualty Figure Low as Italian Bridge Collapses. 2020. Available online: http://www.theguardian.com/world/2020/apr/08/lockdown-keeps-casualty-figure-low-as-italian-bridge-collapses (accessed on 3 February 2021).
- BBC-News. Italy Bridge: Dozens Feared Dead in Genoa as Motorway Collapses. 2018. Available online: https://www.bbc.com/news/world-europe-45183624 (accessed on 3 February 2021).
- Krautkrämer, J.; Krautkrämer, H. Ultrasonic Testing of Materials; Springer Science & Business Media: Berlin, Germany, 2013. [Google Scholar]
- Pundit Ultrasonic Pulse Velocity, Ultrasonic Pulse Echo Tomography. Available online: https://www.proceq.com/compare/pundit-ultrasonic-pulse-velocity-and-pulse-echo-testing/ (accessed on 3 February 2021).
- Schickert, M.; Krause, M. Ultrasonic techniques for evaluation of reinforced concrete structures. In Non-Destructive Evaluation of Reinforced Concrete Structures; Elsevier: Amsterdam, The Netherlands, 2010; pp. 490–530. [Google Scholar] [CrossRef]
- USPC 4000 AirTech Hillger NDT GmbH. Available online: https://www.hillger-ndt.de/HauptseitenE/F-Luftultraschallt-e.html (accessed on 4 February 2021).
- SONOTEC-GmbH. SONOAIR®|R&D, SONOTEC GmbH. Available online: https://www.sonotec.eu/products/non-destructive-testing/air-coupled-ultrasonic-inspections/sonoair-research-and-development/ (accessed on 4 February 2021).
- Bühling, B.; Strangfeld, C.; Maack, S.; Schweitzer, T. Experimental analysis of the acoustic field of an ultrasonic pulse induced by a fluidic switch. JASA 2021. [Google Scholar] [CrossRef]
- Spyropoulos, C.E. A sonic oscillator. In Proceedings of the Fluid Amplification Symposium Vol III, Washington, DC, USA, 26–28 May 1964; Harry Diamond Laboratories, U.S. Army Materiel Command: Redstone Arsenal, AL, USA, 1964; pp. 27–52. [Google Scholar]
- Warren, R.W. Fluid Oscillator. U.S. Patent US3016066A, 9 January 1962. [Google Scholar]
- Bobusch, B.C. Fluidic Devices for Realizing the Shockless Explosion Combustion Process. Ph.D. Thesis, Technische Universität Berlin, Fakultät V, Verkehrs- und Maschinensysteme, Berlin, Germany, 2015. [Google Scholar] [CrossRef]
- Tesař, V. Fluidic Valves for Variable-Configuration Gas Treatment. Chem. Eng. Res. Des. 2005, 83, 1111–1121. [Google Scholar] [CrossRef] [Green Version]
- Tesař, V.; Zhong, S.; Rasheed, F. New Fluidic-Oscillator Concept for Flow-Separation Control. AIAA J. 2013, 51, 397–405. [Google Scholar] [CrossRef]
- Peng, J.M.; Yin, Q.L.; Li, G.l.; Liu, H.; Wang, W. The effect of actuator parameters on the critical flow velocity of a fluidic amplifier. Appl. Math. Model. 2013, 37, 7741–7751. [Google Scholar] [CrossRef]
- Roger, R.; Chan, S. Numerical study of fluidic bistable amplifiers. In Proceedings of the 33th AIAA Fluid Dynamics Conference and Exhibit, Orlando, FL, USA, 23–26 June 2003; American Institute of Aeronautics and Astronautics: Reston, VA, USA, 2003; p. 3459. [Google Scholar] [CrossRef]
- Kirshner, J.M. Design Theory of Fluidic Components; Academic Press: New York, NY, USA, 1975. [Google Scholar]
- Kirschner, J. Fluid Amplifiers; McGRAW-Hill Book Company: London, UK, 1966. [Google Scholar]
- Gregory, J.; Tomac, M.N. A review of fluidic oscillator development and application for flow control. In Proceedings of the 43th AIAA Fluid Dynamics Conferenc, San Diego, CA, USA, 24–27 June 2003. [Google Scholar] [CrossRef]
- Tesař, V. Pressure-Driven Microfluidics; Artech House Norwood: Norwood, MA, USA, 2007. [Google Scholar]
- Foster, K.; Parker, G.A. Fluidics: Components and Circuits; Wiley-Interscience: London, UK, 1970; ISBN 9780471267706. [Google Scholar]
- Raghu, S. Fluidic oscillators for flow control. Exp. Fluids 2013, 54, 1455. [Google Scholar] [CrossRef]
- Barton, P.T.; Obadia, B.; Drikakis, D. A conservative level-set based method for compressible solid/fluid problems on fixed grids. J. Comput. Phys. 2011, 230, 7867–7890. [Google Scholar] [CrossRef]
- Zółtak, J.; Drikakis, D. Hybrid upwind methods for the simulation of unsteady shock-wave diffraction over a cylinder. Comput. Methods Appl. Mech. Eng. 1998, 162, 165–185. [Google Scholar] [CrossRef]
- Harten, A. High resolution schemes for hyperbolic conservation laws. J. Comput. Phys. 1997, 135, 260–278. [Google Scholar] [CrossRef] [Green Version]
- Toro, E.F. Riemann Solvers and Numerical Methods for Fluid Dynamics: A Practical Introduction; Springer Science & Business Media: Berlin, Germany, 2013. [Google Scholar]
- Nessyahu, H.; Tadmor, E. Non-oscillatory central differencing for hyperbolic conservation laws. J. Comput. Phys. 1990, 87, 408–463. [Google Scholar] [CrossRef] [Green Version]
- Lax, P.D. Weak solutions of nonlinear hyperbolic equations and their numerical computation. Commun. Pure Appl. Math. 1954, 7, 159–193. [Google Scholar] [CrossRef]
- Kurganov, A.; Tadmor, E. New high-resolution central schemes for nonlinear conservation laws and convection—Diffusion equations. J. Comput. Phys. 2000, 160, 241–282. [Google Scholar] [CrossRef] [Green Version]
- Marcantoni, L.F.G.; Tamagno, J.P.; Elaskar, S.A. High speed flow simulation using openfoam. Mech. Comput. 2012, 31, 2939–2959. [Google Scholar]
- Menter, F.R.; Kuntz, M.; Langtry, R. Ten years of industrial experience with the SST turbulence model. Turbul. Heat Mass Transf. 2003, 4, 625–632. [Google Scholar]
- Aneja, G. An Engineering Analysis of Fluid Amplifiers and Development of an Air Velocity Sensor. Master’s Theses, Missouri University of Science and Technology, Rolla, MO, USA, 1972. [Google Scholar]
- Lush, P.A. Investigation of the switching mechanism in a large scale model of a turbulen reattachment amplifier. In Proceedings of the Second Cranfield Fluidics Conference, Cambridge, UK, 3–5 January 1967. [Google Scholar]
Figure 1.
The bistable fluidic amplifier used in the design of the transducer with dimensions in mm.
Figure 1.
The bistable fluidic amplifier used in the design of the transducer with dimensions in mm.

Figure 2.
Initial protoype of the fluidic transducer made from brass.

Figure 3.
Time series of the sound pressure and power density spectrum (PSD) measured with the inital prototype.
Figure 3.
Time series of the sound pressure and power density spectrum (PSD) measured with the inital prototype.

Figure 4.
2D unstructured Mesh for the parametric simulation with 355.432 nodes and data probes for the evaluation.
Figure 4.
2D unstructured Mesh for the parametric simulation with 355.432 nodes and data probes for the evaluation.

Figure 5.
Supersonic simulation of the bistable fluidic amplifier (a–f): (a) stable condition lower output channel (b) increasing port flow → growing recirculation bubble (c) main jet hitting the splitter structure, jet start to attach to the upper attachment wall (d) jet fully switched, dissipation of the recirculation bubble (e) stable condition upper channel with maximum control flow (f) stable condition upper channel without control flow.

Figure 6.
(Left) control flow velocity slopes for the parametric simulation, (right) averaged velocity in the output channel for variations of .
Figure 6.
(Left) control flow velocity slopes for the parametric simulation, (right) averaged velocity in the output channel for variations of .

Figure 7.
Averaged outlet channel pressure for the variation of .

Figure 8.
Position of the reattachment point determined by wall shear stress for the variation of .

Figure 9.
Averaged outlet channel pressure for the variation of .

Figure 10.
Position of the reattachment point determined by wall shear stress for the variation of p.
Figure 10.
Position of the reattachment point determined by wall shear stress for the variation of p.

Figure 11.
Averaged outlet channel pressure for the variation of .

Figure 12.
Position of the reattachment point determined by wall shear stress for the variation of .
Figure 12.
Position of the reattachment point determined by wall shear stress for the variation of .


Table 1.
Variations for the parametric simulations. Baseline values are printed in bold letters.
| Control Flow Slope | Pressure p | Power Nozzle Size |
|---|---|---|
| 0.4 ms | 1.0 bar | 0.50 mm |
| 0.8 ms | 1.4 bar | 0.75 mm |
| 1.6 ms | 1.8 bar | 1.00 mm |
| 3.2 ms | 2.2 bar | 1.50 mm |
Table 2.
Results of the parametric simulations. Baseline values are printed in bold letters.
| Control Flow Slope | Switching Time—Recirculation Bubble | Difference |
|---|---|---|
| 0.4 ms | 0.175 ms | −9.8% |
| 0.8 ms | 0.194 ms | 0% |
| 1.6 ms | 0.211 ms | +8.8% |
| 3.2 ms | 0.221 ms | +13.9% |
| Pressure p | Switching Time—Recirculation Bubble | Difference |
| 1,0 bar | 0.275 ms | +44.7% |
| 1.4 bar | 0.199 ms | +4.7% |
| 1.8 bar | 0.190 ms | 0% |
| 2.2 bar | 0.177 ms | −6.8% |
| Power Nozzle Size | Switching Time—Recirculation Bubble | Difference |
| 0.50 mm | 0.105 ms | −46.9% |
| 0.75 mm | 0.160 ms | −19.2% |
| 1.00 mm | 0.198 ms | 0% |
| 1.50 mm | 0.272 ms | +37.3% |
Publisher’s Note: MDPI stays neutral with regard to jurisdictional claims in published maps and institutional affiliations. |
© 2021 by the authors. Licensee MDPI, Basel, Switzerland. This article is an open access article distributed under the terms and conditions of the Creative Commons Attribution (CC BY) license (https://creativecommons.org/licenses/by/4.0/).
Share and Cite
MDPI and ACS Style
Schweitzer, T.; Hörmann, M.; Bühling, B.; Bobusch, B. Switching Action of a Bistable Fluidic Amplifier for Ultrasonic Testing. Fluids 2021, 6, 171. https://0-doi-org.brum.beds.ac.uk/10.3390/fluids6050171
AMA Style
Schweitzer T, Hörmann M, Bühling B, Bobusch B. Switching Action of a Bistable Fluidic Amplifier for Ultrasonic Testing. Fluids. 2021; 6(5):171. https://0-doi-org.brum.beds.ac.uk/10.3390/fluids6050171
Chicago/Turabian StyleSchweitzer, Thorge, Marla Hörmann, Benjamin Bühling, and Bernhard Bobusch. 2021. "Switching Action of a Bistable Fluidic Amplifier for Ultrasonic Testing" Fluids 6, no. 5: 171. https://0-doi-org.brum.beds.ac.uk/10.3390/fluids6050171