
Rheological Characterization of a Concentrated Phosphate Slurry
by

Souhail Maazioui
1,2,3,*, 
Abderrahim Maazouz
4,
Fayssal Benkhaldoun
3,
Driss Ouazar
2 and
Khalid Lamnawar
4
1
Modeling Simulation & Data Analysis (MSDA), Mohammed VI Polytechnic University, Lot 660-Hay Moulay Rachid, Benguerir 43150, Morocco
2
Civil engineering Department, LASH Ecole Mohammadia d’Ingénieurs, Mohammed V University, Rabat 10050, Morocco
3
LAGA, Sorbonne Paris Cité, Université Sorbonne Paris Nord, UMR 7539 Villetaneuse, France
4
IMP, Université de Lyon, INSA Lyon, CNRS, UMR 5223, Ingénierie des Matériaux Polymères, F-69621 Villeurbanne, France
*
Author to whom correspondence should be addressed.
Fluids 2021, 6(5), 178; https://0-doi-org.brum.beds.ac.uk/10.3390/fluids6050178
Submission received: 7 March 2021
/
Revised: 29 March 2021
/
Accepted: 1 April 2021
/
Published: 2 May 2021
(This article belongs to the Collection Non-Newtonian Fluid Mechanics)
Abstract
:Phosphate ore slurry is a suspension of insoluble particles of phosphate rock, the primary raw material for fertilizer and phosphoric acid, in a continuous phase of water. This suspension has a non-Newtonian flow behavior and exhibits yield stress as the shear rate tends toward zero. The suspended particles in the present study were assumed to be noncolloidal. Various grades and phosphate ore concentrations were chosen for this rheological investigation. We created some experimental protocols to determine the main characteristics of these complex fluids and established relevant rheological models with a view to simulate the numerical flow in a cylindrical pipeline. Rheograms of these slurries were obtained using a rotational rheometer and were accurately modeled with commonly used yield-pseudoplastic models. The results show that the concentration of solids in a solid–liquid mixture could be increased while maintaining a desired apparent viscosity. Finally, the design equations for the laminar pipe flow of yield pseudoplastics were investigated to highlight the role of rheological studies in this context.
1. Introduction
Phosphate slurry pipelines have been shown to be an appropriate mode of transport for phosphate ore in terms of energy use and the generated emissions [1]. Since phosphate rock is known to be insoluble, it cannot be used directly as a fertilizer. Consequently, it is normally processed in a wet-process phosphoric acid (WPA) plant [2]. Transporting wet phosphate from the washing plants over the pipeline is a more rational way to use water and energy resources, as no drying at the mine is required and the slurry can simply be driven down the pipeline by gravity.
Phosphate ore is found in sub-horizontal beds as sedimentary deposits with high phosphorus (P) concentrations of up to 30% alongside limestone, marls, and clays. In addition to potassium and nitrogen, phosphorus plays a crucial role in biological processes and is an essential constituent of all living matter, in both its animal and plant forms. Phosphate minerals are, therefore, raw materials for agricultural fertilizers [3]. Mining is accomplished by removing the overburden, followed by the extraction of phosphate ore for processing [4]. Right after excavation, the phosphate is separated from the unwanted sand and clay minerals in a washing plant [5]. Then, the ore is mixed with water, turned into pulp, and the resulting slurry is transported through pipes to a chemical processing plant where it is mixed with sulfuric acid to produce phosphoric acid [6].
The motivation for this rheological study was triggered by evidence that indicates that the transport characteristics and processing of phosphate ore slurry is heavily dependent on its rheological properties. Deep knowledge of the rheological behavior is therefore essential, particularly when transporting a large amount of slurry. It has been shown that when designing a pipeline, prediction of the flow regime (laminar or turbulent) and the head loss cannot be done properly without a rigorous understanding of the rheology [7].
The rheology of a material is usually described using a constitutive equation that relates the applied shear stress τ to the resulting shear rate . The main objective of such a study is to predict the flow that would appear in a given piece of equipment under the action of applied forces. A highly viscous liquid requires more power to be pumped than one with a low viscosity. Knowledge of a material’s rheological behavior is therefore useful when controlling pumping and piping systems [8,9].
Obtaining suspensions of particles in a fluid matrix is challenging and complex, and numerous investigations of particle rheology can be found in the literature. As reported in prior studies, concentrated suspensions may exhibit shear-thickening or shear-thinning behaviors (with or without a yield point), irreversibility under oscillating shear, and many other complex performances [10,11]. At high solids loadings (>25% by volume), observations of the rapid growth in the apparent viscosity, , and an increase in the non-Newtonian behavior (particularly shear-thinning), with Newtonian limiting behavior at both low and high shear rates, are reported in several articles [10,11,12,13,14]. In piping systems, a shear-thinning slurry is often desired since the viscosity of the mixture can be reduced by increasing the shear rate, making the pumping more efficient. In most suspensions, the important physical properties that affect the rheology include a solid volume fraction, the particle size and shape, and the mechanical and physical interactions between particles and the fluid matrix.
Particles in a liquid matrix can be considered as obstacles, hindering the liquid’s flow and, therefore, increasing the flow resistance, i.e., the viscosity. The mechanics of dilute and semi-dilute suspensions representing very low particle concentrations (volume fraction < 25%) are well understood. Simple models for describing the increased viscosity at a given shear rate (or apparent viscosity) have been proposed by Einstein [15] and Batchelor [16]. Their formulas were adapted to monodisperse particles for maximum solid volume fractions of 0.15 to 0.25 and link the increase in bulk viscosity of the suspension η to the viscosity of the liquid η0, as well as the solid fraction in the suspension. However, linearity is restricted to low solid fractions ϕ. For dense or highly concentrated suspensions, the apparent relative viscosity () increases rapidly and without bound with ϕ. At a large solid fraction, small changes in concentration lead to large variations in viscosity. If nonhydrodynamic interparticle forces are absent, suspensions with a high solid fraction can be described with the satisfactory model of Krieger and Dougherty [17], which is valid for low and high shear rates. This model requires an additional input parameter, defined as the maximum packing fraction of particles, which is related to the particles’ properties. Physically, refers to the maximum solid fraction possible in suspension for a given particle size distribution and packing arrangement [18,19]. Many other functions have been proposed and provide excellent fits to experimental data [11,20,21].
Dense particulate suspensions often display a variety of non-Newtonian flow properties, including shear thinning, shear thickening, and reversible, shear-induced solidification called shear jamming. Recently, it has been shown that interparticle friction drastically influences this behavior. Shear jamming (SJ) is a phenomenon where a suspension is fluid-like at low stresses and jams into a solid-like state at high shear. This shear-induced solidification occurs at particle concentrations below the traditional, frictionless jamming packing fraction [22,23,24,25,26].
With an increased solid volume fraction , the apparent viscosity η increases but this increase is not the same for different maximum packing fractions . In fact, the rate of the viscosity increase depends on the ratio . The most important factors affecting the maximum packing fraction are the shape and size distribution of the particles. Since smaller particles can fit into the voids created by larger ones, the maximum packing fraction of polydispersed particles is significantly higher than in monodispersed particle systems [18,19,27]. Many experiments with bidisperse and polydisperse suspensions have been conducted to establish a relationship between and the suspension viscosity [11,12,28,29]. In general, these studies showed that the apparent viscosity tends to decrease when increasing the maximum packing fraction at a constant volume fraction . This indicates that the concentration of solids in a solid–liquid mixture can be raised markedly while maintaining a desired apparent viscosity.
At a constant solid fraction, a reduction in particle size leads to an increase in apparent viscosity. With smaller particle sizes, the total surface area becomes larger, which binds to water molecules and results in a higher number of particles in a given volume. When the volume fraction increases, interactions between particles become significant, particularly for very small particles, thus substantially raising the applied force required to shear the sample. For larger particles that are fewer in number, the effect of particle–particle interactions is considerably reduced [30,31]. However, for most real suspensions used in industry and mineral processing, the particle size is not uniform and is more conveniently described as a particle size distribution. Under small shear stress, Brownian motion dominates the behavior of the finest particles, while for coarse particles, frictional contacts or hydrodynamic forces tend to dominate [11,32].
In this study, we seek to investigate the rheological behavior of phosphate suspension with the aim of optimizing their dispersity and stability throughout future research works. Regarding this concern, a few studies on phosphate composites have been conducted for diverse applications. An early study by Bujake [33] investigated the effect of additives on the rheological and sedimentation behavior of a phosphate slurry. He suggested that particle–particle interactions play an important role in the flow of these systems. Benretem et al. [34] stated that the rheological characteristics of water–phosphate slurries strongly depend on the solids concentration and increase markedly with decreasing particle size. In a comparable study, Belbsir et al. [35] drew similar conclusions and showed that viscosity tends to decrease with increasing temperatures and can also be reduced using appropriate additives. In a more recent study, Shaikh [36] reported the fabrication of a geopolymer of phosphate ore and polypropylene. He found that the composites of smaller phosphate ore particles displayed a highly complex viscosity. Since the transported slurry has a continuous particle size distribution, it is important to discriminate the role of this distribution in the process. Thus, in this work, we put our attention toward the influence of the D-value ratio on apparent viscosity, as well as the solid concentrations. The following sections present some basic information about the experimental work and the methodology carried out to provide a description of the non-Newtonian behavior that is typically exhibited by concentrated phosphate slurries. The main objective of this study was to evaluate the predictive or fitting capabilities of commonly used yield-pseudoplastic models for the rheological data description of concentrated phosphate slurries. The rheological parameters for the Bingham, Casson, Herschel–Bulkley, and Robertson–Stiff models were computed for six samples. A variety of samples with phosphate ore concentrations ranging from 51 to 56 wt.% in water, i.e., 29 to 33% v/v, were employed for this rheological study. These slurries with relatively coarse particles are a representation of what is typically found in phosphate rock processing. The rheological models were used to obtain analytical expressions relating the mean flow velocity to the pressure drop and to determine velocity profiles in the laminar regime.
2. Materials and Methods
2.1. Concentrated Phosphate Slurry Samples
Phosphate rock is mined at different locations and then processed to be stored in agitated tanks at the main slurry pipeline head station. The solid particles in the present study were provided by OCP (Khouribga, Morocco). The samples prepared at our laboratory were a mixture containing rigid randomly shaped solid particles with an equivalent spherical diameter ranging from 1 to 500 µm. The particle density was 2.4 t/m3 when the pores were filled with air and 2.6 t/m3 when the pores were filled with water and stabilized by a specific soluble polymer, such as PEG. Various grades and phosphate ore concentrations of 51, 54, and 56 wt.% in water were used for this rheological study. These samples, labeled S1 through S6, differed mainly in their solids concentrations and particle size distributions.
The main ingredients of the concentrated phosphate slurry (CPS) samples were CaO and P2O5, even though they also contained other elements, such as SiO2, CO2, Fe, MgO, SO3, and Al2O3. The phosphate content of phosphorite P2O5 is often expressed as a percentage of bone phosphate of lime (BPL) [37]. Table 1 summarizes the elemental concentrations of each sample. The samples have a similar composition that can be considered a representation of what is specifically mined in Morocco. Phosphorite deposit compositions may differ from one location to another.
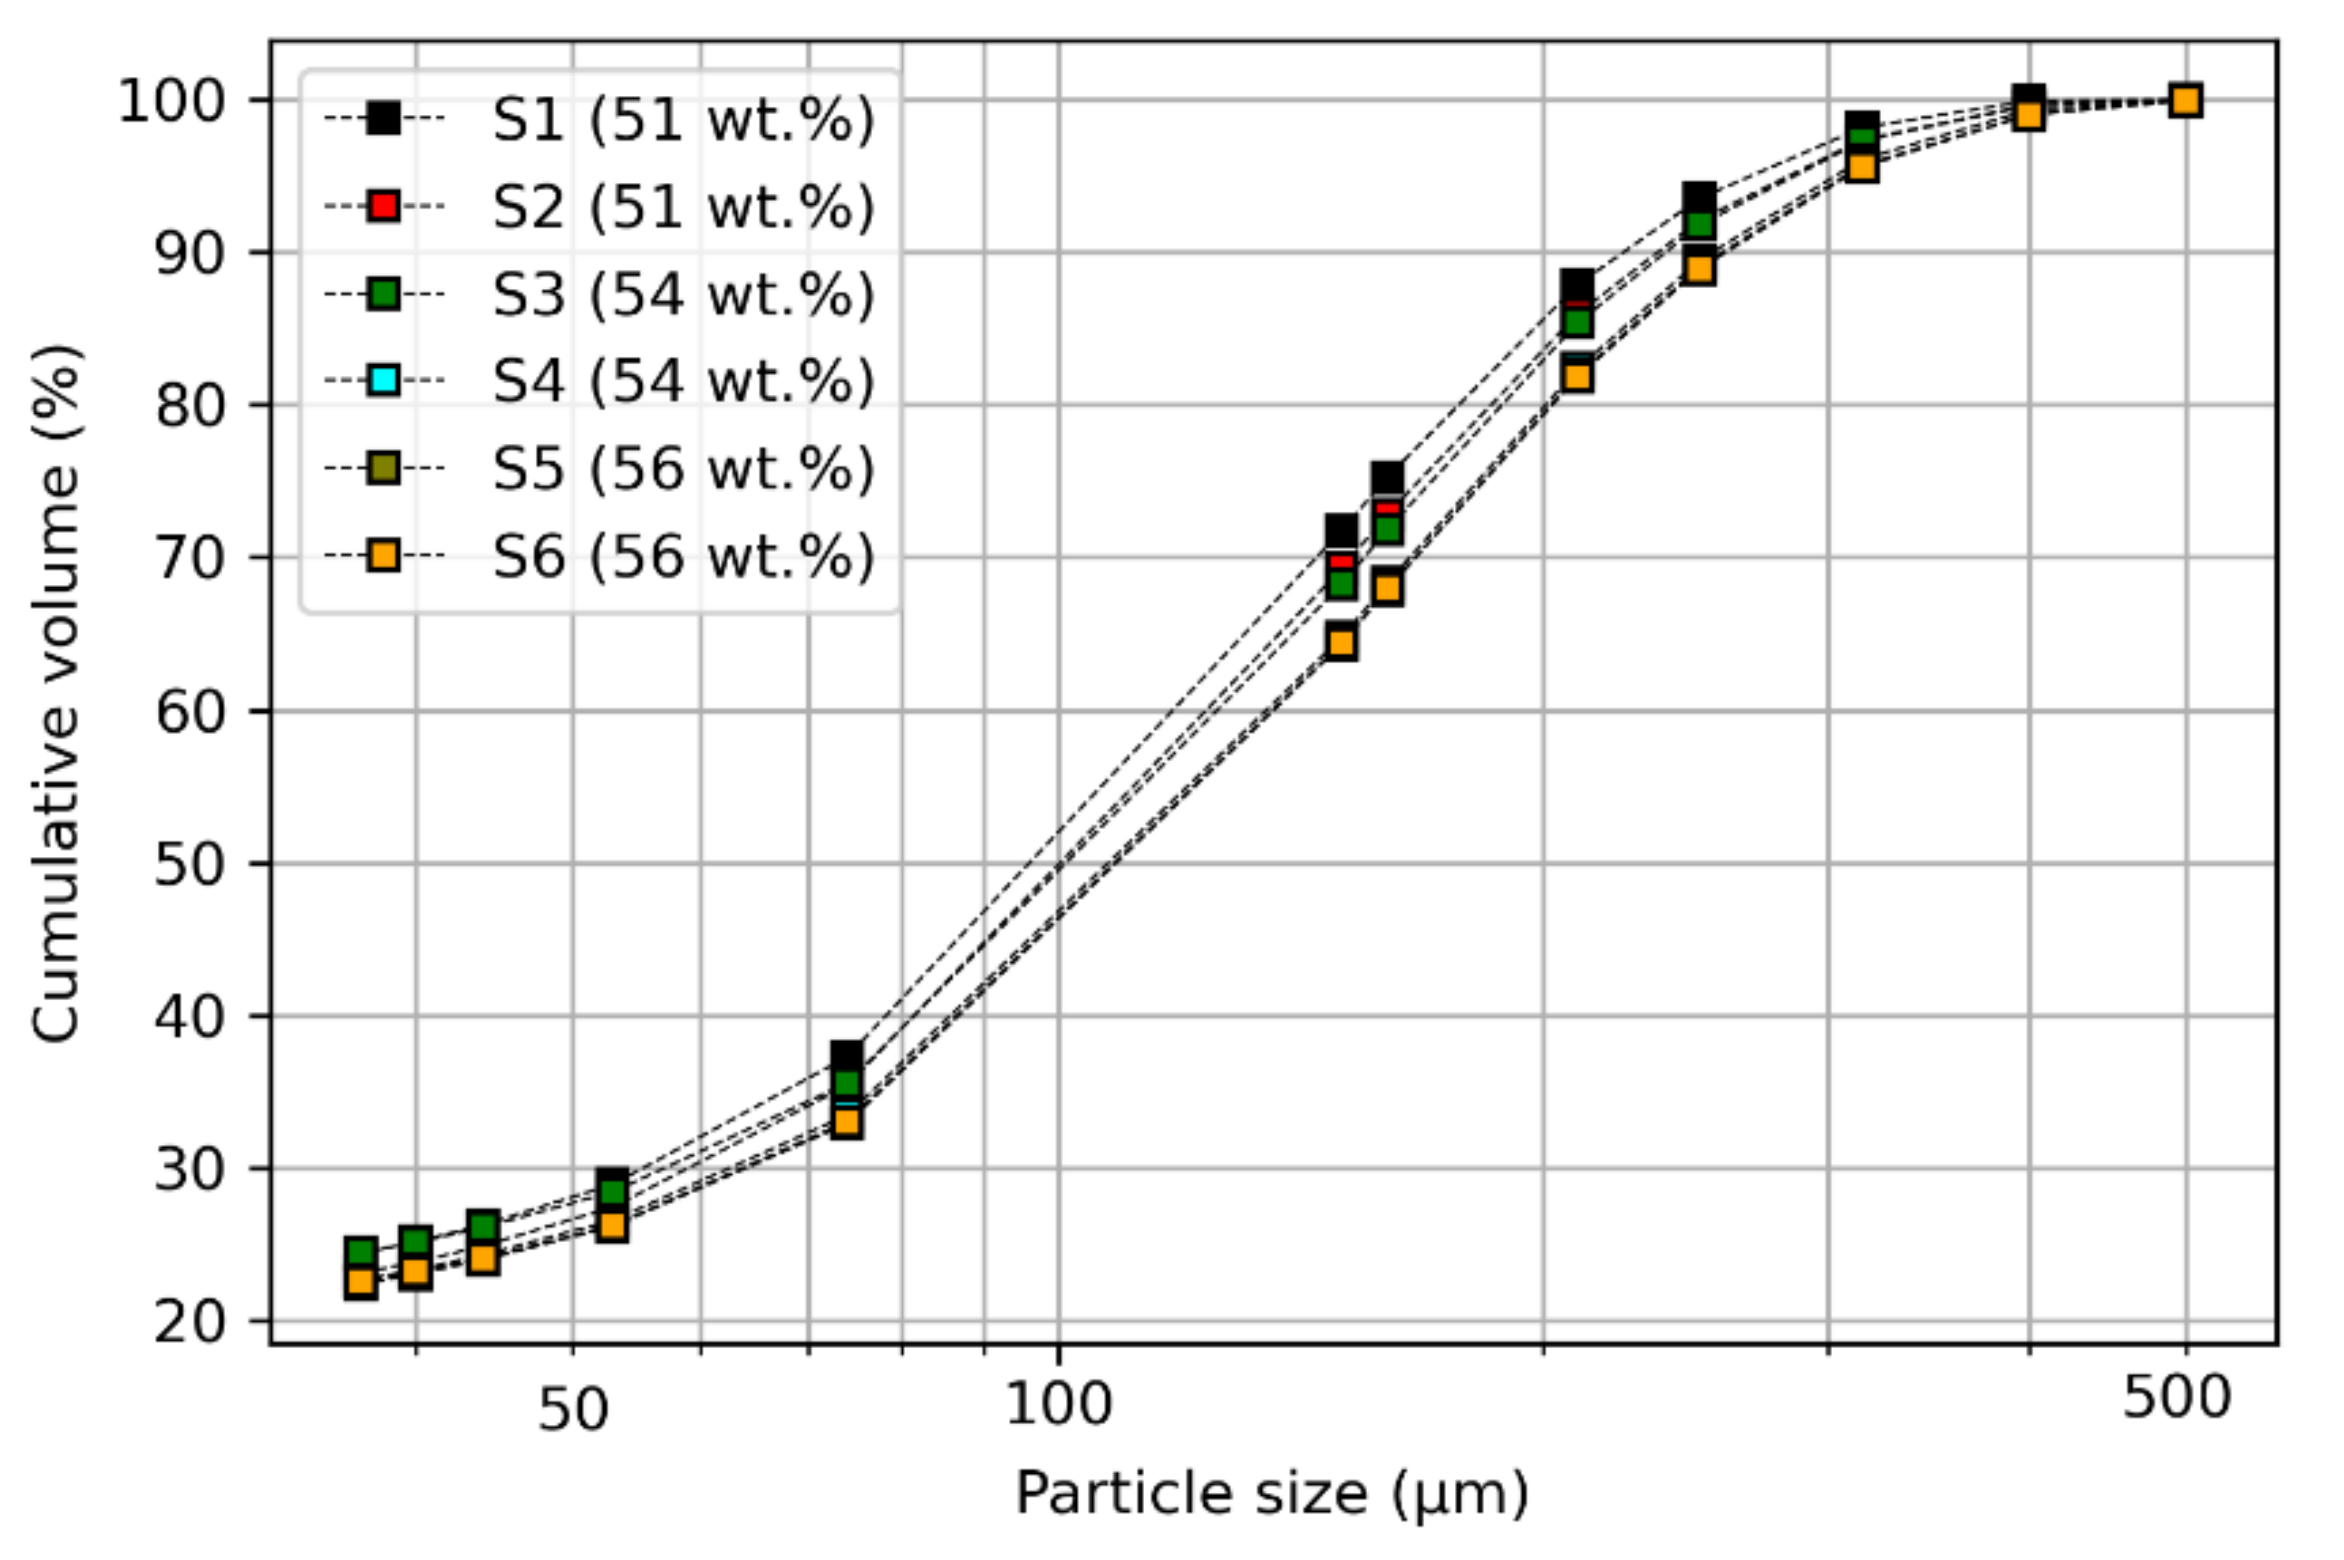
The analysis of the particle size distribution provides essential data for forecasting the slurry behavior in the transport process or its physical properties. Measurements were carried out for each sample using a Mastersizer 3000 granulometer from Malvern (Worcestershire, UK). The analysis of the particles’ size distribution allowed us to define the percentage of the total volume in each sample containing particles with diameters less than the following values: 500 µm, 400 µm, 315 µm, 250 µm, 150 µm, 74 µm, 44 µm, 40 µm, and 37 µm. The most commonly used metrics when describing particle size distributions are the D-values: D20, D50, and D80, which are the intercepts for, respectively, 20%, 50%, and 80% of the cumulative mass. Although a comparison of D50 and D80 values indicated little difference between the samples, the D20 values were dissimilar. The particle sizes in the CPS samples ranged from around 1 µm to 500 µm, where the cumulative particle size distribution of all CPS samples is shown in Figure 1.
2.2. Suspension Characteristics
The suspended particles in the present study were assumed to be noncolloidal, which means that Brownian motion in the suspensions could be neglected. The interaction of the forces describing the rheophysical properties of the suspensions can be defined using nondimensional numbers that were first defined by Krieger (1959). In particular, the impact of Brownian motion is governed by the Peclet number, Pe, which is defined as the ratio of the hydrodynamic force and the Brownian force [10,21]:
where is the suspending fluid viscosity, a is the average radius of particles, is the shear rate, k = 1.38 × 10⁻²³ J K−1 is the Boltzmann constant, and T is the absolute temperature. For Pe > 103, hydrodynamic forces dominate [10,21]. The relative importance of inertial forces at the particle scale is governed by the particles’ Reynolds number Rep, which is given by:
where is the density of the suspending liquid. For Rep > 10−3, inertial forces cannot be neglected [10,11]. Thus, for low shear rates in this work, the suspended particles were strongly influenced by inertial forces.
2.3. Experimental Data
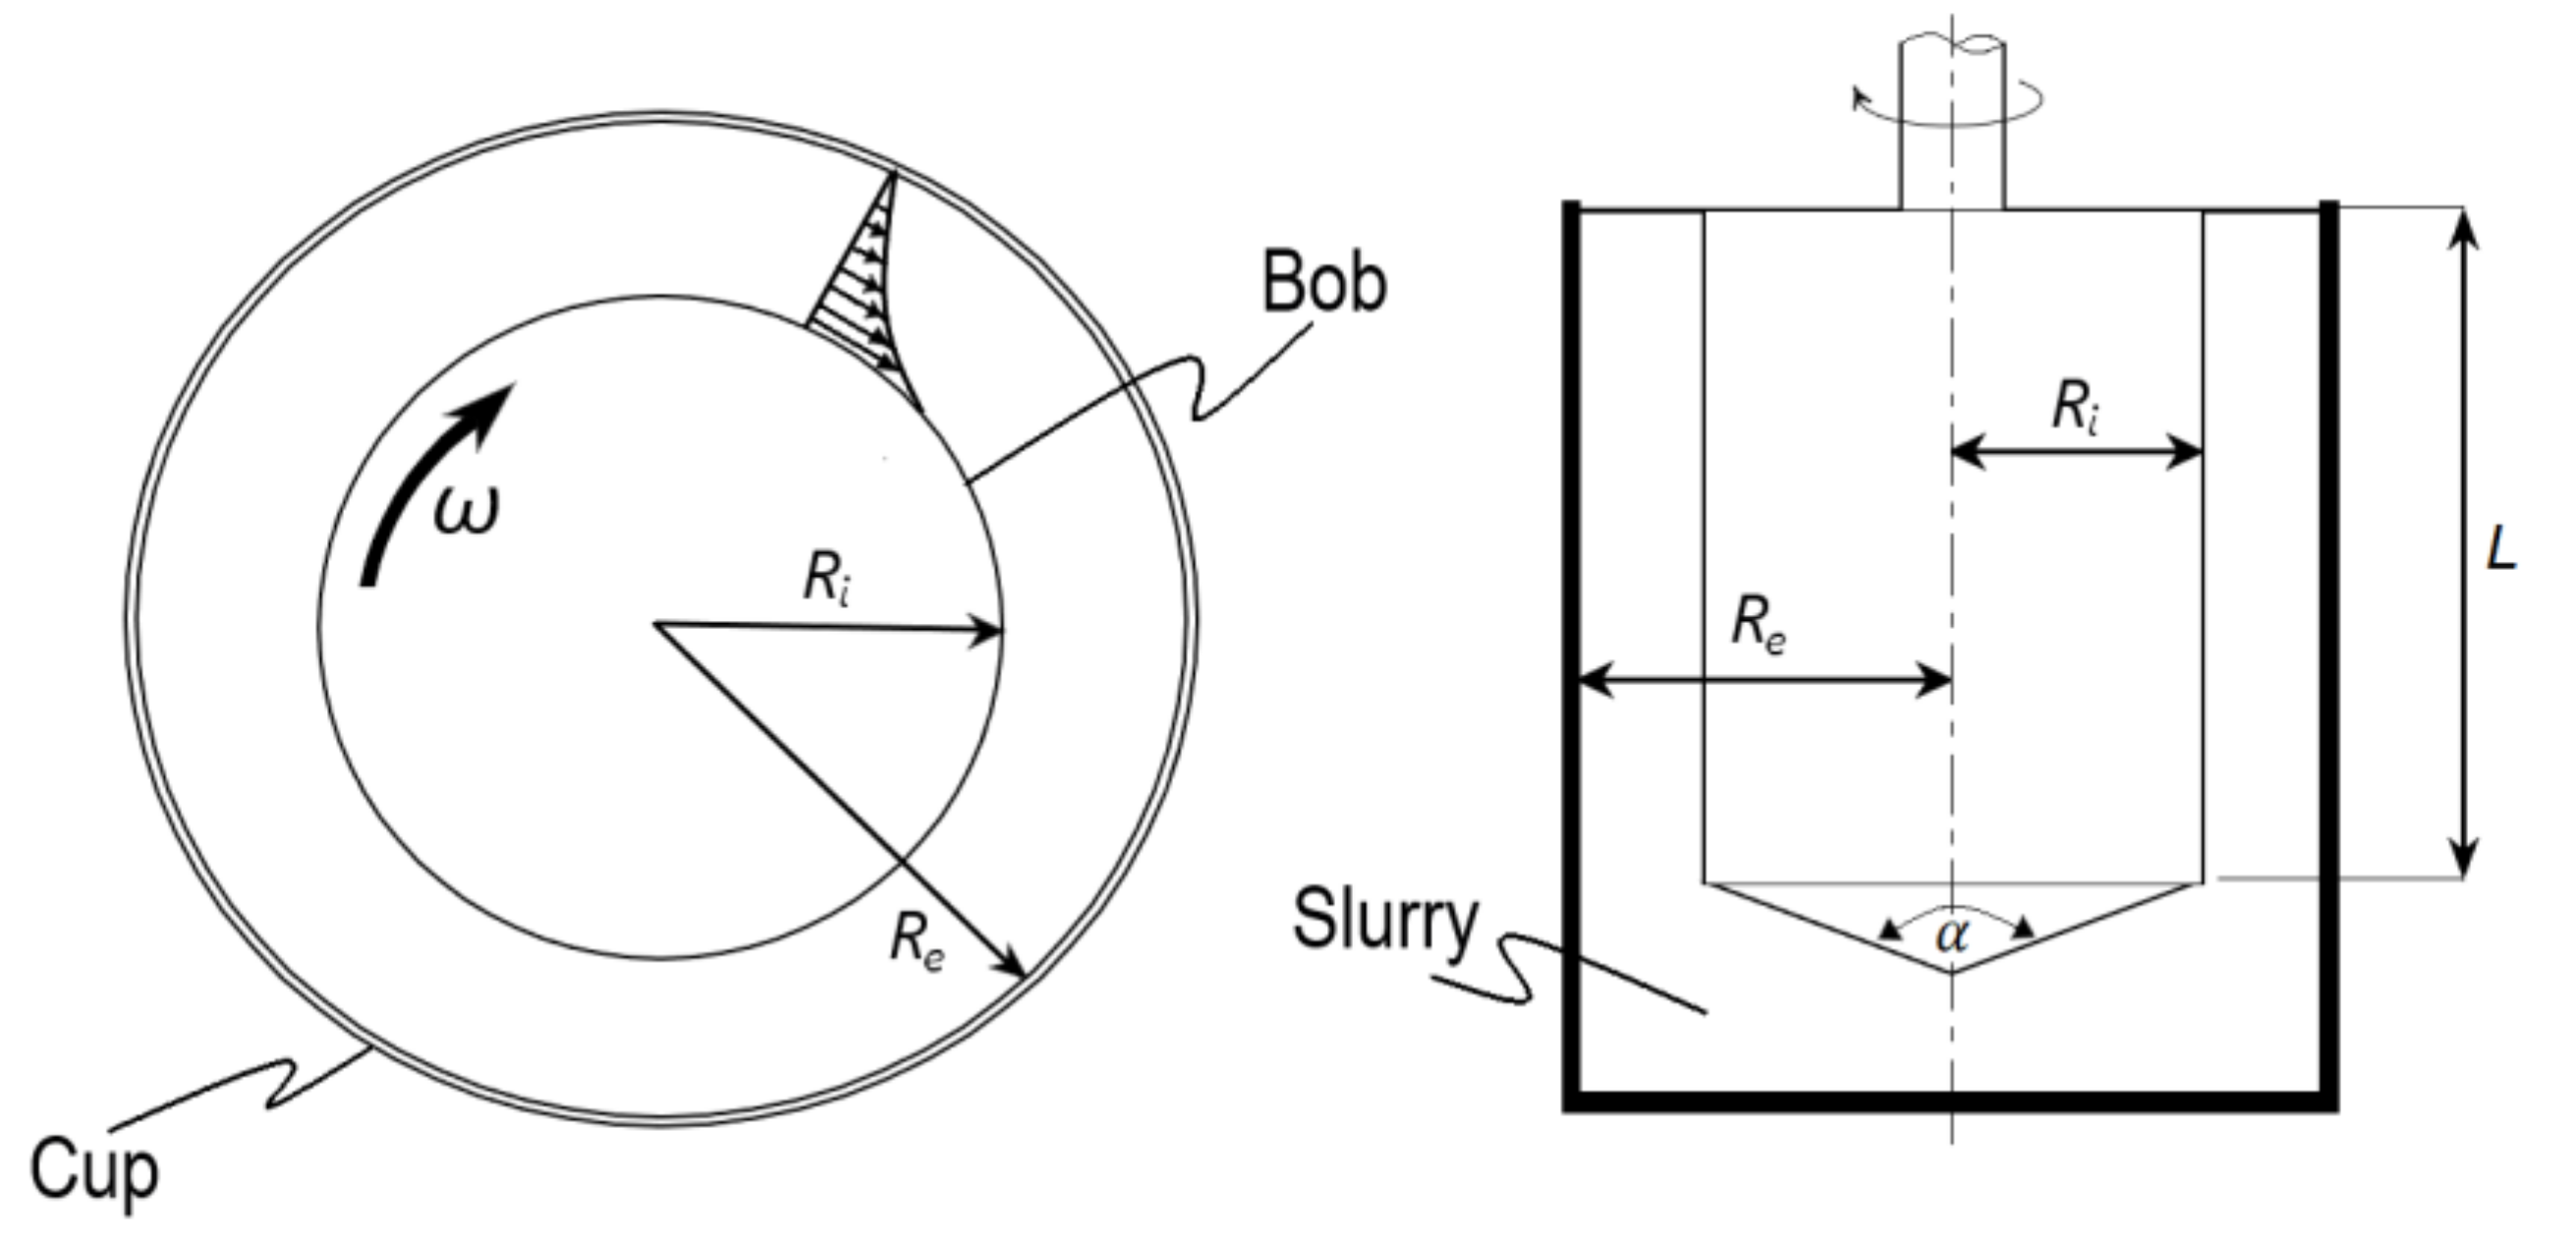
The shear rheology of the slurry was measured using a RheolabQC rotational rheometer from Anton Paar (Ostfildern, Germany) with a concentric cylinder geometry, where the inner and outer cylinders represented, respectively, the test bob and cup (see Figure 2). This device uses the Searle principle with a rotating inner cylinder and stationary outer cylinder and can measure the dynamic viscosity of low-viscosity samples up to semi-solid specimens [38,39]. The Searle system is the most commonly used system for mineral pulps. Coaxial (or concentric) cylinder systems are absolute measuring systems that conform to “Deutsches Institut für Normung” (DIN) and the international standards organization (ISO) standards. Measuring the rotational speed of the electronically communicated (EC) motor and produced torque M allowed us to calculate the shear stress and the shear rate according to the following relationships (standard: ISO 3219 [40] (δ ≤ 1.2)):
where = Re/Ri is the ratio of the outer cylinder and inner cylinder radii (Re and Ri, respectively), L is the bob length, and CL = 1.28 is an end effect correction factor. The rheological behavior of the CPS samples was determined by measuring the shear stress at various applied shear rates. The shear stresses were measured at each point while decreasing the shear rate from 1000 s−1 to 112 s−1 using a coaxial geometry with a rotating cylinder and a cylindrical cup, with diameters of 38.713 mm and 44 mm, respectively. The estimated shear rate range occurring during the transport process was 200 to 600 s−1, which is well within the shear rate range tested. The fixed distance between the two measuring cylinders was 2.644 mm. The experiments were conducted at controlled shear rates in the same range as those expected in pipe flows. The experimental data of the CPS samples were obtained at room temperature. For each measurement, the suspensions were vigorously mixed in a container beforehand. A pre-shear is required to erase material memory and to have similar initial conditions for all samples. Then, after prolonged mixing (>30 s), the necessary volume was quickly poured into the outer cylinder. The inner cylinder was subsequently immersed into the slurry. The stress exerted on this cylinder was recorded as a function of the shear rate The rotational tests were carried out in a preset shear rate ramp mode, descending in steps, while recording the shear stress for each set shear rate. In order to allow the sample to adapt itself to each shear rate step, a duration of three seconds was maintained for each measuring point. It is important to note that the chosen Couette geometry (Figure 2) with the adapted gap allowed us to assume that we would not observe common sudden changes in the rheogram plots at high shear rates and in the ranges of the yield-stress calculations. We intended for the applied pre-shear and the preset shear rate ramp mode to allow for homogenized suspensions and, hence, we could assume their homogeneity. Furthermore, we had other work in progress using a helical geometry and our calculated yield stress seemed to corroborate with those obtained using our adapted geometry and procedure.
The density of the solid particles was higher than that of water, and the settling experiments performed on a mixture of water with 10 vol.% of particles with sizes between 100 and 500 µm revealed small settling velocities. As a result, the effects of the particle settling on the sample concentration were negligible during the performed experiments (less than one minute).
2.4. Rheological Models
Phosphate ore slurry is a suspension of insoluble particles in a continuous phase of water. This suspension displays non-Newtonian flow behavior and exhibits yield stress as the shear rate tends toward zero. These materials only flow due to a certain constraint called the yield stress . Below this stress, they behave like solids, while above this stress, they may flow like a Newtonian fluid or exhibit shear-thinning. Knowledge about the yield stress is essential for transporting suspensions, especially for resuspending particles after they have settled in a pipeline or channel. This property is found in certain polymer solutions and very concentrated suspensions, and in everyday life with toothpaste, yogurt, ketchup, clays (laponite and bentonite, for example), and drilling muds. This behavior can be interpreted as a presence of aggregates in the material that remains up to the yield stress. However, some authors find the idea of yield stress controversial [41] and doubt whether true yield stress actually exists. The main reason for this debate and discussion in the literature is that no equipment has so far allowed researchers to measure the shear stress at very low shear rates without being affected by wall-slip or end effects. For further reading, we refer to the work by Coussot et al. [42].
For Newtonian fluids, most pure liquids, and gases, shear stress is a linear relation with respect to the shear rate:
where the constant of proportionality µ is known as the viscosity of the fluid. Non-Newtonian materials, suspensions of solids, polymer solutions, and polymer melts exhibit a different response, for which an apparent viscosity η is often assigned:
The simplest representation of such complex fluids is the Bingham model, which gives the following relationship between the shear stress and shear rate:
where is the yield stress and ηB is the constant plastic viscosity. This model has the advantage of giving a linear relationship after an initial yield and defining the minimum stress value at which the material starts to flow, which is also referred to as the Bingham yield point . However, recent studies show that this model fails to conform to complex fluid behavior at low shear rates [43] and may result in unrealistically high values of [44].
A general form of the Bingham model, proposed by Herschel and Bulkley [45], is used to describe the flow of pseudoplastic fluids, which require yield stress to initiate the flow and then exhibit a nonlinear flow curve. The Herschel–Bulkley model can describe the rheological behavior of mineral slurries [46,47]. Other investigations have shown that this model can also describe sludge behavior and is most commonly used to characterize concentrated sludge [15,48], as well as most drilling fluids or cement slurries [14,49]. The Herschel–Bulkley model can be used with the constitutive equation:
where the yield stress in this equation represents the intercept of the line fitting the yield stress region, K is the consistency index, and n is the flow index. With the use of the third parameter, this model often provides a better fit to experimental data.
Another commonly used rheological model for yield-pseudoplastic fluids is the so-called Casson model, which was initially generated to describe ink and paint behavior. However, it has demonstrated a good approximation for non-Newtonian mineral suspensions [46,47] and complex fluids in the petroleum industry [14,49]. The Casson model is given by the following equation:
The Robertson–Stiff model is a three-parameter model that was developed in 1976 by Robertson and Stiff to describe the rheology of drilling fluids in the petroleum industry and cement slurries, though it can also be used for fluids as diverse as maize flour pastes [16] and gels. It is expressed as:
The parameters K and n can be considered similar to the parameters (K and n) of the Herschel–Bulkley model. However, the parameter has a different implication than the yield stress of the Herschel–Bulkley or Bingham models. In the Robertson–Stiff model, appears as a correction to the shear rate rather than the shear stress and the yield stress is defined as:
For Equations (7)–(9) and (11), the following condition can be applied:
2.5. Determination of Model Parameters
When comparing the measuring data, it is not useful to compare all values of one test with those of another mostly due to the large number of individual measuring points. Mathematical model functions for curve fitting are therefore used to characterize complete flow or viscosity curves, resulting in only a small number of curve parameters. This simplifies the comparison of measuring curves since there are only a few model parameters left to compare. Fitting is also called approximation and the corresponding functions are often referred to as regression models. Not every model function can be used for each kind of flow behavior. If the correlation value (e.g., in %) indicates insufficient agreement between the measuring data and model function, it is useful to try another model function. It is also important to keep in mind that both model-specific coefficients and exponents are purely mathematical variables and do not represent real measuring data in principle.
Here, with a controlled shear rate (CSR), the rotational speeds (or shear rates) are preset in the form of steps. However, when using this kind of testing, a yield point cannot be determined directly. It is instead calculated using a fitting function, which is adapted to the available measuring points of the flow curve. Curve fitting is carried out using one of the various model functions. For all approximation models, the dynamic yield stress value is determined via extrapolation of the flow curve toward the shear rate value or at the point of intersection of the fitting function and the -axis. The obtained value of the method strongly depends on the chosen rheological model and the accuracy of the measurements.
To determine the rheological coefficients of each model, curve fitting is performed. Curved relationships between variables are not as straightforward to fit and interpret as linear relationships, but there are standard ways for dealing with this problem [14,50]. In total, six sets of rheometer data for the shear stress and shear rate were analyzed. Three statistical indicators were computed and reported: the correlation coefficient R2, the sum of square errors SSE, and the root mean square error RMSE. The SSE was calculated according to:
where is the predicted or modeled shear stress value. The root-mean-square error is given as:
where Nm is the number of measurements.
3. Results and Discussions
3.1. Rheological and Statistical Evaluation
For each test, the Anton Paar RheolabQC rotational rheometer provided the variation of the shear stress with the shear rate. Figure 4, Figure 5, Figure 6 show the rheograms obtained for the six samples at solids concentrations ranging from 51 to 58 wt.%. In all cases, the flow curves appeared to exhibit non-Newtonian behavior with a nonzero intercept on the stress axis and could be described as yield pseudoplastic. It was also observed that the shear-thinning was accentuated and the dynamic yield stress increased as the solids concentrations were increased for all cases.
In this study, a statistical model fitting analysis was performed on all five models previously discussed to determine the model that was best able to predict the rheological behavior of the CPS samples. Table A1 lists the measured shear stresses of the fluids at different rotational speeds. The raw data obtained were analyzed using several models to determine the various rheological parameters, such as the yield value, consistency, and shear-thinning index. For discussion purposes and in order to limit the size of the paper, only six samples of the total number of experimental runs are presented.
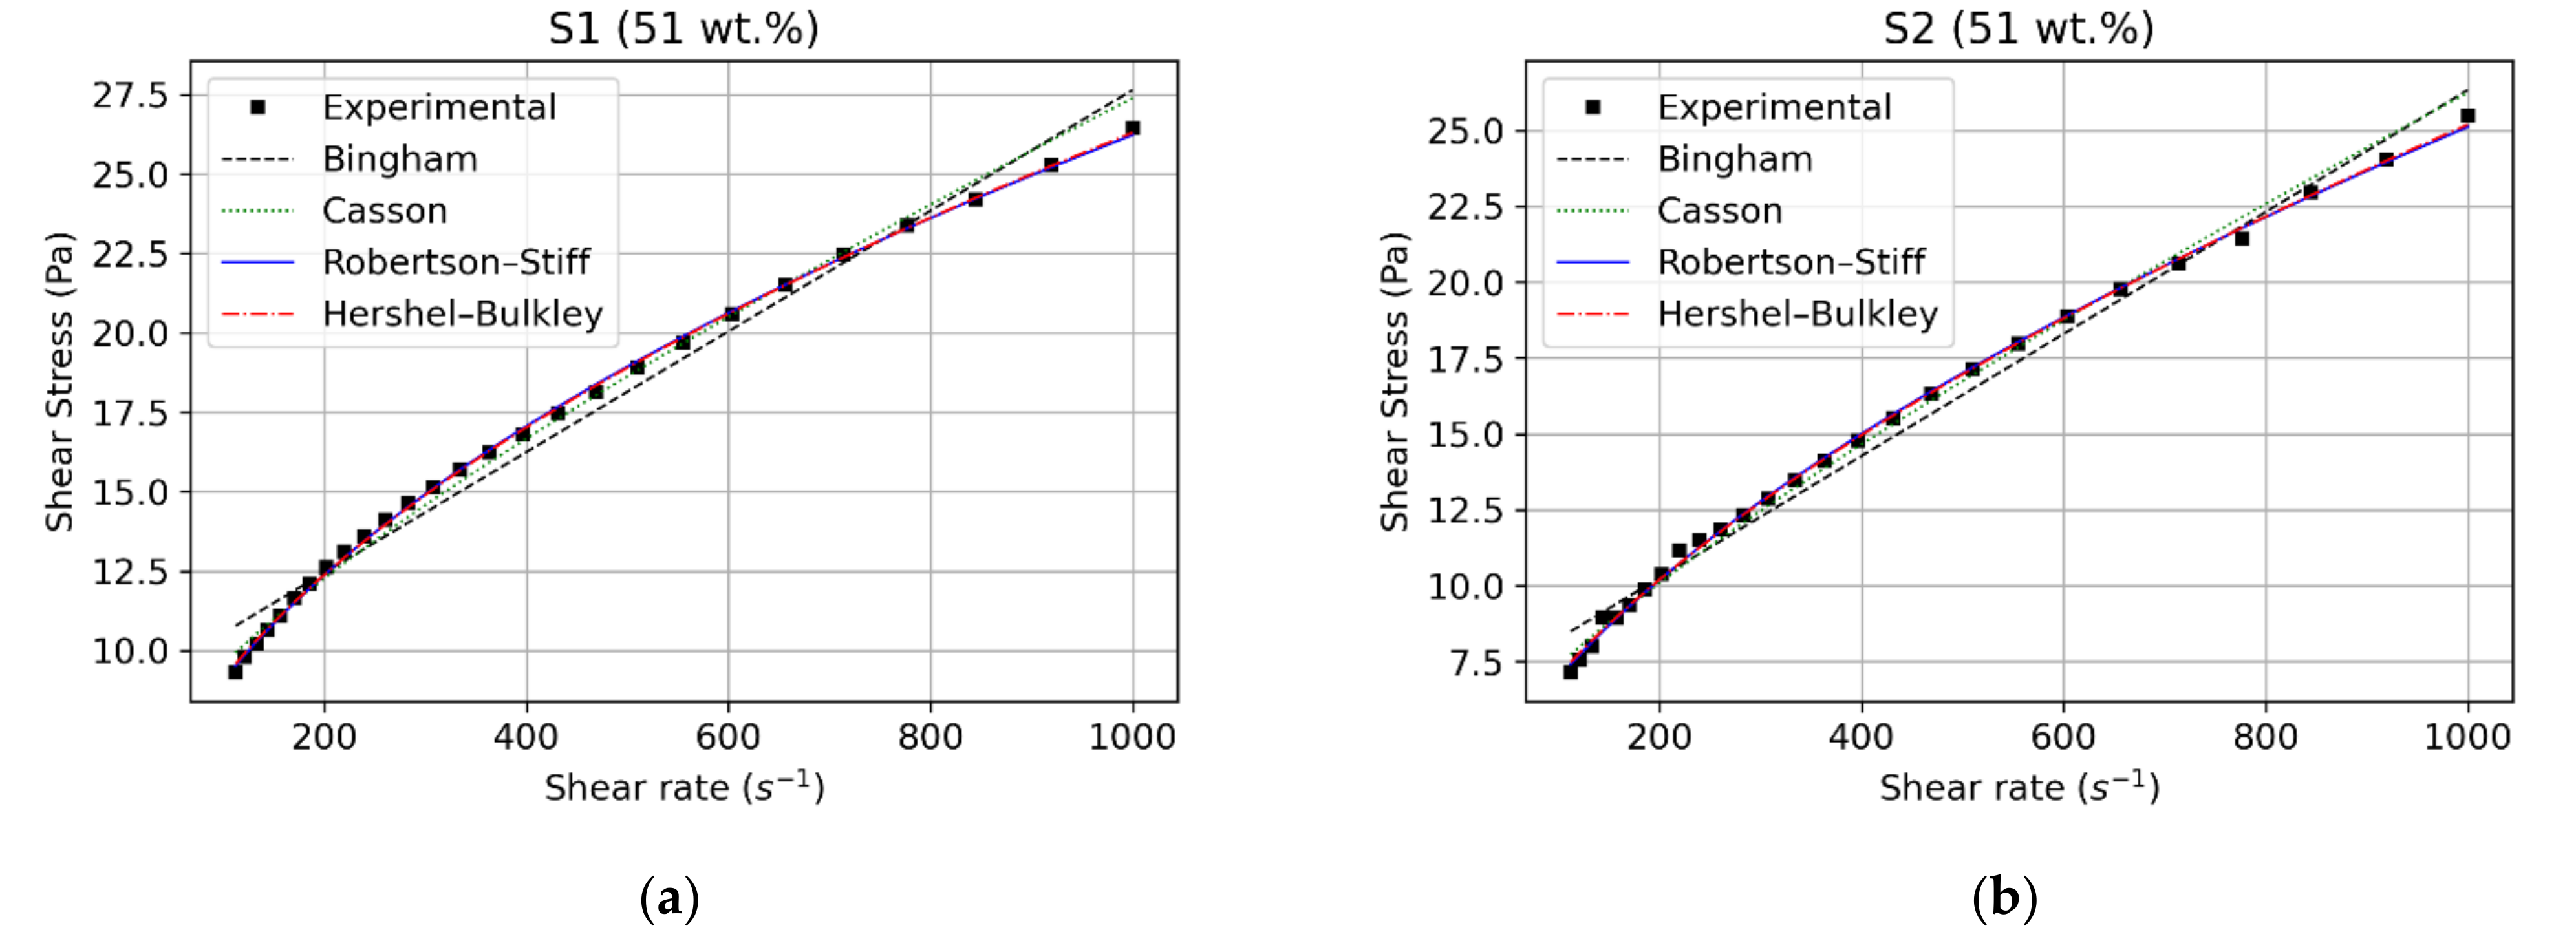
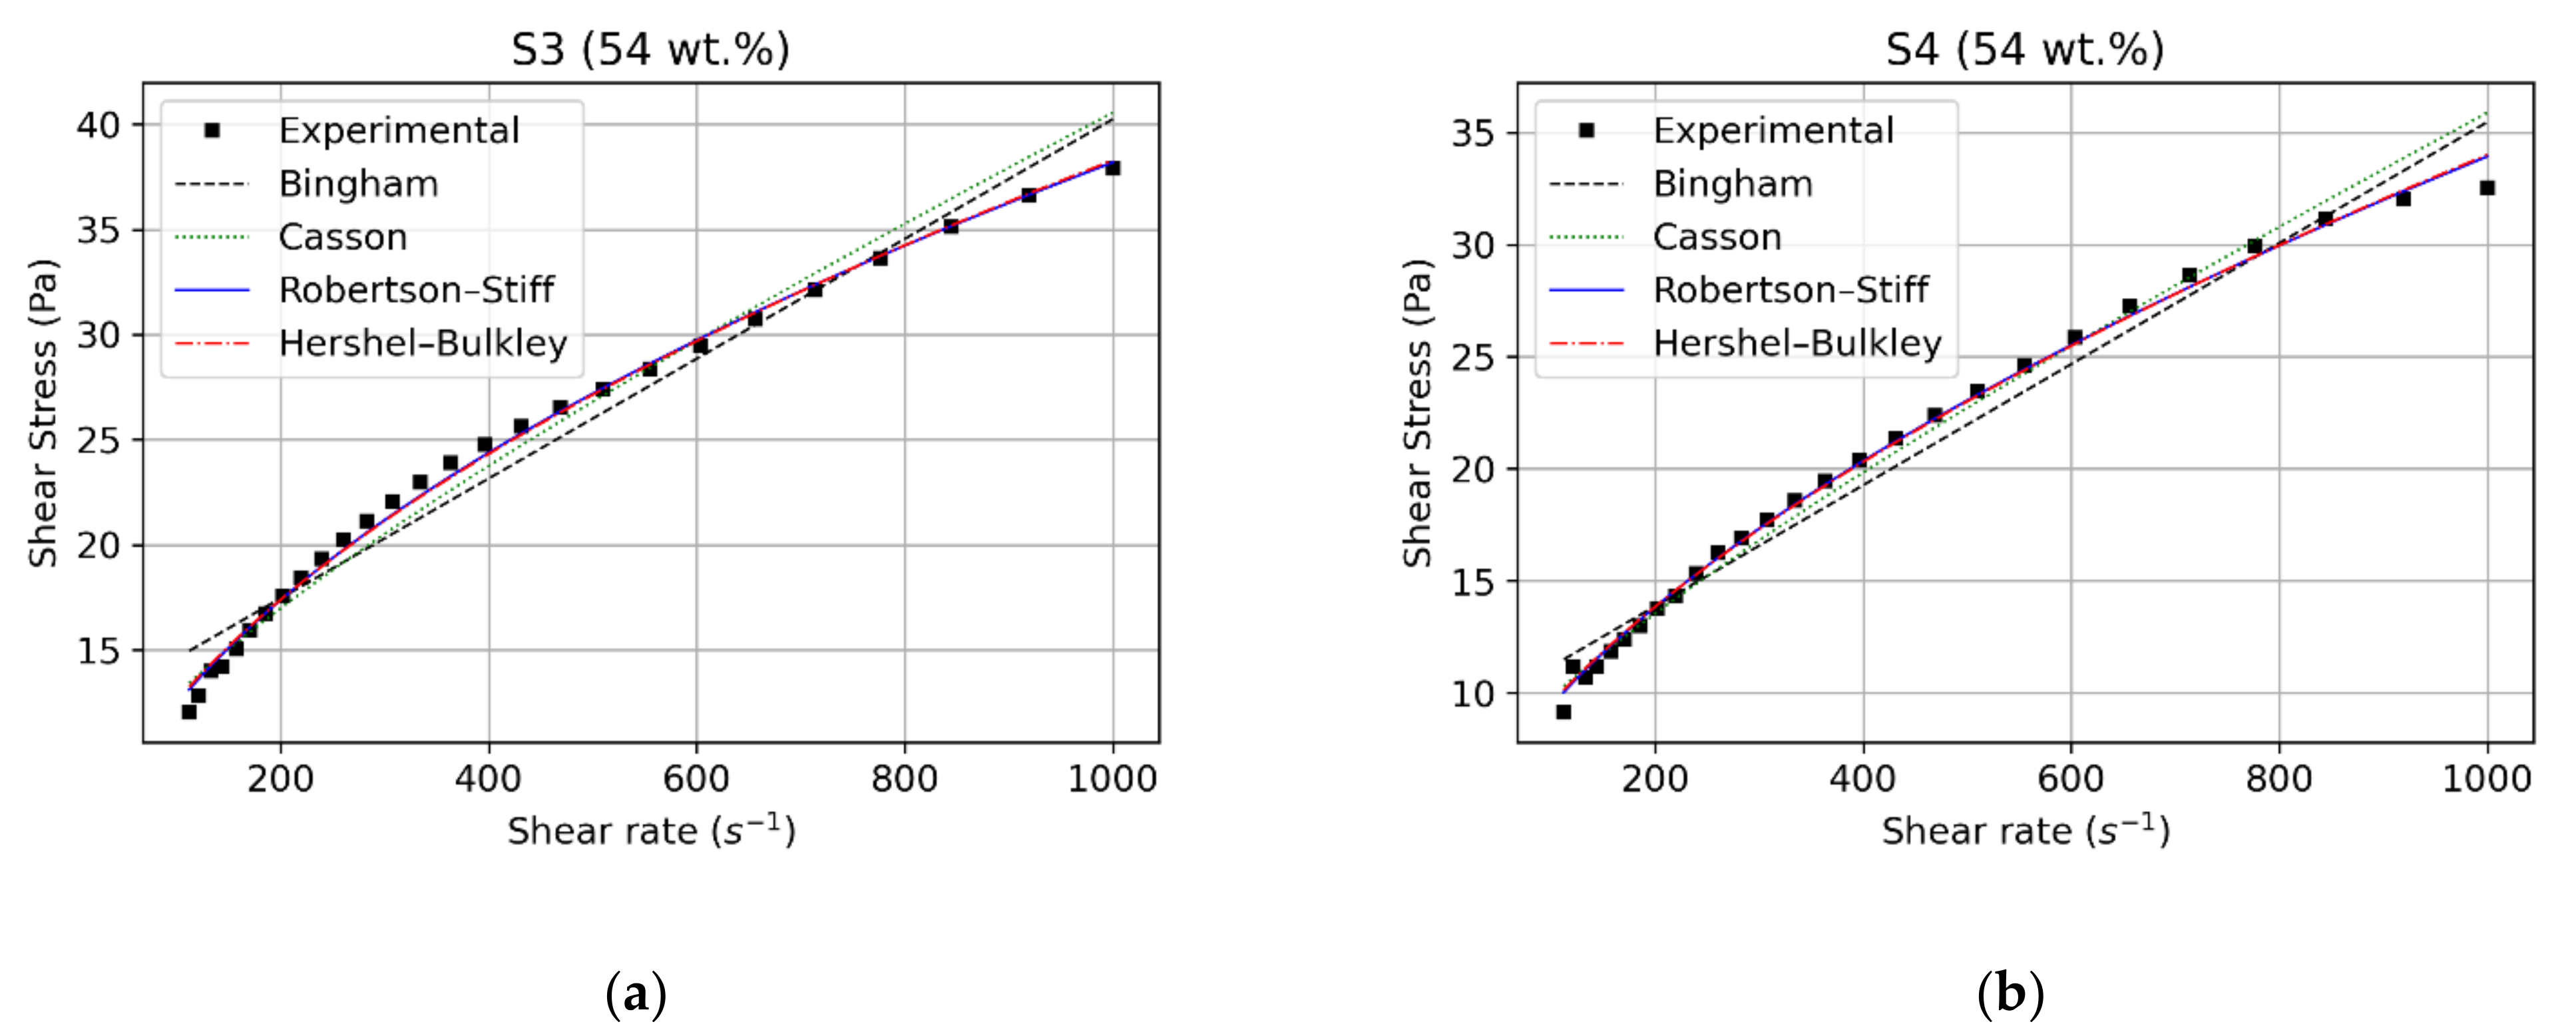
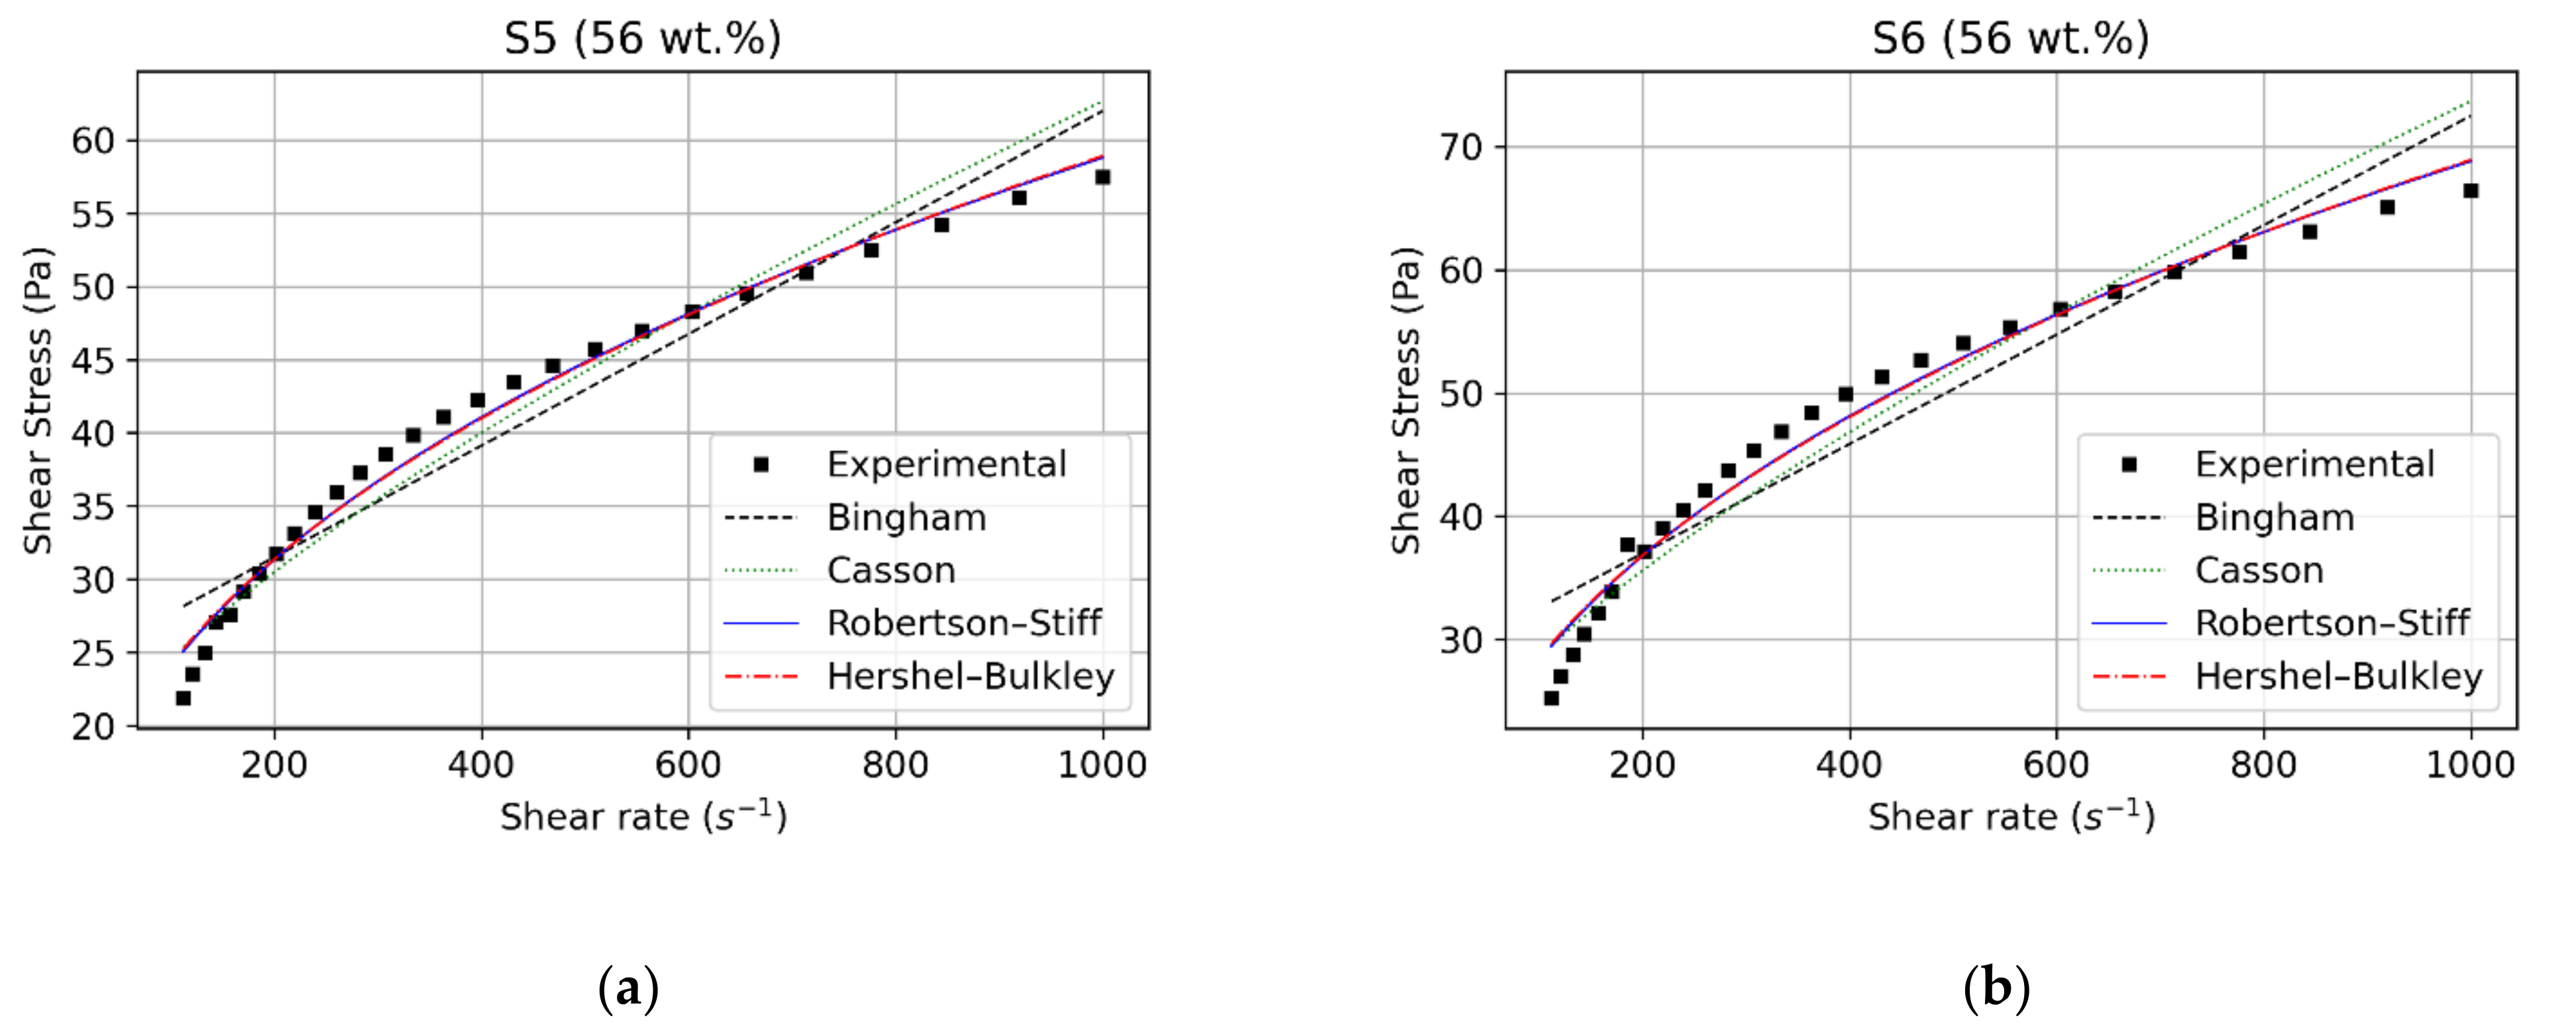
The plots of experimental data and shear stress predicted by each model versus the shear rate for all samples are shown in Figure 4, Figure 5 and Figure 6. Table 2 and Table 3 summarize, respectively, the rheological parameters and statistical indicators obtained after the fitting processes. It can be seen that all the models fit the general trend well but the Bingham model failed to match the experimental stress as closely as the other models. All the models had high R2 values ranging from 0.90 to 0.99 and the highest value was from the Robertson–Stiff fit. The same procedure was applied to the data from all the tests and similar results were obtained; the Robertson–Stiff fit model appeared to fit the data better than the other models tested.
The plots show that increasing viscosity or decreasing size ratios resulted in shear-thinning (curved line) for intermediate shear rates. The data fit to the Bingham and Casson equations resulted in better correlation coefficients for samples with weak shear-thinning: S1, S2, S3, and S4. Thus, for the diluted phosphate slurry, the Bingham and Casson models gave a fair description of the rheological behavior.
However, the Robertson–Stiff and Herschel–Bulkley models provided a better fit for all samples, with the correlation coefficients R2 ranging from 0.97 to 0.99, thus reflecting the accuracy of these models. The sum of the square errors was also lower in comparison with the other models and ranged from 0.48 to 93.80. These indicators were significantly lower than for the Bingham and Casson models, perhaps indicating that three-parameter models were more adequate to describe the rheological behavior of phosphate slurries. Furthermore, the shear-thinning behavior was satisfactorily captured by these models.
3.2. Effect of Particles Concentration
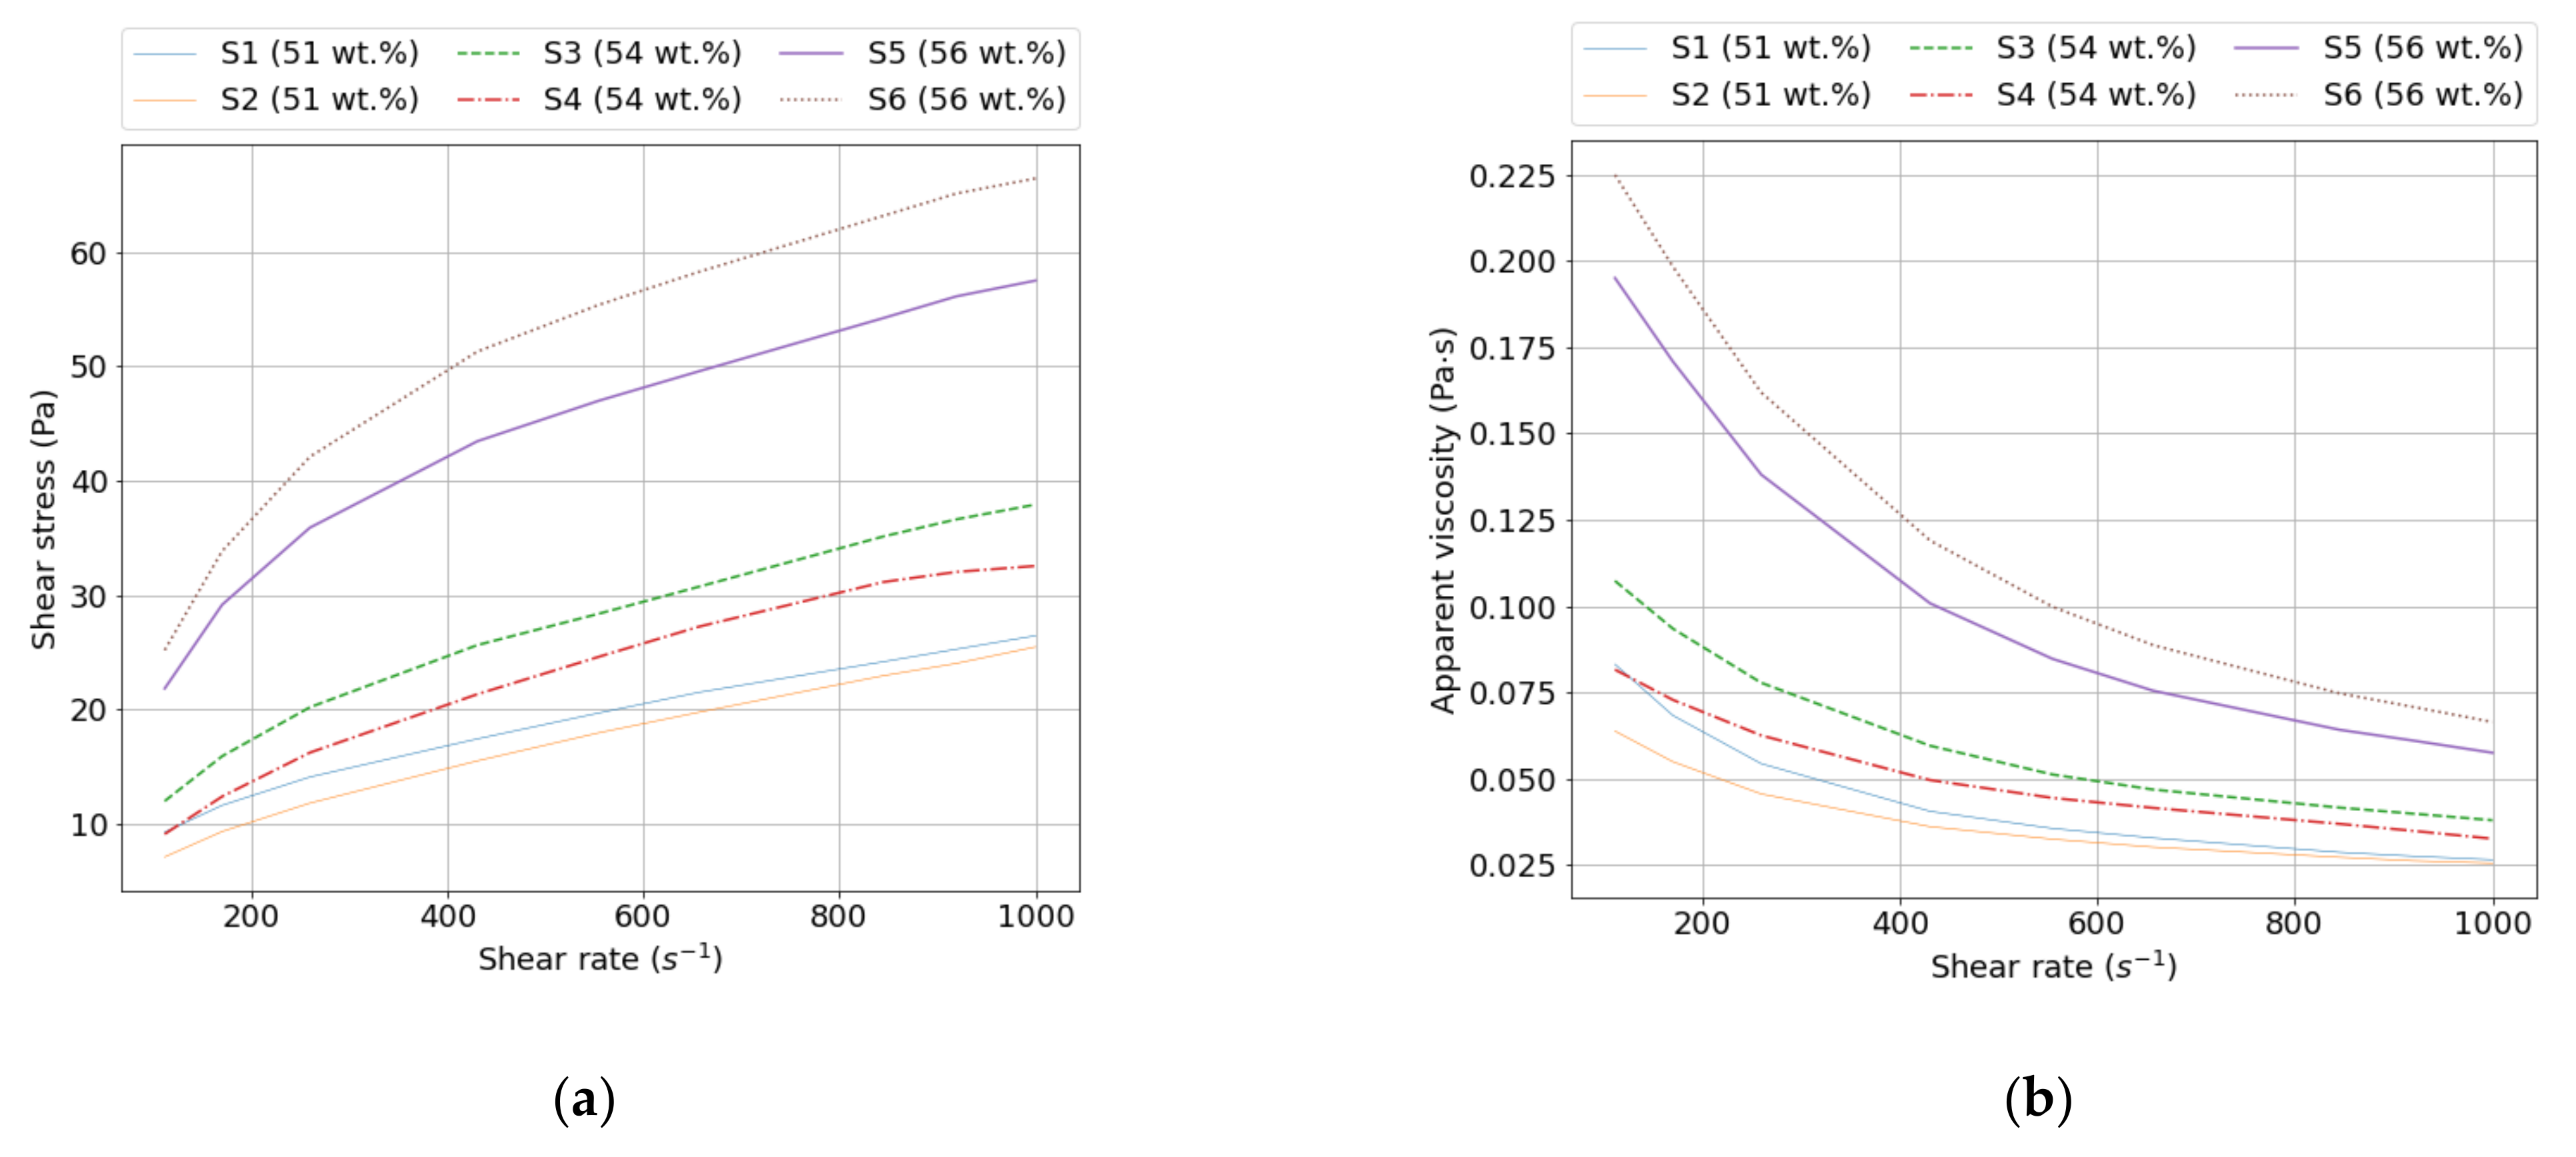
The rheology of a particle suspension is a complex function of its physical properties and of processes that occur at the scale of the dispersed particles. The most important factors are the particle volume fraction ϕ, the particle shape, the interactions between the particles, and the spatial arrangement of the particles. The results in Figure 3 and Table 2 describe the rheological behavior of phosphate slurries with three solids concentrations at a temperature of 25 °C.
Clearly, at a solids concentration of 51 wt.% (29% by volume), the behavior appeared to involve weak shear-thinning at shear rates less than 300 s−1 that tended to be considerably reduced at shear rates larger than 300 s−1. At even higher particle concentrations, the flow curve became more convex upward, indicating shear-thinning in a wider range of shear rates (<400 s−1). This was due to large interparticle distances between the solid particles in a dilute slurry such that attractive forces existing between them had no effect. A larger concentration fraction of particles implied a higher concentration of particle–particle bonds wherefore greater shear energy was required to disrupt them. The higher energy dissipation was reflected by a higher viscosity and yield stress.
3.3. Effect of Particle Size Distribution
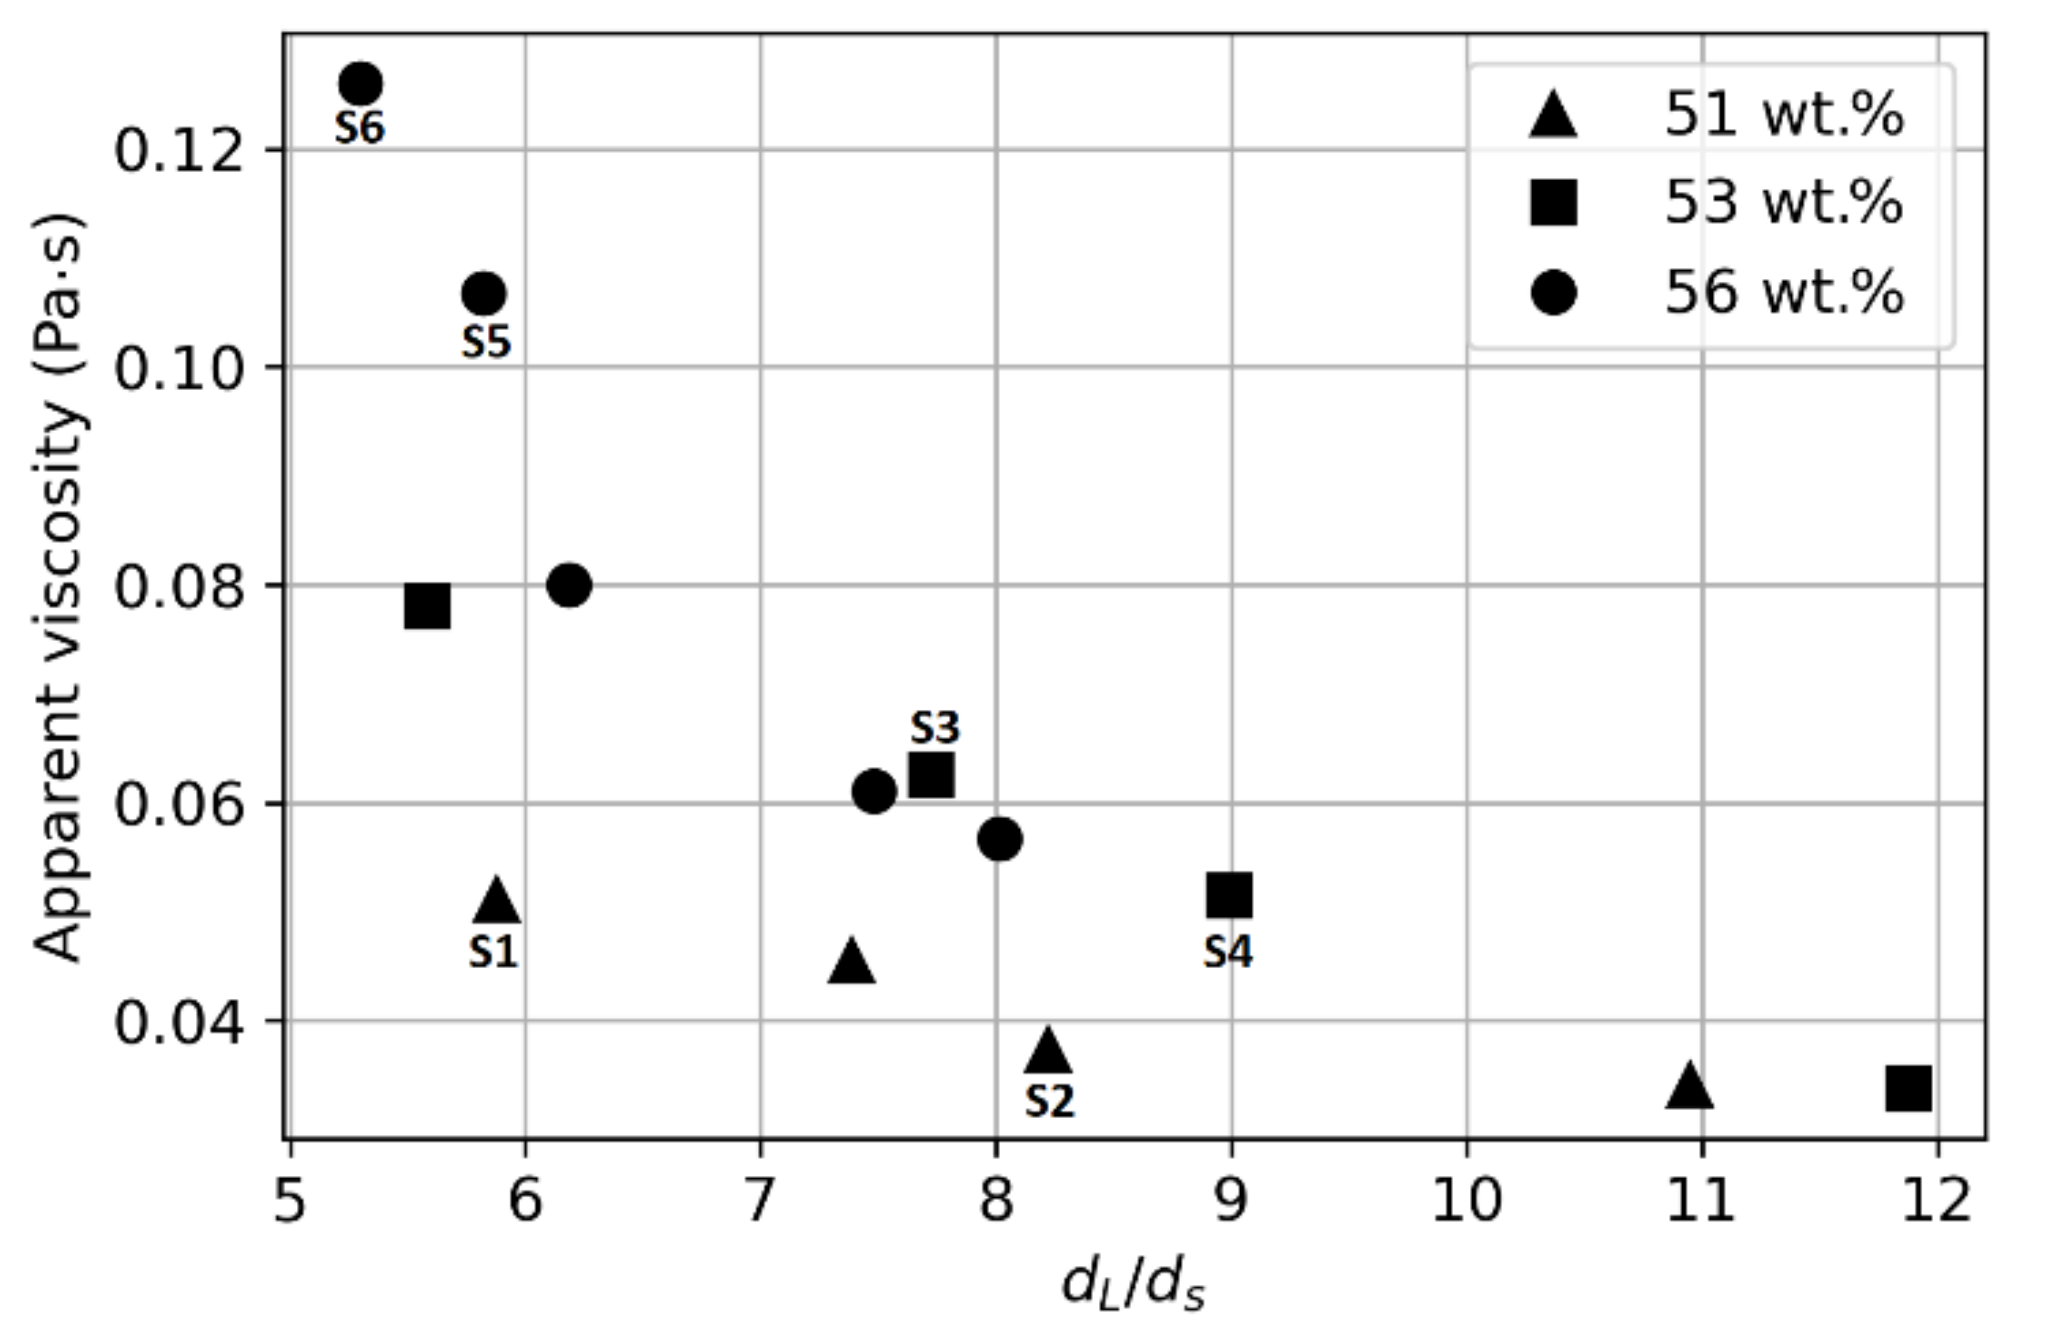
The particle size distribution is an important factor that needs to be taken into account to understand the rheology of certain industrial suspensions. During mineral processing, phosphate rock is subjected to various grinding operations that result in a wide particle size range, from nearly one to few hundreds of micrometers. Thus, to better understand the effect of particle size distribution changes on the viscosity of the CPS samples and to keep the size of this paper reasonable, additional polydisperse systems were used alongside the six samples discussed previously. The total solids concentrations ranged from 51 to 56 wt.%. The values presented in Figure 7 were obtained using the same methodology described previously in this work.
The correlation of the apparent viscosity at a shear rate of 400 s−1, , with particle size distribution is provided in Figure 7. The dL/ds ratio is the particle size ratio (d80/d20) and is expected to correlate with the apparent viscosity η. This seems to be borne out by the data: η decreased as the particle size expanded. This can be predicted using the theory of Farris when applied to suspensions of single-sized fractions of spherical particles [28]. For a given solids concentration, a wide particle size distribution will decrease the apparent viscosity of the mixture. The maximum packing fraction of a monomodal suspension is not influenced by the particle size. However, the maximum packing fraction increases when the particle size distribution (PSD) gets wider because the small particles can fill the void between the large particles. This relation between with the PSD can be used to predict the Krieger–Dougherty equation, and hence, to predict a slurry’s apparent viscosity. This justifies further research on the viscosity of multimodal suspensions to better understand the role of particle size distributions. From an industrial perspective, finding the best size proportions would be useful to optimize the transport process by reducing the resistance to the flow. In this context, air classification might be used before mixing the solids with water in the primary classification of mineral processing.
3.4. Laminar Pipe Flow
In the mineral-processing industry, it is essential to know the rheological properties of pumped slurries over extended distances in order to evaluate the key design parameters (flow rates, pressure gradients, etc.). In this subsection, mathematical models of the flow of time-independent and non-Newtonian fluids through a straight pipe in steady-state laminar flow regimes are described in order to highlight the influence of rheological parameters on flow behavior. In the following, it was assumed that the liquid–solid mixture was homogeneous and that there was no slippage between the suspension and the pipe wall.
When considering a unidirectional and axisymmetric flow of a fluid through a circular tube with radius R, the relation between the volumetric flow rate Q and the pressure gradient ∆p/L is obtained via integration of the Rabinowitsch–Mooney equation:
where Q is the total volumetric flow rate and is the wall shear stress. At r = R, the relationship between the wall stress and the pressure gradient is as follows:
When the relationship between the shear stress and the shear rate raw data from the rheometer can be accurately modeled using explicit algebraic expressions, such as the rheological models that we proposed in Section 2.4, we can use them as a substitute for in Equation (16), allowing the integral to be evaluated analytically. Similarly, cross-sectional velocity profiles for a given pressure drop can be found. The shear rate is expressed as . Assuming a no-slip condition u(R) = 0, this integrates to give the flow velocity distribution in the axial direction u(r) with respect to the radial distance:
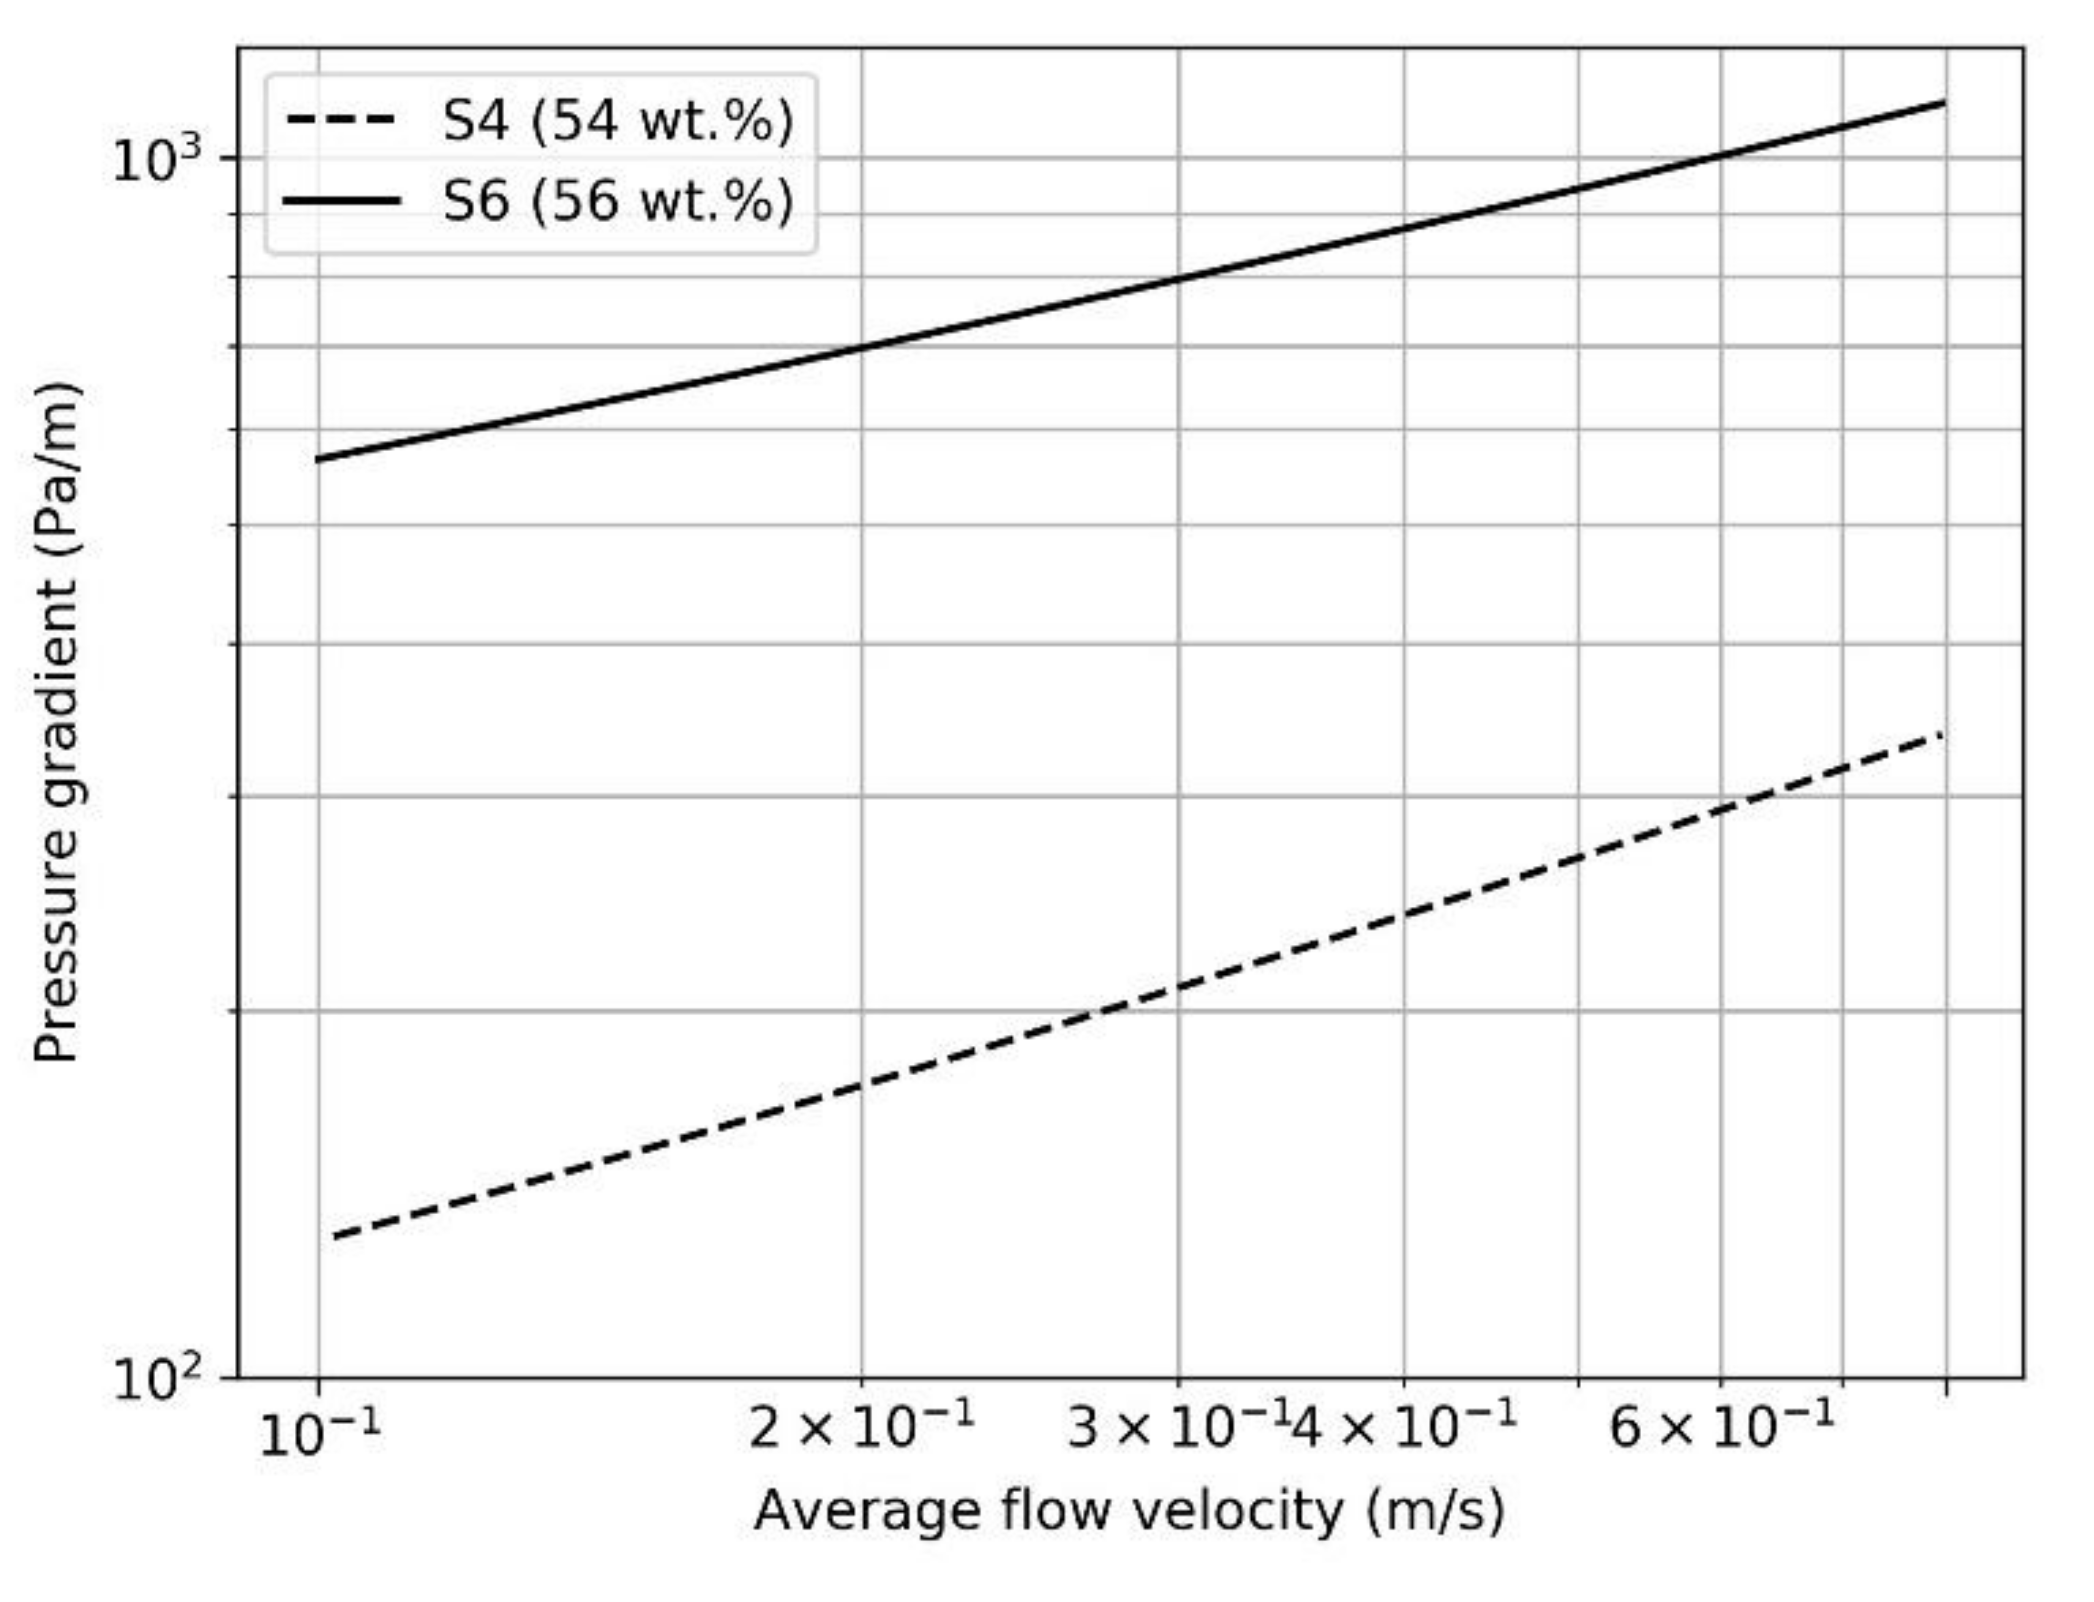
In Figure 8, the Herschel–Bulkley model was used to plot the flow curves of samples 4 and 6 in the laminar regime. As can be seen, S6 required a greater pressure gradient (or equivalently,) in order to reach the same mean flow velocity as S4 through a cross-section. For a mean velocity of 0.8 m/s, sample 6 theoretically needed nearly three times more pressure per unit length for a given transfer duty. The required pressure gradients per length for S4 and S6 were 336.84 Pa·s/m and 1107.26 Pa·s/m, respectively. Indeed, as seen in Table 2, the curve fitting indicated that sample 6 had a higher value of dynamic yield stress. Moreover, Figure 3 revealed a higher value of apparent viscosity over the range of shear rates where the Herschel–Bulkley model was applied. Thus, the design of slurry pipelines relies heavily on the rheological behavior of the transported suspensions, which needs to be optimally controlled.
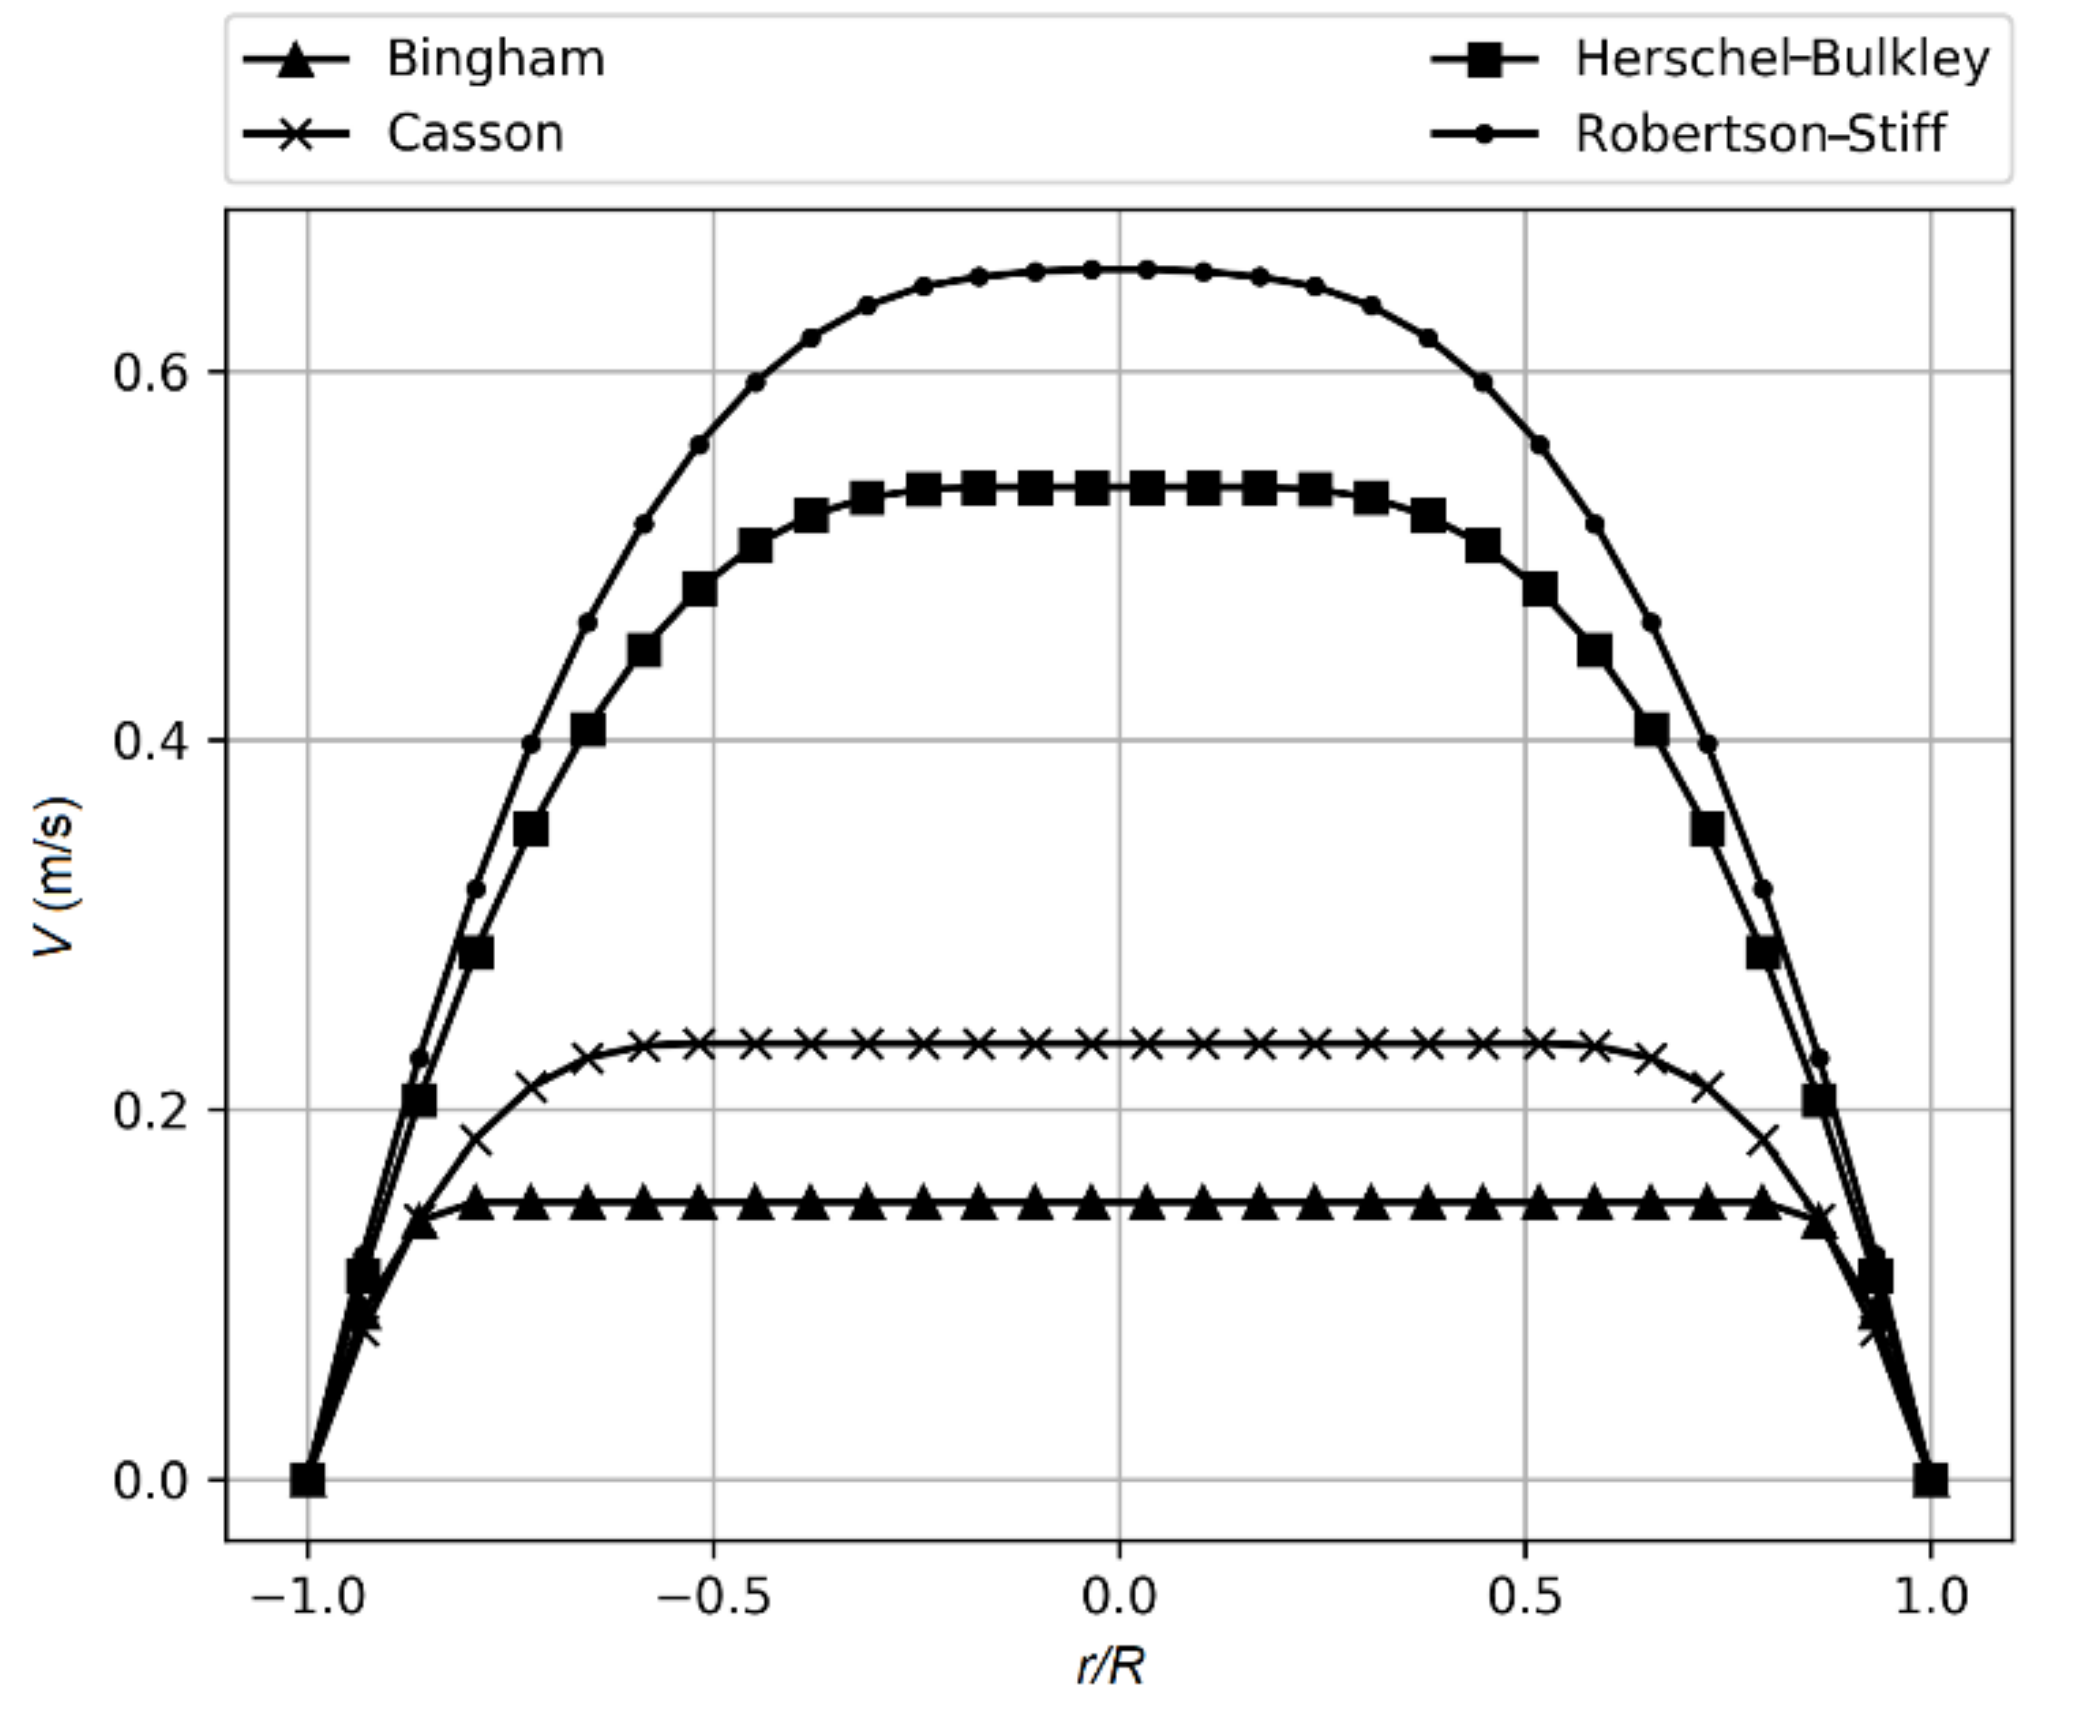
Figure 9 shows the velocity distributions for different rheological models during the laminar flow of phosphate ore slurry through a 0.1 m pipe evaluated at a constant pressure gradient ∆p/L. The rheological parameters obtained via curve fitting using the raw data of sample 4 served as the basis to illustrate the effect of different rheological models on the velocity profile. In these plots, the value of the pressure gradient was adjusted to maintain a laminar flow regime [44,51,52,53].
As shown in Figure 9, the velocity profile of a yield stress fluid presented a plug core flowing in the center of the pipe. In this zone, the applied stress was less than the yield stress. When the threshold was exceeded, the sheared fluid presented a curved velocity profile. For the Bingham and Casson models, the flat region occupied a major part of the pipe section. This could be explained by the fact that the curve fitting based on these two models resulted in high values of yield stress in comparison with the Robertson–Stiff and Herschel–Bulkley models, which enlarged the zone of the plug flow. Lower values of yield stress imply a reduction in the size of the plug core and a higher velocity magnitude [50]. Figure 9 clearly demonstrates that using different models to describe fluid flow may lead to completely dissimilar outputs. The accuracy of the mean velocity or pressure loss prediction is then closely related to the accuracy of the data and the closeness with which the slurry flow properties fit any chosen model. Performing a benchmark test with pipe flow experiments is crucial for validating the obtained results.
4. Conclusions
As a starting point, we proposed an experimental protocol for measuring the shear rheology of a concentrated phosphate slurry. The flow curves appeared to be non-Newtonian and exhibited shear-thinning behavior in all cases and could be described as yield pseudoplastics. Then, well-known rheological models were considered for the modeling. These equations were more suitable for describing the behavior of our mixture over the range of shear rates. Based on the results of this work, the following conclusions were reached. The Robertson–Stiff model was found to give the best description of the flow curves, yielding a value of R2 higher than 0.97 in all cases. The Casson model, as a two-parameter model, offered a good alternative for this suspension. The apparent viscosity increased as the particle concentration increased. It was also observed that an expanded particle size distribution yielded a lower apparent viscosity for all cases. The results show that apparent viscosity can be reduced at a constant loading by up to 20%. Later, it was found that the accuracy of the pressure loss prediction relied on the accuracy of the rheological model. Despite the fact that a significant amount of rheological data for the concentrated phosphate slurry were evaluated in this study, the data did not cover the complete range of the shear rates. Hence, we are aware that some conclusions are limited to the range of the data considered in this study.
These findings can be exploited for better control of phosphate dispersion in biocomposites polymeric-based systems, which allow for better control of the filler dispersity and avoid harmful aggregation. Overall, shear rheology seems to be a suitable tool for controlling the phosphate filler properties and especially their polydispersities upstream of their processing. This part is the subject of an ongoing investigation that is to be published in our future works.
Author Contributions
Conceptualization, S.M. and A.M.; methodology, S.M. and A.M.; validation, S.M., A.M., and K.L.; formal analysis, S.M. and A.M.; investigation, S.M., K.L., A.M., D.O., and F.B.; data curation, S.M.; writing—original draft preparation, S.M.; writing—review and editing, S.M., A.M. and K.L.; visualization, K.L.; supervision, A.M., D.O., and F.B.; project administration, D.O. and F.B. All authors have read and agreed to the published version of the manuscript.
Funding
This research received no external funding.
Conflicts of Interest
The authors declare no conflict of interest. The funders had no role in the design of the study; in the collection, analyses, or interpretation of data; in the writing of the manuscript; in the decision to publish the results.
Appendix A

Table A1.
Shear stress data.
| Rotational Speed (rpm) | Shear Stress | |||||
|---|---|---|---|---|---|---|
| τ (Pa) | ||||||
| Measuring Points | S1 | S2 | S3 | S4 | S5 | S6 |
| 776.5 | 24.47 | 27.66 | 47.42 | 40.55 | 72.63 | 66.39 |
| 713.8 | 23.26 | 26.48 | 46.19 | 39.94 | 70.31 | 65.07 |
| 656.2 | 22.2 | 25.39 | 44.44 | 38.4 | 67.79 | 63.13 |
| 603.2 | 20.47 | 24.58 | 42.74 | 37.07 | 65.63 | 61.48 |
| 554.5 | 19.52 | 23.66 | 41.17 | 35.69 | 63.71 | 59.79 |
| 509.7 | 18.78 | 22.71 | 39.77 | 34.42 | 61.9 | 58.22 |
| 468.5 | 18.01 | 21.79 | 38.54 | 33.25 | 60.09 | 56.79 |
| 430.7 | 17.27 | 20.91 | 37.35 | 32.21 | 58.39 | 55.35 |
| 395.9 | 16.51 | 20.1 | 36.24 | 31.2 | 56.83 | 54.02 |
| 364 | 15.79 | 19.35 | 35.13 | 30.24 | 55.3 | 52.66 |
| 334.6 | 15.09 | 18.65 | 34.03 | 29.32 | 53.73 | 51.27 |
| 307.6 | 14.39 | 18.02 | 32.87 | 28.5 | 52.21 | 49.9 |
| 282.7 | 13.71 | 17.43 | 31.74 | 27.67 | 50.65 | 48.4 |
| 259.9 | 13.09 | 16.89 | 30.54 | 26.84 | 48.95 | 46.86 |
| 238.9 | 12.49 | 16.35 | 29.31 | 26.02 | 47.27 | 45.31 |
| 219.6 | 12.17 | 15.84 | 28.12 | 25.15 | 45.69 | 43.69 |
| 201.9 | 11.55 | 15.32 | 26.92 | 24.28 | 43.89 | 42.08 |
| 185.6 | 11.18 | 14.8 | 25.74 | 23.41 | 42.34 | 40.48 |
| 170.6 | 10.82 | 14.31 | 24.59 | 22.49 | 40.5 | 39.03 |
| 156.8 | 10.39 | 13.83 | 23.5 | 21.63 | 38.56 | 37.13 |
| 144.1 | 9.797 | 13.32 | 22.32 | 20.7 | 36.79 | 36.19 |
| 132.5 | 9.117 | 12.85 | 21.34 | 19.79 | 34.93 | 33.85 |
| 121.8 | 8.646 | 12.29 | 20.27 | 18.92 | 33.16 | 32.14 |
| 112 | 8.036 | 11.84 | 19.12 | 18.09 | 31.42 | 30.41 |
| 102.9 | 7.567 | 11.42 | 17.97 | 17.3 | 29.63 | 28.74 |
| 94.61 | 7.102 | 10.99 | 16.9 | 16.52 | 27.83 | 27.02 |
| 86.97 | 6.586 | 10.51 | 15.87 | 15.63 | 26.04 | 25.2 |
References
- Rusconi, J.; Lakhouaja, A.; Kopuz, M. The Design and Engineering of the 187 Km Khouribga to Jorf Lasfar Phosphate Slurry Pipeline. Procedia Eng. 2016, 138, 142–150. [Google Scholar] [CrossRef] [Green Version]
- Hore-Lacy, I. Production of Byproduct Uranium and Uranium from Unconventional Resources. In Uranium for Nuclear Power; Hore-Lacy, I., Ed.; Woodhead Publishing: Sawston, UK, 2016; pp. 239–251. [Google Scholar] [CrossRef]
- Ilyin, A.V. Rare-Earth Geochemistry of ‘old’ Phosphorites and Probability of Syngenetic Precipitation and Accumulation of Phosphate1In Memory of Richard P. Sheldon1. Chem. Geol. 1998, 144, 243–256. [Google Scholar] [CrossRef]
- Dar, S.A.; Khan, K.F.; Birch, W.D. Sedimentary: Phosphates. In Reference Module in Earth Systems and Environmental Sciences; Elsevier: Amsterdam, The Netherlands, 2017. [Google Scholar] [CrossRef]
- El-Shall, H.; Zhang, P.; Abdel Khalek, N.; El-Mofty, S. Beneficiation Technology of Phosphates: Challenges and Solutions. Miner. Metall. Process. 2004, 21, 17–26. [Google Scholar] [CrossRef]
- Becker, P. Phosphates and Phosphoric Acid: Raw Materials, Technology, and Economics of the Wet Process. Second Edition, Revised and Expanded; Marcel Dekker, Inc.: New York, NY, USA, 1989; Volume 6. [Google Scholar]
- Eshtiaghi, N.; Markis, F.; Slatter, P. The Laminar/Turbulent Transition in a Sludge Pipeline. Water Sci. Technol. 2012, 65, 697–702. [Google Scholar] [CrossRef]
- Coussot, P. Yield Stress Fluid Flows: A Review of Experimental Data. J. Non-Newton. Fluid Mech. 2014, 211. [Google Scholar] [CrossRef]
- Hart, A. A Review of Technologies for Transporting Heavy Crude Oil and Bitumen via Pipelines. J. Pet. Explor. Prod. Technol. 2014, 4, 327–336. [Google Scholar] [CrossRef] [Green Version]
- Stickel, J.J.; Powell, R.L. Fluid Mechanics And Rheology Of Dense Suspensions. Annu. Rev. Fluid Mech. 2005, 37, 129–149. [Google Scholar] [CrossRef]
- Mueller, S.; Llewellin, E.W.; Mader, H.M. The Rheology of Suspensions of Solid Particles. Proc. R. Soc. A: Math. Phys. Eng. Sci. 2010, 466, 1201–1228. [Google Scholar] [CrossRef] [Green Version]
- Kelessidis, V.; Maglione, R.; Tsamantaki, C.; Aspirtakis, Y. Optimal Determination of Rheological Parameters for Herschel-Bulkley Drilling Fluids and Impact on Pressure Drop, Velocity Profiles and Penetration Rates during Drilling. J. Pet. Sci. Eng. 2006, 53, 203–224. [Google Scholar] [CrossRef]
- Eshtiaghi, N.; Markis, F.; Yap, S.D.; Baudez, J.-C.; Slatter, P. Rheological Characterisation of Municipal Sludge: A Review. Water Res. 2013, 47, 5493–5510. [Google Scholar] [CrossRef]
- Núñez-Santiago, M.; Santoyo, E.; Bello-Pérez, L.; Santoyo-Gutiérrez, S. Rheological Evaluation of Non-Newtonian Mexican Nixtamalised Maize and Dry Processed Masa Flours. J. Food Eng. 2003, 60, 55–66. [Google Scholar] [CrossRef]
- Einstein, A. Eine Neue Bestimmung Der Moleküldimensionen. Ann. Phys. 1906, 324, 289–306. [Google Scholar] [CrossRef] [Green Version]
- Batchelor, G.K. The Effect of Brownian Motion on the Bulk Stress in a Suspension of Spherical Particles. J. Fluid Mech. 1977, 83, 97–117. [Google Scholar] [CrossRef]
- Krieger, I.M.; Dougherty, T.J. A Mechanism for Non-Newtonian Flow in Suspensions of Rigid Spheres. Trans. Soc. Rheol. 1959, 3, 137–152. [Google Scholar] [CrossRef]
- McGEARY, R.K. Mechanical Packing of Spherical Particles. J. Am. Ceram. Soc. 1961, 44, 513–522. [Google Scholar] [CrossRef]
- Ouchiyama, N.; Tanaka, T. Porosity of a Mass of Solid Particles Having a Range of Sizes. Ind. Eng. Chem. Fund. 1981, 20, 66–71. [Google Scholar] [CrossRef]
- Mooney, M. The Viscosity of a Concentrated Suspension of Spherical Particles. J. Colloid Sci. 1951, 6, 162–170. [Google Scholar] [CrossRef]
- Frankel, N.A.; Acrivos, A. On the Viscosity of a Concentrated Suspension of Solid Spheres. Chem. Eng. Sci. 1967, 22, 847–853. [Google Scholar] [CrossRef]
- Barnes, H.A. Shear-Thickening (“Dilatancy”) in Suspensions of Nonaggregating Solid Particles Dispersed in Newtonian Liquids. J. Rheol. 1989, 33, 329–366. [Google Scholar] [CrossRef]
- Bender, J.; Wagner, N.J. Reversible Shear Thickening in Monodisperse and Bidisperse Colloidal Dispersions. J. Rheol. 1996, 40, 899–916. [Google Scholar] [CrossRef]
- Maranzano, B.J.; Wagner, N.J. The Effects of Interparticle Interactions and Particle Size on Reversible Shear Thickening: Hard-Sphere Colloidal Dispersions. J. Rheol. 2001, 45, 1205–1222. [Google Scholar] [CrossRef] [Green Version]
- Brown, E.; Jaeger, H.M. The Role of Dilation and Confining Stresses in Shear Thickening of Dense Suspensions. J. Rheol. 2012, 56, 875–923. [Google Scholar] [CrossRef] [Green Version]
- Wagner, N.J.; Brady, J.F. Shear Thickening in Colloidal Dispersions. Phys. Today 2009, 62, 27–32. [Google Scholar] [CrossRef] [Green Version]
- Zou, R.P.; Xu, J.Q.; Feng, C.L.; Yu, A.; Johnston, S.; Standish, N. Packing of Multi-Sized Mixtures of Wet Coarse Spheres. Powder Technol. 2003, 130, 77–83. [Google Scholar] [CrossRef]
- Farris, R.J. Prediction of the Viscosity of Multimodal Suspensions from Unimodal Viscosity Data. Trans. Soc. Rheol. 1968, 12, 281–301. [Google Scholar] [CrossRef]
- Chang, C.; Powell, R.L. Effect of Particle Size Distributions on the Rheology of Concentrated Bimodal Suspensions. J. Rheol. 1994, 38, 85–98. [Google Scholar] [CrossRef]
- Austin, L.G.; Klimpel, R.R.; Luckie, P.T. Process Engineering of Size Reduction: Ball Milling; Society for Mining Metallurgy: Englewood, CO, USA, 1984. [Google Scholar]
- Mewis, J.; Wagner, N.J. (Eds.) Thixotropy. In Colloidal Suspension Rheology; Cambridge Series in Chemical Engineering; Cambridge University Press: Cambridge, UK, 2011; pp. 228–251. [Google Scholar] [CrossRef]
- Denn, M.M.; Morris, J.F. Rheology of Non-Brownian Suspensions. Annu. Rev. Chem. Biomol. Eng. 2014, 5, 203–228. [Google Scholar] [CrossRef] [PubMed]
- Bujake, J.E., Jr. Rheology of Concentrated Dicalcium Phosphate Suspensions. J. Pharm. Sci. 1965, 54, 1599–1604. [Google Scholar] [CrossRef]
- Benretem, A.; Benidir, M.; Chaib, R. Factors Influencing Slurry Rheology. World Pumps 2010, 2010, 30–32. [Google Scholar] [CrossRef]
- Hamza, B.; El-Hami, K.; Mazouz, H. Study of the Rheological Behavior of Phosphate Slurry and Its Derivatives Products. In International Conference on Advanced Intelligent Systems for Sustainable Development; Springer: Berlin/Heidelberg, Germany, 2020; pp. 650–660. [Google Scholar] [CrossRef]
- Shaikh, H.M. Thermal, Rheological, and Mechanical Properties of Polypropylene/Phosphate Ore Composites. Constr. Build. Mater. 2020, 263, 120151. [Google Scholar] [CrossRef]
- Fertilizer, M. United Nations Industrial Development Organization (UNIDO) and International Fertilizer Development Center (IFDC); Kluwer Academic Publishers: Dordrecht, The Netherlands; Muscle Shoals, AL, USA, 1998. [Google Scholar]
- Plastics—Polymers/Resins in the Liquid State or as Emulsions or Dispersions—Determination of Viscosity Using a Rotational Viscometer with Defined Shear Rate; ISO 3219: Geneva, Switzerland, 1993.
- Macosko, C.W. Rheology: Principles, Measurements, and Applications; Wiley: Hoboken, NJ, USA, 1994. [Google Scholar]
- Van Wazer, J.R. Colwell: Viscosity and Flow Measurement. A Laboratory Handbook of Rheology; John Wiley and Sons: New York, NY, USA; London, UK, 1964; pp. 371–372. Volume 16. [Google Scholar] [CrossRef]
- Barnes, H. The “yield Stress Myth?” Paper—21 Years On. Appl. Rheol. 2007, 17, 43110–43111. [Google Scholar] [CrossRef]
- Coussot, P.; Tocquer, L.; Lanos, C.; Ovarlez, G. Macroscopic vs Local Rheology of Yield Stress Fluids. J. Non-Newton. Fluid Mech. 2009, 158, 85–90. [Google Scholar] [CrossRef]
- Thota Radhakrishnan, A.K.; van Lier, J.B.; Clemens, F.H.L.R. Rheological Characterisation of Concentrated Domestic Slurry. Water Res. 2018, 141, 235–250. [Google Scholar] [CrossRef]
- Khataniar, S.; Chukwu, G.A.; Xu, H. Evaluation of Rheological Models and Application to Flow Regime Determination. J. Pet. Sci. Eng. 1994, 11, 155–164. [Google Scholar] [CrossRef]
- Herschel, W.H. Consistency of Rubber Benzene Solutions. Ind. Eng. Chem. 1924, 16, 927. [Google Scholar] [CrossRef]
- Turian, R.M.; Ma, T.W.; Hsu, F.L.G.; Sung, D.J. Characterization, Settling, and Rheology of Concentrated Fine Particulate Mineral Slurries. Powder Technol. 1997, 93, 219–233. [Google Scholar] [CrossRef]
- He, M.; Wang, Y.; Forssberg, E. Slurry Rheology in Wet Ultrafine Grinding of Industrial Minerals: A Review. Powder Technol. 2004, 147, 94–112. [Google Scholar] [CrossRef]
- Baudez, J.-C.; Coussot, P. Rheology of Aging, Concentrated, Polymeric Suspensions: Application to Pasty Sewage Sludges. J. Rheol. 2001, 45, 1123–1139. [Google Scholar] [CrossRef]
- Bailey, W.; Weir, I. Investigation of Methods for Direct Rheological Model Parameter Estimation. J. Pet. Sci. Eng. 1998, 21, 1–13. [Google Scholar] [CrossRef]
- Ohen, H.A.; Blick, E.F. Golden Section Search Method for Determining Parameters in Robertson-Stiff Non-Newtonian Fluid Model. J. Pet. Sci. Eng. 1990, 4, 309–316. [Google Scholar] [CrossRef]
- Metzner, A.B.; Reed, J.C. Flow of Non-Newtonian Fluids—Correlation of the Laminar, Transition, and Turbulent-Flow Regions. Aiche J. 1955, 1, 434–440. [Google Scholar] [CrossRef]
- Bailey, W.J.; Peden, J.M. A Generalized and Consistent Pressure Drop and Flow Regime Transition Model for Drilling Hydraulics. Spe Drill. Completion 2000, 15, 44–56. [Google Scholar] [CrossRef]
- Peixinho, J.; Nouar, C.; Desaubry, C.; Théron, B. Laminar Transitional and Turbulent Flow of Yield Stress Fluid in a Pipe. J. Non-Newton. Fluid Mech. 2005, 128, 172–184. [Google Scholar] [CrossRef]
Figure 1.
Cumulative particle size distribution of the concentrated phosphate slurry (CPS) samples in terms of the percentage of cumulative volume versus particle size. S1–S6 signify the sample labels.
Figure 1.
Cumulative particle size distribution of the concentrated phosphate slurry (CPS) samples in terms of the percentage of cumulative volume versus particle size. S1–S6 signify the sample labels.

Figure 2.
Searle principle: the instrument’s motor rotates the measuring bob inside an immovable cup filled with slurry (αcyl.cone = 120°).
Figure 2.
Searle principle: the instrument’s motor rotates the measuring bob inside an immovable cup filled with slurry (αcyl.cone = 120°).

Figure 3.
Representative rheograms showing (a) the shear stress as a function of the shear rate of CPS samples at various solids concentrations and a fixed temperature of 25 °C and (b) the apparent viscosity as a function of the shear rate under the same conditions.
Figure 3.
Representative rheograms showing (a) the shear stress as a function of the shear rate of CPS samples at various solids concentrations and a fixed temperature of 25 °C and (b) the apparent viscosity as a function of the shear rate under the same conditions.

Figure 4.
Comparison of rheological model fits for (a) S1 and (b) S2.

Figure 5.
Comparison of rheological model fits for (a) S3 and (b) S4.

Figure 6.
Comparison of rheological model fits for (a) S5 and (b) S6.

Figure 7.
Apparent viscosity at a constant shear rate of 400 s−1 as a function of the D-value ratio of the large (dL) and small (dS) particles.
Figure 7.
Apparent viscosity at a constant shear rate of 400 s−1 as a function of the D-value ratio of the large (dL) and small (dS) particles.

Figure 8.
Pipe pressure loss analysis of the Herschel–Bulkley model for S4 and S6.

Figure 9.
Axial laminar velocity profiles that were calculated based on different rheological models.
Figure 9.
Axial laminar velocity profiles that were calculated based on different rheological models.

Table 1.
Elemental composition of the CPS samples.
| Element | Concentration (wt.%) | |||||
|---|---|---|---|---|---|---|
| S1 | S2 | S3 | S4 | S5 | S6 | |
| Bone phosphate of lime (BPL) | 64.5 | 64.7 | 64.4 | 64.8 | 66.0 | 65.0 |
| CO2 | 7.6 | 7.6 | 7.0 | 7.7 | 7.8 | 7.7 |
| SiO2 | 3.23 | 3.35 | 3.62 | 3.16 | 3.34 | 3.71 |
| MgO | 0.80 | 0.74 | 0.96 | 0.83 | 0.66 | 0.62 |
| Al2O3 | 0.46 | 0.41 | 0.46 | 0.44 | 0.40 | 0.47 |
| Reactive SiO2 | 1.43 | 1.24 | 1.19 | 1.29 | 1.27 | 1.06 |
Table 2.
Constant parameters for rheological models.
| Model | Rheological Parameters | Test Samples | |||||
|---|---|---|---|---|---|---|---|
| S1 | S2 | S3 | S4 | S5 | S6 | ||
| Bingham | (Pa) | 5.54 | 3.81 | 6.75 | 4.47 | 16.8 | 18.92 |
| (Pa·s) | 0.024 | 0.02 | 0.037 | 0.03 | 0.051 | 0.061 | |
| Casson | (Pa) | 4.42 | 2.56 | 5.29 | 3.27 | 12.86 | 14.8 |
| (Pa.s) | 0.01 | 0.012 | 0.017 | 0.017 | 0.019 | 0.022 | |
| Herschel–Bulkley | (Pa) | 1.36 | 0.89 | 1.32 | 0.82 | 3.21 | 3.7 |
| K (Pa·sn) | 0.75 | 0.395 | 1.032 | 0.6 | 2.98 | 3.56 | |
| n | 0.51 | 0.6 | 0.52 | 0.58 | 0.42 | 0.42 | |
| Robertson–Stiff | K (Pa·sn) | 0.99 | 0.5 | 1.28 | 0.72 | 3.87 | 4.56 |
| n | 0.47 | 0.56 | 0.49 | 0.56 | 0.39 | 0.39 | |
| (s−1) | 6.63 | 3.84 | 1.32 | 0.82 | 3.22 | 3.7 | |
| (Pa) | 2.40 | 1.06 | 1.66 | 0.65 | 6.1 | 7.5 | |
Table 3.
Statistical indicators.
| Model | Statistical Indicators | Test Samples | |||||
|---|---|---|---|---|---|---|---|
| S1 | S2 | S3 | S4 | S5 | S6 | ||
| Bingham | R2 | 0.97 | 0.98 | 0.96 | 0.95 | 0.92 | 0.9 |
| SSE | 12.16 | 9.58 | 51.11 | 36.01 | 210.14 | 356.49 | |
| RMSE | 0.67 | 0.59 | 1.37 | 1.15 | 2.79 | 3.63 | |
| Casson | R2 | 0.99 | 0.99 | 0.98 | 0.98 | 0.95 | 0.93 |
| SSE | 3.94 | 3.87 | 29.94 | 21.22 | 137.33 | 252.25 | |
| RMSE | 0.38 | 0.37 | 1.053 | 0.88 | 2.25 | 3.05 | |
| Herschel–Bulkley | R2 | 0.99 | 0.99 | 0.99 | 0.99 | 0.98 | 0.97 |
| SSE | 0.48 | 0.93 | 6.28 | 5.41 | 44.9 | 93.8 | |
| RMSE | 0.13 | 0.18 | 0.48 | 0.44 | 1.28 | 1.86 | |
| Robertson–Stiff | R2 | 0.99 | 0.99 | 0.99 | 0.99 | 0.98 | 0.97 |
| SSE | 0.52 | 0.97 | 5.25 | 4.79 | 40.4 | 86.74 | |
| RMSE | 0.14 | 0.19 | 0.44 | 0.42 | 1.22 | 1.79 | |
Publisher’s Note: MDPI stays neutral with regard to jurisdictional claims in published maps and institutional affiliations. |
© 2021 by the authors. Licensee MDPI, Basel, Switzerland. This article is an open access article distributed under the terms and conditions of the Creative Commons Attribution (CC BY) license (https://creativecommons.org/licenses/by/4.0/).
Share and Cite
MDPI and ACS Style
Maazioui, S.; Maazouz, A.; Benkhaldoun, F.; Ouazar, D.; Lamnawar, K. Rheological Characterization of a Concentrated Phosphate Slurry. Fluids 2021, 6, 178. https://0-doi-org.brum.beds.ac.uk/10.3390/fluids6050178
AMA Style
Maazioui S, Maazouz A, Benkhaldoun F, Ouazar D, Lamnawar K. Rheological Characterization of a Concentrated Phosphate Slurry. Fluids. 2021; 6(5):178. https://0-doi-org.brum.beds.ac.uk/10.3390/fluids6050178
Chicago/Turabian StyleMaazioui, Souhail, Abderrahim Maazouz, Fayssal Benkhaldoun, Driss Ouazar, and Khalid Lamnawar. 2021. "Rheological Characterization of a Concentrated Phosphate Slurry" Fluids 6, no. 5: 178. https://0-doi-org.brum.beds.ac.uk/10.3390/fluids6050178