
PIV-Measurements of Centrifugal Instabilities in a Rectangular Curved Duct with a Small Aspect Ratio


Department of Mechanical Engineering, Khalifa University, Abu Dhabi P.O. Box 127788, United Arab Emirates
*
Author to whom correspondence should be addressed.
Fluids 2021, 6(5), 184; https://0-doi-org.brum.beds.ac.uk/10.3390/fluids6050184
Submission received: 17 March 2021
/
Revised: 26 April 2021
/
Accepted: 9 May 2021
/
Published: 13 May 2021
(This article belongs to the Collection Complex Fluids)
Abstract
:In this study, experimental measurements were undertaken using non-intrusive particle image velocimetry (PIV) to investigate fluid flow within a 180° rectangular, curved duct geometry of a height-to-width aspect ratio of 0.167 and a curvature of 0.54. The duct was constructed from Plexiglas to permit optical access to flow pattern observations and flow velocity field measurements. Silicone oil was used as working fluid because it has a similar refractive index to Plexiglas. The measured velocity fields within the Reynolds number ranged from 116 to 203 and were presented at the curved channel section inlet and outlet, as well as at the mid-channel height over the complete duct length. It was observed from spanwise measurements that the transition to unsteady secondary flows generated the creation of wavy structures linked with the formation of Dean vortices close to the outer channel wall. This flow structure became unsteady with increasing Reynolds number. Simultaneously, the presence of Dean vortices in the spanwise direction influenced the velocity distribution in the streamwise direction. Two distinct regions defined by a higher velocity distribution were observed. Fluid particles were accelerated near the inner wall of the channel bend and subsequently downstream near the outer channel wall.
1. Introduction
The transport of fluid in closed conduits, having a strong curvature, represents key element in several engineering applications such as the design of fuel cells [1], heat exchangers [2], chemical mixers [3], and gas turbine blades [4]. When a steady laminar flow passes through a 180° bend, small disturbances are developed and lead to a three-dimensional unsteady flow. Flow instability is therefore created, and it is characterized by structured vortices that comprise secondary flow. Such patterns can enhance convective heat transfer inside the geometry as the fluid is mixed or conversely decrease the efficiency of the fluid transport.
The first significant work on fluid flow through curved geometry ducts can be credited to Couette [5] and his experimental observations on the flow between rotating cylinders. By measuring the viscosity with the torque effect of rotating cylinders, a discontinuity on viscosity measurements was exposed. Later, Taylor [6] compared experimental observations with specific predictions from the Navier–Stokes equations for instabilities in this geometry. This analysis succeeded at both explaining and predicting the instability appearing in curved geometries. A subsequent theoretical study presented by Dean [7] was directly inspired by Taylor’s findings, as the analysis geometry was made of two concentric cylinders. In Dean’s work, fluid motion was not induced by the rotation but instead by a pressure gradient for which a new procedure to resolve the Navier–Stokes equations and find stream lines motion was introduced. Dean defined a new parameter to characterize the occurrence of instabilities in curved pipes, which depends on the pipe geometry and flow conditions; this is termed the Dean number:
where channel curvature (β) and Reynolds number (Re) and are defined in Equations (3) and (5), respectively.
The characteristics of Dean instability in circular curved pipes have been extensively studied via theoretical, numerical, and experimental analyses [8,9,10,11,12,13]. In order to study the effect of geometry on Dean instability, a significant number of studies have been focused on flow in curved rectangular ducts [14,15,16,17,18,19,20]. From such studies, it has been observed that both channel aspect (Γ) and curvature (β) ratios have strong influence on Dean instability [14,15]. Despite a significant number of published studies, Dean instability in a curved channel is still a relevant topic in ongoing research. For example, Boutabaa et al. [21] numerically studied three-dimensional Dean vortices and observed the presence of two steady Dean cells in a square duct. They also observed that when centrifugal forces became significant, the flow pattern was characterized by a four-cell pattern. Similar numerical results in square curved ducts were presented by Wu et al. [22]. They reported the presence of multiple secondary flow patterns in the presence of a negative pressure gradient, i.e., flow separation. Yamamoto et al. [23,24] theoretically and experimentally studied the Taylor–Dean flow through square ducts. They characterized both Dean vortices in fixed walls and Taylor–Dean vortices when the inner wall was moving. The numerical results of Yamamoto et al. [23] showed that secondary flow consists of two, four, eight, or even non-symmetric vortices in a cross section region, depending on the speed and the direction of inner wall rotation. Subsequently, Yamamoto et al. [24] experimentally identified several types of secondary flow patterns and proposed a new flow pattern diagram for mapping (or classifying) all observed flow patterns. Norouzi et al. [25] developed an analytical solution for Dean flow in curved ducts with rectangular cross sections for which a perturbation method was used to solve the applicable governing equations. In their study, channel curvature was considered as the perturbation parameter. Using a perturbation method, they obtained analytically the main flow velocity, stream function of lateral velocities (secondary flows), and pressure drop in curved pipes. Yanase et al. [26] numerically investigated the characteristics of laminar flow through a curved rectangular duct using a spectral method. They placed emphasis on the bifurcation of the solution and observed, depending on channel aspect ratio, 2–12 secondary vortex solutions. Facao and Oliveria [27] and Chandratilleke et al. [28] numerically investigated the influence of secondary vortex motion on convective heat transfer processes. Both studies observed that secondary flow could significantly improve the heat transfer due to the interaction between Dean vortices with buoyancy force arising from the heated wall. For more complex curved rectangular ducts geometries with continuously varying curvature, Li et al. [29] conducted an experimental and numerical study to investigate the flow characteristics. The results revealed complex changes in the flow pattern with respect to both the flow and geometric parameters (Reynolds number, curvature, and aspect ratios) in terms of the onset, development, and disappearance of different types of the Dean vortex. In addition, it was found that flow development in ducts with continuously varying curvatures is quite different from that in conventional curved ducts with constant curvatures. Most published studies related to flow through curved rectangular ducts have focused on channel height-to-width aspect ratios (Γ) equal to or greater than one. However, to the authors’ knowledge, only a limited number of studies have focused on small channel aspect ratios (Γ < 3) where the centrifugal forces act along the largest dimension [16,20]. Humphrey et al. [16] investigated flow stability for curved channel aspect ratios (1/3 < Γ < 3) in 90° bends. Their experimental results confirmed and quantified that the location of maximum velocity moves from the center of the duct to the outer wall. Gauthier et al. [20] experimentally investigated the impact of the smaller channel geometry aspect ratios (1/40 < Γ < 1/3) on the development of secondary flow structures. The core flow was found to be three-dimensional in square or circular curved ducts, and streamwise vortices were observed above the critical Reynolds number. Gauthier et al. [20] identified the critical Reynolds number (Rec = 135.4) to be function of the curved duct dimensions and concluded that the threshold of the instabilities was controlled by the Dean number. Their experimental results were based on the qualitative observations of flow instabilities using digital photography techniques.
In this study, experimental measurements are undertaken to investigate fluid flow in curved geometries using particle image velocimetry (PIV) to provide quantitative data. The selected duct geometry was based on Gauthier’s et al. [20] design, namely 180° rectangular, curved duct geometry of a height-to-width aspect ratio Γ = 0.167 and a curvature of β = 0.54. To the authors’ knowledge, quantitative measurements of velocity distribution illustrating the Dean instability in rectangular, curved channels with small aspect ratios (Γ < 1) are missing in the literature.
2. Experimental Conditions
The channel geometry shown in Figure 1 consisted of two plates of transparent Plexiglas (acrylic), where one had a machined U-shape geometry profile. The dimension of the channel was 250 mm long, 60 mm wide, and 10 mm high. The fluid entered a rectangular cross-section divergent manifold duct with six outlet holes of 8 mm in diameter, followed by a flow straightener to ensure that the inlet flow to the channel was both uniform and laminar. After 200 mm of a straight rectangular duct section, the fluid entered the 180° curvature bend. The inner radius was fixed at R1 = 25 mm, the outer radius was fixed at R2 = 85 mm, and the duct width was fixed at 60 mm. The channel aspect (Γ = 0.167) and curvature (β = 0.54) ratios are defined as:
The channel outlet section had five holes of 8 mm in diameter that were equally spaced. The use of Plexiglas allowed for the visualization of the flow and permitted the laser light to be transmitted with limited refraction effects. Furthermore, the channel internal and external walls were polished to remove all possible manufacturing defaults such as scratches. Laminar flow was generated by a pump with a maximum volumetric flow rate (Q) of 30 (L/min). The channel flow rate was measured using a digital flow meter (RS 511-3892) and regulated using a gate valve fitted after the pump outlet. The average channel flow velocity is defined by:
The working fluid was silicone oil (Dow Corning DC556, DOW, Midland, MI, USA) with a refractive index of 1.46, which was close to the Plexiglas refractive index of 1.48. The fluid was maintained at a constant temperature of 60 °C with a specified kinematic viscosity (ν) of 1.384 × 10⁻⁵ m2/s.
Flow Visualization
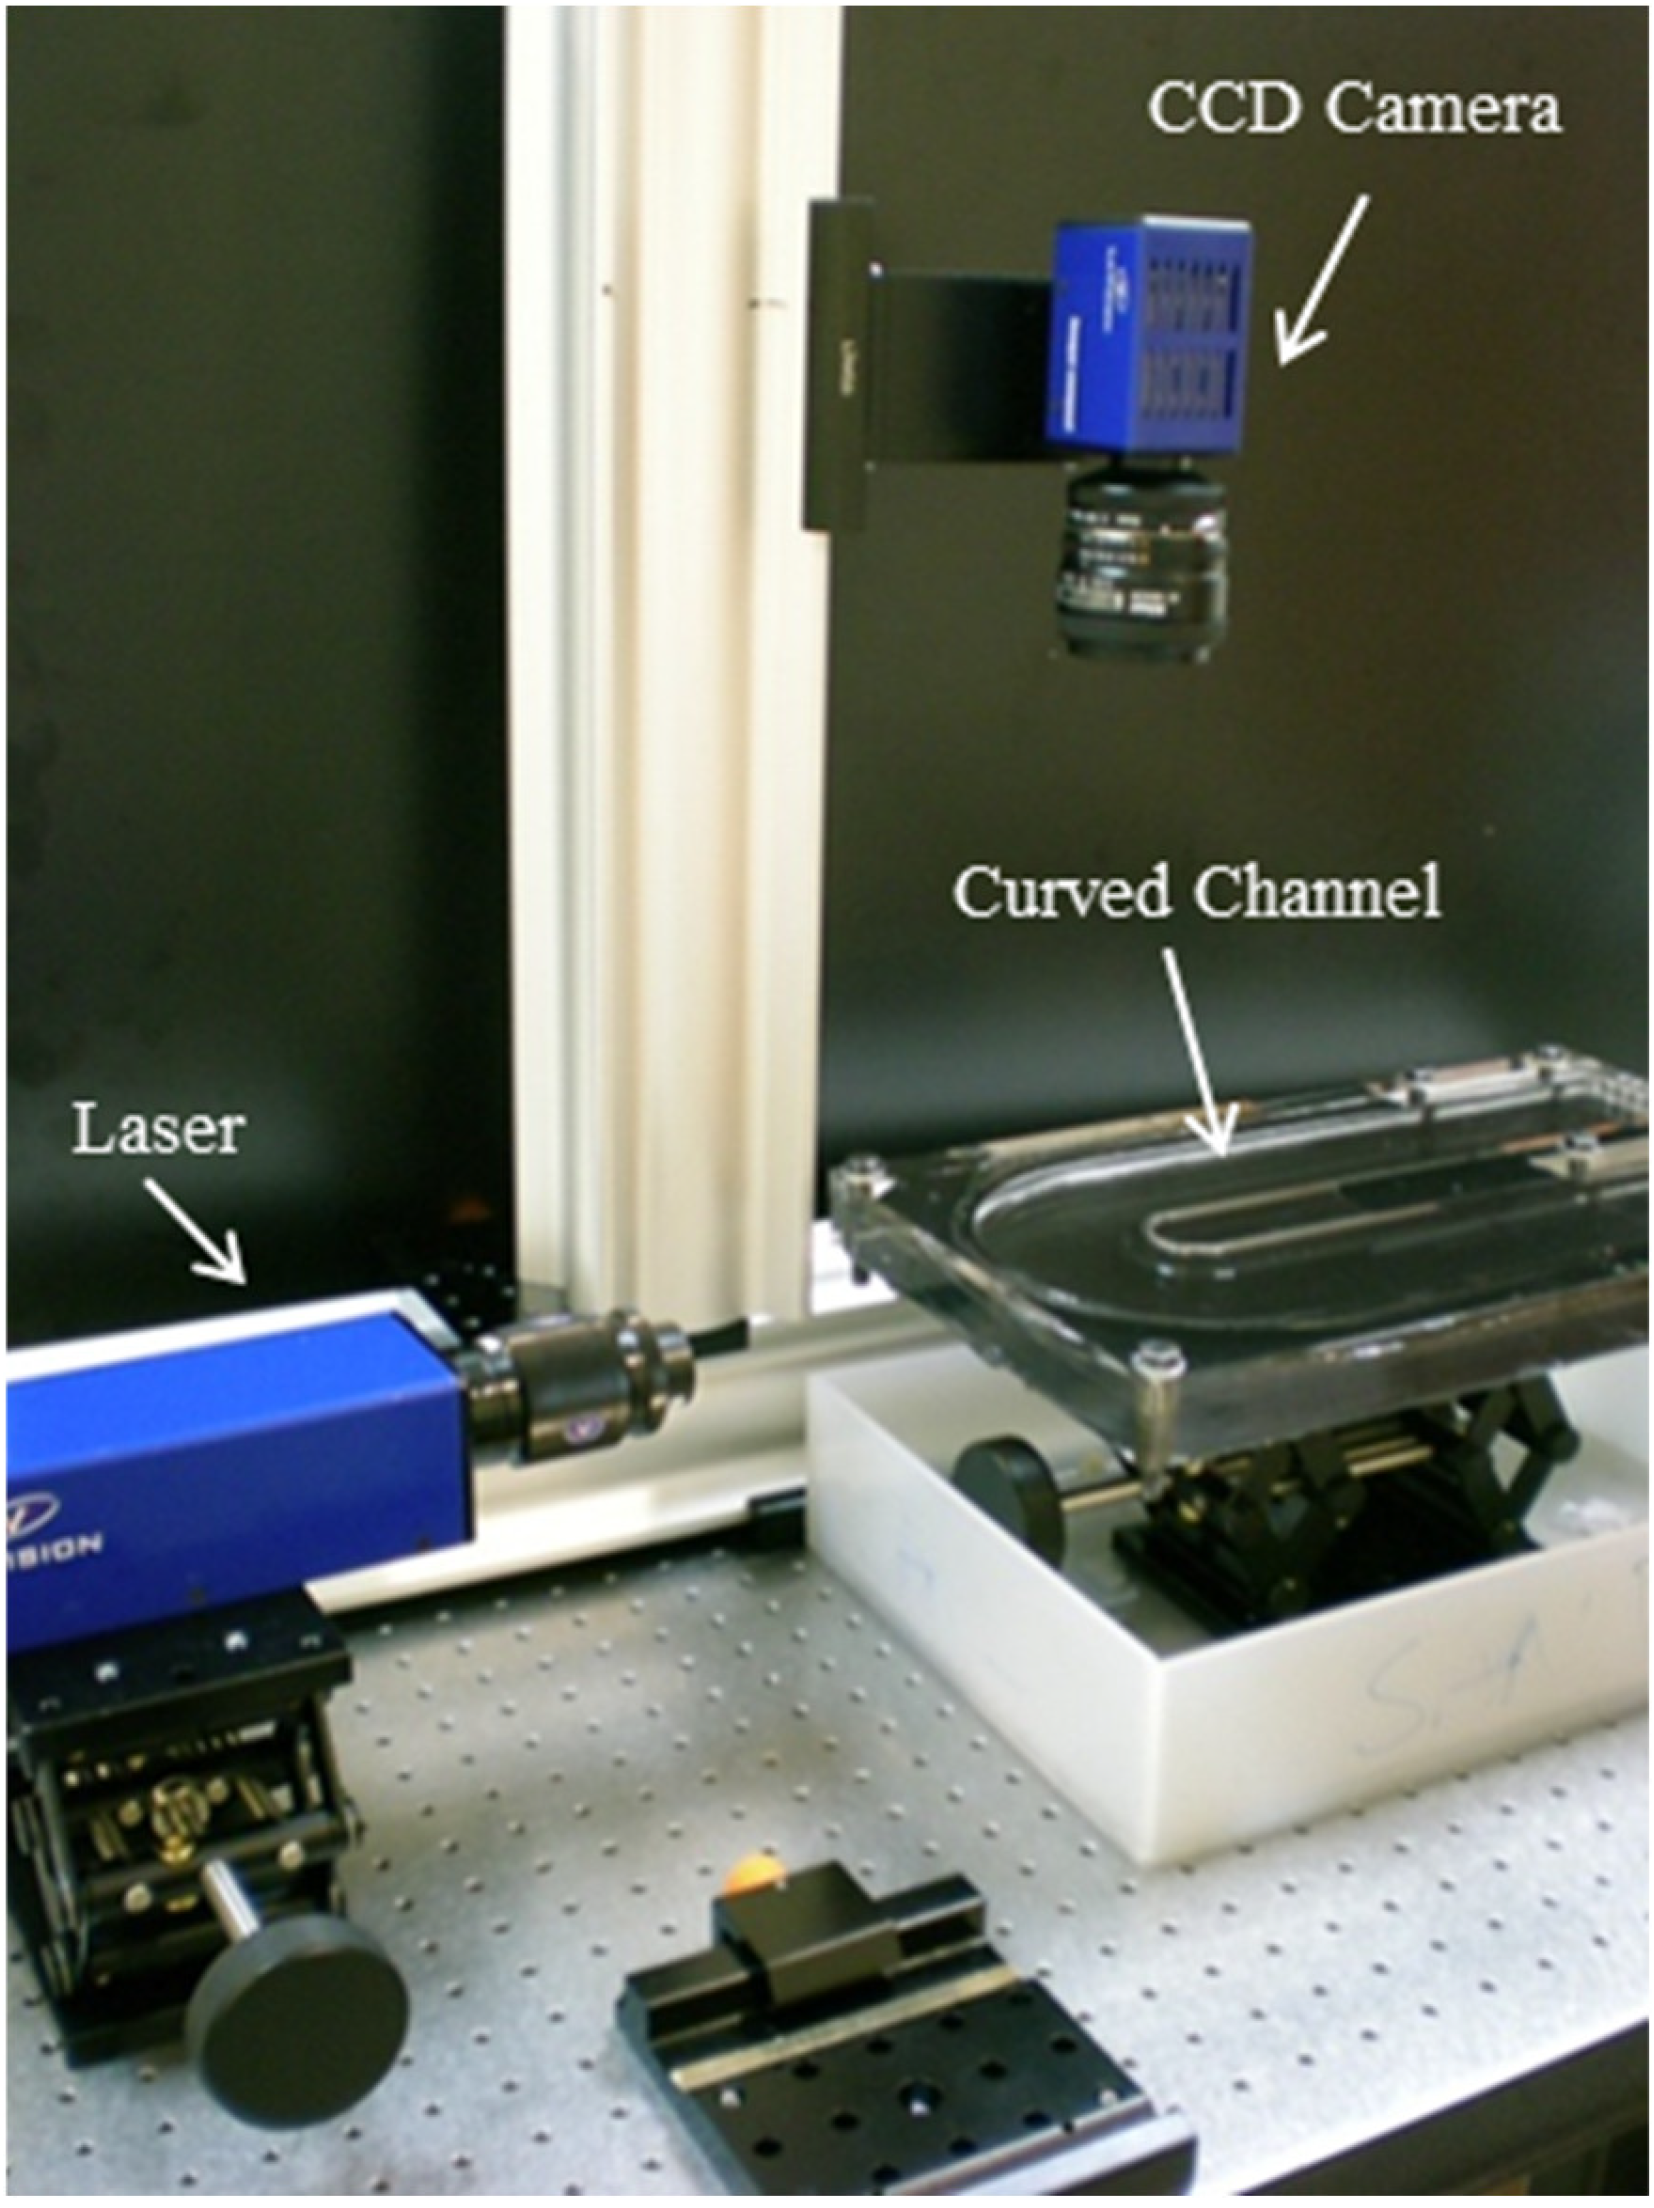
To obtain quantitative visualizations of the flow field structures, PIV was employed using the experimental setup illustrated in Figure 2. All flow field measurements were taken with a projected laser sheet, and a charge coupled device (CCD) camera installed perpendicular to this plane was used to record fluid motion. To visualize the flow, polyamide particles tracers with a diameter of 10 μm and a density of 1.016 g/cm3 were seeded in silicone oil. PIV measurements were performed in two directions: (i) along the channel length and (ii) in the cross-section. For each case, the CCD camera and the laser were placed in different setups. The flow was observed with a field of view of 250 × 120 mm2. A diode laser was used as the light source for PIV measurements, with a maximum power output of 200 W at a wavelength of 532 nm. A cylindrical lens (focal length of 28 mm) was used to generate a light sheet of approximately 1 mm in thickness. The synchronization between the laser light pulses and the camera was accomplished by transistor–transistor logic pulses from the synchronizer. For each Reynolds number under analysis (116–203), 100 images were recorded using the PIV system. The time between each couple of images was 200 ms. The pulse separation time was adjusted between 1 and 3 ms depending on the Reynolds number. Full-frame images of 1024 × 820 pixels were acquired and transferred to a computer via a frame grabber.
Using the DAVIS FLOWMASTER software provided by the LaVision System (Göttingen, Germany), the 2D PIV image was divided into 16 × 16 pixel-sized sub-regions using a multigrid correlation process with a 50% overlap. The average particle velocities were calculated using 100 images and the cross correlation method. The spurious vectors calculated and based on the local median filtering were less than 3%. No smoothing data were used for the velocity calculation of the reattachment zone. Steady flow data were post-processed by the PIV software using the sum of correlation function, whereas for unsteady cases, one couple of images was chosen as representative of an instantaneous flow pattern. PIV measurement accuracy can be influenced by a range of error sources that include tracer density, particle displacement, velocity gradients in the interrogation windows, the background noise of the recordings, and the quantization level of the camera. In a study by Raffle et al. [30], a detailed discussion of the influence of such error sources was given. Additionally, near-wall measurements using PIV are often difficult and characterized by large errors and uncertainties due to potential difficulties encountered with light scattering from wall boundaries and a lack of seed particles in the near-wall region. Error analysis assessment was based on comparing the mean velocity measured using PIV and the digital flow meter described in the previous section. Velocity measurement uncertainty was quantified to be less than 7% based on comparing the average velocity derived from the PIV-measured velocity profile with the corresponding measured flow rate.
3. Experimental Results
3.1. Experimental Validation
A uniform laminar flow is characterized by a constant Reynolds number defined in the same manner as Gauthier et al. [20]:
where is the averaged flow velocity, h is the channel height, and ν is the silicone oil kinematic viscosity.
According to Gauthier et al. [20], flow instability appears after a critical Reynolds number (Rec), which is dependent upon the channel curvature β:
Based on a curvature of 0.54 for the geometry under analysis, the critical Reynolds number value characterizing the onset of flow instabilities was found to be Rec = 135.4. To assess the relationship between different flow systems and this critical Reynolds number, experimental results are presented for four different Reynolds numbers (116, 136, 151, and 203). For each Reynolds number, the velocity profile in the streamwise direction was measured in a location after the entrance length and before the curve entrance (x = 120 mm). The flow velocity, at a given spanwise location in a rectangular duct, was approximated with the following analytical solution (Ebadian and Dong [31]):
where y* = y⁄W is the non-dimensional spanwise width position (starting from the center of the duct), W is (R2 − R1), and m is a calculated coefficient:
Both the measured and predicted velocity profiles are presented in Figure 3. The overall trend of the measured velocity profiles matched well with corresponding analytical predictions. For below and near the instability threshold (Re = 116, 136, and 151), it was observed that the entrance velocity profile was almost flat, with a small deviation from the corresponding analytical prediction. This discrepancy was within 7% of the error obtained from the PIV measurements and was therefore considered as negligible in this study. However, the measured velocity profile for Re = 203 represented a disturbance around an average value, with a mean constant velocity comparable to the predicted profile.
3.2. Two-Dimensional Velocity Distributions
To observe the flow behavior near the instability predicted by Gauthier et al. [20], the measured velocity vectors in the x–y plane at h/2 are presented in Figure 4 for a Reynolds number of Re = 136, which was slightly higher than the critical Reynolds number (Rec = 135.4). The color velocity contour was superimposed on the velocity vector field to provide a visualization of the directions and value of the particles velocities.
The velocity distribution upstream of the channel bend entrance was uniform, with a constant value of 0.37 m/s. The flow entered the channel bend (θ = 0°) with an upstream uniform velocity profile, but the geometry affected the flow by creating high velocity near the inner wall. A gradient of velocity was observed, with its highest value near the inner wall (0.4 m/s) and its lowest value near the outer wall (0.1 m/s). As the flow progressed through the curvature, the region of highest velocity was also changing and approaching the outer wall of the channel.
At the outlet of the channel curvature (θ = 180°), the velocity distribution represented an opposite pattern compared to the inlet region (θ = 0°), with the highest value near the outer wall and the lowest value near the inner wall. This trend was amplified as the flow reached the outlet region of the straight channel. This result clearly showed that the instabilities appearing near the outlet channel were originally created in the curvature region and were due to the presence of the velocity gradient and its propagation along the curvature of the channel.
3.3. Flow Pattern along the Curved Channel
Figure 5 presents the evolution of the averaged two-dimensional flow velocity pattern with an increasing Reynolds number on exiting the channel bend (θ > 90°). A steady flow condition at Re = 116 is shown in Figure 5a. The flow regained a smooth pattern containing a region of the highest velocity (red color) that was deviated from inner wall towards the outer wall. At this Reynolds number (Re < Rec), the bend geometry only created a velocity gradient. Figure 5b shows to the velocity distribution of the fluid flow near the critical Reynolds number (Re = 136). At this flow regime, the flow arrived at the bend section with an upstream uniform velocity. However, at the bend section, velocity peaked near the inner wall, representing an approximately 20% increase. The most interesting observation of this flow regime was the velocity pattern on exiting region of the bend, which was characterized by small disturbances and color changes near the highest velocity region. The velocity pattern was not smooth compared to the previous case (at Re = 116), and signs of instability were clearly seen in the two-dimensional velocity distributions that showed the transition between steady and unsteady flows. Regarding the unsteady systems, Re > 136, the same phenomenon can be observed in Figure 5c,d, with the presence of a large velocity gradient close to the outer wall at the outlet of the channel bend.
3.4. Spanwise Velocity Distribution
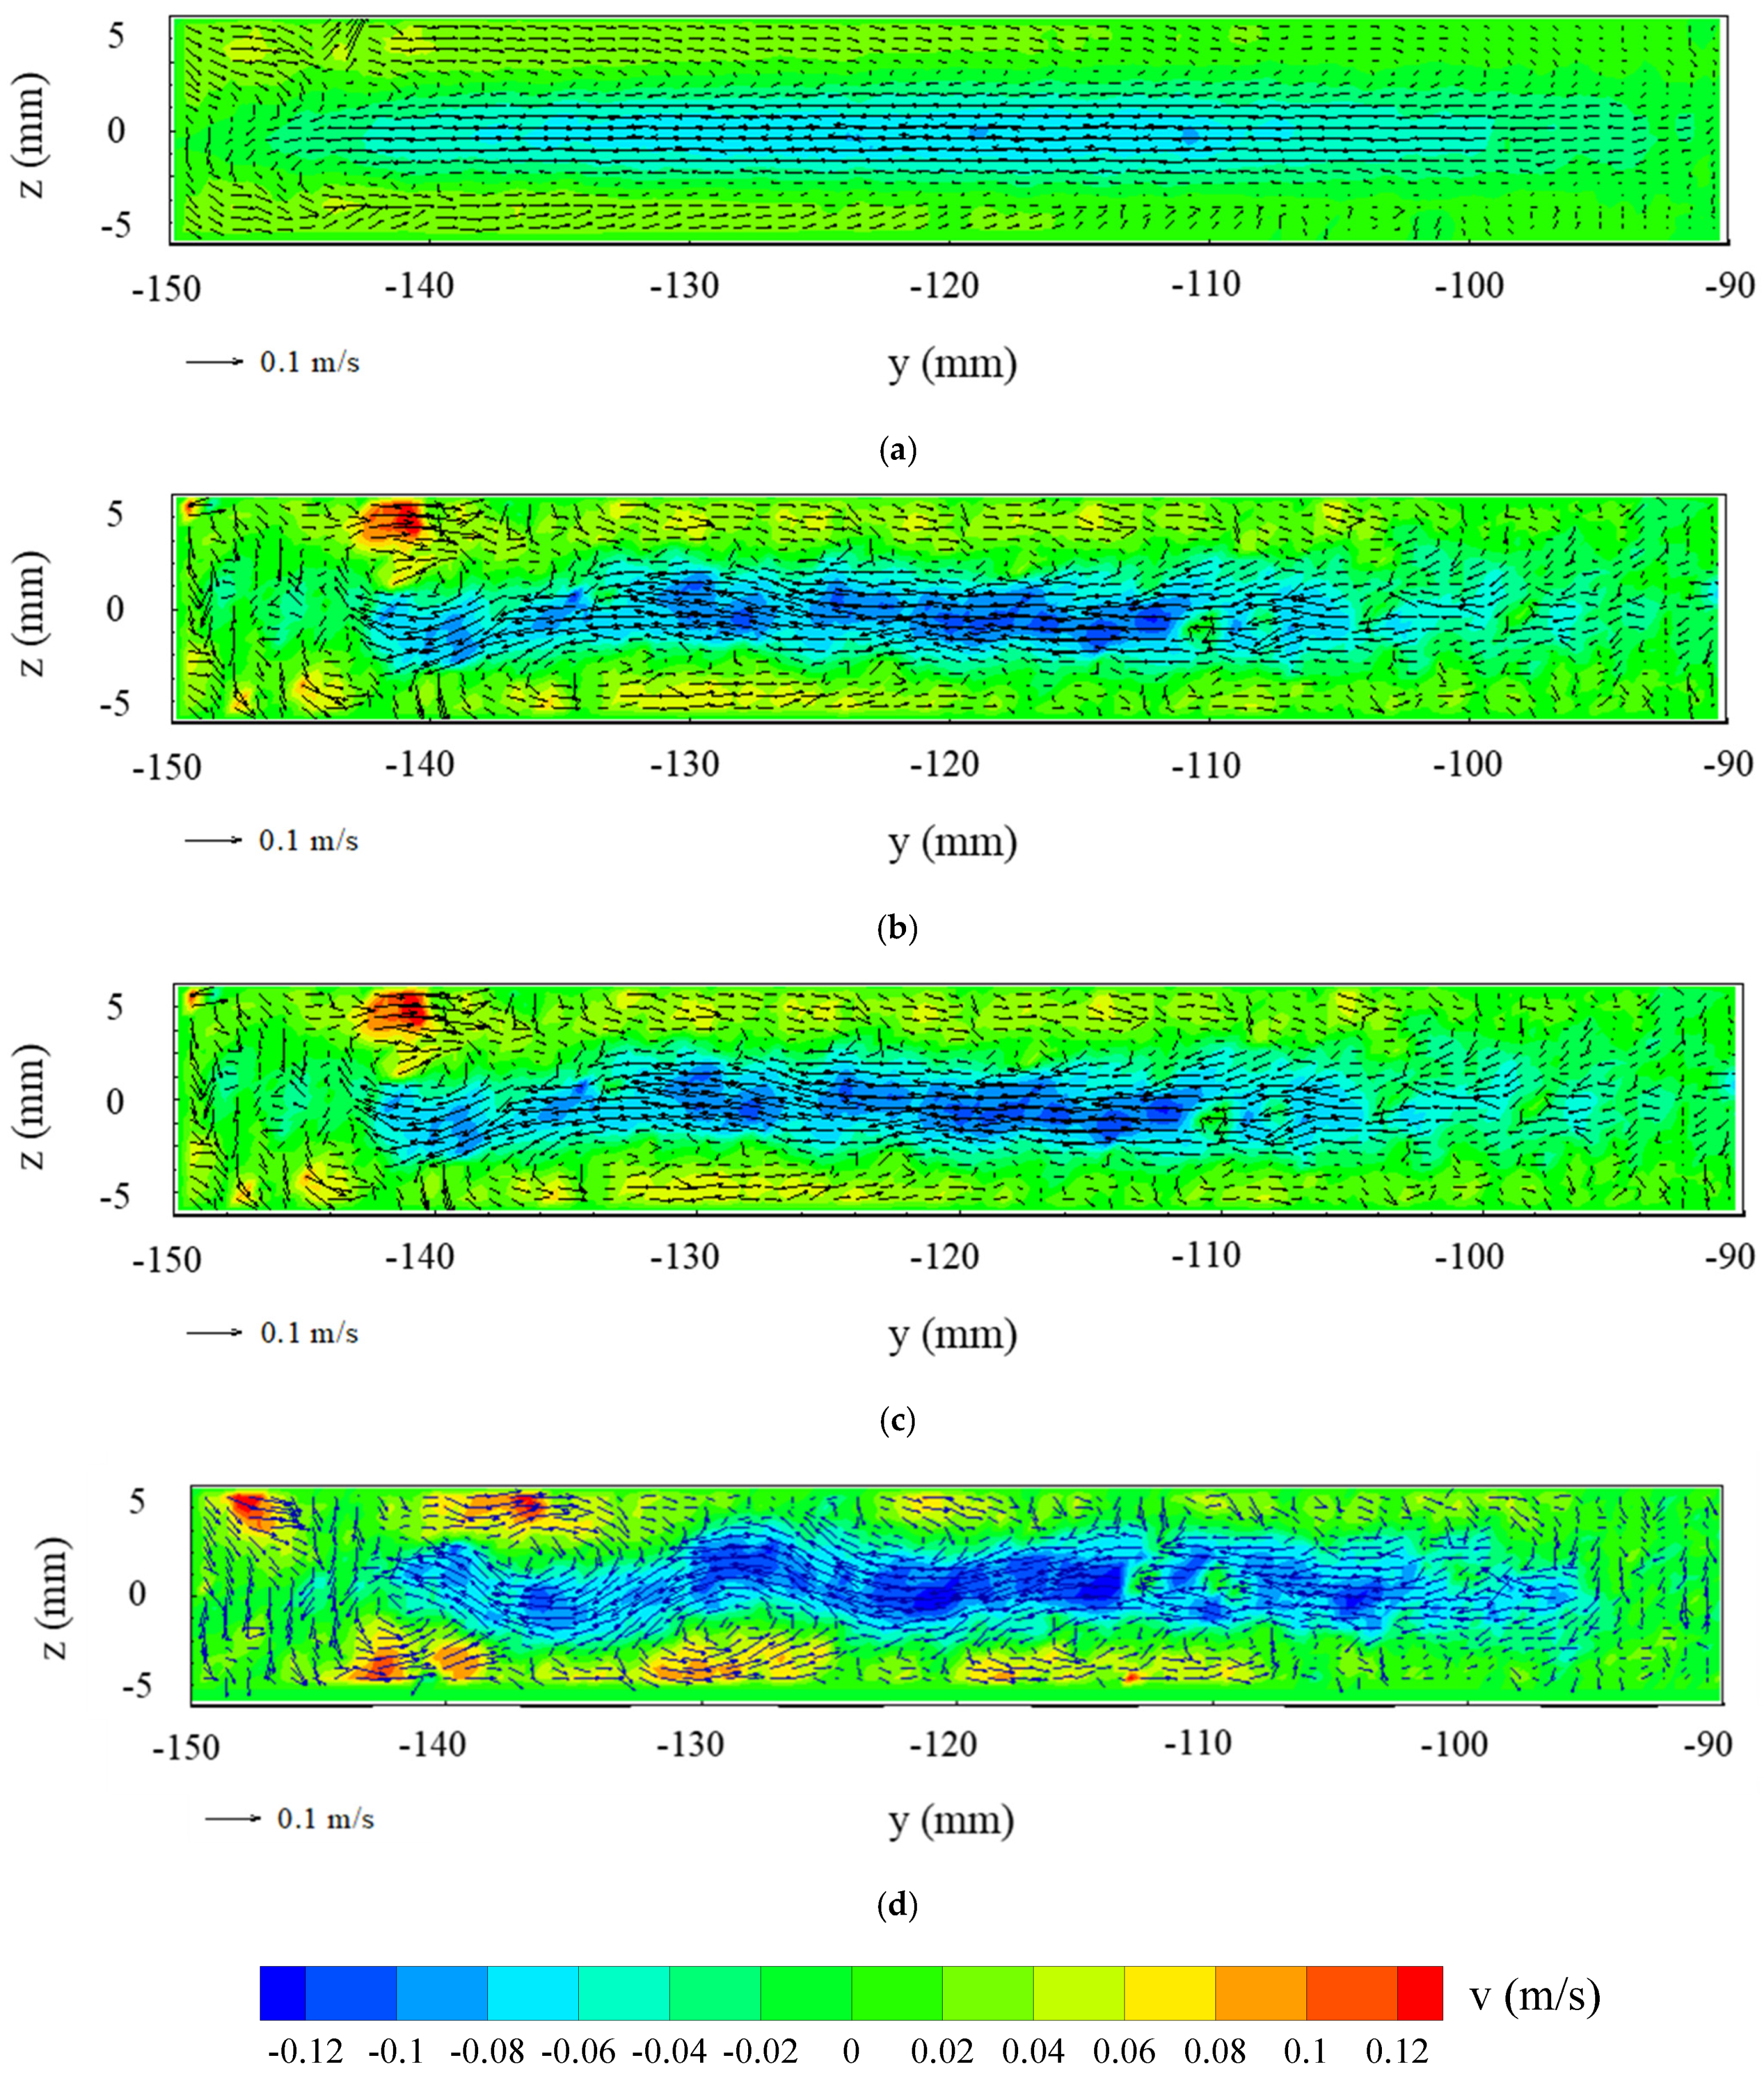
One of the present study’s objectives was to visualize velocity distribution of Dean vortices using the PIV technique. The vertical section at the outlet of the bend was chosen for the measurements of Dean vortices at the outlet of the channel bend (θ = 180°). For each Reynolds number, instantaneous, two-dimensional velocity distribution and corresponding color velocity contour are presented in Figure 6. Steady flow conditions (Re = 116) corresponding to Reynolds number below the critical value (Re = 135.4) are shown in Figure 6a. Two horizontal and steady recirculating cells filling the entire cross section of the channel were observed. The value of the velocity was higher in the center region of the cross section with a negative sign (inner to outer wall direction). Near the bottom and top walls, flow was in the opposite direction (positive) with a very smaller value. This was an indication of the Dean vortices, and velocity distribution was in good agreement with the flow pattern observed by Guathier et al. [20]. It is also important to note that near the outer wall (0 < y < 10 mm), the velocity magnitude was higher than that of the inner wall (50 < y < 60 mm) with the start of disturbances in vector directions.
When the Reynolds number reached the critical value Re = 136, as is shown in Figure 6b, the magnitude of the velocity was increased and the small disturbances observed in Figure 6a were now transformed to 5-mm-diameter recirculating vortices propagating near walls from the outer to the inner wall. For higher Reynolds numbers (Re = 151 and 203), the fluid flow circulated in a wave motion with an approximate wavelength of 1.3 × h. Small vortices with a larger size and a higher velocity magnitude were created near the outer wall and were propagated in the opposite direction of the flow reaching the inner wall.
Wave evolution with time is shown in Figure 7, where velocity vectors are plotted as a function of time in increments of 0.2 s. For the case of Re = 203, the waves had a moving portion and two vortices appeared at the disappearance of waves close to the outer wall. The wavelength of the fluid flow was approximately 13 mm. The size of each vortex was between 7 and 10 mm, and approximately five vortices were generated near the outer wall, propagating in the direction opposite to the flow and vanishing near the inner wall.
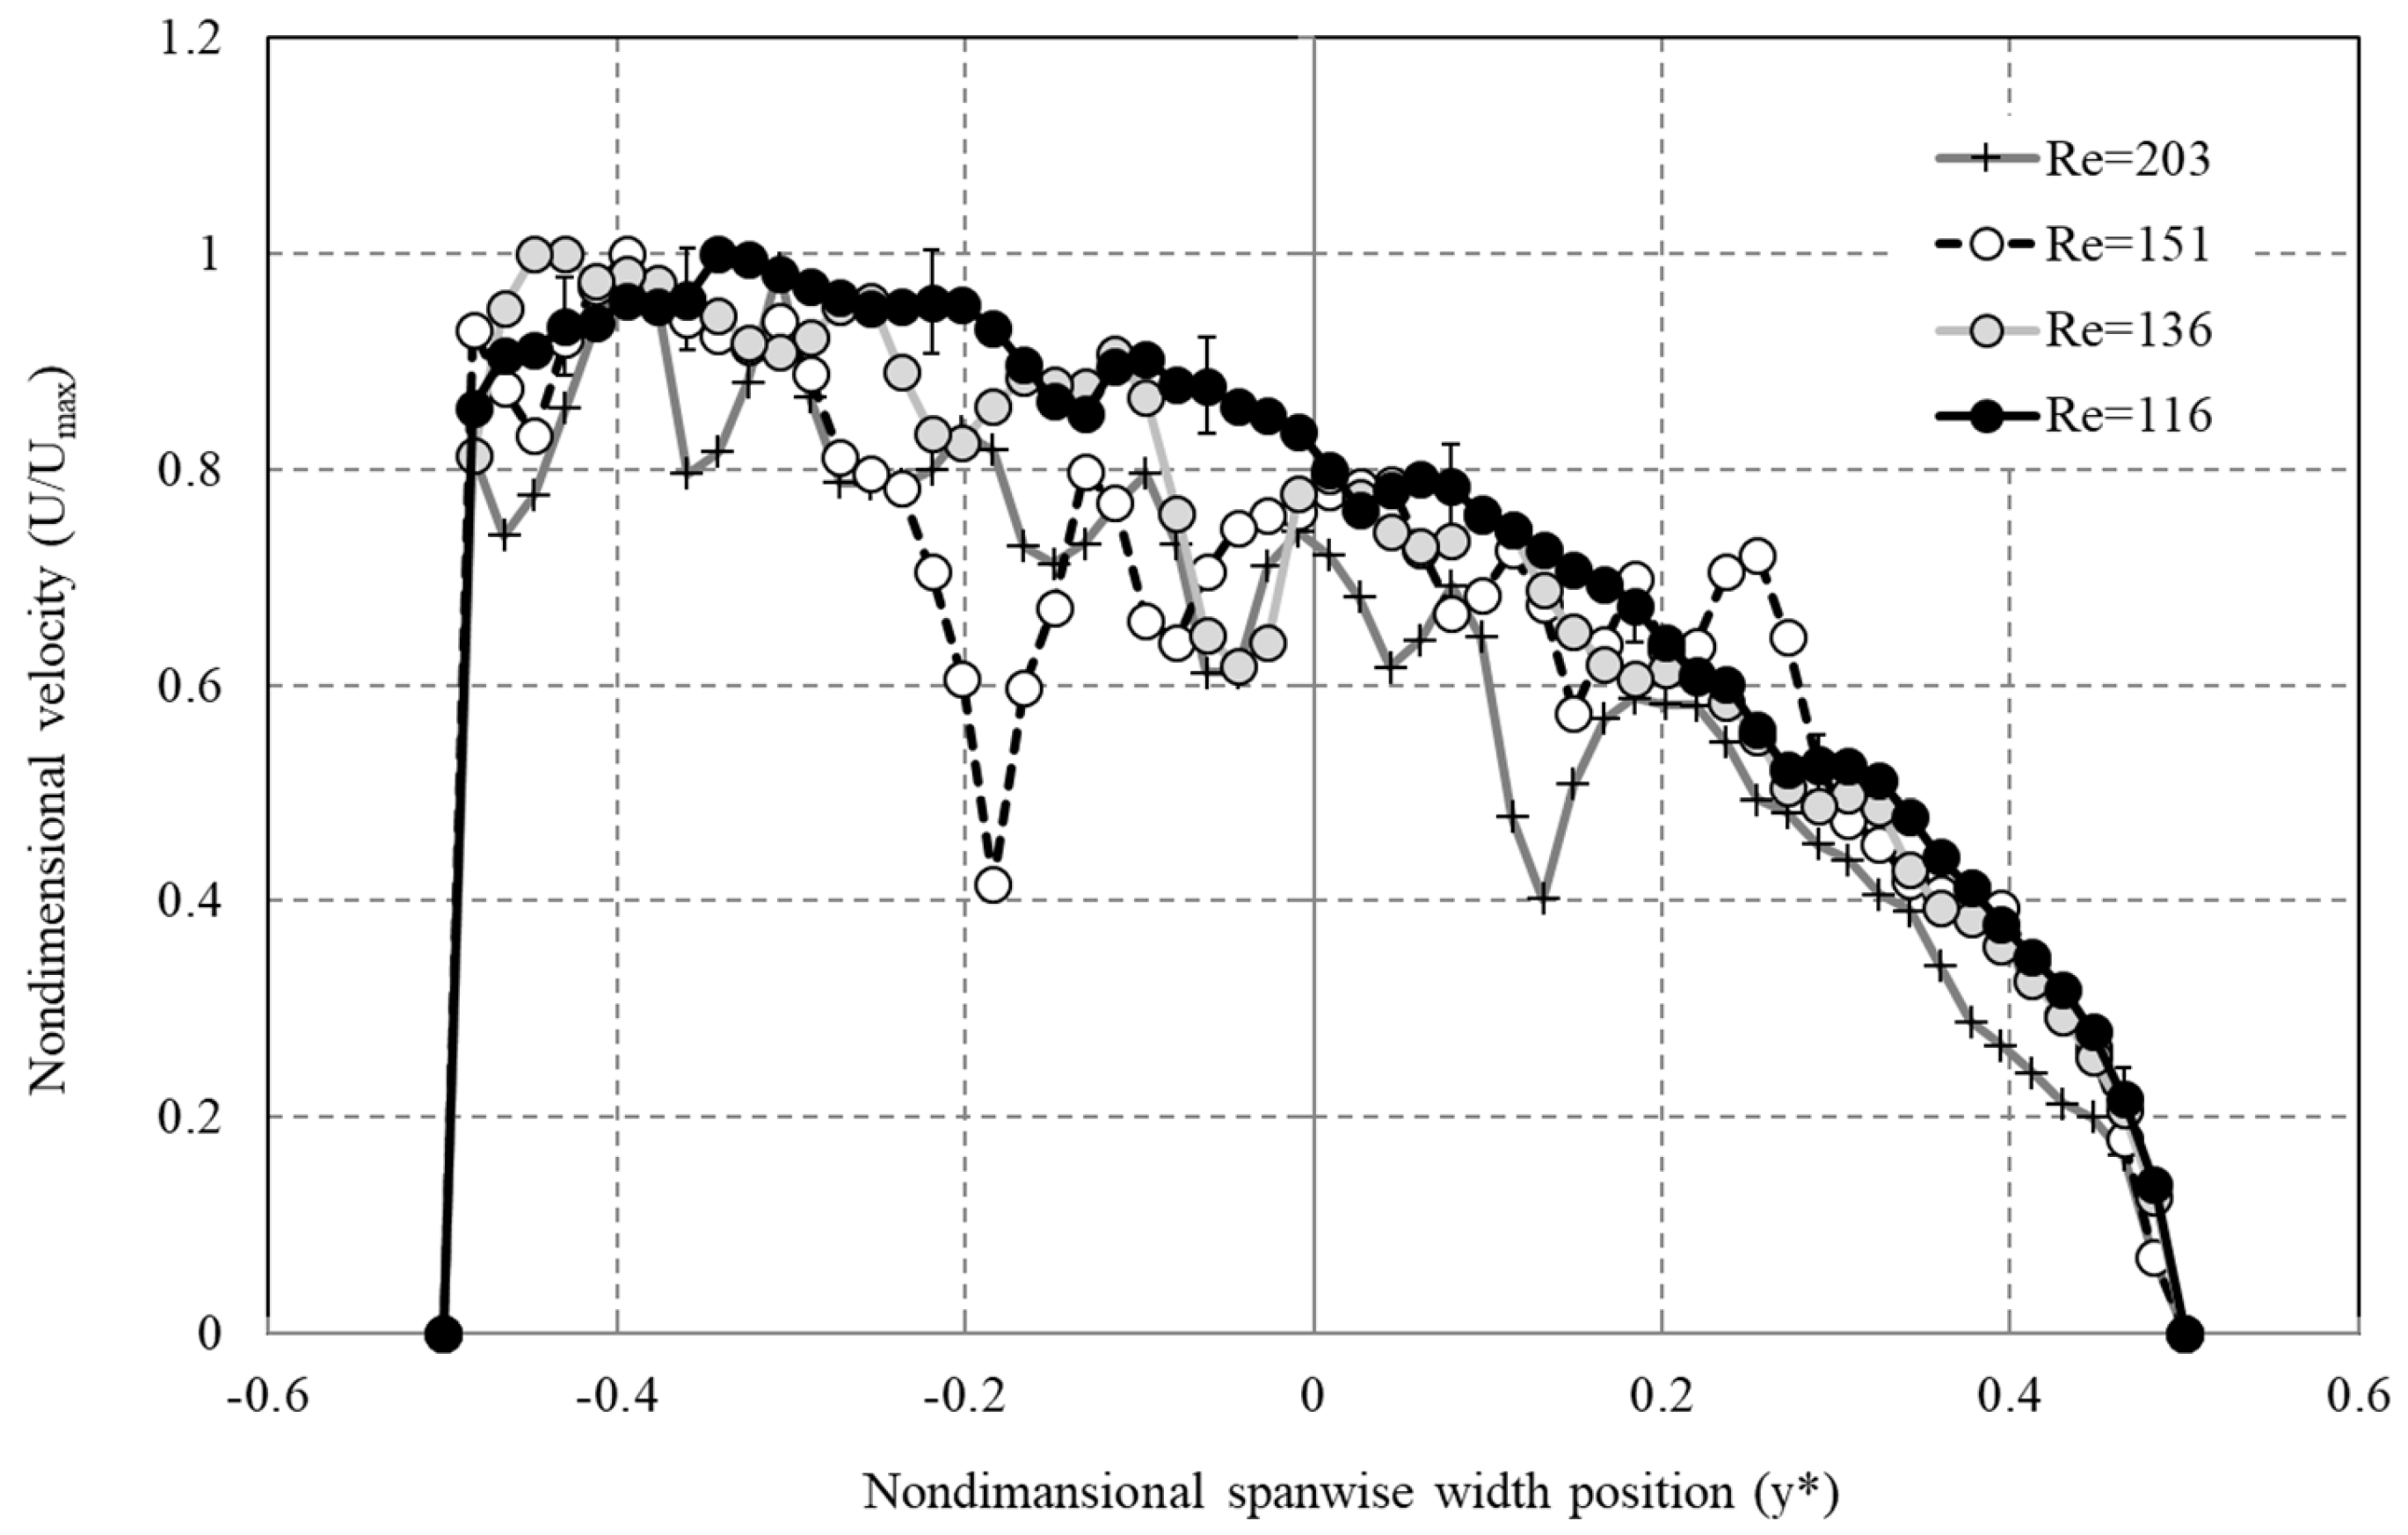
To allow for a better comparison of the measured flow velocity, non-dimensional spanwise velocity profiles were compared along center axis of the channel in the x–y direction and are presented in Figure 8, with y* representing the non-dimensional spanwise width position. For all Reynolds numbers, velocity profiles had higher magnitudes near the outer wall. For Re = 116, the spanwise profile was almost smooth, with small variations in the range of the measurement uncertainty. Near the critical Reynolds number (Rec = 136), the velocity profile represented the first oscillation that indicated the onset of the instability. At Re = 151, the velocity presented a peak close to the outer wall and a low speed core flow near y* ≈ −0.17. This confirmed the generation of recirculating vortices near the outer wall. At Reynolds Re = 203, instabilities were caused by the oscillation of the velocity along central duct axis.
4. Conclusions
The experimental results presented in this study characterized secondary flow structures that appeared for flow through a 180° rectangular, curved duct geometry with a small height-to-width aspect ratio of 0.167 and a curvature of 0.54. The method of PIV permitted us to obtain both velocity profile measurements and flow pattern observations, as well as to observe the effect of Dean vortices on flow structure for the Reynolds numbers of 116–203. The transition to unsteady secondary flows generated the creation of wavy structures linked with the formation of vortices close to the outer channel wall, as observed in spanwise flow measurements. This flow structure became more unsteady with increasing Reynolds numbers. This could be further investigated through numerical analysis, such as computation fluid dynamics (CFD), to enable the obtainment of explanations for the development and progression of such secondary flow structures. Simultaneously with the generation of Dean vortices, a separation of the large velocity zone could be observed along the channel bend. Another zone subsequently appeared downstream near the outer channel wall. The observation of this upper velocity area could provide fundamental insight to aid the growing research on heat transfer for curved geometries in terms of enhancing the convective heat transfer rate. Finally, the presented experimental work clearly demonstrated that the utilization of PIV to characterize the creation of secondary flow structures in curved geometry is appropriate. PIV analysis permitted both visualizations and velocity field measurements of such structures to be obtained in both the streamwise and spanwise directions.
Author Contributions
Conceptualization, A.G. and P.R.; methodology, A.G. and P.R.; software, A.G. and P.R.; validation, A.G. and P.R.; formal analysis, A.G. and P.R.; investigation, A.G. and P.R.; resources, A.G. and P.R.; data curation, A.G. and P.R.; writing—original draft preparation, A.G. and P.R.; writing—review and editing, A.G. and P.R.; visualization, A.G. and P.R.; supervision, A.G. and P.R.; project administration, A.G. and P.R.; funding acquisition, A.G. and P.R. All authors have read and agreed to the published version of the manuscript.
Funding
This research received no external funding.
Institutional Review Board Statement
Not applicable.
Informed Consent Statement
Not applicable.
Data Availability Statement
Not applicable.
Acknowledgments
This work was funded through The Petroleum Institute Research Initiation Grants (RAGS 11046/12139) Multiphase Flow Measurement and Characterization. Louis Perez and Liang Wang’s assistance with the experiment measurements are greatly appreciated.
Conflicts of Interest
The authors declare no conflict of interest.
References
- Martin, J.; Oshkai, P.; Djilili, N. Flow structure in a u-shaped fuel cell flow channel: Quantitative visualization using particle image velocimetry. Trans. ASME J. Fuel Cell Sci. Tech. 2005, 2, 70. [Google Scholar] [CrossRef]
- Ligrani, P.M.; Hedlund, C.R. Experimental surface heat transfer and flow structure in a curved channel with laminar, transitional, and turbulent flows. Trans. ASME J. Turbomach. 2004, 126, 414. [Google Scholar] [CrossRef]
- Kumar, V.; Aggarwal, M.; Nigam, K.D.P. Mixing in curved tubes. Chem. Eng. Sci. 2006, 61, 5742. [Google Scholar] [CrossRef]
- Bruschewski, M.; Scherhag, C.; Schiffer, H.P.; Grundmann, S. Influence of Channel Geometry and Flow Variables on Cyclone Cooling of Turbine Blades. Trans. ASME J. Turbomach. 2016, 138, 061005. [Google Scholar] [CrossRef]
- Couette, M. Études sur le frottement des liquids. Ann. Chim. Phys. 1890, 21, 433–510. [Google Scholar]
- Taylor, G.I. VIII. Stability of a viscous liquid contained between two rotating cylinders. Phil. Trans. R. Soc. Lond. A 1923, 223, 289–343. [Google Scholar] [CrossRef]
- Dean, W.R. Flow motion in a curved channel. Proc. R. Soc. Lond. A 1928, 121, 402. [Google Scholar]
- Berger, S.A.; Yao, L.S. Entry flow in a curved pipe. J. Fluid Mech. 1975, 67, 177–196. [Google Scholar]
- Patankar, S.V.; Pratap, V.S.; Spalding, D.B. Prediction of turbulent flow in curved pipes. J. Fluid Mech. 1975, 67, 583–595. [Google Scholar] [CrossRef] [Green Version]
- Agrawal, Y.; Talbot, L.; Gong, K. Laser anemometer study of flow development in curved circular pipes. J. Fluid Mech. 1978, 85, 497–518. [Google Scholar] [CrossRef]
- Lin, J.Y.; Tarbell, J.M. An experimental and numerical study of periodic flow in a curved tube. J. Fluid Mech. 1980, 100, 623–638. [Google Scholar] [CrossRef]
- Berger, S.A.; Talbot, L.; Yao, L.S. Flow in curved pipes. Annu. Rev. Fluid Mech. 1983, 15, 461–512. [Google Scholar] [CrossRef]
- Olson, D.E.; Snyder, B. The upstream scale of flow development in curved circular pipes. J. Fluid Mech. 1985, 150, 139–158. [Google Scholar] [CrossRef]
- Ghia, K.N.; Sokhey, J.S. Laminar incompressible viscous flow in curved ducts of regular cross-sections. J. Fluids Eng. 1977, 99, 640–648. [Google Scholar] [CrossRef]
- Sugiyama, S.; Hayashi, T.; Yamazaki, K. Flow characteristics in the curved rectangular channels: Visualization of secondary flow. JSME Int. J. Ser. B 1983, 26, 532–552. [Google Scholar] [CrossRef]
- Humphrey, J.A.C.; Taylor, A.M.K.; Whitelaw, J.H. Laminar flow in a square duct of strong curvature. J. Fluid Mech. 1977, 83, 509–527. [Google Scholar] [CrossRef]
- Bara, B.; Nandakumar, K.; Masliyah, J.H. An experimental and numerical study of the dean problem: Flow development towards two-dimensional multiple solutions. J. Fluid Mech. 1992, 244, 339–376. [Google Scholar] [CrossRef]
- Arnal, M.P.; Goering, D.J.; Humphrey, J.A.C. Unsteady laminar flow developing in a curved duct. Int. J. Heat Fluid Flow 1992, 13, 347–357. [Google Scholar] [CrossRef]
- Mees, P.A.J.; Nandakumar, K.; Masliyah, J.H. Instability and transitions of flow in a curved square duct: The development of two pairs of dean vortices. J. Fluid Mech. 1996, 314, 227–246. [Google Scholar] [CrossRef]
- Gauthier, G.; Gondret, P.; Thome, H.; Rabaud, M. Centrifugal instabilities in a curved rectangular duct of small aspect ratio. Phys. Fluids 2001, 13, 2831–2834. [Google Scholar] [CrossRef] [Green Version]
- Boutabaa, M.; Helin, L.; Mompean, G.; Thais, L. Numerical study of Dean vortices in developing Newtonian and viscoelastic flows through a curved duct of square cross-section. Comptes Rendus Mécanique 2009, 337, 40–47. [Google Scholar] [CrossRef]
- Wu, X.; Lai, S.; Yamamoto, K.; Yanase, S. Vortex patterns of the flow in a curved duct. Energy Procedia 2011, 12, 920–927. [Google Scholar] [CrossRef] [Green Version]
- Yamamoto, K.; Wub, X.; Hyakutake, T.; Yanase, S. Taylor–Dean flow through a curved duct of square cross section. Fluid Dyn. Res. 2004, 35, 67–86. [Google Scholar] [CrossRef]
- Yamamoto, K.; Wub, X.; Nozaki, K.; Hayamizu, Y. Visualization of Taylor–Dean flow in a curved duct of square cross-section. Fluid Dyn. Res. 2006, 38, 1–18. [Google Scholar] [CrossRef]
- Norouzi, M.; Biglari, N. An analytical solution for Dean flow in curved ducts with rectangular cross section. Phys. Fluids 2013, 25, 053602. [Google Scholar] [CrossRef]
- Yanase, S.; Kaga, Y.; Daikai, R. Laminar flows through a curved rectangular duct over a wide range of the aspect ratio. Fluid Dyn. Res. 2002, 31, 151–183. [Google Scholar] [CrossRef]
- Facao, J.; Oliveira, A.C. Modeling laminar heat transfer in a curved rectangular duct with a computational fluid dynamics code. Numer. Heat Trans. A 2005, 48, 165–177. [Google Scholar] [CrossRef]
- Chandratilleke, T.T.; Nadim, N.; Narayanaswamy, R. Vortex structure-based analysis of laminar flow behaviour and thermal characteristics in curved ducts. Int. J. Sci. 2012, 59, 75–86. [Google Scholar] [CrossRef]
- Li, Y.; Wang, X.; Yuan, S.; Tan, S.K. Flow development in curved rectangular ducts with continuously varying curvature. Exp. Fluid Sci. 2016, 75, 1–15. [Google Scholar] [CrossRef]
- Raffle, M.; Willert, C.; Werely, S.; Kompenhans, J. Particle Image Velocimetry—A Practical Guide, 3rd ed.; Springer: Berlin, Germany, 2018. [Google Scholar]
- Ebadian, M.A.; Dong, Z.F. Forced convection, internal flow in ducts. In Handbook of Heat Transfer, 3rd ed.; McGraw-Hill: New York, NY, USA, 1998. [Google Scholar]
Figure 1.
Experimental setup: (a) Schematic of experimental loop and (b) Isometric view of the test section.
Figure 1.
Experimental setup: (a) Schematic of experimental loop and (b) Isometric view of the test section.

Figure 2.
Particle image velocimetry (PIV) flow visualization system.

Figure 3.
Comparison of measured and predicted steady state velocity profiles in the streamwise direction as a function of Reynolds number (x–y plane, z = h/2, x = 120 mm).
Figure 3.
Comparison of measured and predicted steady state velocity profiles in the streamwise direction as a function of Reynolds number (x–y plane, z = h/2, x = 120 mm).

Figure 4.
Measured average velocity distribution in the x–y plane (at z = h/2) for Re = 116.

Figure 5.
Measured averaged velocity flow field (vector) and corresponding magnitude (in color) in the x–y plane (at z = h/2) on exiting the region of the channel bend as a function of the Reynolds number: (a) Re = 116, (b) Re = 136, (c) Re = 151, (d) Re = 203.
Figure 5.
Measured averaged velocity flow field (vector) and corresponding magnitude (in color) in the x–y plane (at z = h/2) on exiting the region of the channel bend as a function of the Reynolds number: (a) Re = 116, (b) Re = 136, (c) Re = 151, (d) Re = 203.

Figure 6.
Measured instantaneous velocity flow field (vector), with its corresponding magnitude (in color) in the y–z plane (h/2) at the channel bend (θ = 180°) existing as a function of the Reynolds number: (a) Re = 116, (b) Re = 136, (c) Re = 151, (d) Re = 203.
Figure 6.
Measured instantaneous velocity flow field (vector), with its corresponding magnitude (in color) in the y–z plane (h/2) at the channel bend (θ = 180°) existing as a function of the Reynolds number: (a) Re = 116, (b) Re = 136, (c) Re = 151, (d) Re = 203.

Figure 7.
Measured instantaneous velocity flow field (vector), with its corresponding magnitude (in color) in the y–z plane (h/2) at the curved channel outlet (θ = 180°) existing as a function of time at Re = 203: (a) t = 0 s, (b) t = 0.2 s, (c) t = 0.4 s, (d) t = 0.6 s.
Figure 7.
Measured instantaneous velocity flow field (vector), with its corresponding magnitude (in color) in the y–z plane (h/2) at the curved channel outlet (θ = 180°) existing as a function of time at Re = 203: (a) t = 0 s, (b) t = 0.2 s, (c) t = 0.4 s, (d) t = 0.6 s.

Figure 8.
Measured velocity profile in the x–y plane (at z = h/2) at the curved channel outlet (θ = 180°) as a function of the Reynolds number.
Figure 8.
Measured velocity profile in the x–y plane (at z = h/2) at the curved channel outlet (θ = 180°) as a function of the Reynolds number.

Publisher’s Note: MDPI stays neutral with regard to jurisdictional claims in published maps and institutional affiliations. |
© 2021 by the authors. Licensee MDPI, Basel, Switzerland. This article is an open access article distributed under the terms and conditions of the Creative Commons Attribution (CC BY) license (https://creativecommons.org/licenses/by/4.0/).
Share and Cite
MDPI and ACS Style
Goharzadeh, A.; Rodgers, P. PIV-Measurements of Centrifugal Instabilities in a Rectangular Curved Duct with a Small Aspect Ratio. Fluids 2021, 6, 184. https://0-doi-org.brum.beds.ac.uk/10.3390/fluids6050184
AMA Style
Goharzadeh A, Rodgers P. PIV-Measurements of Centrifugal Instabilities in a Rectangular Curved Duct with a Small Aspect Ratio. Fluids. 2021; 6(5):184. https://0-doi-org.brum.beds.ac.uk/10.3390/fluids6050184
Chicago/Turabian StyleGoharzadeh, Afshin, and Peter Rodgers. 2021. "PIV-Measurements of Centrifugal Instabilities in a Rectangular Curved Duct with a Small Aspect Ratio" Fluids 6, no. 5: 184. https://0-doi-org.brum.beds.ac.uk/10.3390/fluids6050184