
Impact of Modelling Surface Roughness in an Arterial Stenosis


1
School of Mechanical & Manufacturing Engineering, University of New South Wales, Sydney, NSW 2052, Australia
2
School of Engineering & Information Technology, University of New South Wales, Canberra, ACT 2612, Australia
*
Author to whom correspondence should be addressed.
Fluids 2022, 7(5), 179; https://0-doi-org.brum.beds.ac.uk/10.3390/fluids7050179
Submission received: 14 April 2022
/
Revised: 16 May 2022
/
Accepted: 19 May 2022
/
Published: 21 May 2022
(This article belongs to the Special Issue Cardiovascular Hemodynamics)
Abstract
:Arterial stenosis is a problem of immediate significance, as cardiovascular disease is the number one leading cause of death worldwide. Generally, the study of stenotic flow assumes a smooth, curved stenosis and artery. However, the real situation is unlikely to present an infinitely smooth-surfaced arterial stenosis. Here, the impact of surface roughness on the flow in an arterial stenosis was studied via a computational fluid dynamics analysis. A patient-specific geometry with a smooth surface was reconstructed, and a partially rough model was built by artificially adding random roughness only on the stenotic region of the smooth model. It was found that the flow was oscillatory downstream of the stenosis in the models. A slightly lower velocity near the wall and more oscillatory flows were observed due to the presence of the roughness in the stenotic region. However, the pressure distributions did not vary significantly between the smooth and rough models. The differences in the wall shear metrics were slight in the stenotic region and became larger in the downstream region of the models.
1. Introduction
Cardiovascular disease and associated arterial stenosis is the number one leading cause of death worldwide, contributing to 30% of all annual fatalities [1]. Stenosis development is strongly linked to spatial and temporal variations in wall shear stress (WSS) [2], which can be caused by flow separation, reversed flow and unsteadiness [3]. Turbulent flow results in significant temporal and spatial variations in velocity, which cause large WSS fluctuations; this is complicated by the pulsatile flow presented in arterial systems, where turbulent and transitional flows may appear for some parts of the cycle. Pulsatile flow in pipes features different flow characteristics from those of the steady state, as the velocity across the diameter of the pipe can vary considerably, and therefore turbulence can occur near the walls while the core of the flow remains laminar [4]. Typically, based on a non-constricted region diameter, the peak Reynolds number is around 1000 for these types of flows; however, actual velocities through the stenosis cause the local Reynolds numbers to be significantly larger in this region. The critical Reynolds numbers for the transition to turbulence decrease with smaller roughness-wavelength-to-tube-diameter ratios, and it is well known that the inner layer of a turbulent boundary layer is significantly altered due to the surface roughness [5].
There exists a significant body of work regarding stenotic flow [6,7,8,9,10]; however, the majority of studies assume a smooth, curved (usually axisymmetric) stenosis and artery. However, reality is unlikely to present an infinitely smooth-surfaced arterial stenosis. In the early stage of atherosclerosis, the luminal surface of an arterial wall becomes rough as a result of endothelial damage [11], with a roughness of the order of the cell height, i.e., from 10–20 µm up to a few hundred µm [12]. A stenosed blood vessel may contain rough irregularities that resemble small valleys and ridges [13], and irregular plaque deposits are more likely to be encountered than smooth stenoses in pathological conditions [14].
Stenosis surface irregularity can lead to complex flow patterns [13] and therefore a variation in the local WSS, although the pressure drop is unaffected as the geometric effect of the stenosis is much more significant [13,15]. A smooth surface can also result in a reduction of as much as 80% in the rate of hemolysis [16].
Mustapha et al. [17] modelled an irregular stenosis couple and noted that the multiple stenoses, as well as their surface roughness, prompted early separation of flow. Bhaganagar [5] conducted a direct numerical simulation study with four types of roughness in a channel flow, representative of four types of arterial roughness. The study revealed that the turbulence generated due to stenosis is strongly dependent on the shape of this stenosis, and the turbulent structures exhibit characteristic structures and mechanisms very specific to the different roughness types. In particular, the ridge/valley representation resulted in strong near-wall velocity gradients with roll-up of the shear layer near the peak locations and recirculating regions near the valley locations. The peak turbulence production was also higher compared to the other three types. WSS effects were not reported.
Bark Jr. and Ku [18] used a random roughness with an amplitude of 200 µm to simulate surface roughness. In their computational model (using a laminar Navier–Stokes solution), it was found that shear-rate peaks developed along the hills with small recirculation eddies in the valleys of the rough surface, causing platelets to experience varying shear stresses near the apex of a stenosis. The irregular thrombus surface resulted in focal areas of increased shear rate relative to a smooth surface. However, Xiong and Taylor [19] found that surface roughness had only a minor effect on the WSS, although the local flow was affected.
A complex pattern of vessel roughness is difficult to describe in an essentially qualitative angiographic report, prompting Cho et al. [20] and Back et al. [21] to take a silicone casting from a cadaveric coronary artery (with significant but non-obstructive diffuse atherosclerotic disease) to obtain the detailed geometric variation up to an order of accuracy of 0.1 mm, and these data have been used in subsequent numerical studies [22]. Stroud et al. [14] used high-resolution imaging of surgically removed plaque specimens from carotid and coronary arteries to define a range of characteristics for arterial stenosis models. These were then modelled with a laminar Navier–Stokes solver, to evaluate the isolated effects of curvature and surface irregularity. These features were observed to have substantial effects on hemodynamics descriptions such as WSS. Fully three-dimensional (3D) irregularities significantly increased the shear stress at the wall, and an oscillating pattern of WSS was observed, even far from the stenosis.
Although the impact of stenotic surface irregularity has been studied, a hemodynamic analysis for a patient-specific model is still lacking. In this paper, a patient-specific model with a smooth surface was clinically obtained and computed, and a rough model was created by manually adding roughness only in the stenotic region of the smooth model. We aimed to investigate the impact of the surface roughness of the stenosis on the blood fluid dynamics. Comparisons are presented between the smooth and rough models via computational fluid dynamics (CFD) studies.
2. Materials and Methods
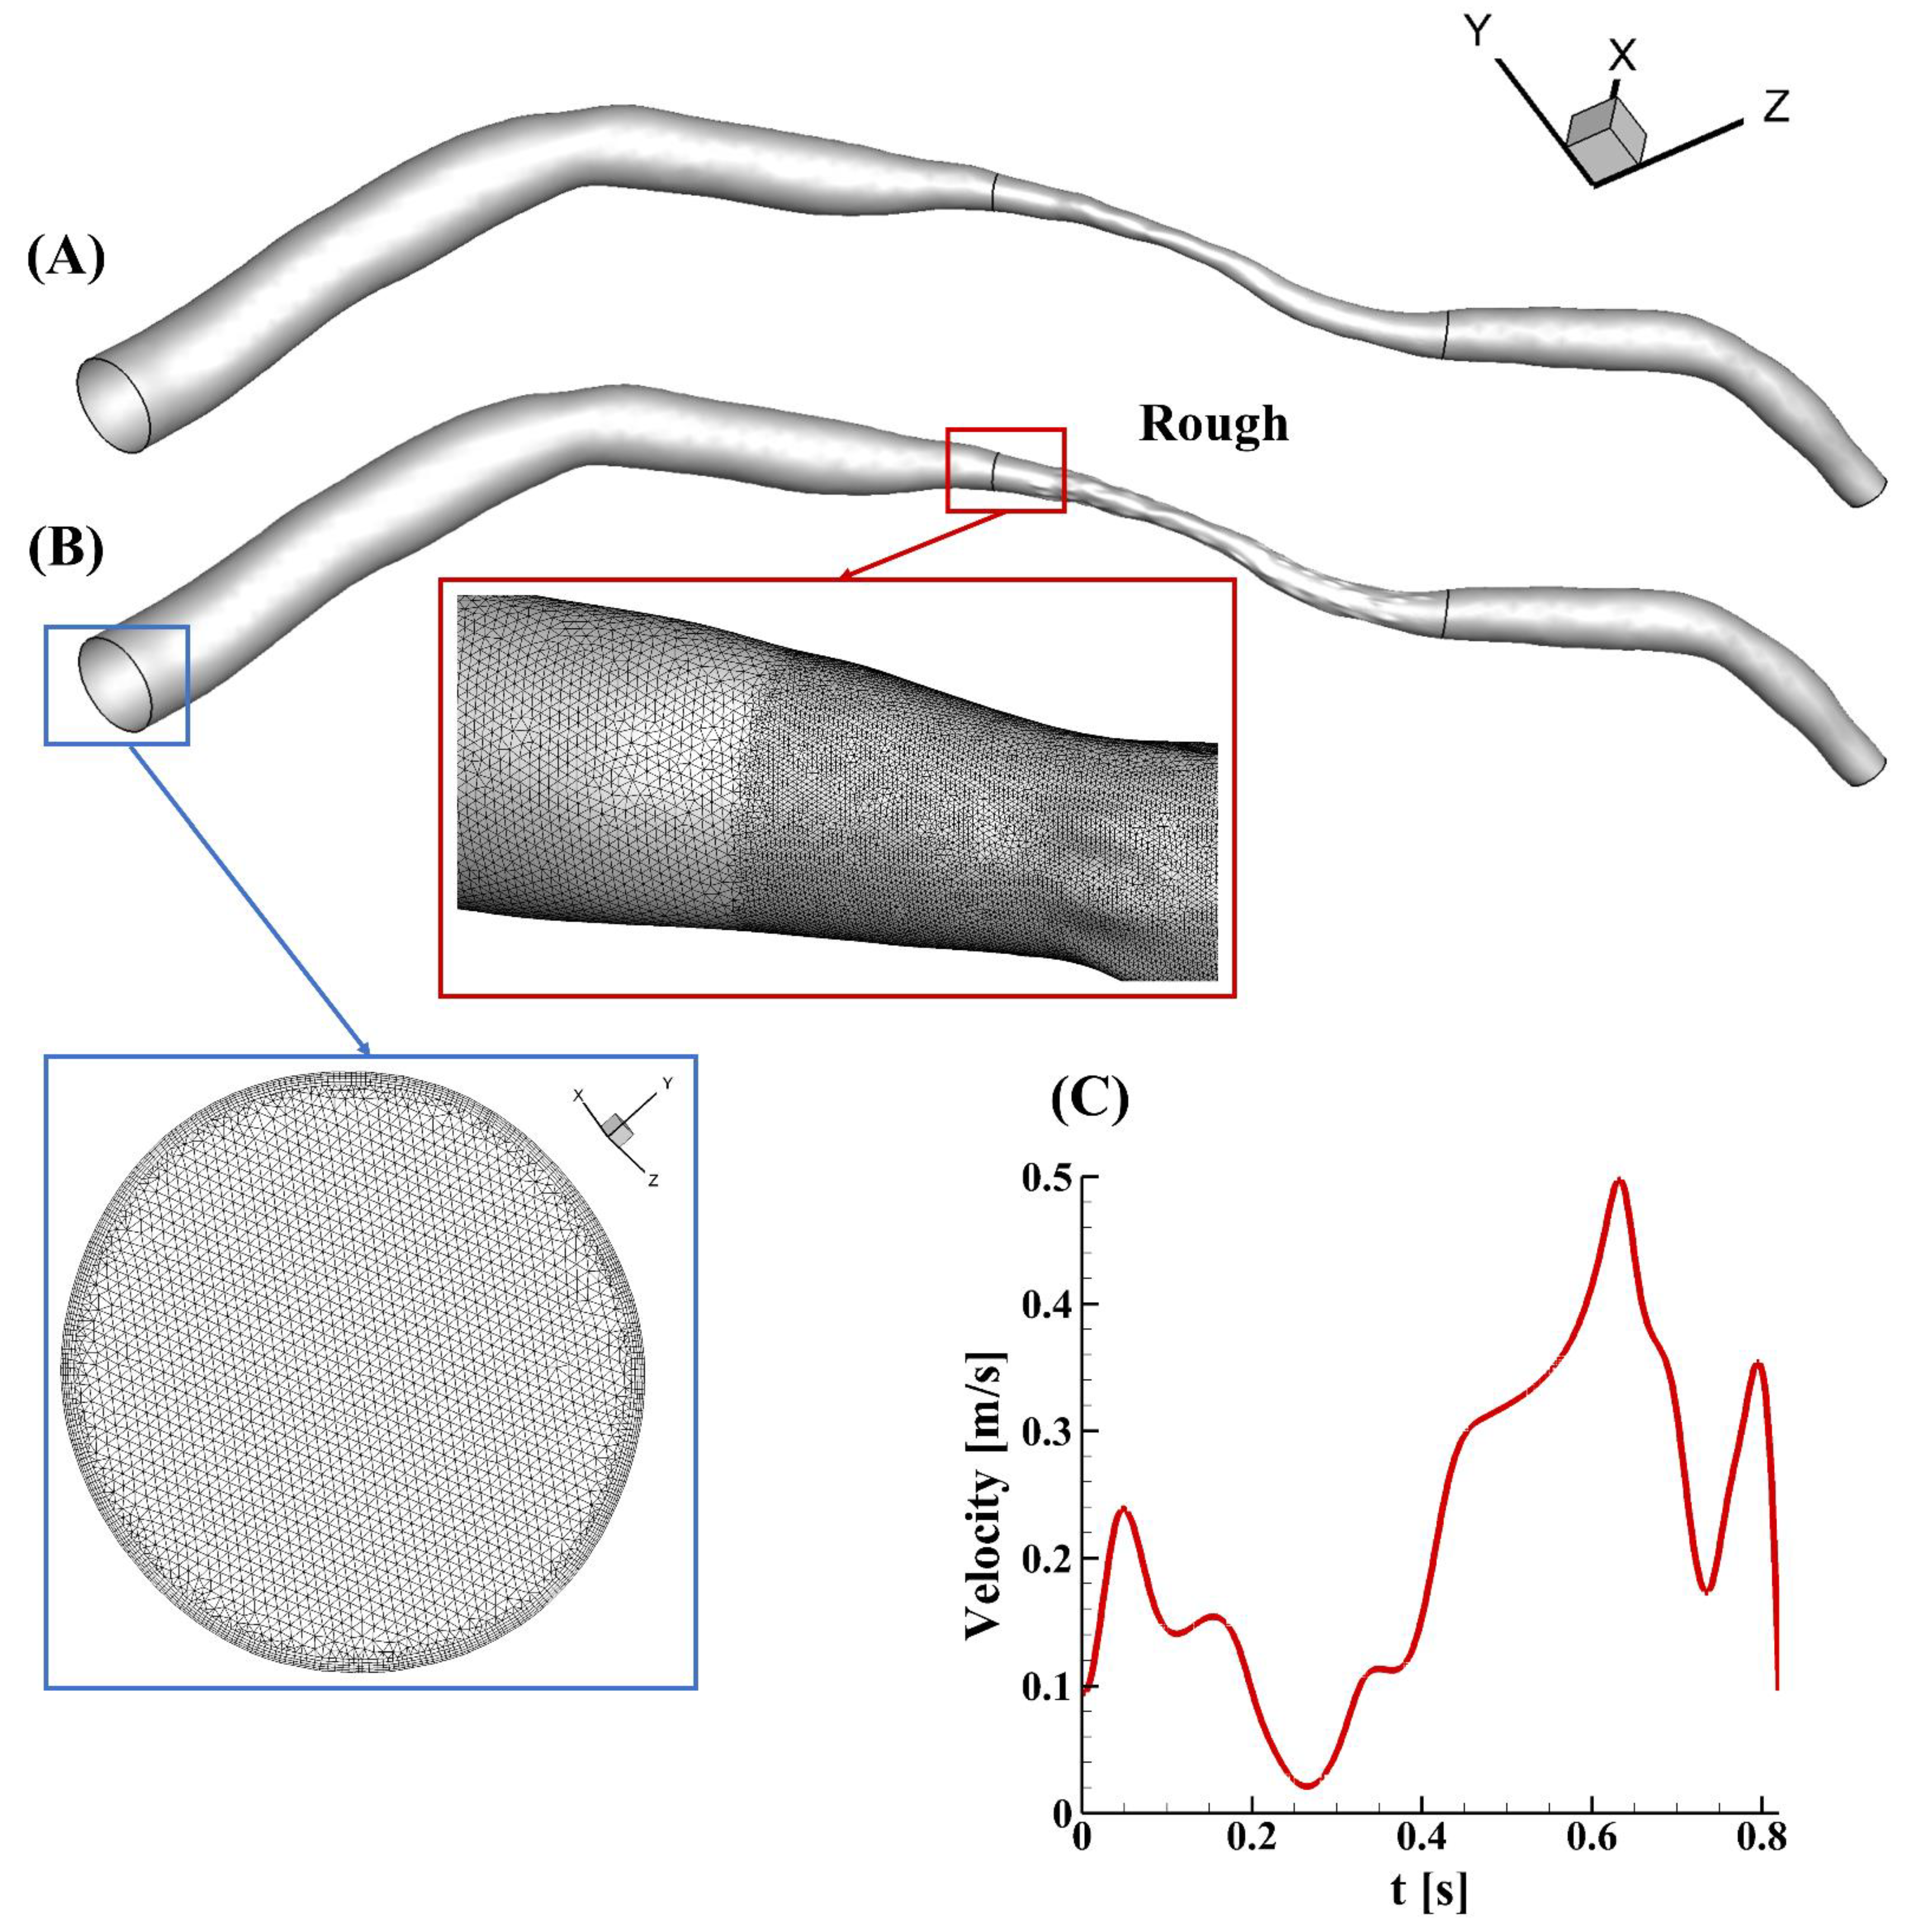
A patient-specific model with a smooth surface of a left anterior descending coronary artery was reconstructed from intravascular ultrasound images, which were obtained in a catheterization laboratory at 15 frames per second (Axiom Artis, Siemens, Germany) (Figure 1A). The diameter at the inlet was 2.97 mm, while the diameter at the outlet was 0.65 mm. The area at the narrowing region was about 0.57 mm2, and the area reduction in this case was 79% (percentage diameter reduction of about 54%). The lesion length was 13.14 mm, and the total length was 63.24 mm. Random roughness was constructed manually, only in the stenotic region, using SolidWorks 2019 (Figure 1B). Small faces in the stenotic region were recognized and segmented automatically after importing the geometry into the software. Ridges and valleys were created along the direction of the vector of each sketch face. The lengths and widths of the ridge and valley were varied and determined based on the curvature of the selected face, but the roughness height remained the same at 50 µm. The surfaces of the upstream and downstream segments in the rough model were unchanged and smooth, as shown in Figure 1B. Finite elements with five prism layers were created using Ansys ICEM, and the minimum mesh quality was 0.37. To capture the flow variations in the rough model, a finer mesh was created in the stenotic segment, of the order of the roughness height, in contrast to the upstream and downstream regions (zoomed-in view in Figure 1).
Simulations were performed in Ansys Fluent 2020 using a high-performance computing cluster (Gadi, National Computational Infrastructure, Australia). The fluid was assumed to be Newtonian and incompressible, with a density of 1050 kg/m3 and a viscosity of 0.0035 Pa·s. These values are typical for arterial simulations [23,24]. The patient-specific pulsatile waveform of the velocity was prescribed at the inlet (Figure 1C), while zero pressure was applied at the outlet. A fully-developed parabolic flow can be represented at the inlet by applying a user-defined function in the software [25]. The peak Reynolds number was around 330, and the flow was assumed to be laminar in this study. The artery was considered as a rigid conduit with a non-slip wall. The Reynolds-averaged Navier–Stokes equations were solved for the modelling of the blood flow, and the PISO (pressure-implicit with splitting of operators) scheme was used for the pressure–velocity coupling, with the accuracy set to be second order. To reach a Courant number lower than 1 and ensure numerical stability [26], the time-step size was set to be 2 × 10⁻⁶. The maximum number of iterations of each step was 20, and the convergence level was set at 1 × 10⁻³. Results were obtained and analyzed for numerical stability and accuracy after three cardiac cycles. The time-averaged wall shear stress (TAWSS), oscillatory shear index (OSI), relative residence time (RRT) and transverse wall shear stress (transWSS) were calculated by executing user-defined functions that are hooked into the iterative process. The definitions and descriptions of these shear metrics are given in Table 1.
A grid independency study was performed in the rough model to obtain a convergent and reliable result in the simulations. The meshing size in the model was around 6,700,000. The parameters for the grid generation were then decreased to half, and the total element size was increased to 9,800,000. The values of the area-weighted average WSS at the peak velocity were selected for the mesh independency study and compared after the computation. These values were 74.51 and 74.64 Pa in the models with a normal and a fine grid, respectively. The difference was observed to be 0.17% for the rough model. Therefore, the normal element grids were deemed to be appropriate for use in the study.
3. Results and Discussion
3.1. Velocity
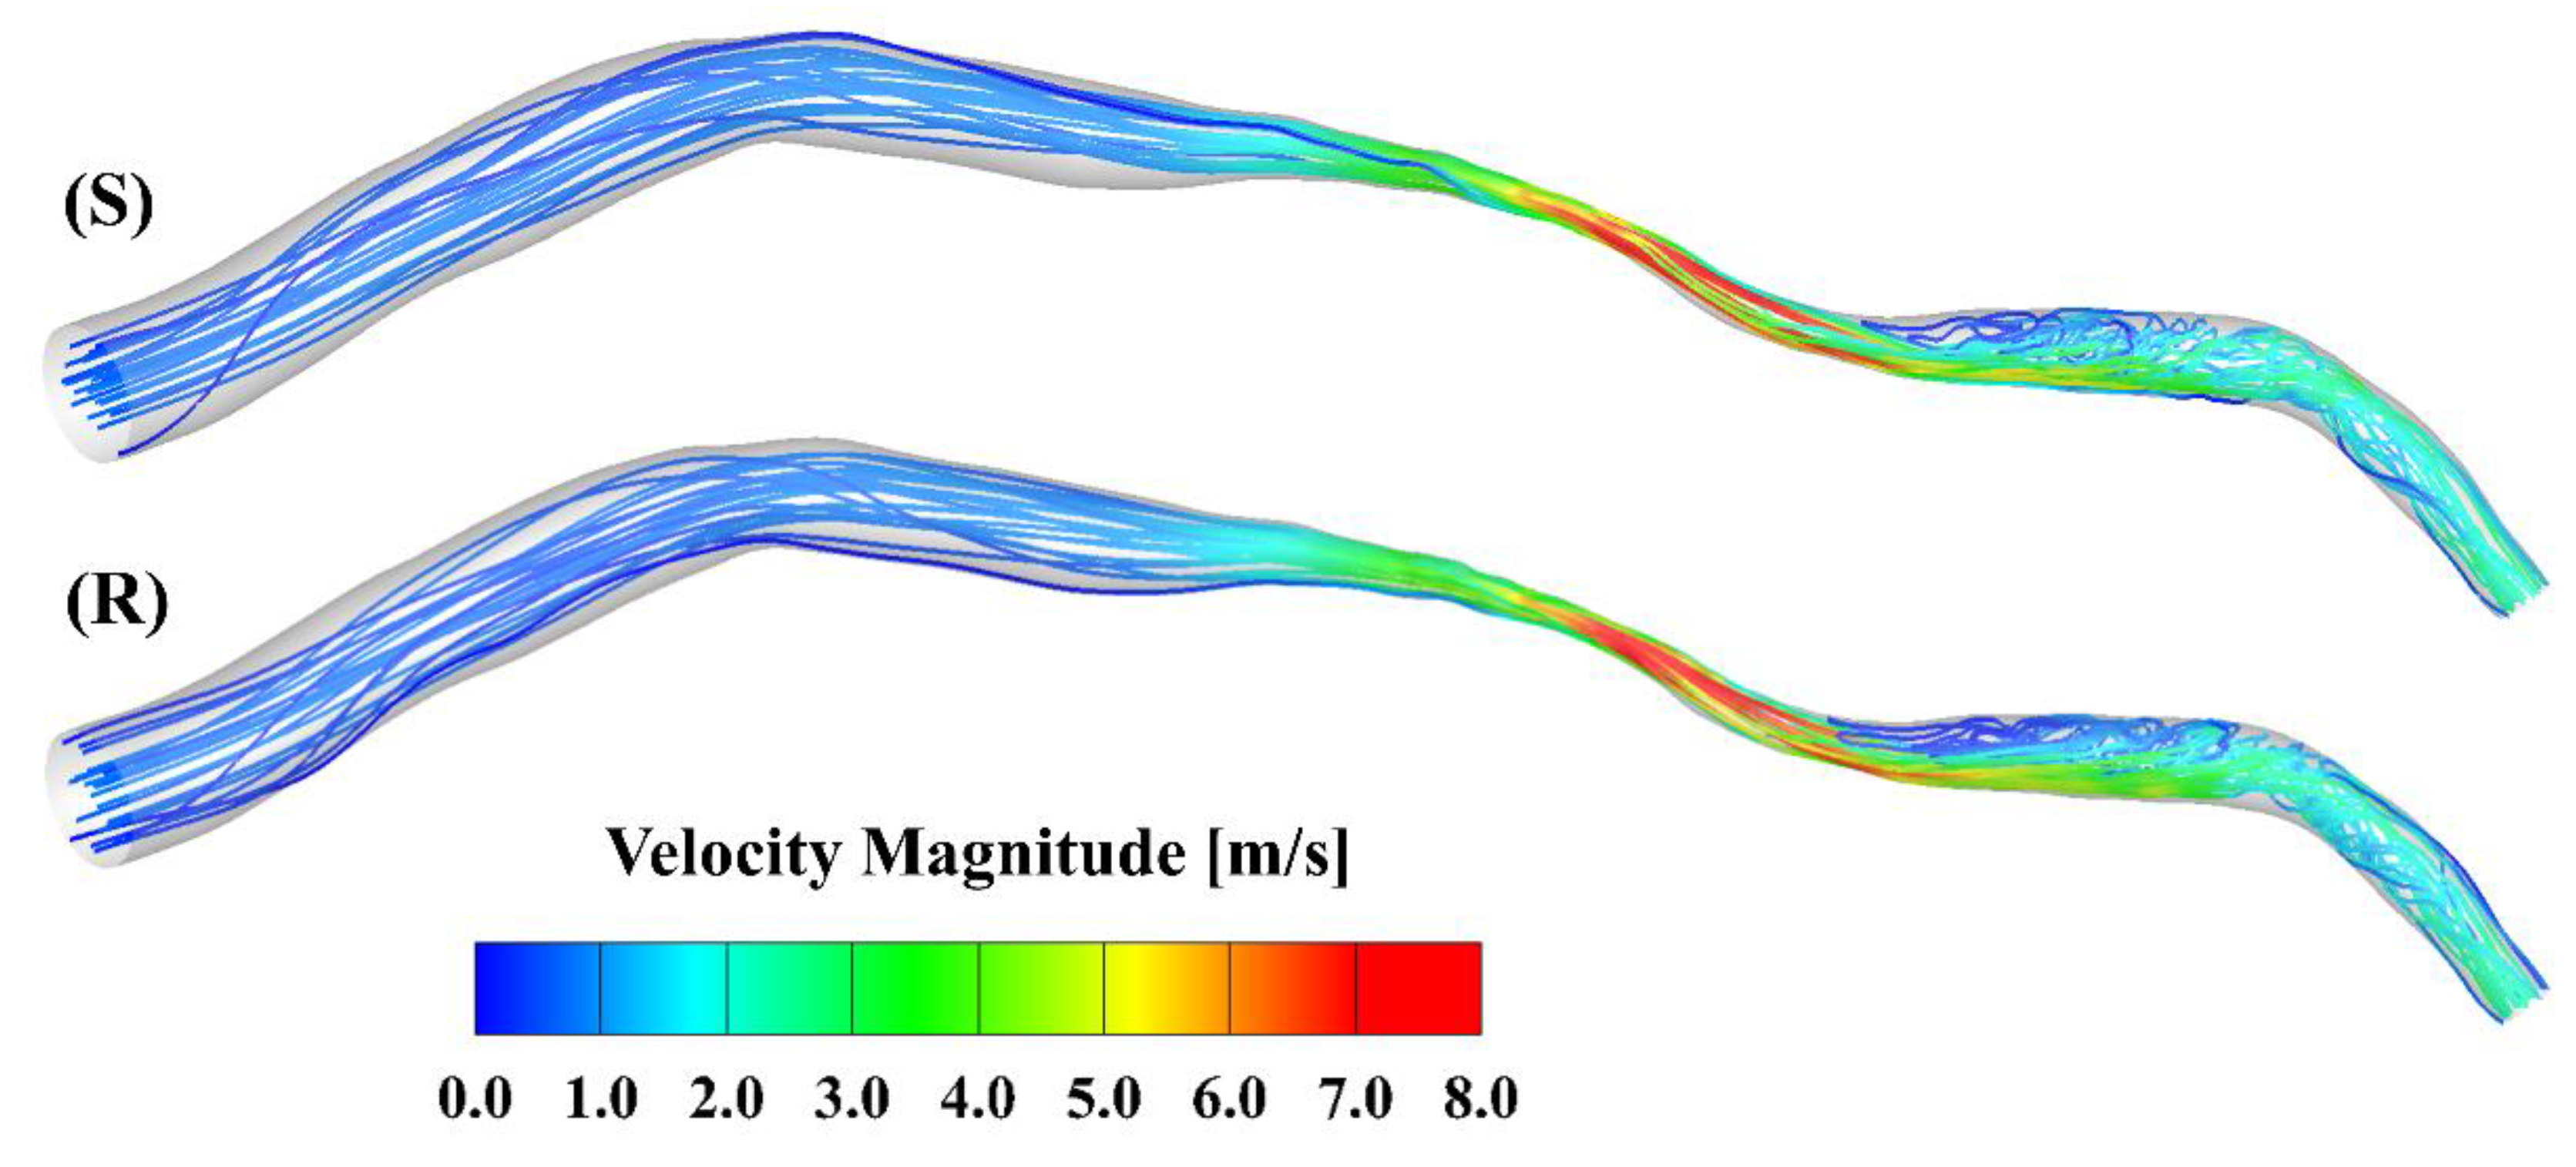
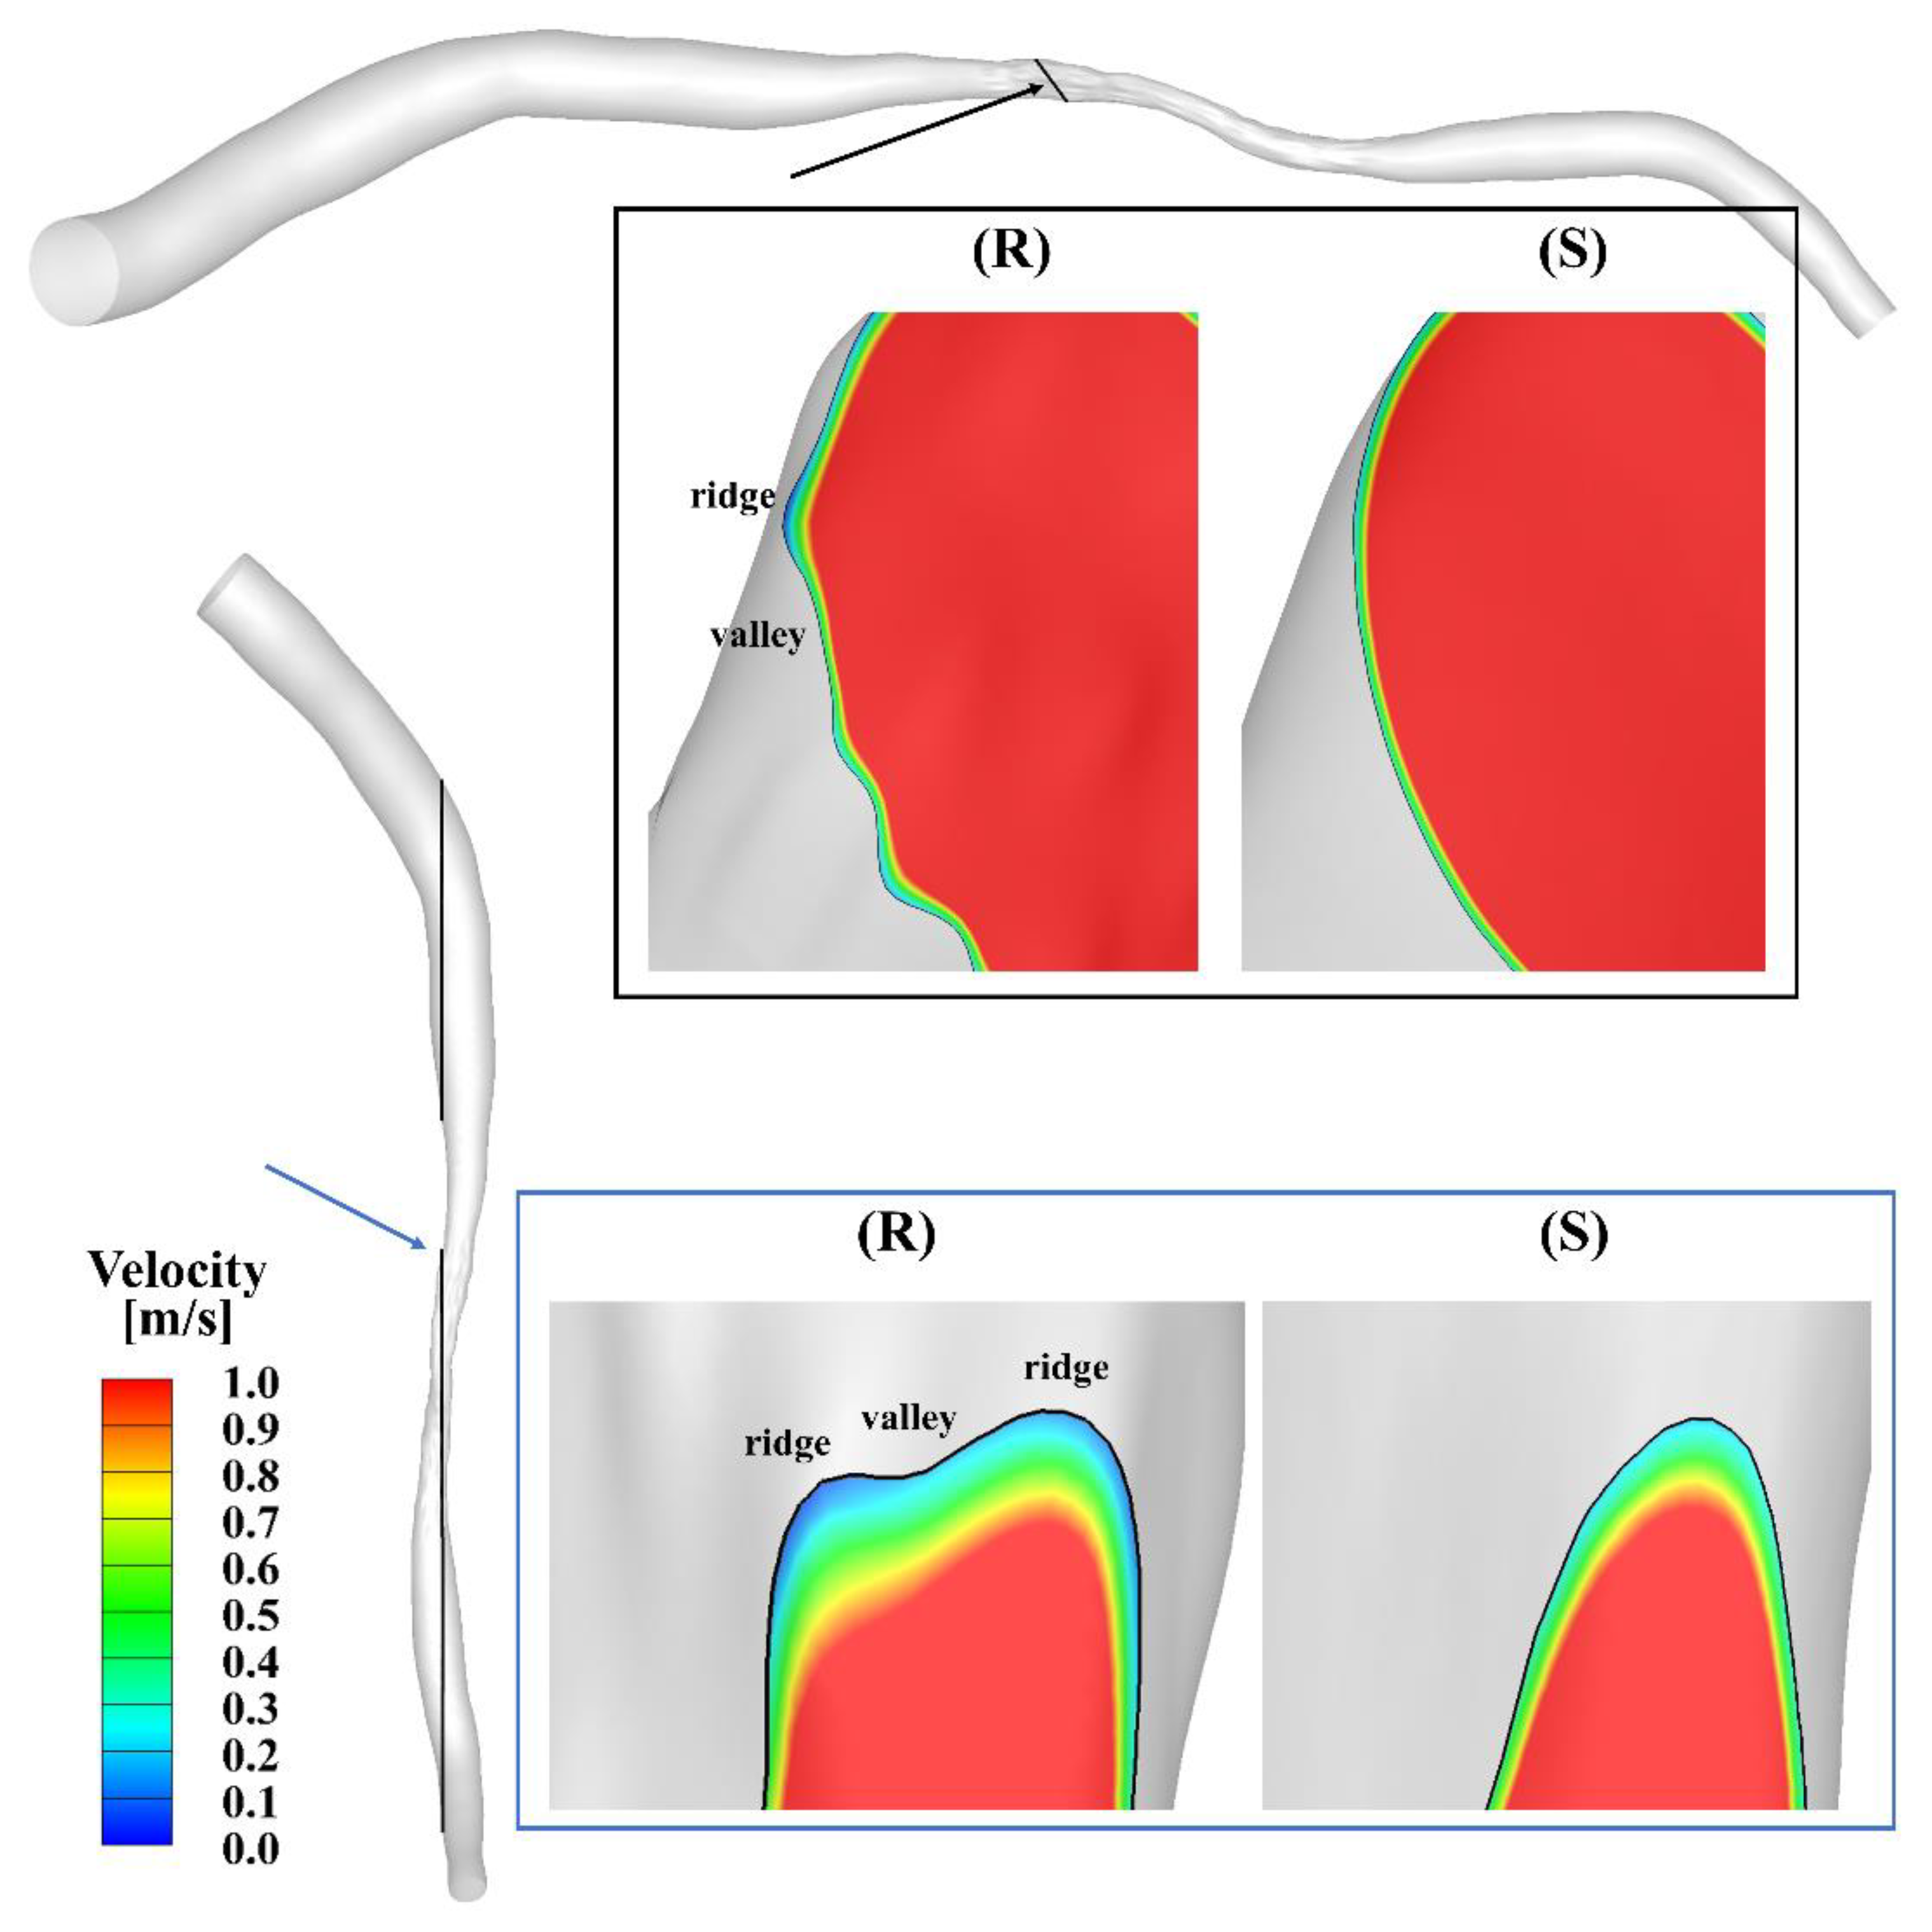
Figure 2 presents the velocity streamlines at the peak of the cardiac cycle. The maximal velocity, which is larger than 8 m/s, occurs at the center of the stenosis. Oscillatory flow is observed in the region downstream of the stenosis in both models. To further visualize the flow contour near the ridges and valleys, zoomed-in views of the slices across the stenotic region at the peak in the smooth and rough model are shown in Figure 3. A velocity cut-off value of 1 m/s is shown in the contours. The near-wall velocity in the rough model is lower than in the smooth model, especially near the ridges. Meanwhile, the velocity near the ridge is lower than that near the valley. As can be seen, the near-wall velocity gradient in the smooth model is slightly larger than in the rough model.
3.2. Pressure
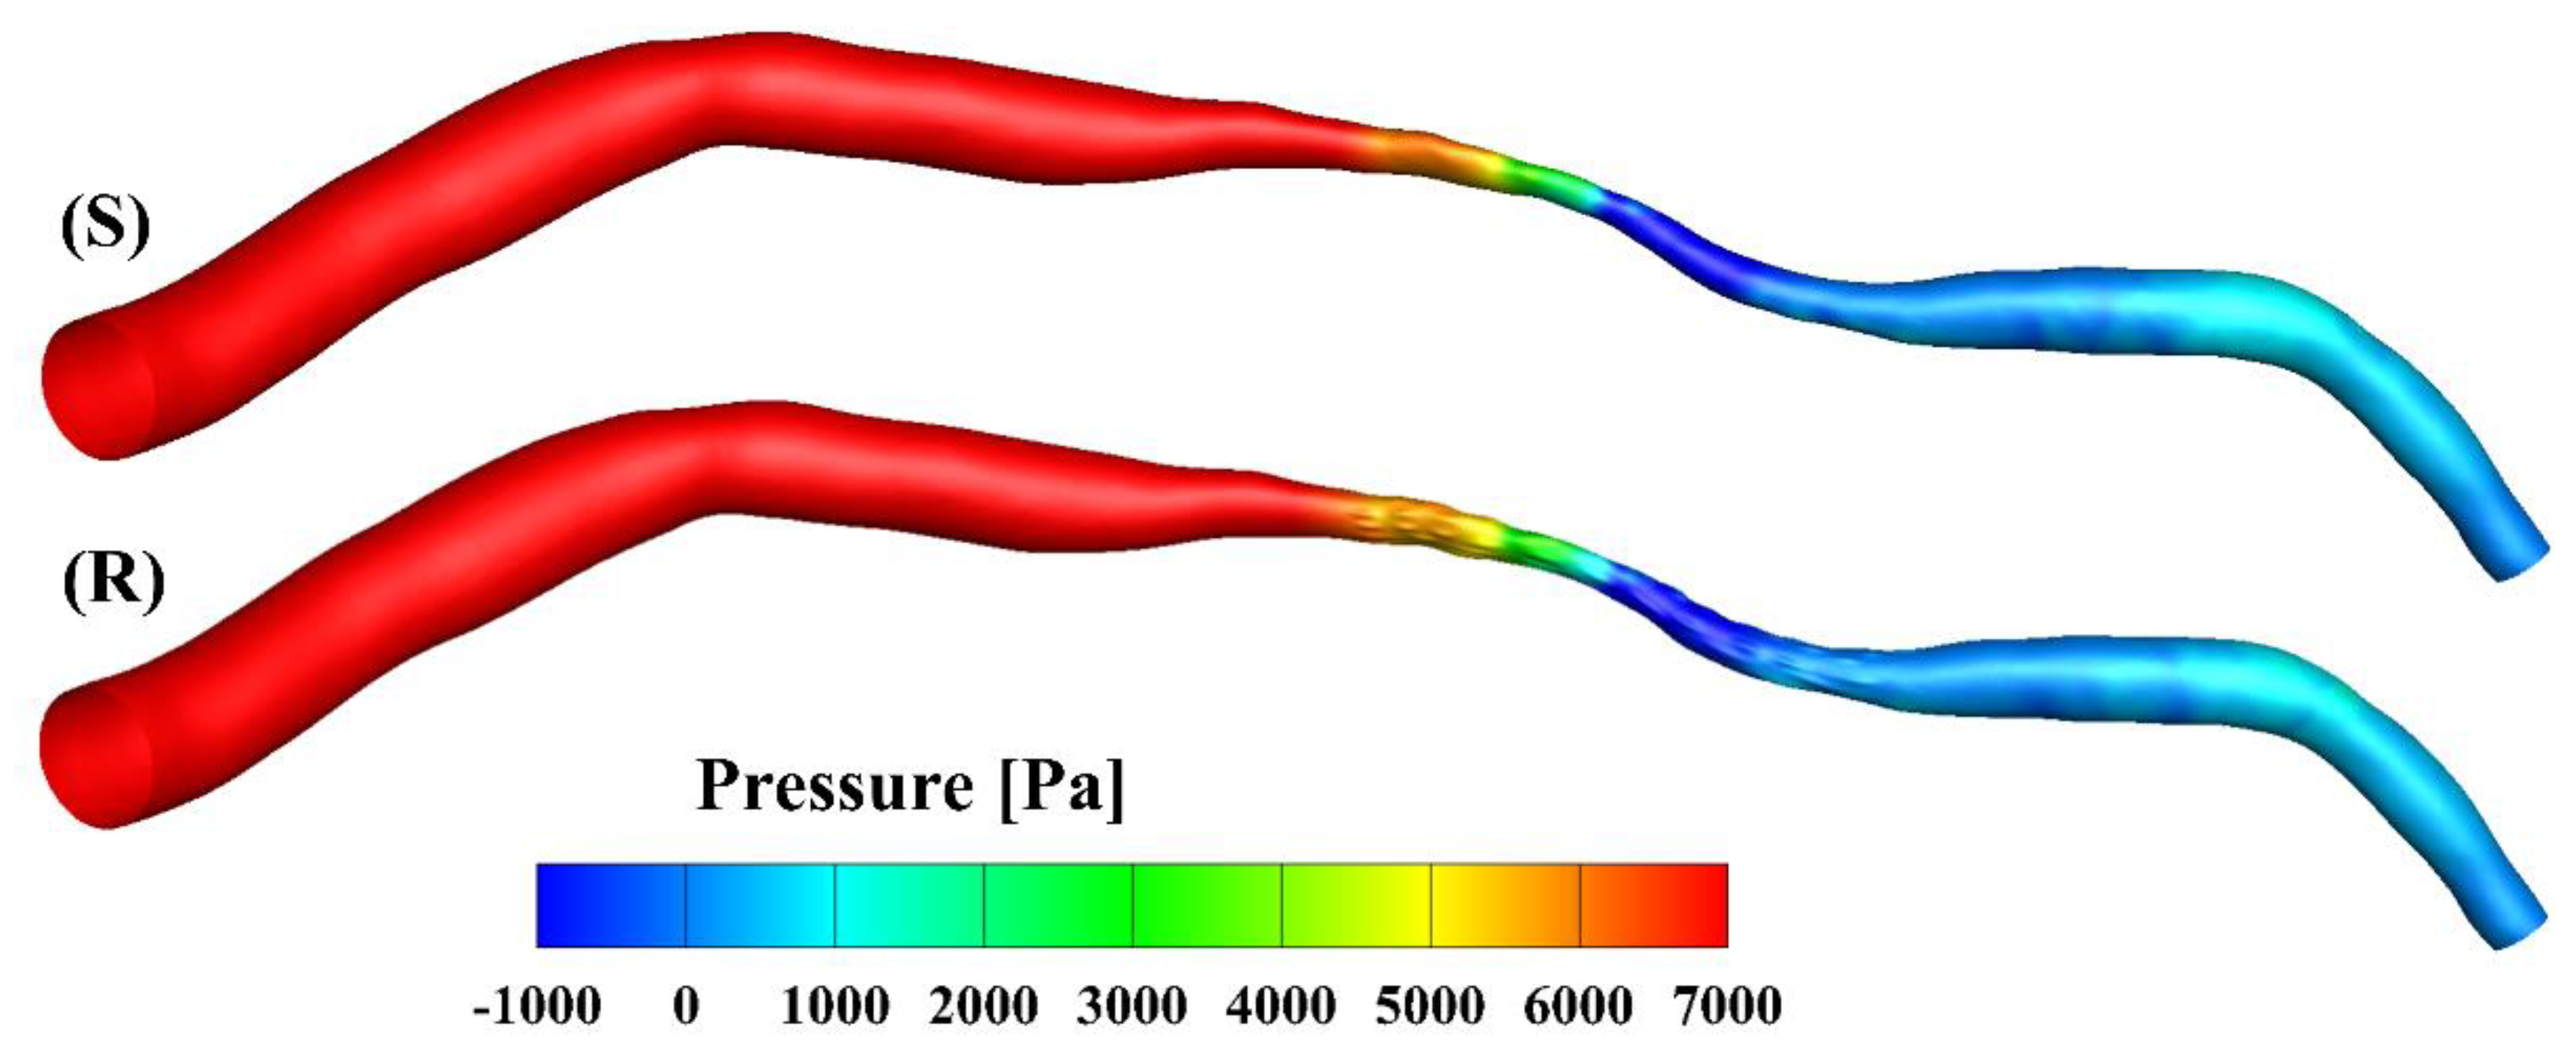
The pressure contours of the smooth and rough model at the peak inlet velocity are presented in Figure 4. The pressure drop from the inlet to the outlet was about 8770 Pa in the smooth model and slightly smaller (8650 Pa) in the rough model. Over the cardiac cycle, the mean pressure dropped to 1500 Pa and 1480 Pa in the smooth and rough models, respectively. The overestimation rate of the smooth model was 1.33% compared to the rough model, calculated as the ratio (1500 − 1480)/1500. The difference between the mean pressure drops in the two models was not significant compared with other factors such as the degree of the stenosis [30]; this finding is consistent with the results published by Yakhot, Grinberg and Nikitin [13], as well as those of Johnston and Kilpatrick [15].
3.3. WSS
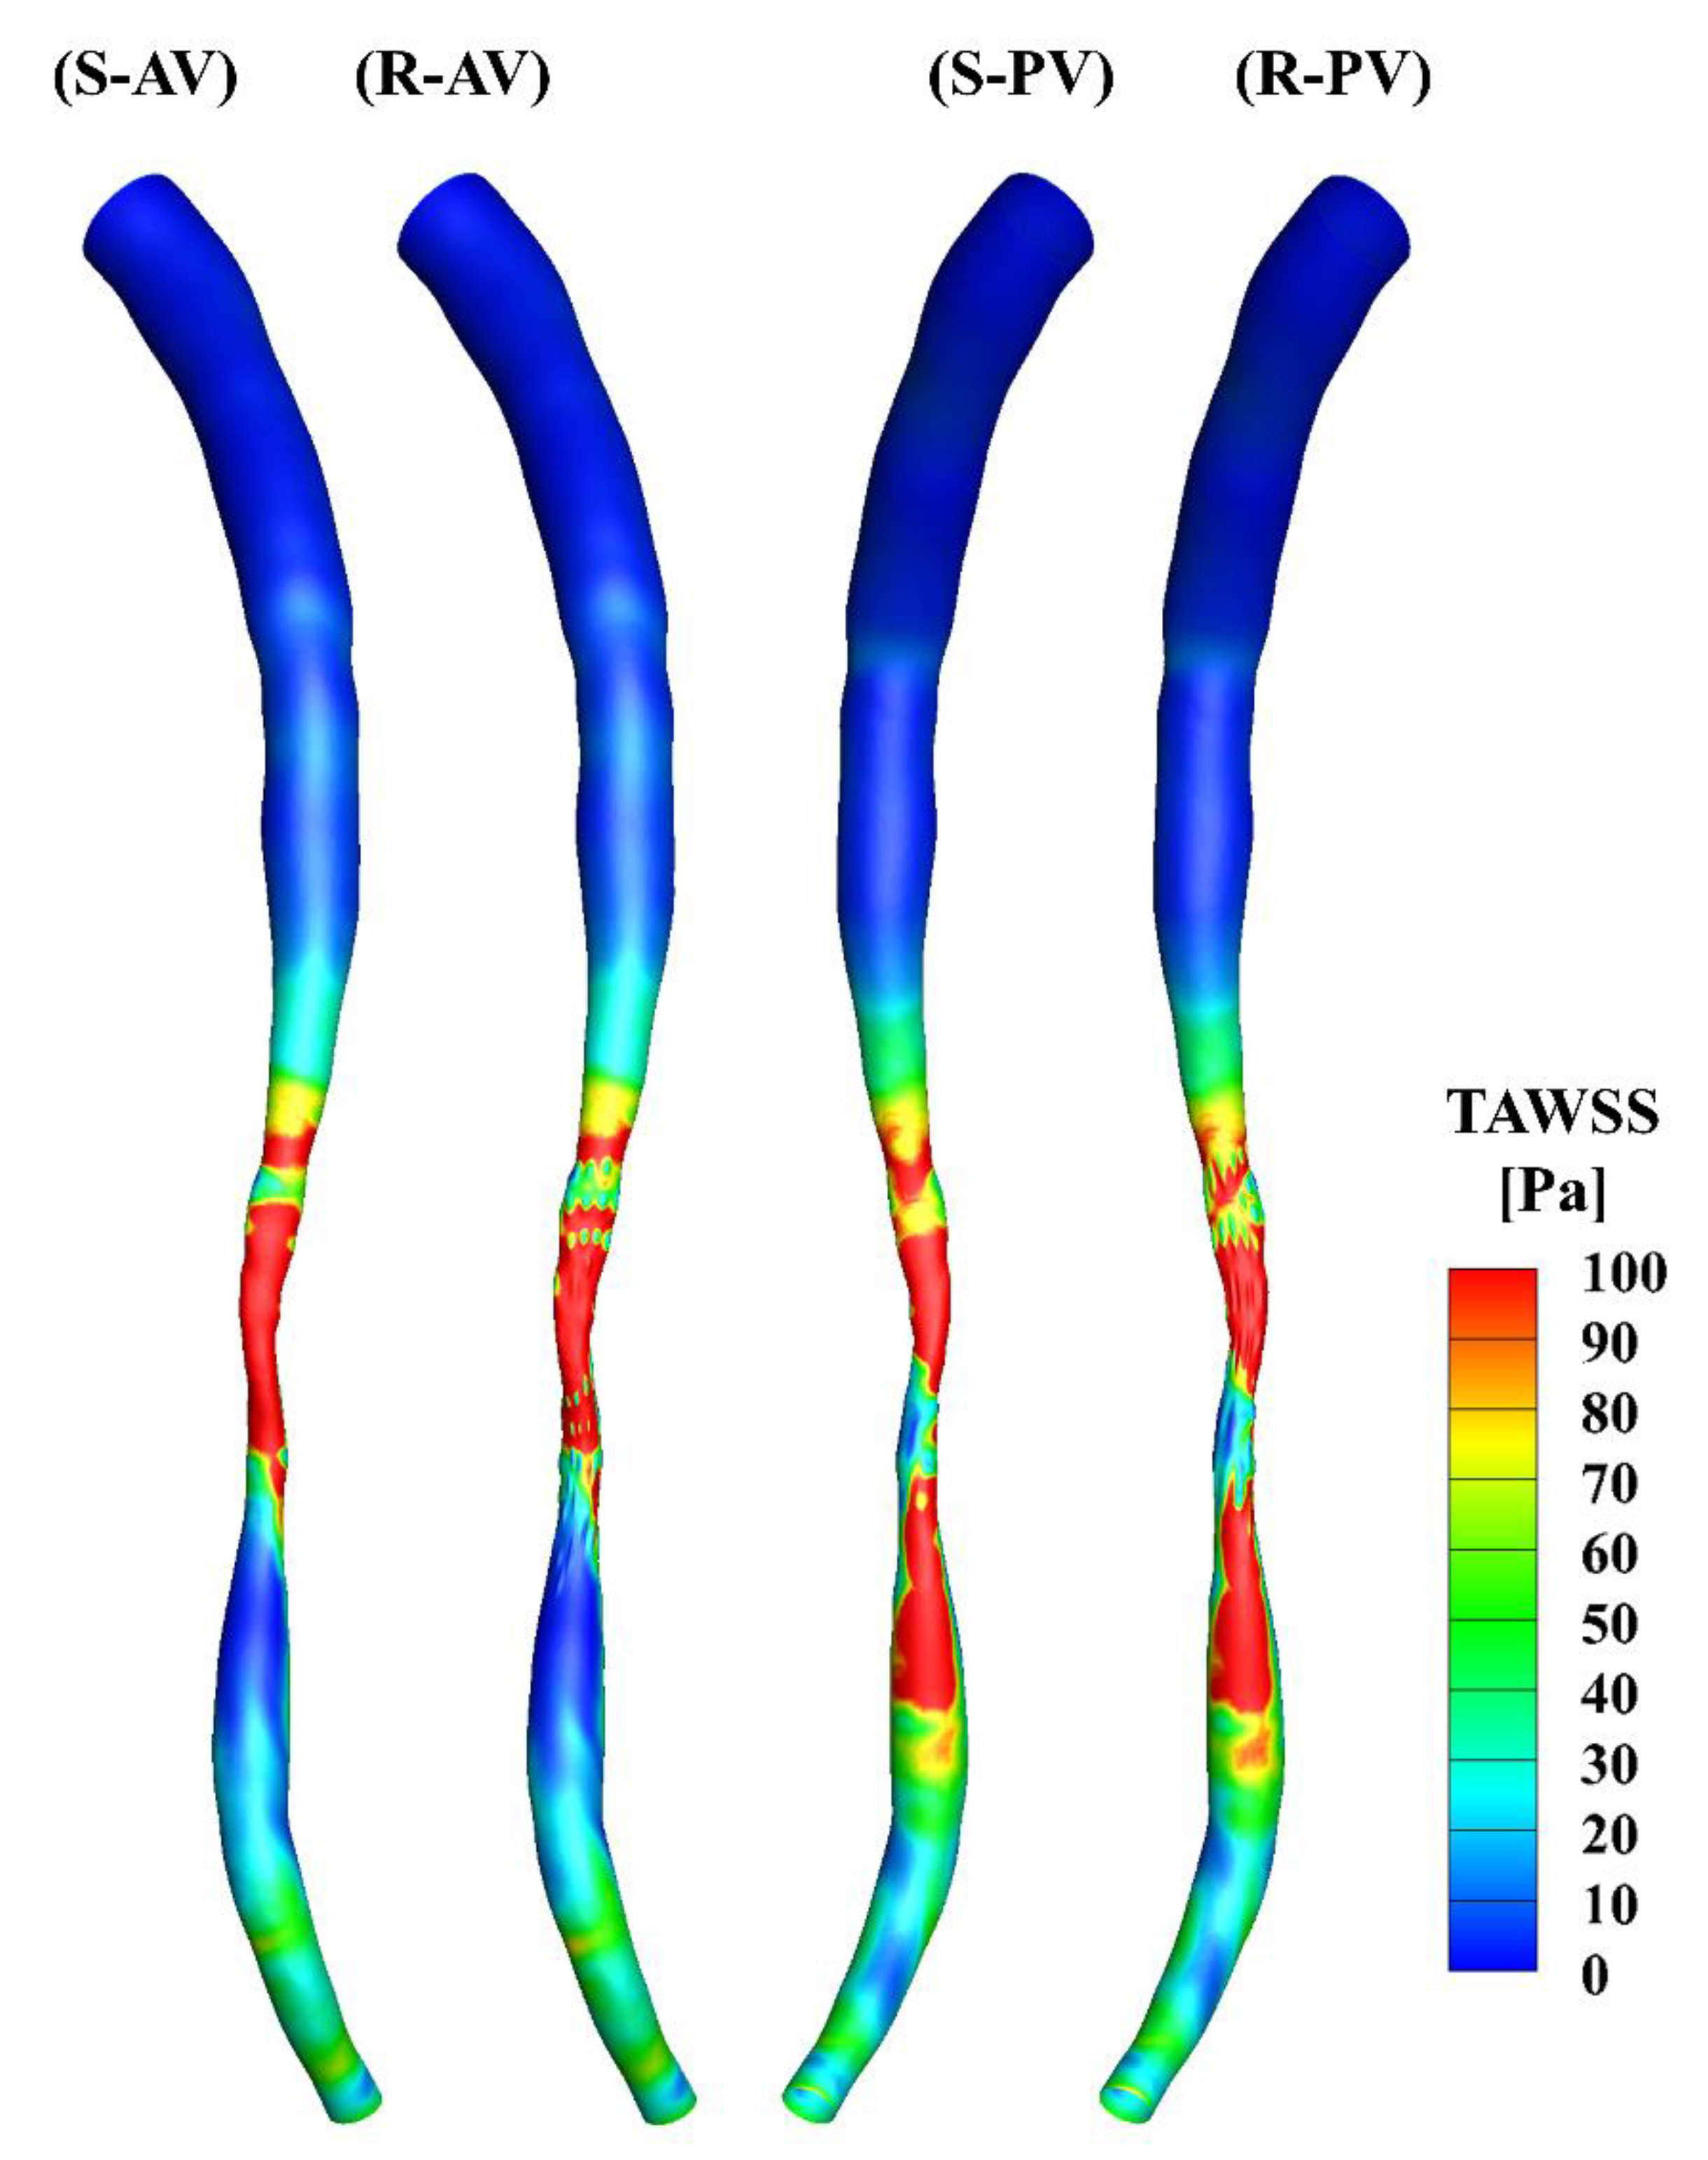
The TAWSS was calculated over the cardiac cycle and is presented in Figure 5. There is a minor difference in the upstream segments of the two models, and the high WSS occurs primarily in the middle of the stenotic region in both cases. The distributions of the TAWSS are generally similar, yet differences may be observed in the stenotic region due to the presence of the surface roughness.
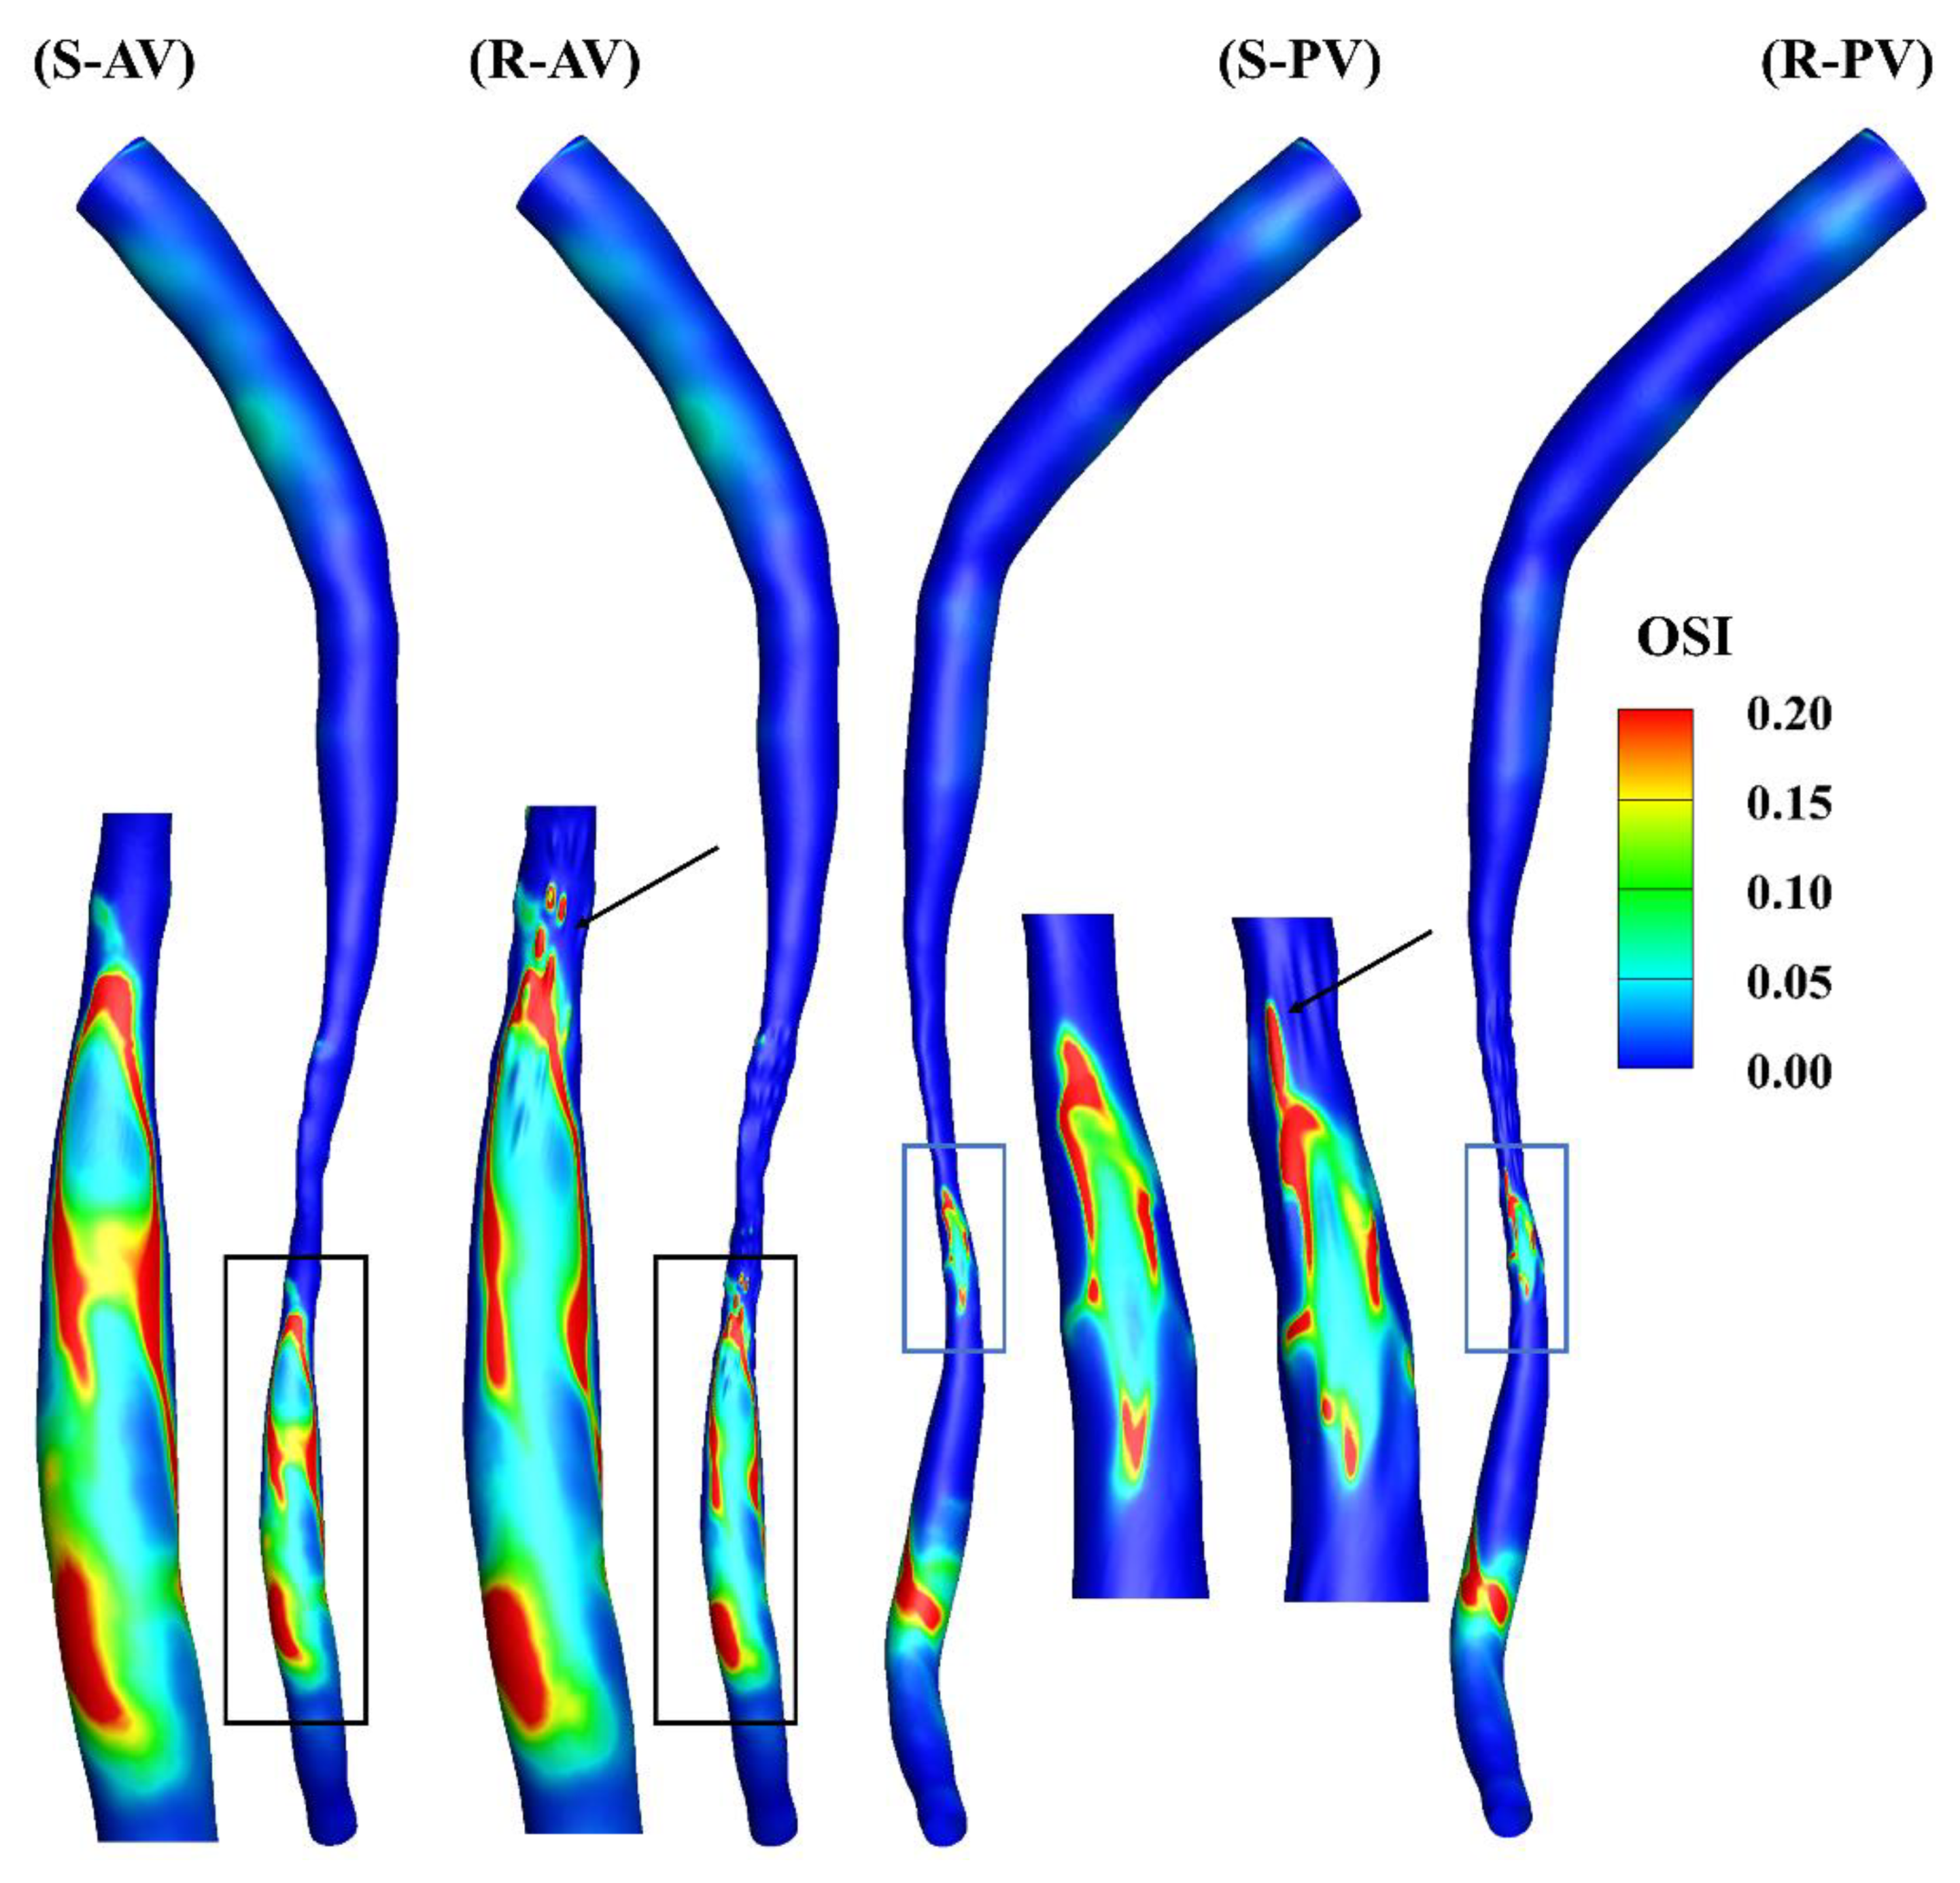
Figure 6 shows the oscillation of the WSS, and a cut-off value of 0.2 is present in the contours. A locally elevated OSI occurs primarily downstream of the stenosis, and its distributions are different in the models, as can be observed in the zoomed-in views. A high OSI can also be found at the ridges, highlighted by the arrows in the figure.
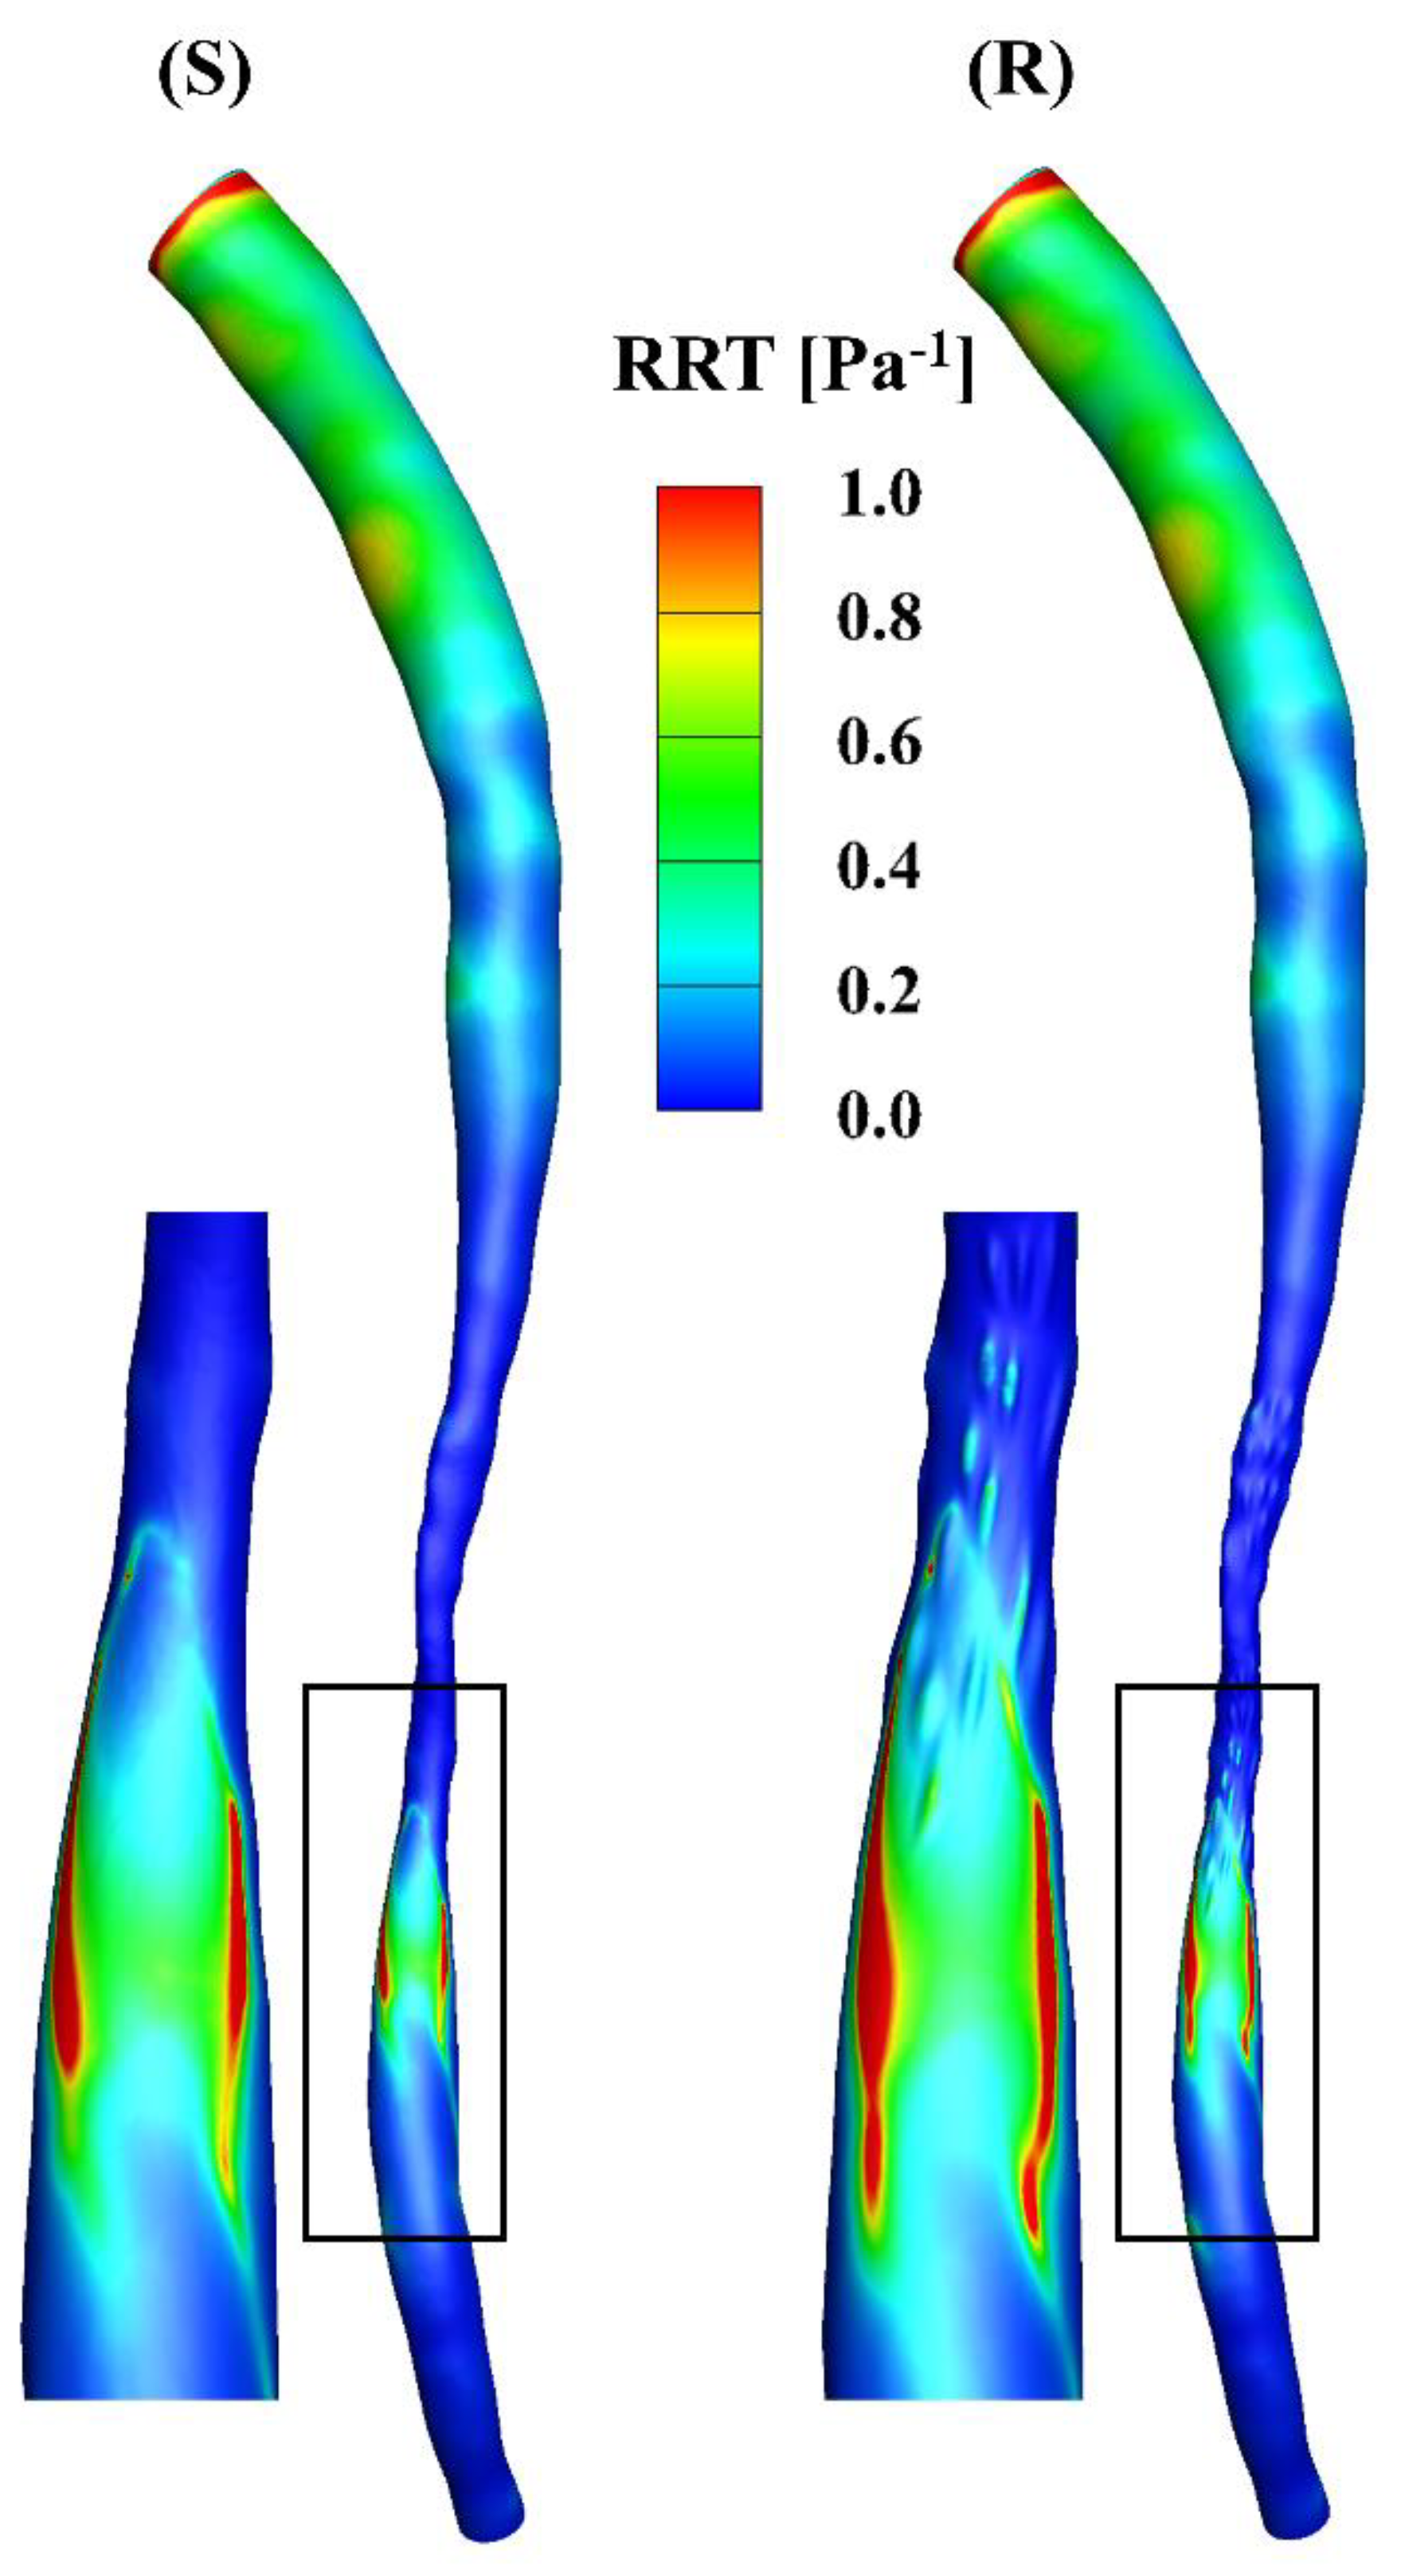
The RRT incorporates the effects of TAWSS and OSI, i.e., low and oscillatory flow, which is an indicator of the vascular endothelial permeability (Figure 7). A high RRT is observed near the inlet in the models, mainly due to the low TAWSS at that position and the mathematical calculations based on the equation for RRT. The values of the RRT in the downstream segments in the models are larger than those in the stenotic segments, where the high-RRT region corresponds to the oscillatory flow in Figure 2.
The TransWSS represents the multi-directionality of the WSS during the cardiac cycle. A high transWSS mainly occurs in the stenotic and downstream segments of the models (Figure 8). The zoomed-in views show that the distributions of transWSS are different, and a high transWSS can be found in the ridges in the rough model.
The total surface area of the stenotic region was changed after adding the roughness, with values of 46.77 mm2 and 48.11 mm2 in the smooth and rough models, respectively. To compare the difference in WSS metrics more specifically, the ratio of the surface area under different thresholds to the total surface area in the stenotic region is presented in Table 2. The proportion of low TAWSS in the smooth model was less than that in the rough model (4.51% vs. 5.16%, threshold < 5 Pa). A threshold of > 0.2 was set to calculate the proportions of high OSI in the stenotic region, which were 1.97% and 2.47% in the smooth and rough models, respectively. Moreover, the proportions of high RRT (> 0.5 Pa−1) in the stenotic region of the smooth and rough models were 1.22% and 1.62%, yet the proportion of high transWSS in the stenotic region was slightly smaller in the rough model compared with the smooth model (4.95% vs. 4.44%, threshold > 10 Pa). From the statistics in the table, the maximum difference in WSS metrics induced by the roughness was 4.69%.
In summary, the near-wall velocity in the rough model was found to be lower, mainly due to the trapping effects of the flow inside the ridges and valleys. This also correlates with a larger RRT [13]. However, the pressure distributions of the two models did not vary significantly. Over the cardiac cycle, although the difference in the proportion under various WSS metrics in the stenotic region was slight, based on the calculations, the distributions of the WSS contours were different. A lower WSS was found in the rough model from the results for TAWSS and RRT. Moreover, a slightly higher OSI but lower transWSS may demonstrate a more oscillatory flow from the axial direction in the rough model. It is known that a low and oscillatory flow is associated with plaque formation and progression [31,32]. The results above indicate a slightly higher potential for atherosclerotic change in the rough model.
Bhaganagar [5] concluded that the region in the vicinity of rough plaque is directly affected by the plaque morphology, and the regions away from the rough wall are indistinguishable. In our study, the stenotic region was directly affected by the roughness of the plaque, and the differences in the upstream segment were minor and could be neglected. However, the velocity and WSS distributions in the downstream segment of the artery changed due to the rough plaque morphology, especially regarding the contours of OSI, RRT and transWSS. To specify the variations in WSS in the downstream region, the areas of high shear stress in the smooth and rough models were calculated under the same threshold, as mentioned previously (OSI > 0.2, 4.41 vs. 4.15 mm2; RRT > 0.5 Pa−1, 1.93 vs. 2.54 mm2; transWSS > 10 Pa, 6.75 vs. 4.19 mm2), and the differences were 5.90%, 31.60% and 37.93%, respectively. It can therefore be concluded that the stenotic roughness not only influences the flow in the stenotic segment but also changes the hemodynamics downstream of the stenosis.
Our study demonstrated that stenotic model simulations with a smooth surface may contribute to an inaccurate estimation of the WSS metrics. Apart from the smooth surface assumption, other assumptions or simplifications are often introduced, which may affect the outcomes of a hemodynamic study. The WSS variabilities resulting from the surface roughness in this study were as significant as the variations found from other factors such as the periodicity of the flow boundary waveform [33], blood viscosity [34] and inlet flow condition [35].
Currently, a number of papers focus on the study and evaluation of the functional severity of the coronary stenosis in terms of fractional flow reserve [36,37,38,39], but few analyze the plaque itself. The characteristics of the plaque can reveal its formation, development and even rupture. Herein, we analyzed the impact of the surface roughness on the hemodynamics, and the flow and WSS in the stenotic and downstream regions were changed if the effect was included.
One major limitation of this study is the assumption of a rigid wall. It remains unclear how the deformation of the arterial wall would influence the comparisons between smooth and rough surface simulations, and this may be addressed in future studies by considering both wall deformation and roughness. In addition, there is currently no standard for the selection of the threshold for the WSS metrics. The values of the threshold in our study were based on our simulation results and selected to present a better comparison. The roughness in the stenotic region was randomly generated, based on the stenosis morphology in this study. Realistic patient-specific roughness may be included in the future. Moreover, this study is only a preliminary analysis of the patient-specific roughness. More patient-specific models and experimental validations should be performed in the future to further elucidate the characteristics of the flow.
4. Conclusions
A patient-specific geometry with a smooth surface was constructed, and a random roughness was added only in the stenotic region to create a partially rough model. Oscillatory flow was demonstrated downstream in both models, and a lower near-wall velocity was observed in the rough model. The pressure distributions did not vary significantly depending on the presence of the surface roughness. In the stenotic region, the variations in the proportions of WSS metrics under different thresholds were slight, contributing to a slightly lower and oscillatory flow in the axial direction in the rough model. However, the differences in the WSS metrics in the downstream region became larger. The findings suggest that taking the stenotic surface roughness into account could be important for WSS investigations, especially when OSI, RRT and transWSS are the main hemodynamic parameters of concern. However, the impact may be negligible in pressure-related studies.
Author Contributions
Conceptualization, T.B.; methodology, T.B. and J.Y.; software, T.B. and F.-B.T.; validation, T.B. and J.Y.; formal analysis, J.Y.; investigation, J.Y.; resources, T.B.; data curation, J.Y.; writing—original draft preparation, J.Y; writing—review and editing, T.B. and F.-B.T.; visualization, J.Y.; supervision, T.B., F.-B.T. and A.S.; project administration, T.B.; funding acquisition, T.B. All authors have read and agreed to the published version of the manuscript.
Funding
This research was funded by Australian Research Council Linkage Award (Project No. LP150100574) and Australian Research Council Discovery Early Career Researcher Award (Project No. DE160101098).
Institutional Review Board Statement
Not applicable.
Informed Consent Statement
Informed consent was obtained from all subjects involved in the study.
Data Availability Statement
The data presented in this study are available on request from the corresponding author.
Conflicts of Interest
The authors declare no conflict of interest.
References
- Ezzati, M.; Obermeyer, Z.; Tzoulaki, I.; Mayosi, B.M.; Elliott, P.; Leon, D.A. Contributions of risk factors and medical care to cardiovascular mortality trends. Nat. Rev. Cardiol. 2015, 12, 508. [Google Scholar] [CrossRef] [PubMed] [Green Version]
- Deplano, V.; Siouffi, M. Experimental and numerical study of pulsatile flows through stenosis: Wall shear stress analysis. J. Biomech. 1999, 32, 1081–1090. [Google Scholar] [CrossRef]
- Van Wyk, S.; Wittberg, L.P.; Fuchs, L. Wall shear stress variations and unsteadiness of pulsatile blood-like flows in 90-degree bifurcations. Comput. Biol. Med. 2013, 43, 1025–1036. [Google Scholar] [CrossRef] [PubMed]
- Eckmann, D.M.; Grotberg, J.B. Experiments on transition to turbulence in oscillatory pipe flow. J. Fluid Mech. 1991, 222, 329–350. [Google Scholar] [CrossRef]
- Bhaganagar, K. Direct numerical simulation of flow in stenotic channel to understand the effect of stenotic morphology on turbulence. J. Turbul. 2009, 10, N41. [Google Scholar] [CrossRef]
- Marques, P.F.; Oliveira, M.E.C.; Franca, A.S.; Pinotti, M. Modeling and simulation of pulsatile blood flow with a physiologic wave pattern. Artif. Organs 2003, 27, 478–485. [Google Scholar] [CrossRef]
- Varghese, S.S.; Frankel, S.H. Numerical modeling of pulsatile turbulent flow in stenotic vessels. J. Biomech. Eng. 2003, 125, 445–460. [Google Scholar] [CrossRef]
- Barber, T.J.; Simmons, A. Large eddy simulation of a stenosed artery using a femoral artery pulsatile flow profile. Artif. Organs 2011, 35, E155–E160. [Google Scholar] [CrossRef]
- Sherwin, S.J.; Blackburn, H.M. Three-dimensional instabilities and transition of steady and pulsatile axisymmetric stenotic flows. J. Fluid Mech. 2005, 533, 297–327. [Google Scholar] [CrossRef] [Green Version]
- Griffith, M.D.; Leweke, T.; Thompson, M.C.; Hourigan, K. Steady inlet flow in stenotic geometries: Convective and absolute instabilities. J. Fluid Mech. 2008, 616, 111. [Google Scholar] [CrossRef]
- Kitamura, K.; Hasegawa, H.; Kanai, H. Accurate estimation of carotid luminal surface roughness using ultrasonic radio-frequency echo. Jpn. J. Appl. Phys. 2012, 51, 07GF08. [Google Scholar] [CrossRef]
- Nagai, Y.; Cinthio, M.; Hasegawa, H.; Bengtsson, M.; Evander, M.; Albinsson, J.; Kanai, H. In vitro experiment using porcine artery for evaluation of ultrasonic measurement of arterial luminal surface profile. J. Med. Ultrason. 2014, 41, 431–437. [Google Scholar] [CrossRef] [PubMed]
- Yakhot, A.; Grinberg, L.; Nikitin, N. Modeling rough stenoses by an immersed-boundary method. J. Biomech. 2005, 38, 1115–1127. [Google Scholar] [CrossRef] [PubMed]
- Stroud, J.; Berger, S.; Saloner, D. Influence of stenosis morphology on flow through severely stenotic vessels: Implications for plaque rupture. J. Biomech. 2000, 33, 443–455. [Google Scholar] [CrossRef]
- Johnston, P.R.; Kilpatrick, D. Mathematical modelling of flow through an irregular arterial stenosis. J. Biomech. 1991, 24, 1069–1077. [Google Scholar] [CrossRef]
- Umezu, M.; Yamada, T.; Fujimasu, H.; Fujimoto, T.; Ranawake, M.; Nogawa, A.; Kijima, T. Effects of surface roughness on mechanical hemolysis. Artif. Organs 1996, 20, 575–578. [Google Scholar] [CrossRef]
- Mustapha, N.; Mandal, P.K.; Johnston, P.R.; Amin, N. A numerical simulation of unsteady blood flow through multi-irregular arterial stenoses. Appl. Math. Model. 2010, 34, 1559–1573. [Google Scholar] [CrossRef]
- Bark Jr, D.L.; Ku, D.N. Wall shear over high degree stenoses pertinent to atherothrombosis. J. Biomech. 2010, 43, 2970–2977. [Google Scholar] [CrossRef]
- Xiong, G.; Taylor, C.A. Influence of vessel roughness on wall shear stress in image-based blood flow modeling. In Proceedings of the 2010 IEEE International Symposium on Biomedical Imaging: From Nano to Macro, Rotterdam, The Netherlands, 14–17 April 2010; pp. 33–36. [Google Scholar]
- Cho, Y.I.; Back, L.H.; Crawford, D.W.; Cuffel, R.F. Experimental study of pulsatile and steady flow through a smooth tube and an atherosclerotic coronary artery casting of man. J. Biomech. 1983, 16, 933–946. [Google Scholar] [CrossRef]
- Back, L.; Cho, Y.; Crawford, D.; Cuffel, R. Effect of mild atherosclerosis on flow resistance in a coronary artery casting of man. J. Biomech. Eng. 1984, 106, 48–53. [Google Scholar] [CrossRef]
- Sarifuddin; Chakravarty, S.; Mandal, P.K. Effect of asymmetry and roughness of stenosis on non-Newtonian flow past an arterial segment. Int. J. Comput. Methods 2009, 6, 361–388. [Google Scholar] [CrossRef]
- Kenner, T. The measurement of blood density and its meaning. Basic Res. Cardiol. 1989, 84, 111–124. [Google Scholar] [CrossRef] [PubMed]
- Mayer, G.A. Blood viscosity in healthy subjects and patients with coronary heart disease. Can. Med. Assoc. J. 1964, 91, 951. [Google Scholar] [PubMed]
- Myers, J.; Moore, J.; Ojha, M.; Johnston, K.; Ethier, C. Factors influencing blood flow patterns in the human right coronary artery. Ann. Biomed. Eng. 2001, 29, 109–120. [Google Scholar] [CrossRef]
- El Zahab, Z.; Divo, E.; Kassab, A. A localized collocation meshless method (LCMM) for incompressible flows CFD modeling with applications to transient hemodynamics. Eng. Anal. Bound. Elem. 2009, 33, 1045–1061. [Google Scholar] [CrossRef]
- He, X.; Ku, D.N. Pulsatile flow in the human left coronary artery bifurcation: Average conditions. J. Biomech. Eng. 1996, 118, 74–82. [Google Scholar] [CrossRef]
- Himburg, H.A.; Grzybowski, D.M.; Hazel, A.L.; LaMack, J.A.; Li, X.-M.; Friedman, M.H. Spatial comparison between wall shear stress measures and porcine arterial endothelial permeability. Am. J. Physiol.-Heart Circ. Physiol. 2004, 286, H1916–H1922. [Google Scholar] [CrossRef] [Green Version]
- Peiffer, V.; Sherwin, S.J.; Weinberg, P.D. Computation in the rabbit aorta of a new metric–the transverse wall shear stress–to quantify the multidirectional character of disturbed blood flow. J. Biomech. 2013, 46, 2651–2658. [Google Scholar] [CrossRef] [Green Version]
- Yi, J.; Tian, F.-B.; Simmons, A.; Barber, T. A Computational Analysis of the Influence of a Pressure Wire in Evaluating Coronary Stenosis. Fluids 2021, 6, 165. [Google Scholar] [CrossRef]
- Gijsen, F.; Katagiri, Y.; Barlis, P.; Bourantas, C.; Collet, C.; Coskun, U.; Daemen, J.; Dijkstra, J.; Edelman, E.; Evans, P.; et al. Expert recommendations on the assessment of wall shear stress in human coronary arteries: Existing methodologies, technical considerations, and clinical applications. Eur. Heart J. 2019, 40, 3421–3433. [Google Scholar] [CrossRef] [Green Version]
- Malek, A.M.; Alper, S.L.; Izumo, S. Hemodynamic Shear Stress and Its Role in Atherosclerosis. JAMA 1999, 282, 2035–2042. [Google Scholar] [CrossRef] [PubMed]
- Zhou, X.; Yin, L.; Xu, L.; Liang, F.J.J.o.b. Non-periodicity of blood flow and its influence on wall shear stress in the carotid artery bifurcation: An in vivo measurement-based computational study. J. Biomech. 2020, 101, 109617. [Google Scholar] [CrossRef] [PubMed]
- Lee, S.-W.; Steinman, D.A. On the relative importance of rheology for image-based CFD models of the carotid bifurcation. J. Biomech. Eng. 2007, 129, 273–278. [Google Scholar] [CrossRef] [PubMed]
- Moyle, K.R.; Antiga, L.; Steinman, D.A.J.J.o.b.e. Inlet conditions for image-based CFD models of the carotid bifurcation: Is it reasonable to assume fully developed flow? J. Biomech. Eng. 2006, 128, 371–379. [Google Scholar] [CrossRef]
- Ramasamy, A.; Jin, C.; Tufaro, V.; Bajaj, R.; Kilic, Y.; Safi, H.; Amersey, R.; Jones, D.; Torii, R.; Lansky, A.; et al. Computerised Methodologies for Non-Invasive Angiography-Derived Fractional Flow Reserve Assessment: A Critical Review. J. Interv. Cardiol. 2020, 2020, 6381637. [Google Scholar] [CrossRef]
- Jhand, A.; Gordon, P.C.; Sharaf, B.L.; Seto, A.H.; Amin, A.P.; Naidu, S.S.; Goldsweig, A.M. Contrast Fractional Flow Reserve (cFFR) and Computed Tomography Fractional Flow Reserve (CT-FFR) Guidance for Percutaneous Coronary Intervention (PCI). Curr. Cardiovasc. Imaging Rep. 2020, 13, 23. [Google Scholar] [CrossRef]
- Morris, P.D.; van de Vosse, F.N.; Lawford, P.V.; Hose, D.R.; Gunn, J.P. “Virtual” (Computed) Fractional Flow Reserve: Current Challenges and Limitations. JACC Cardiovasc. Interv. 2015, 8, 1009–1017. [Google Scholar] [CrossRef] [Green Version]
- Taylor, C.A.; Fonte, T.A.; Min, J.K. Computational Fluid Dynamics Applied to Cardiac Computed Tomography for Noninvasive Quantification of Fractional Flow Reserve: Scientific Basis. J. Am. Coll. Cardiol. 2013, 61, 2233–2241. [Google Scholar] [CrossRef] [Green Version]
Figure 1.
An illustration of the models in this study. (A) The patient-specific model with a smooth surface, obtained clinically; (B) the rough model rebuilt from (A) by manually adding roughness only in the stenotic region (zoomed-in views of the mesh at the inlet (blue square) and in the transition region from the upstream segment to the stenotic region (red square) in the rough model are also present); (C) the patient-specific velocity profile applied at the inlet.

Figure 2.
Streamlines at the peak inlet velocity of the cardiac cycle: (S) smooth model; (R) rough model.
Figure 2.
Streamlines at the peak inlet velocity of the cardiac cycle: (S) smooth model; (R) rough model.

Figure 3.
Zoomed-in views (scale factor 1:50) of the velocity contours of the slice across the stenosis in the smooth (S) and rough (R) models.
Figure 3.
Zoomed-in views (scale factor 1:50) of the velocity contours of the slice across the stenosis in the smooth (S) and rough (R) models.

Figure 4.
Pressure contours at the peak velocity of the smooth (S) and rough (R) models, respectively.
Figure 4.
Pressure contours at the peak velocity of the smooth (S) and rough (R) models, respectively.

Figure 5.
TAWSS distributions in the smooth (S) and rough (R) models. (AV) and (PV) show the contours from the anterior and posterior view.
Figure 5.
TAWSS distributions in the smooth (S) and rough (R) models. (AV) and (PV) show the contours from the anterior and posterior view.

Figure 6.
OSI contours of the smooth (S) and rough (R) models from the anterior (AV) and posterior (PV) views.
Figure 6.
OSI contours of the smooth (S) and rough (R) models from the anterior (AV) and posterior (PV) views.

Figure 7.
RRT distributions of the smooth (S) and rough (R) models, respectively.

Figure 8.
TransWSS contours of the smooth (S) and rough (R) models from the anterior (AV) and posterior (PV) views.
Figure 8.
TransWSS contours of the smooth (S) and rough (R) models from the anterior (AV) and posterior (PV) views.


Table 1.
Definitions and brief descriptions of four shear metrics in this study.
| Equation | Description | |
|---|---|---|
| Time-averaged wall shear stress (TAWSS) | Time average of the WSS magnitude over a cardiac cycle | |
| Oscillatory shear index (OSI) | Oscillatory variation in the WSS [27] | |
| Relative residence time (RRT) | Near-wall flow stagnation [28] | |
| Transverse wall shear stress (transWSS) | Multi-directionality of the flow field [29] |
Table 2.
Proportion of the WSS metrics under different thresholds in the stenotic region.
| WSS Metrics | Threshold | Smooth | Rough | Difference |
|---|---|---|---|---|
| TAWSS (Pa) | < 5 | 4.51% | 5.16% | 0.65% |
| 5–10 | 3.14% | 3.37% | 0.23% | |
| 10–50 | 19.15% | 22.87% | 3.72% | |
| 50–100 | 31.63% | 31.72% | 0.09% | |
| > 100 | 41.57% | 36.88% | 4.69% | |
| OSI | < 0.1 | 95.10% | 94.50% | 0.60% |
| 0.1–0.2 | 2.93% | 3.04% | 0.11% | |
| 0.2–0.5 | 1.97% | 2.47% | 0.50% | |
| RRT (Pa−1) | < 0.2 | 94.42% | 93.14% | 1.28% |
| 0.2–0.5 | 4.36% | 5.21% | 0.85% | |
| > 0.5 | 1.22% | 1.62% | 0.40% | |
| TransWSS (Pa) | < 5 | 74.39% | 77.11% | 2.72% |
| 5–10 | 20.67% | 18.44% | 2.23% | |
| > 10 | 4.95% | 4.44% | 0.51% |
Publisher’s Note: MDPI stays neutral with regard to jurisdictional claims in published maps and institutional affiliations. |
© 2022 by the authors. Licensee MDPI, Basel, Switzerland. This article is an open access article distributed under the terms and conditions of the Creative Commons Attribution (CC BY) license (https://creativecommons.org/licenses/by/4.0/).
Share and Cite
MDPI and ACS Style
Yi, J.; Tian, F.-B.; Simmons, A.; Barber, T. Impact of Modelling Surface Roughness in an Arterial Stenosis. Fluids 2022, 7, 179. https://0-doi-org.brum.beds.ac.uk/10.3390/fluids7050179
AMA Style
Yi J, Tian F-B, Simmons A, Barber T. Impact of Modelling Surface Roughness in an Arterial Stenosis. Fluids. 2022; 7(5):179. https://0-doi-org.brum.beds.ac.uk/10.3390/fluids7050179
Chicago/Turabian StyleYi, Jie, Fang-Bao Tian, Anne Simmons, and Tracie Barber. 2022. "Impact of Modelling Surface Roughness in an Arterial Stenosis" Fluids 7, no. 5: 179. https://0-doi-org.brum.beds.ac.uk/10.3390/fluids7050179