Article

CFD Analysis of Convective Heat Transfer in a Vertical Square Sub-Channel for Laminar Flow Regime

by
Efrizon Umar
1,
Nathanael Panagung Tandian
2,
Ahmad Ciptadi Syuryavin
2,3,
Anwar Ilmar Ramadhan
4 and
Joko Hadi Prayitno
1,*
1
National Nuclear Energy Agency, BRIN, Jl. Tamansari No 71, Bandung 40132, Indonesia
2
Faculty of Mechanical and Aerospace Engineering, Bandung Institute of Technology, Jl. Ganesha No 10, Bandung 40132, Indonesia
3
Nuclear Energy Regulation Agency, Jl. Gadjah Mada No 8, Jakarta 11120, Indonesia
4
Department of Mechanical Engineering, Faculty of Engineering, Universitas Muhammadiyah Jakarta, Jl. Cempaka Putih Tengah No 27, Jakarta 10510, Indonesia
*
Author to whom correspondence should be addressed.
Submission received: 12 April 2022 / Revised: 27 May 2022 / Accepted: 30 May 2022 / Published: 17 June 2022
(This article belongs to the Special Issue Fluid Flows at the Nanoscale)

Abstract

:
The development of new practices in nuclear research reactor safety aspects and optimization of recent nuclear reactors needs knowledge on forced convective heat transfer within sub-channels formed between several nuclear fuel rods or heat exchanger tubes, not only in the fully developed regime but also in the developing regime or laminar flow regime. The main objective of this research was to find a new correlation equation for calculating the convective heat transfer coefficient in the vertical square sub-channels. Recently, a simulation study was conducted to find a new heat transfer correlation equation for calculating the convective heat transfer coefficient within a vertical square sub-channel in the developing regime or laminar flow regime for Reynolds number range 400 ≤ Re ≤ 1700. Simulations were carried out using a computational fluid dynamics (CFD) code and modeling already defined in the software. The novelty of the research lies in the analysis of the entrance effect for the sub-channel by proposing a new empirical correlation that can then be inserted into the STAT computer code. The surface temperature distribution around the tangential direction of the active cylinders shows that the implementation of active and dummy cylinders in the current study can simulate sub-channels that exist in a real nuclear reactor core. The current study shows that the flow simulated in this study is in its developing condition (entrance region). A new forced convective heat transfer correlation for the developing region in the form of Nu = 2.094(Gz)0.329 for the Graetz number range 161 ≤ Gz ≤ 2429 was obtained from the current study.

1. Introduction

Heating and cooling of fluids flowing inside conduits or around rod bundles in a nuclear reactor core are among the most important heat transfer processes in engineering. The design and analysis of heat exchangers or rod bundles in a nuclear reactor core require knowledge of the heat transfer coefficient between the wall of the conduits or rod bundles and the fluid flowing inside or around them [1,2,3,4]. Modeling the heat exchanger is very important task so as to estimate the performance of the system in terms of heat transfer and accordingly design the configuration [5]. Rod bundles are the heat exchange elements of a nuclear reactor, where in the coolant that passes through the sub-channels extracts heat from the surrounding fuel rods [6].
For a nuclear research reactor, many researchers have conducted theoretical [7,8,9,10,11,12,13] and experimental study [14,15] on convective heat transfer for natural, laminar, and turbulent flow in the sub-channel of a reactor core. In the theoretical study, RELAP5-3D was used for all computational modeling during the thermal–hydraulic analysis. Meanwhile, in the Bandung TRIGA research reactor, the STAT computer code was used [16,17] to study the essential safety parameters of the reactor. In actuality, the flow in the pool of the Bandung TRIGA research reactor is complex; water exiting the reactor rises toward the top of the pool where some part is removed to a cooling system and subsequently returned at the point near the level of the bottom grid plate. The construction of the Bandung TRIGA research reactor core is also made in such a way that the primary cooling water that comes out at a speed of 2.8 m/s is assumed to have no effect on the flow velocity in the reactor core. On the basis of this assumption, the heat transfer in the reactor core takes place by a pure natural convection, and the thermal hydraulic parameter analysis can be carried out via single-channel analysis without involving the outlet flow velocity from the primary cooling system. The use of the computer code STAT gives a significant deviation to the experimental data [16].
To improve the analysis using STAT computer code, it is necessary to carry out a three-dimensional analysis and consider the effect of flow from the primary cooling system. One method that can be used to overcome this problem is computational fluid dynamics [18,19,20,21,22,23,24,25]. Heat, mass, and momentum balance equations of the water are solved with the help of numerical analysis [21]. CFD is a powerful technique for study of the complex flow [25], and, compared to the experiment, results from CFD can often be obtained in a shorter time and at a lower cost [22,25]. For the Bandung TRIGA research reactor, a thermal–hydraulic analysis using CFD was carried out, both for the core according to the general atomic design [23] and for the reactor core after modification [24]. The results of this study indicated that the outlet flow from the primary cooling system has a significant effect on the sub-channel inlet velocity. Moreover, the length of the sub-channel in the TRIGA 2000 reactor core is very limited (38 cm), such that the flow in the sub-channel is predicted to be still in the developing regime. Research related to forced convection in sub-channels, including in developing regimes, is limited [26,27,28,29,30,31,32,33,34,35,36,37,38,39].
Recently, a simulation study was performed in the search for a new heat transfer correlation equation for calculating the convective heat transfer coefficient within a vertical square sub-channel in the developing regime or laminar flow regime with Reynolds number (Re) range 400 ≤ Re ≤ 1700. Simulations were carried out with computational fluid dynamics (CFD) code using modeling already defined in the software. The novelty of this research lies in the analysis of the entrance effect for the sub-channel by proposing a new empirical correlation which can then be inserted into the STAT computer code.

2. Materials and Methods

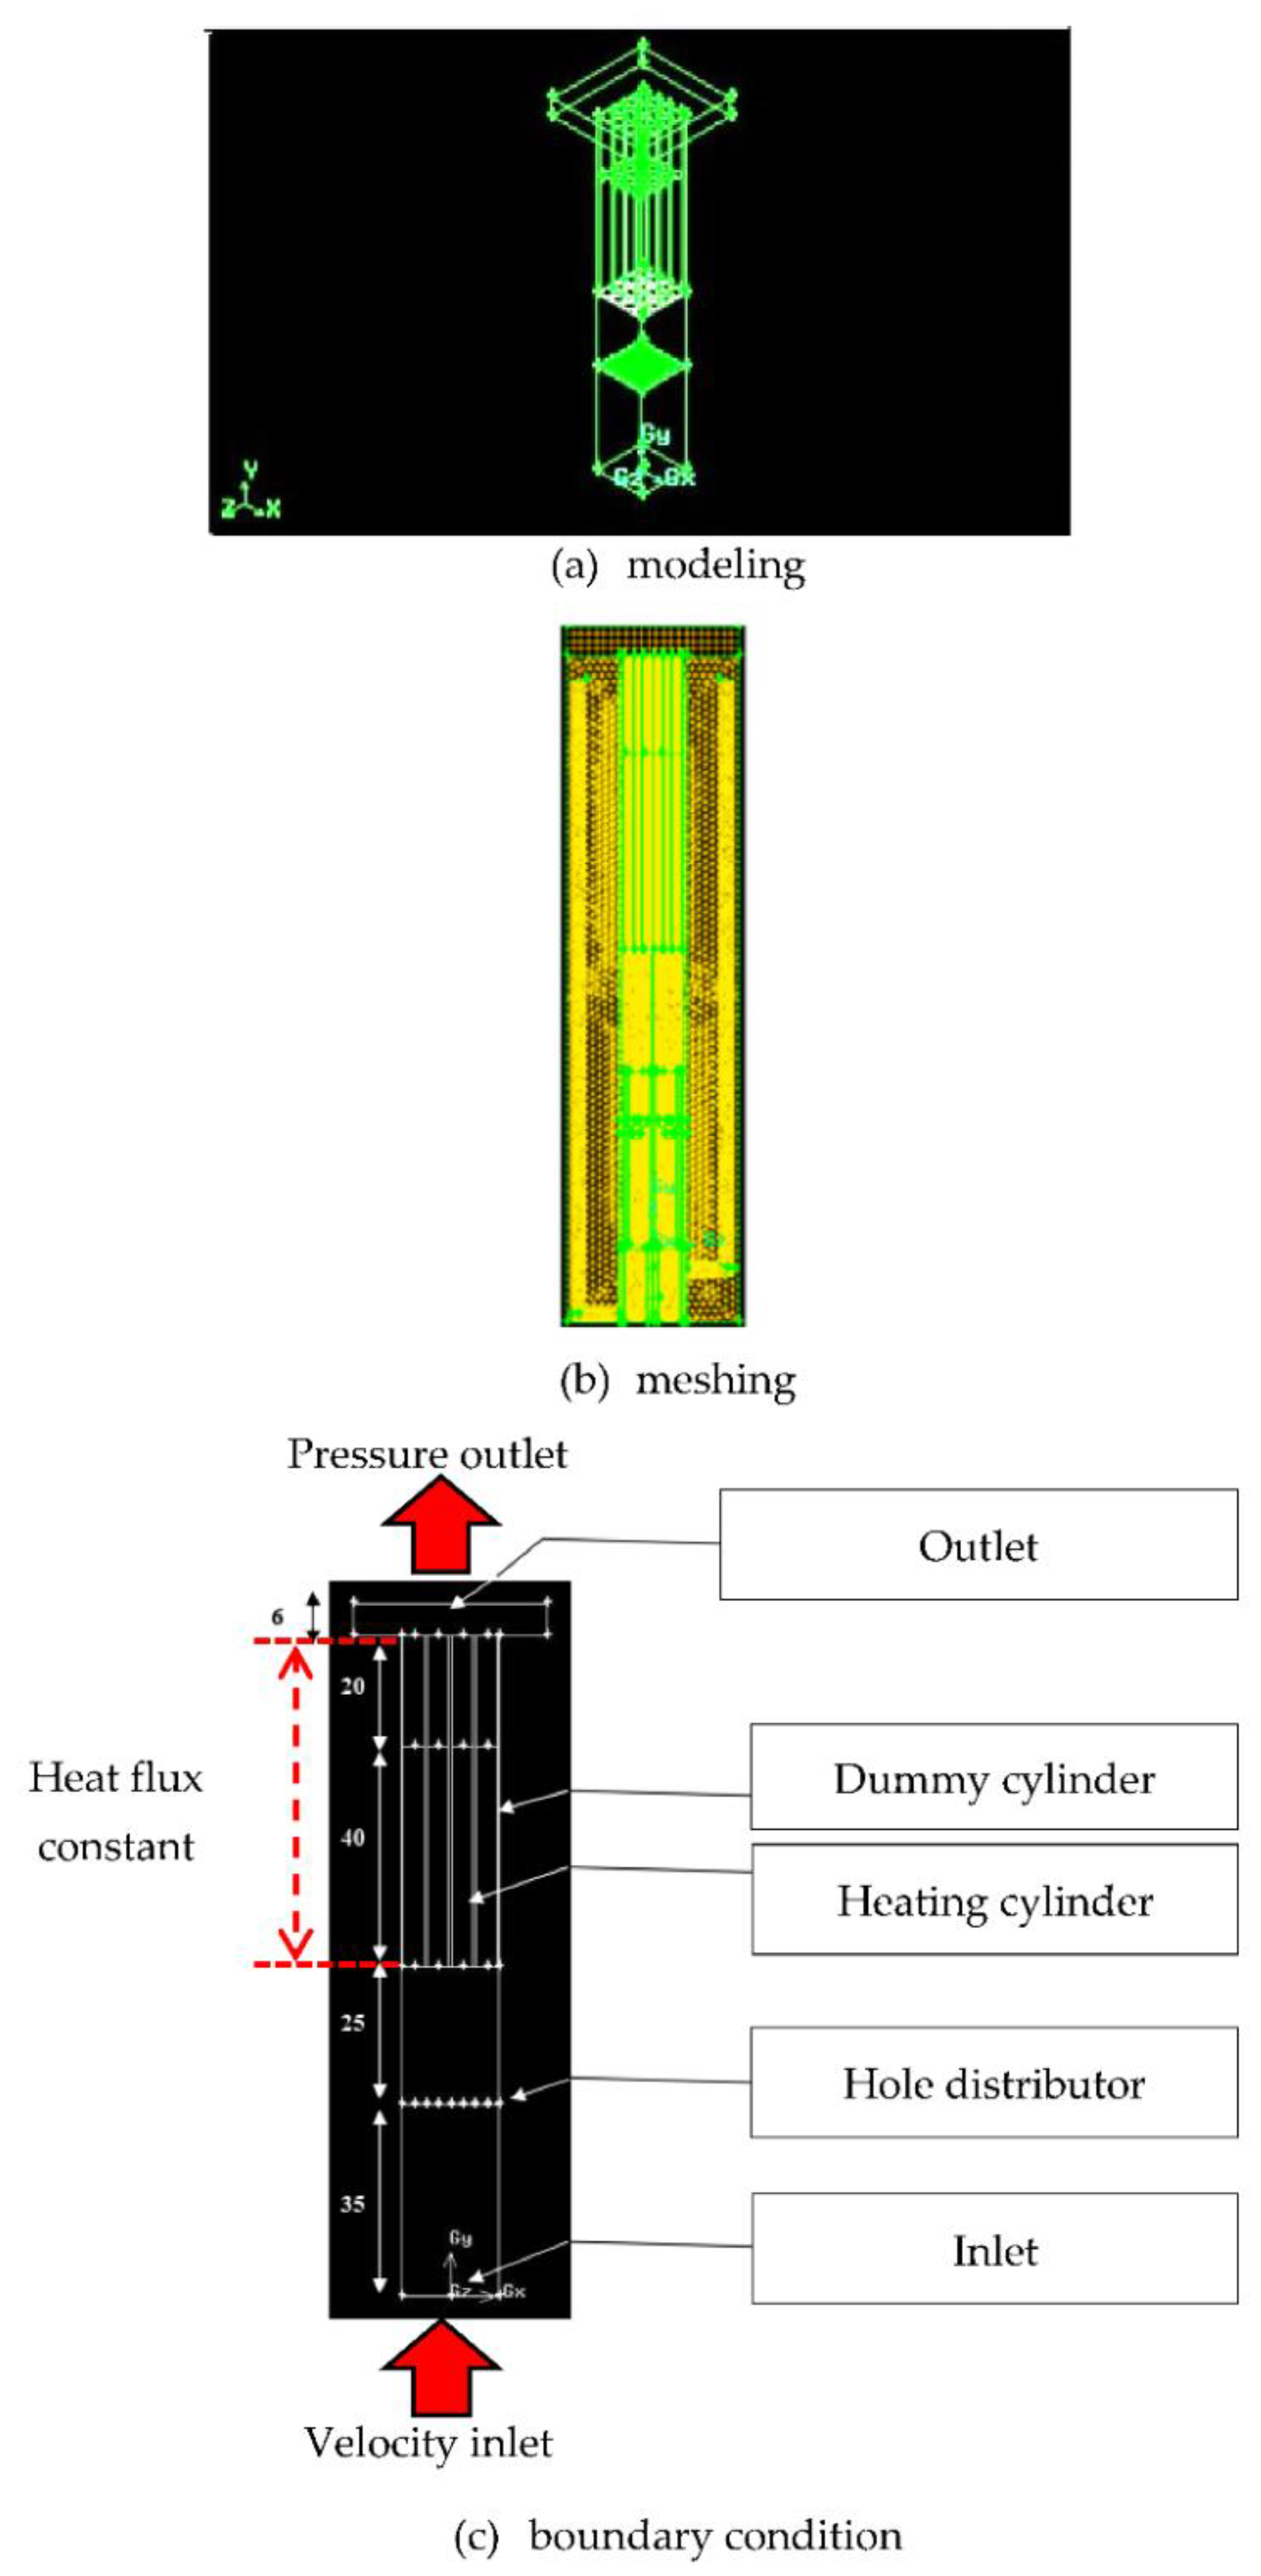
2.1. Numerical Model

Vertical cylinders simulate a bundle of nuclear reactor fuel rods or heat exchanger tubes. The size and the geometry of the vertical cylinder used in the current study specifically replicate the fuel rod of a nuclear reactor core with a pitch/diameter (P/D) ratio of about 1.16. Sketches of the test section used in this study and its schematic vertical cross-section are shown in Figure 1. The simulation test section was a model of the sub-channel in the CFD computer code consisting of the following components: a test box, a main test section, a cylinder assembly, a perforated plate acting as a flow distributor, a fresh water inlet, and a warm water outlet.
The main test section and the test box were made of glass sheets so that they were transparent. During a forced convection experiment, cooling water flows into lower part of the main test section through the cooling water inlet. The water flows through the perforated plates into the main chamber of the test section, where the cylinder assembly is installed. The water flows through the sub-channels between the cylinders, and finally leaves the main test section through the opening at the top of main test section. The horizontal cross-section of the cylinder assembly is shown in Figure 2. The cylinder assembly consisted of 16 vertical cylinders; four of them were active cylinders equipped with electric heaters, while the remaining cylinders were dummy cylinders without electric heaters. The sub-channel explored in this study was the main sub-channel formed by the active cylinders, i.e., the blue sub-channel in Figure 2.
The dummy cylinders were used to distribute the water flows through the sub-channels such that the flow characteristics within the sub-channel were similar to those of water flows inside the nuclear reactor core or vertical heat exchanger sub-channels (Figure 3). One major characteristic of the flow inside a sub-channel in a reactor core is the insignificant lateral flow, i.e., the water flow is dominated by its axial velocity. To ensure that the tested sub-channel had this flow characteristic, the gap between the cylinder walls and main test section walls had to be well designed. By using this arrangement, it was expected that the water flows inside sub-channels in a nuclear reactor core could be well simulated. This theoretical study analyzed the heat transfer in the main sub-channel using a CFD (FLUENT) software package. The computational domain covered by the CFD analysis consisted of the volume inside the test section main chamber filled with cooling water.

2.2. Boundary Conditions

It was assumed that heat flux on the active cylinder surface was constant and uniform, while the surface of the dummy cylinders was assumed to be adiabatic. Several other important assumptions were considered in this study, as listed below:
  • The experiment reached its steady operating condition.
  • Since the test section was opened to the atmosphere, the pressure at the water surface was constant at 1 bar, while pressures at other locations were hydrostatic pressures.
  • The fresh water inlet entered the test section at a room temperature of 300 K.
  • Gravity was taken as 9.8 m/s2.
  • The physical properties of water followed its temperature and were obtained from the literature (Table 1).
The theoretical CFD model assumed the boundary conditions shown in Table 2 in its computational domain.
Table 1. Physical properties of water at temperature of 300 K [23,29].
ρ (kg/m3)µ (N·s/m2)Cp (kJ/kg·K)k (W/m·K)
996.590.0008524.1790.6
Table 2. Boundary conditions for the CFD model.
Boundary TypeParameterValue
Pressure outletGauge pressure0 Pa
Backflow temperature298 K
Wall (heater)Heat flux100, 500, and 1000 W/m2
Wall (stainless steel)Heat flux0 W/m2
InletVelocity inlet
Reynolds number (Re)
0.7–1.0 m/s
(400 ≤ Re ≤ 1700)

2.3. Governing Equations

The governing equations utilized in the theoretical study followed the governing equations implemented in the CFD FLUENT. Basically, the equations consisted of a continuity equation, momentum equation, energy equations, and equations for the standard k–ε turbulence model. These equations are expressed below [12,23,29].
Continuity Equation: The continuity equation, or equation for the conservation of mass, can be written in the tensor notation as follows:
( ρ v ) = 0 ,
where ρ is water mass density, and v is velocity vector.
Momentum Equation: The conservation of momentum in an inertial (non-accelerating) reference frame can be described by the following equation:
. ( ρ v   v ) = p + .   τ = ρ g ,
where p is the static pressure, τ is the stress tensor (described below), and     ρ g is the gravitational body force. The stress tensor can be expressed as follows:
τ = μ ( ( v + v T ) 2 3 . v I ) ,
where μ is the molecular viscosity, I is the unit tensor, and the second term on the right-hand side of Equation (3) represents the effect of volume dilation.
Energy Equation: The energy conservation equation can be expressed in the following form:
.   ( v ρ ( h + 1 2 v 2 ) ) = .   ( κ e f f   T ) ,
where κ e f f is the effective thermal conductivity, i.e., the fluid thermal conductivity combined with the turbulence thermal conductivity, κ t is defined according to the turbulence model being used, and T is temperature of the water.

2.4. Parameters of Forced Convective Heat Transfer

In the design and analysis of heat exchangers or rod bundles in a nuclear reactor core, it is necessary to evaluate heat transfer coefficients for fluid flowing inside heat exchangers or around the rod bundles. If the heat transfer coefficient for a given geometry and specified flow conditions is known, the heat transfer rate at the prevailing temperature difference can be calculated using Equation (5) [2].
qc = hc A (TsurfaceTfluid).
From a dimensional analysis, the experimental results or the simulation results of CFD obtained in forced convection heat transfer experiments in long ducts and conduits can be correlated by the following equation [7]:
Nu = Φ(Re) Ө(Pr),
where the symbols Φ and Ө denote functions of the Reynolds number and Prandtl number, respectively. For heated fluid and turbulent flow, the Dittus–Boelter correlation [28,29,40] is used to calculate the Nusselt number of flow in a circular tube.
Nu = 0.023 Re0.8Pr0.4,
where
N u = the   Nusselt   dimensionless   number = h . D k
R e = the   Reynolds   dimensionless   number = ρ . V . D μ   P r = the   Prandtl   dimensionless   number = c p . μ k  
If the channel through which the fluid flows does not have a circular cross-section, it is also recommended that the heat transfer correlation be based on the hydraulic diameter (Dh), defined by
D h = 4 A P
where A is the cross-sectional area of the flow, and P is the wetted perimeter.
To express the forced convection correlation for fully developed flow in the sub-channel, the Nusselt number is used as the product of the Nusselt number for circular tube (Nu) with the correction factor formulated in Equation (9) [1,32].
Nu = ψ(Nu)ct,
where Nu = the Nusselt number = h . D k , (Nu)ct = the Nusselt number for flow in a circular tube, and ψ = the correction factor. For ratios of length (L) to diameter (D) of circular tubes greater than 60, and for 1.1 ≤ P/D ≤ 1.3, the correction factor ψ is
ψ = 1826 P/D − 1.043.
For short ducts, particularly in laminar flow, the right-hand side of Equation (6) must be modified by including the aspect ratio D h x .
Nu = Φ ( R e )   Ө   ( P r )   f   ( D h x ) ,  
where f ( D h x ) denotes the functional dependence of the aspect ratio.
In addition to the Reynolds number and Prandtl number, another factor that can affect the conditions of heat transfer by means of forced convection is the influence of the developing region. For laminar flow, the influence of the developing region is very important if the L/Dh ratio is <50 [2]. Some studies calculated the local and average Nusselt numbers for laminar entrance regions of circular tubes for the case of a fully developed velocity profile, and results of these analysis were described in the literature by introducing the Graetz number [2,3,41]. The forced convection heat transfer correlation in the sub-channel in the developing region for constant heat flux can be formulated as follows:
Nu = f (Re, Pr, Dh/x),
Nu = f (Gz).
The Graetz number is a dimensionless number that characterizes laminar flow in a conduit or sub-channel. The Graetz number is equal to the product of the specific heat capacity, diameter, characteristic length, characteristic speed, and mass density divided by thermal conductivity and length.

3. Results and Discussion

3.1. Grid-Independent Test

According to Table 3, grid-independent testing was conducted in CFD FLUENT for mesh sizes of 0.1, 0.2, 0.3, 0.4, and 0.5 mm. Grid-independent tests are run on physical models to determine the best mesh size. Grid independence was investigated in this study using various grid systems and five mesh sizes for pure water. Nusselt numbers were estimated for all five mesh sizes, and the results were close. The remnants were properly monitored throughout the recurrence process. All solutions were considered united when all governing equations were less than 10−6. Lastly, when the CFD FLUENT iteration led to a unified decision on the basis of a set of criteria, the results were available. At this stage, the Nusselt number in mesh size could be found throughout the computing domain.
The grid-independent Nusselt number versus Reynolds test was performed with respect to all grid mesh sizes. All mesh sizes were considered, but the mesh size of 0.5 mm was considered optimal in this study. Although any mesh size could be used for these five cases, Figure 4 shows that a mesh size of 0.5 mm provided the best accuracy.

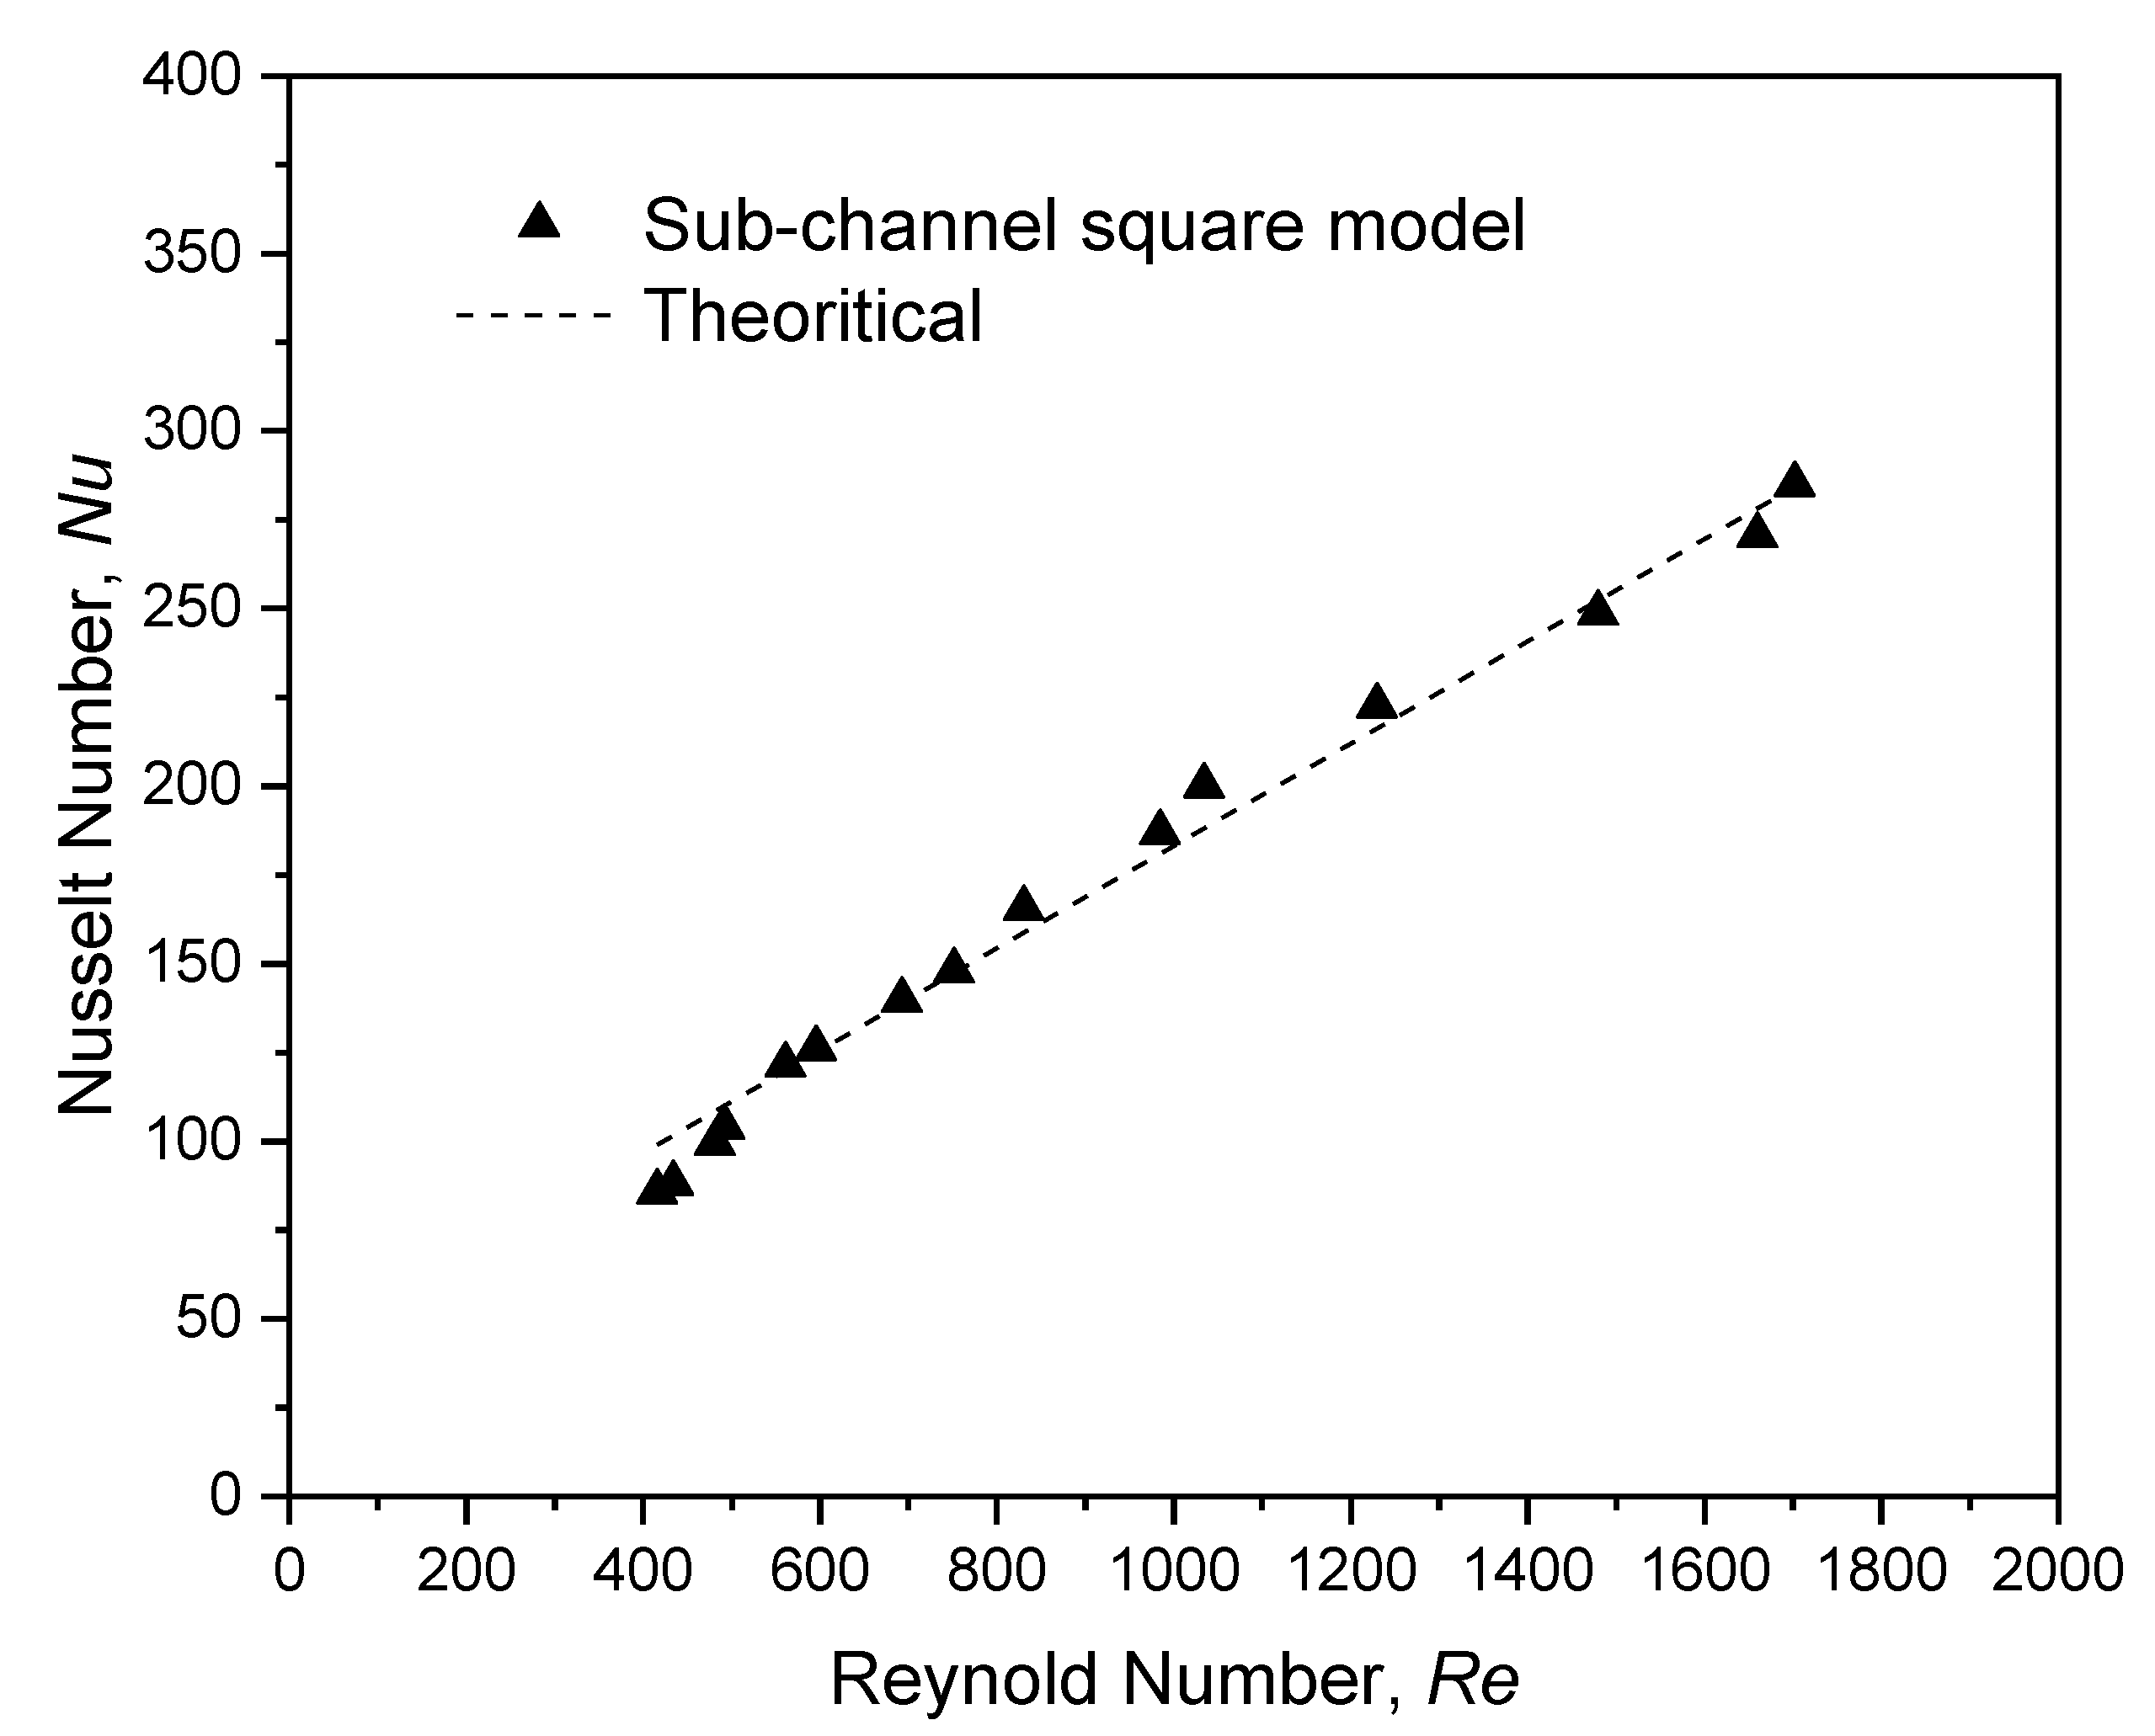
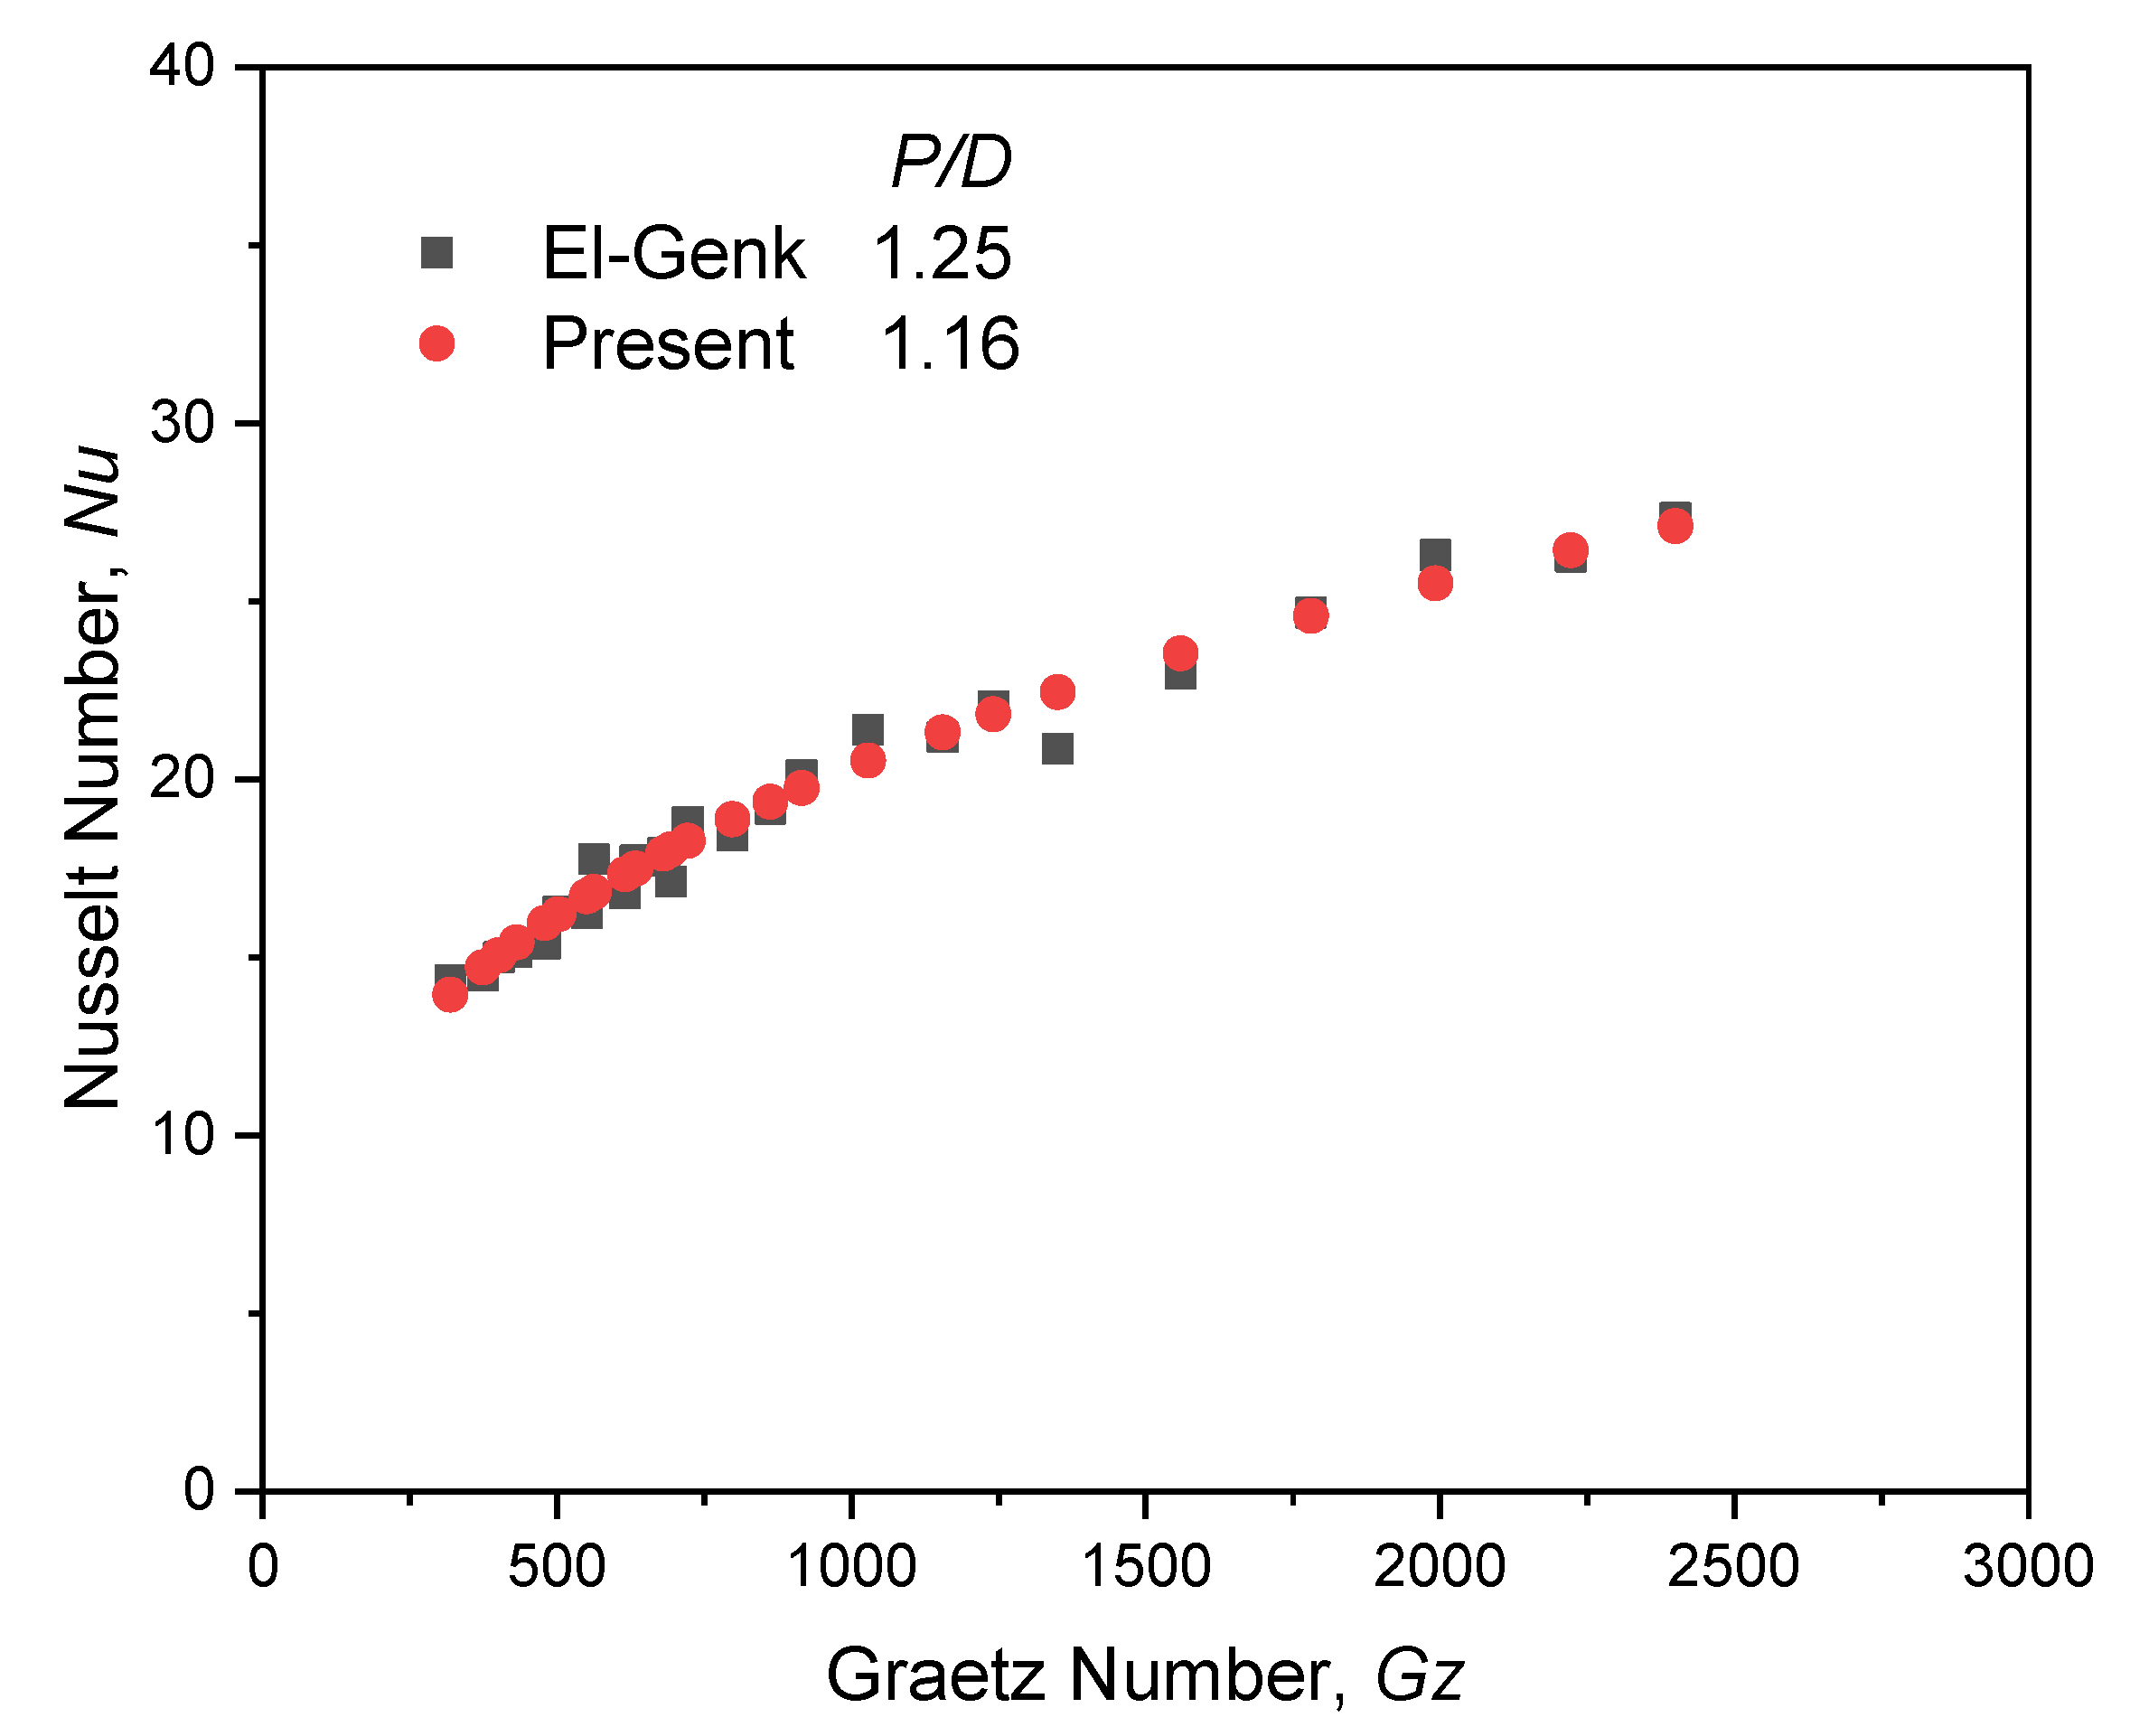
3.2. Validation of Results

The validation process is critical for ensuring that the results are correct when using the optimal size mesh model. This can be seen in Figure 5 as the Reynolds number increased (Re). The results of the theoretical study are shown as dotted black lines, revealing a good fit between the CFD results and the equation.

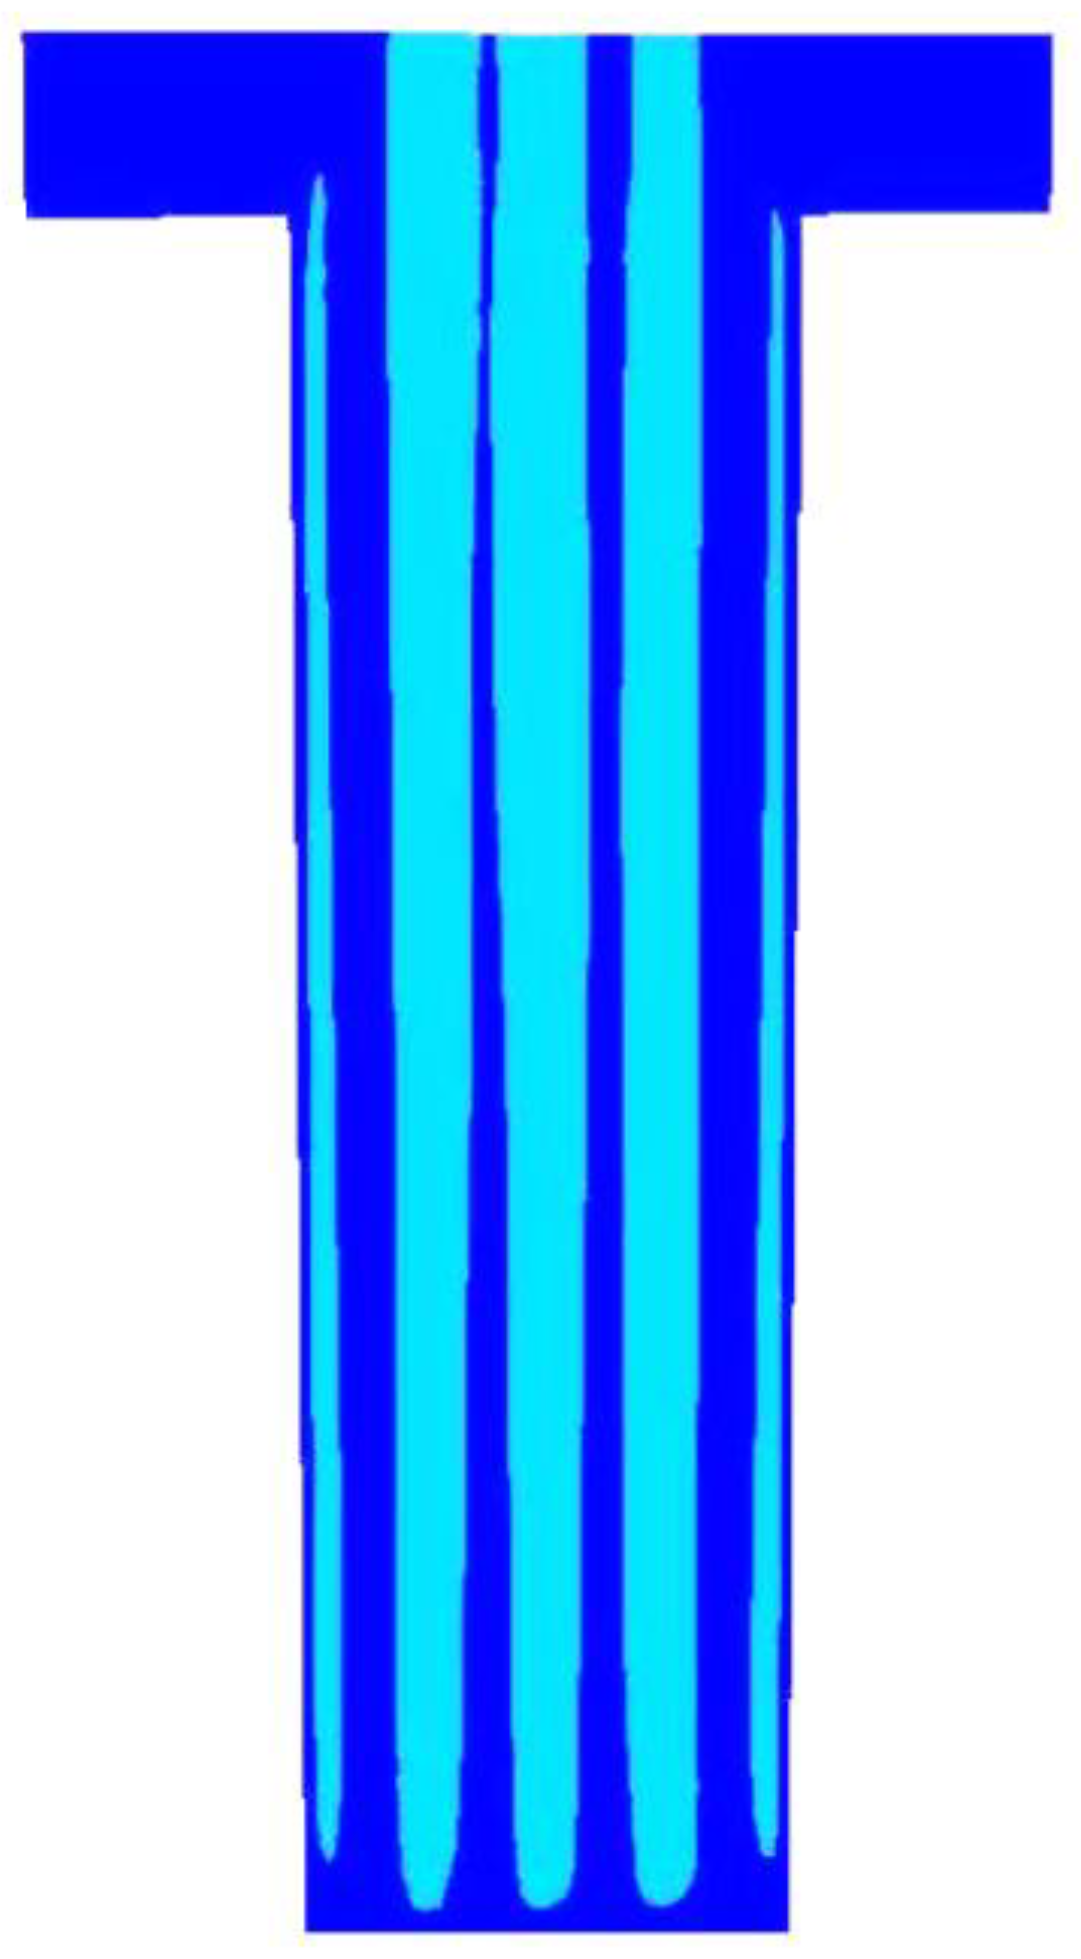
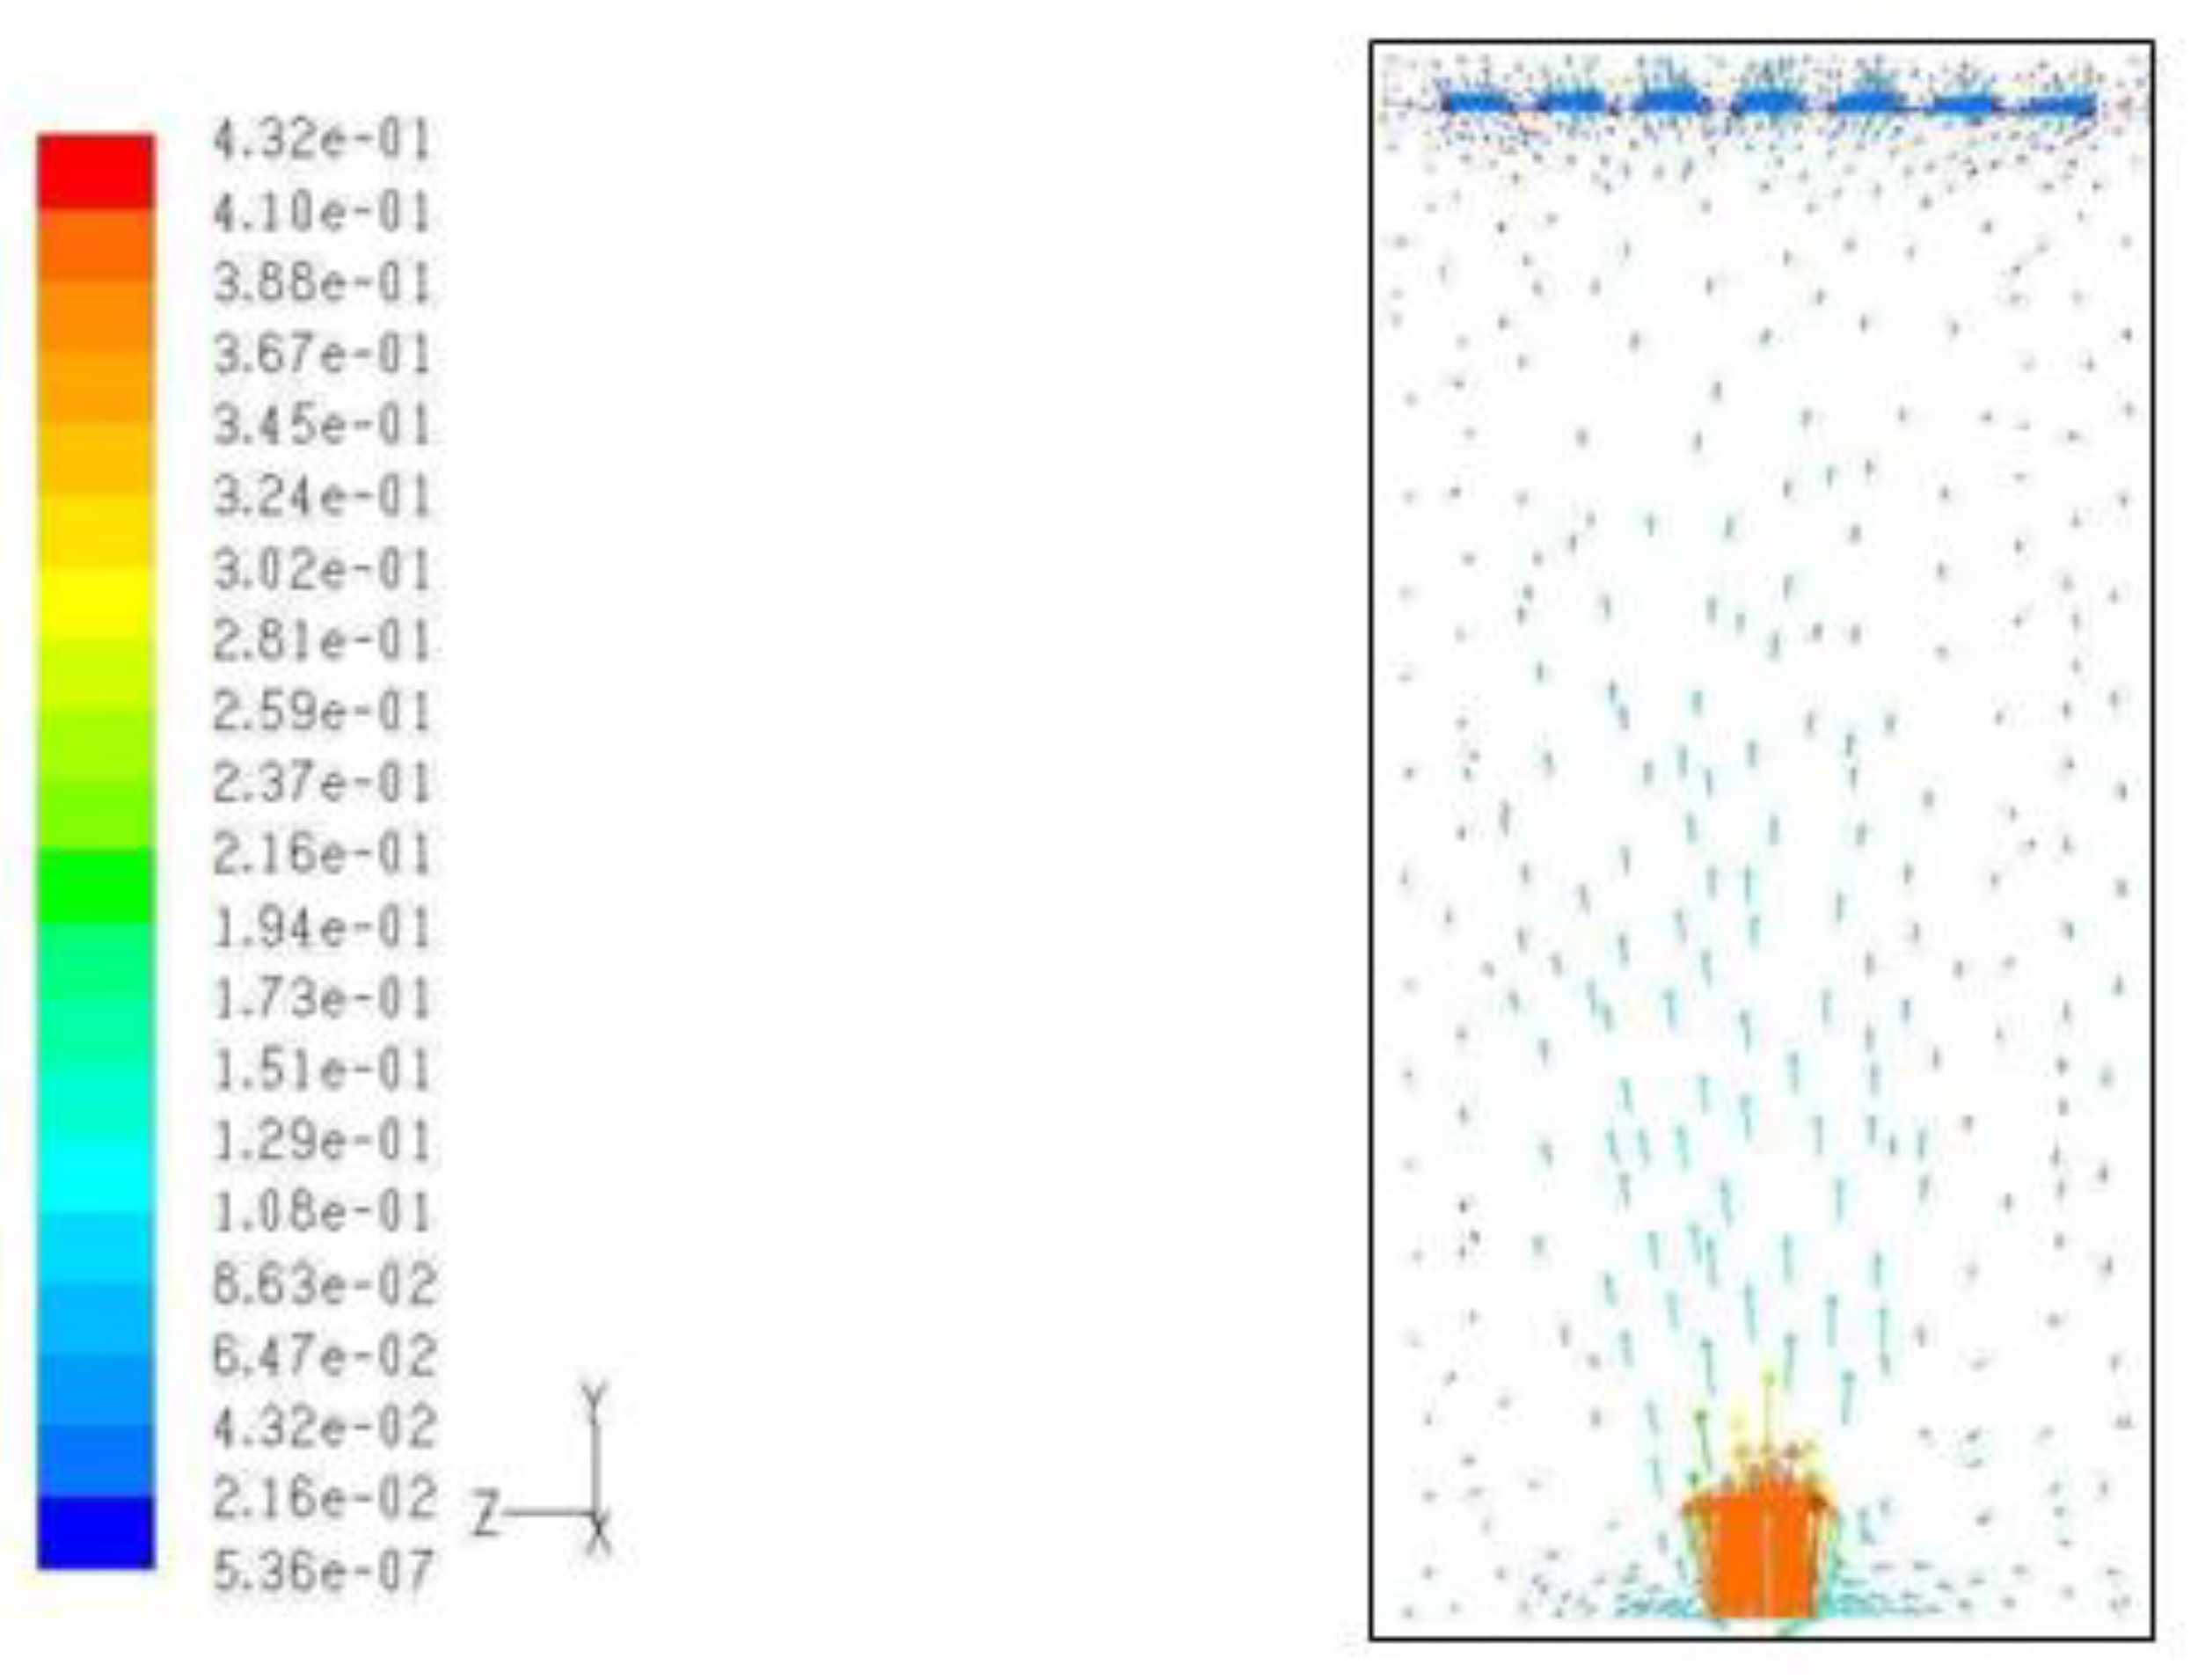
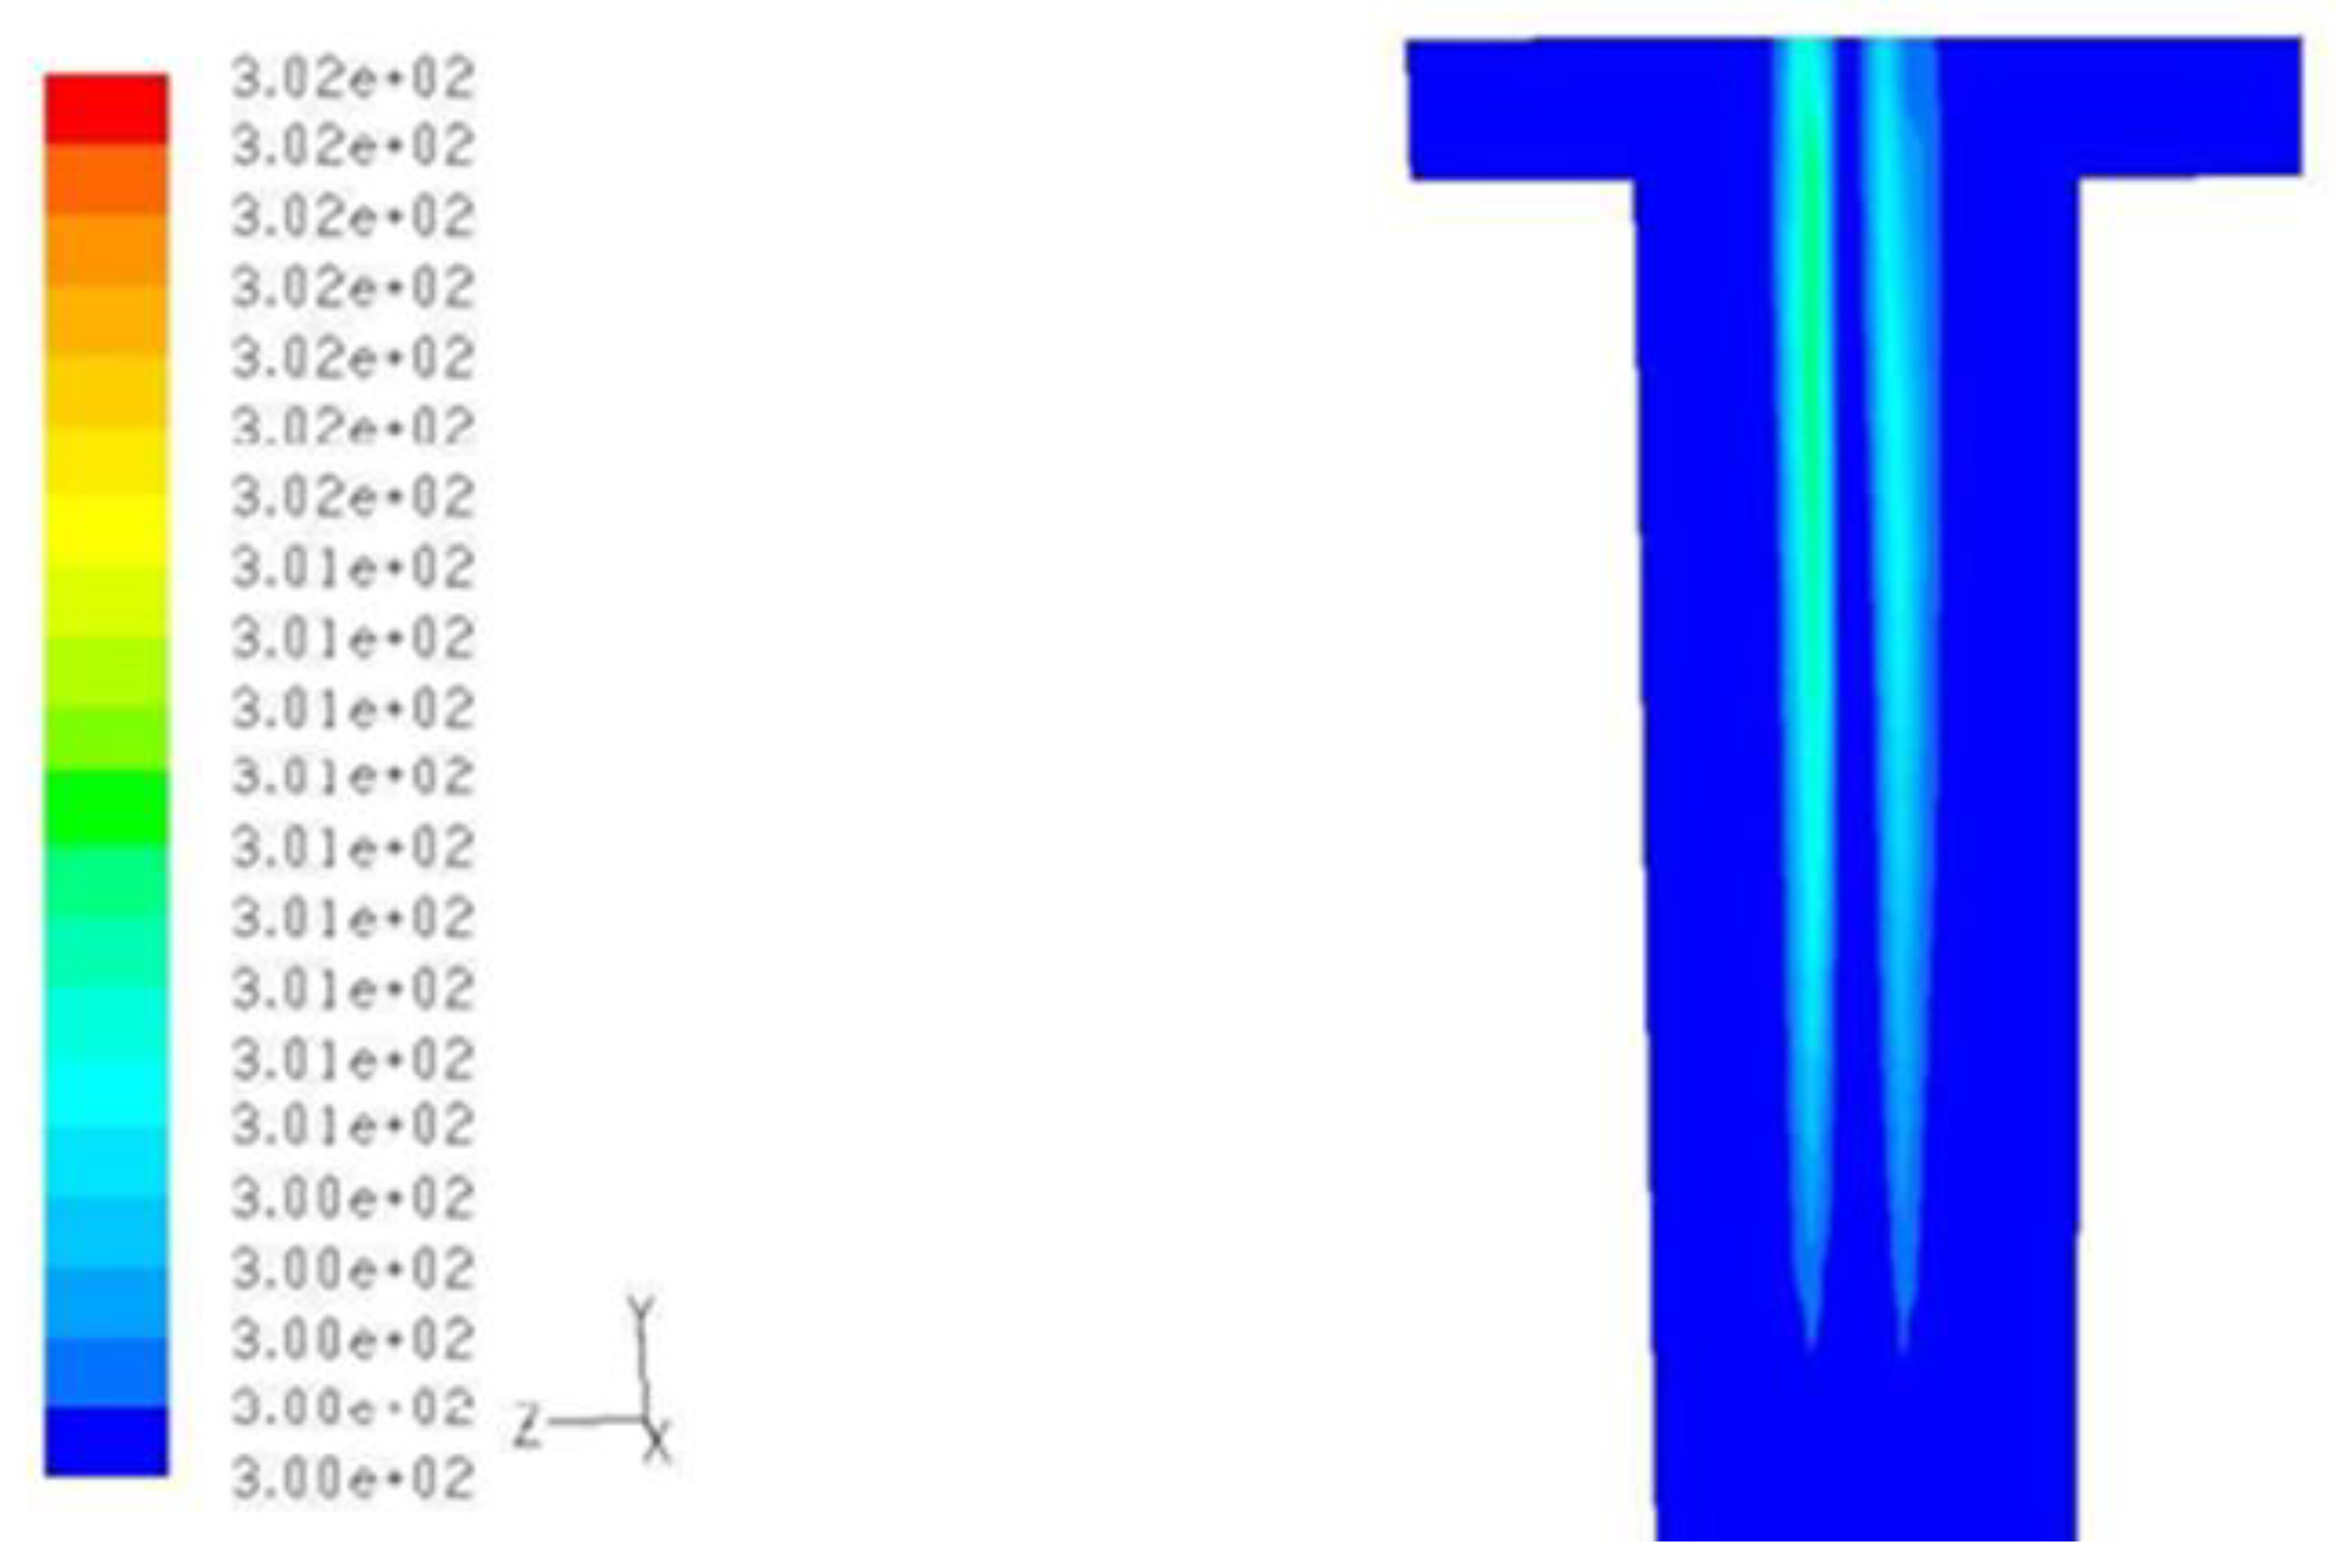
3.3. Fluid Flow Contour and Distribution of Velocity

Figure 6 and Figure 7 present the contour of fluid flow and the distribution of velocity on forced convection heat transfer in the sub-channel. Figure 6 illustrates that forced convection for the laminar flow regime had a more even velocity flow, with the highest average velocity in the middle of the sub-channel, denoted by a light-blue color (0.108 m/s) compared to a blue color (0.021 m/s). The velocity vector of the fluid flow near the bottom area of the sub-channel distributor wall is illustrated in Figure 7. The velocity flow distribution was evenly distributed along the sub-channel from the bottom to the top of the model. This is because the flow in forced convection was not greatly affected by the presence of heat, while the area in the middle of the sub-reed had the smallest shear stress and, therefore, a high velocity.

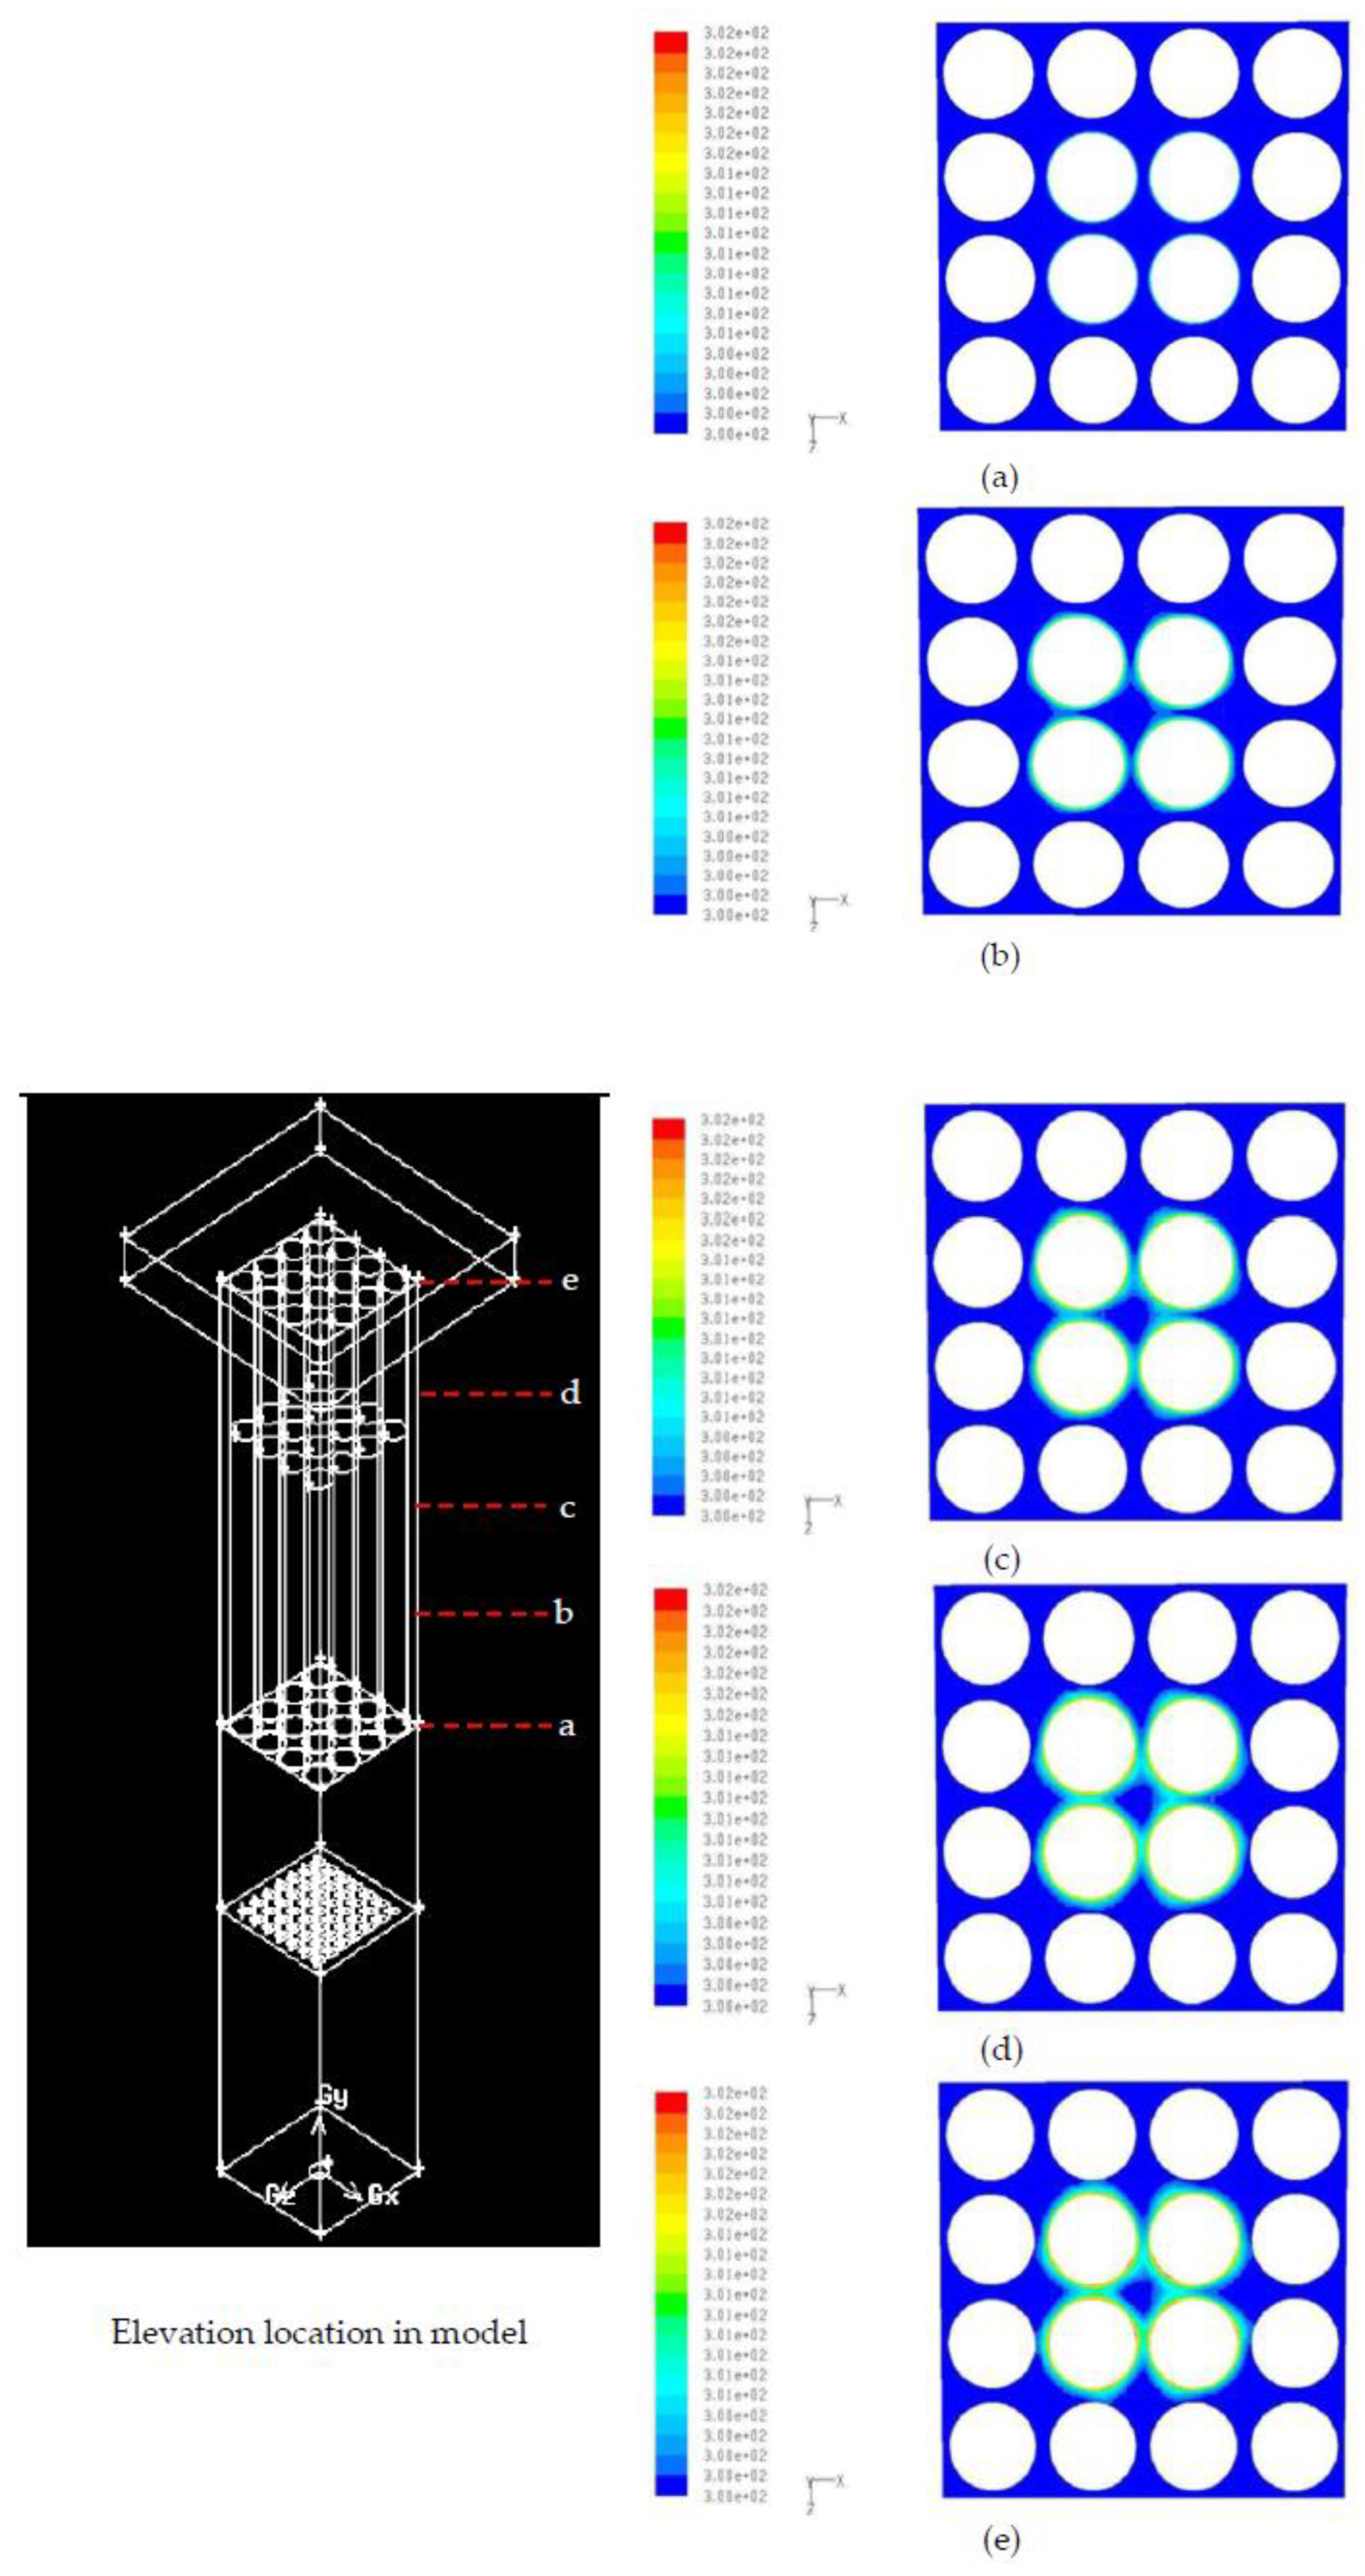
3.4. Temperature Distribution

By conductinga simulation using CFD, the surface temperature of the active cylinder could be obtained. The surface temperature distribution of active cylinders at a surface heat flux of 500 W/m2 is shown in Figure 8. The color bar in this figure shows the temperature values of active cylinders in K. Water received heat from the active cylinders while it flowed upward; therefore, as it rose higher, its temperature increased. As a result, the surface temperature of the active cylinders was also higher at higher elevations. The same condition also occurred for the water temperature field for a surface heat flux of 500 W/m2. Figure 9 shows that the thermal boundary layer growth near the active cylinders and the thermal boundary layer was thicker at higher elevations; therefore, it can also be expected that the heat transfer coefficient would tend to be smaller at higher elevations.
Figure 10a–e present that, at a certain elevation, the surface temperature varied with its tangential location around the cylinder. The active cylinder surface regions that were directly facing the other active cylinders had the highest temperatures. This is related to the fact that the water in these areas had less freedom since the water gaps between these areas were thinner compared to water gaps in other areas.
The cylinder surface regions that were directly facing the main sub-channel also had relatively high temperatures, although their temperatures were not as high as the temperatures of the surface regions that were directly facing the other active cylinders. A similar tangential surface temperature distribution around the active cylinders is also shown in Figure 10a–e, showing horizontal temperature fields at elevations of 0.60, 0.70, 0.80, 0.90, and 1.0 m from the fresh water inlet. Figure 9 also shows the thermal boundary growth, as discussed at the beginning of this section. In this figure, it is obvious that the whole thermal boundary layer inside the main sub-channel was practically still in its developing region, since the temperature of the sub-channel axis area was still relatively low and almost the same as the inlet water temperature.

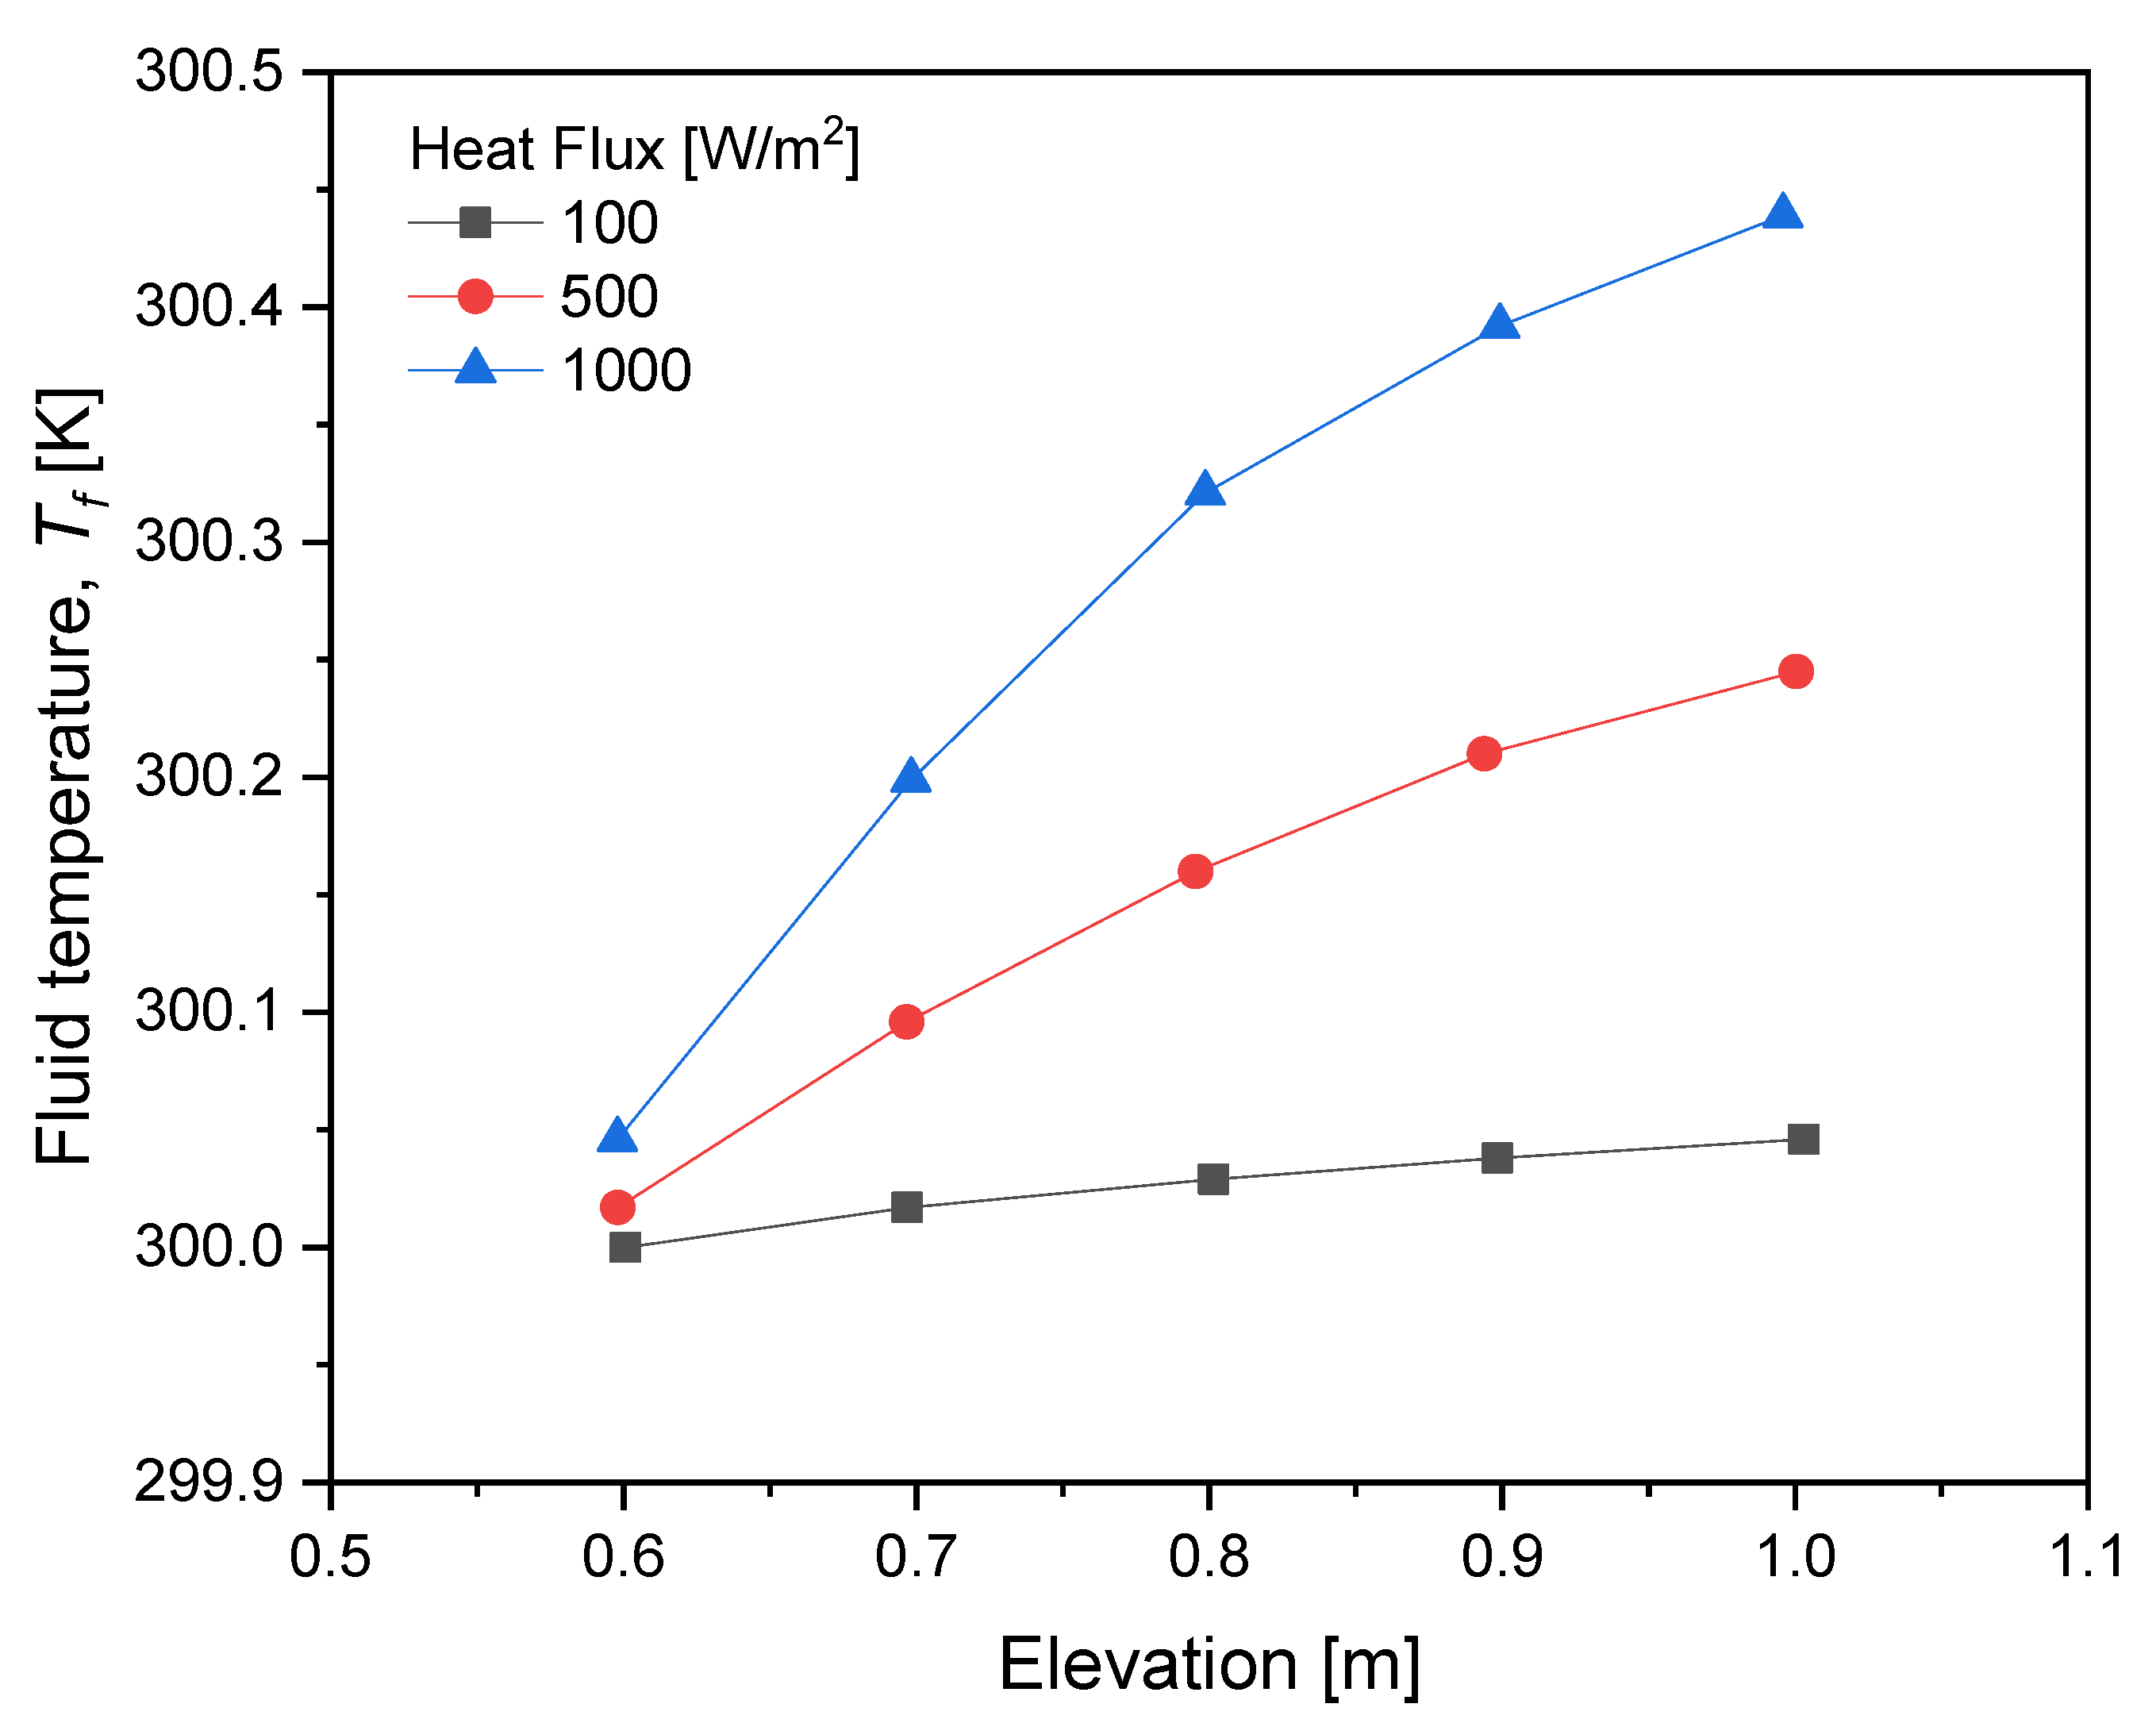
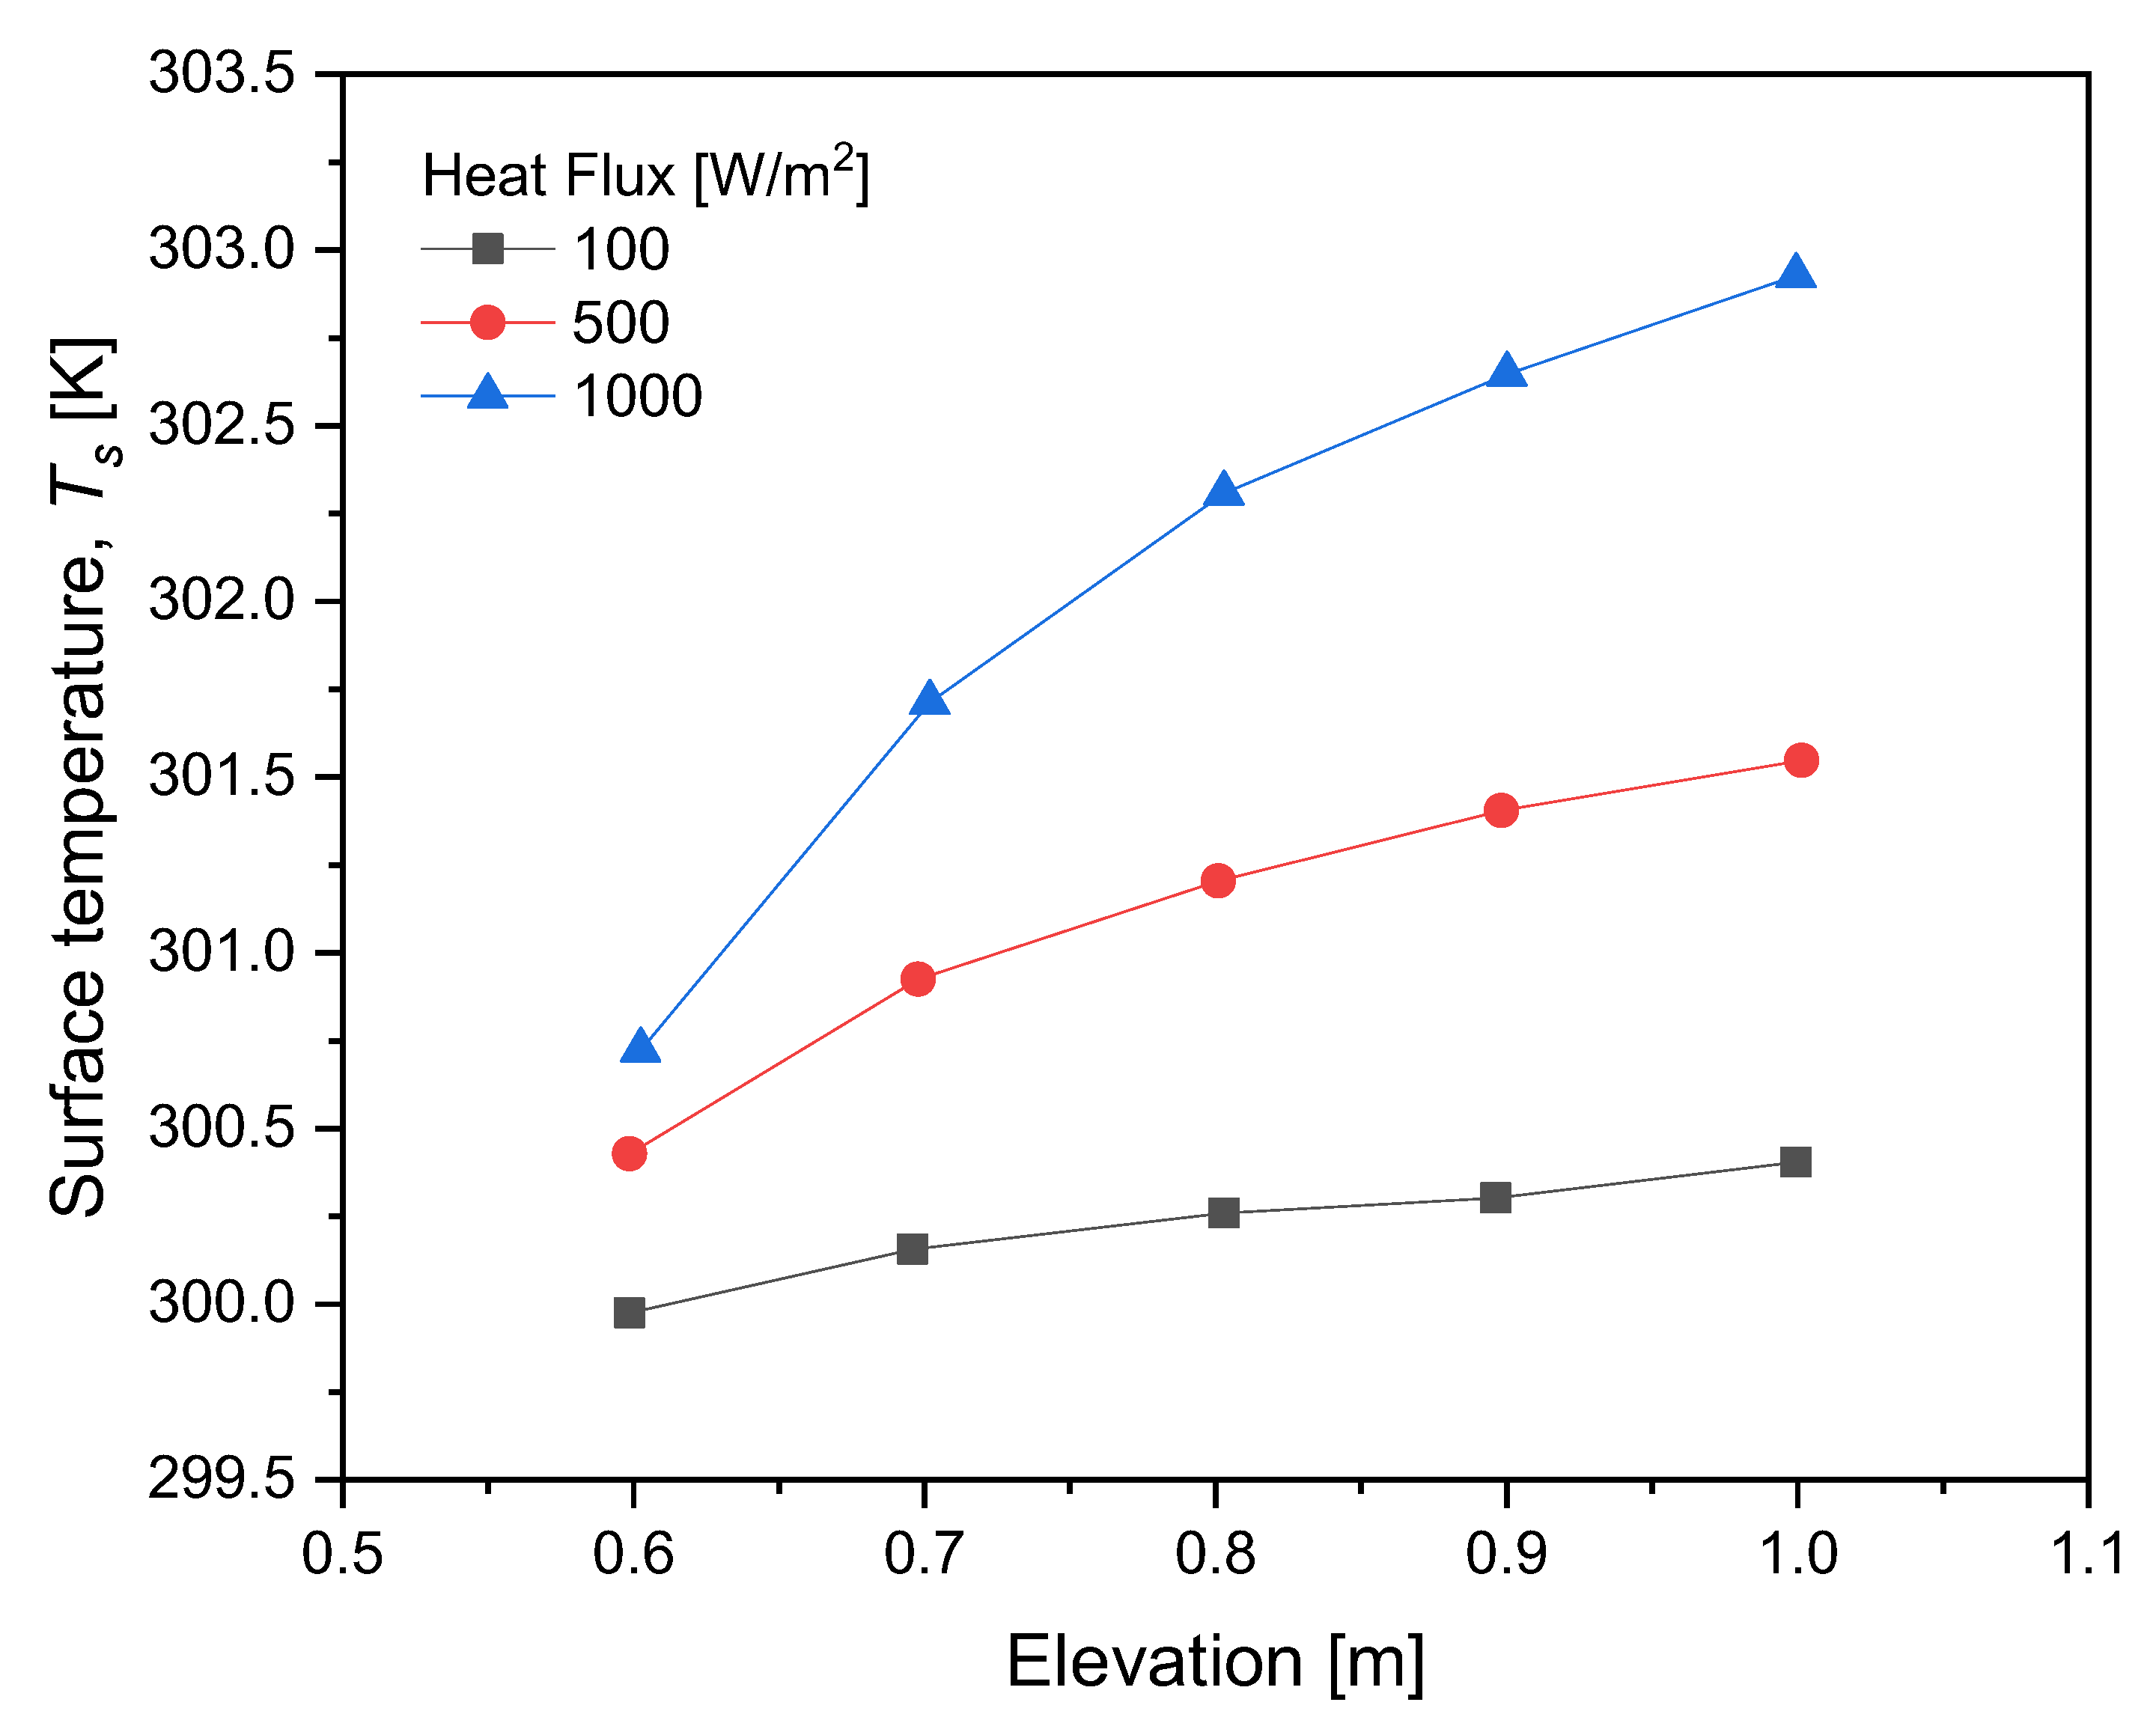
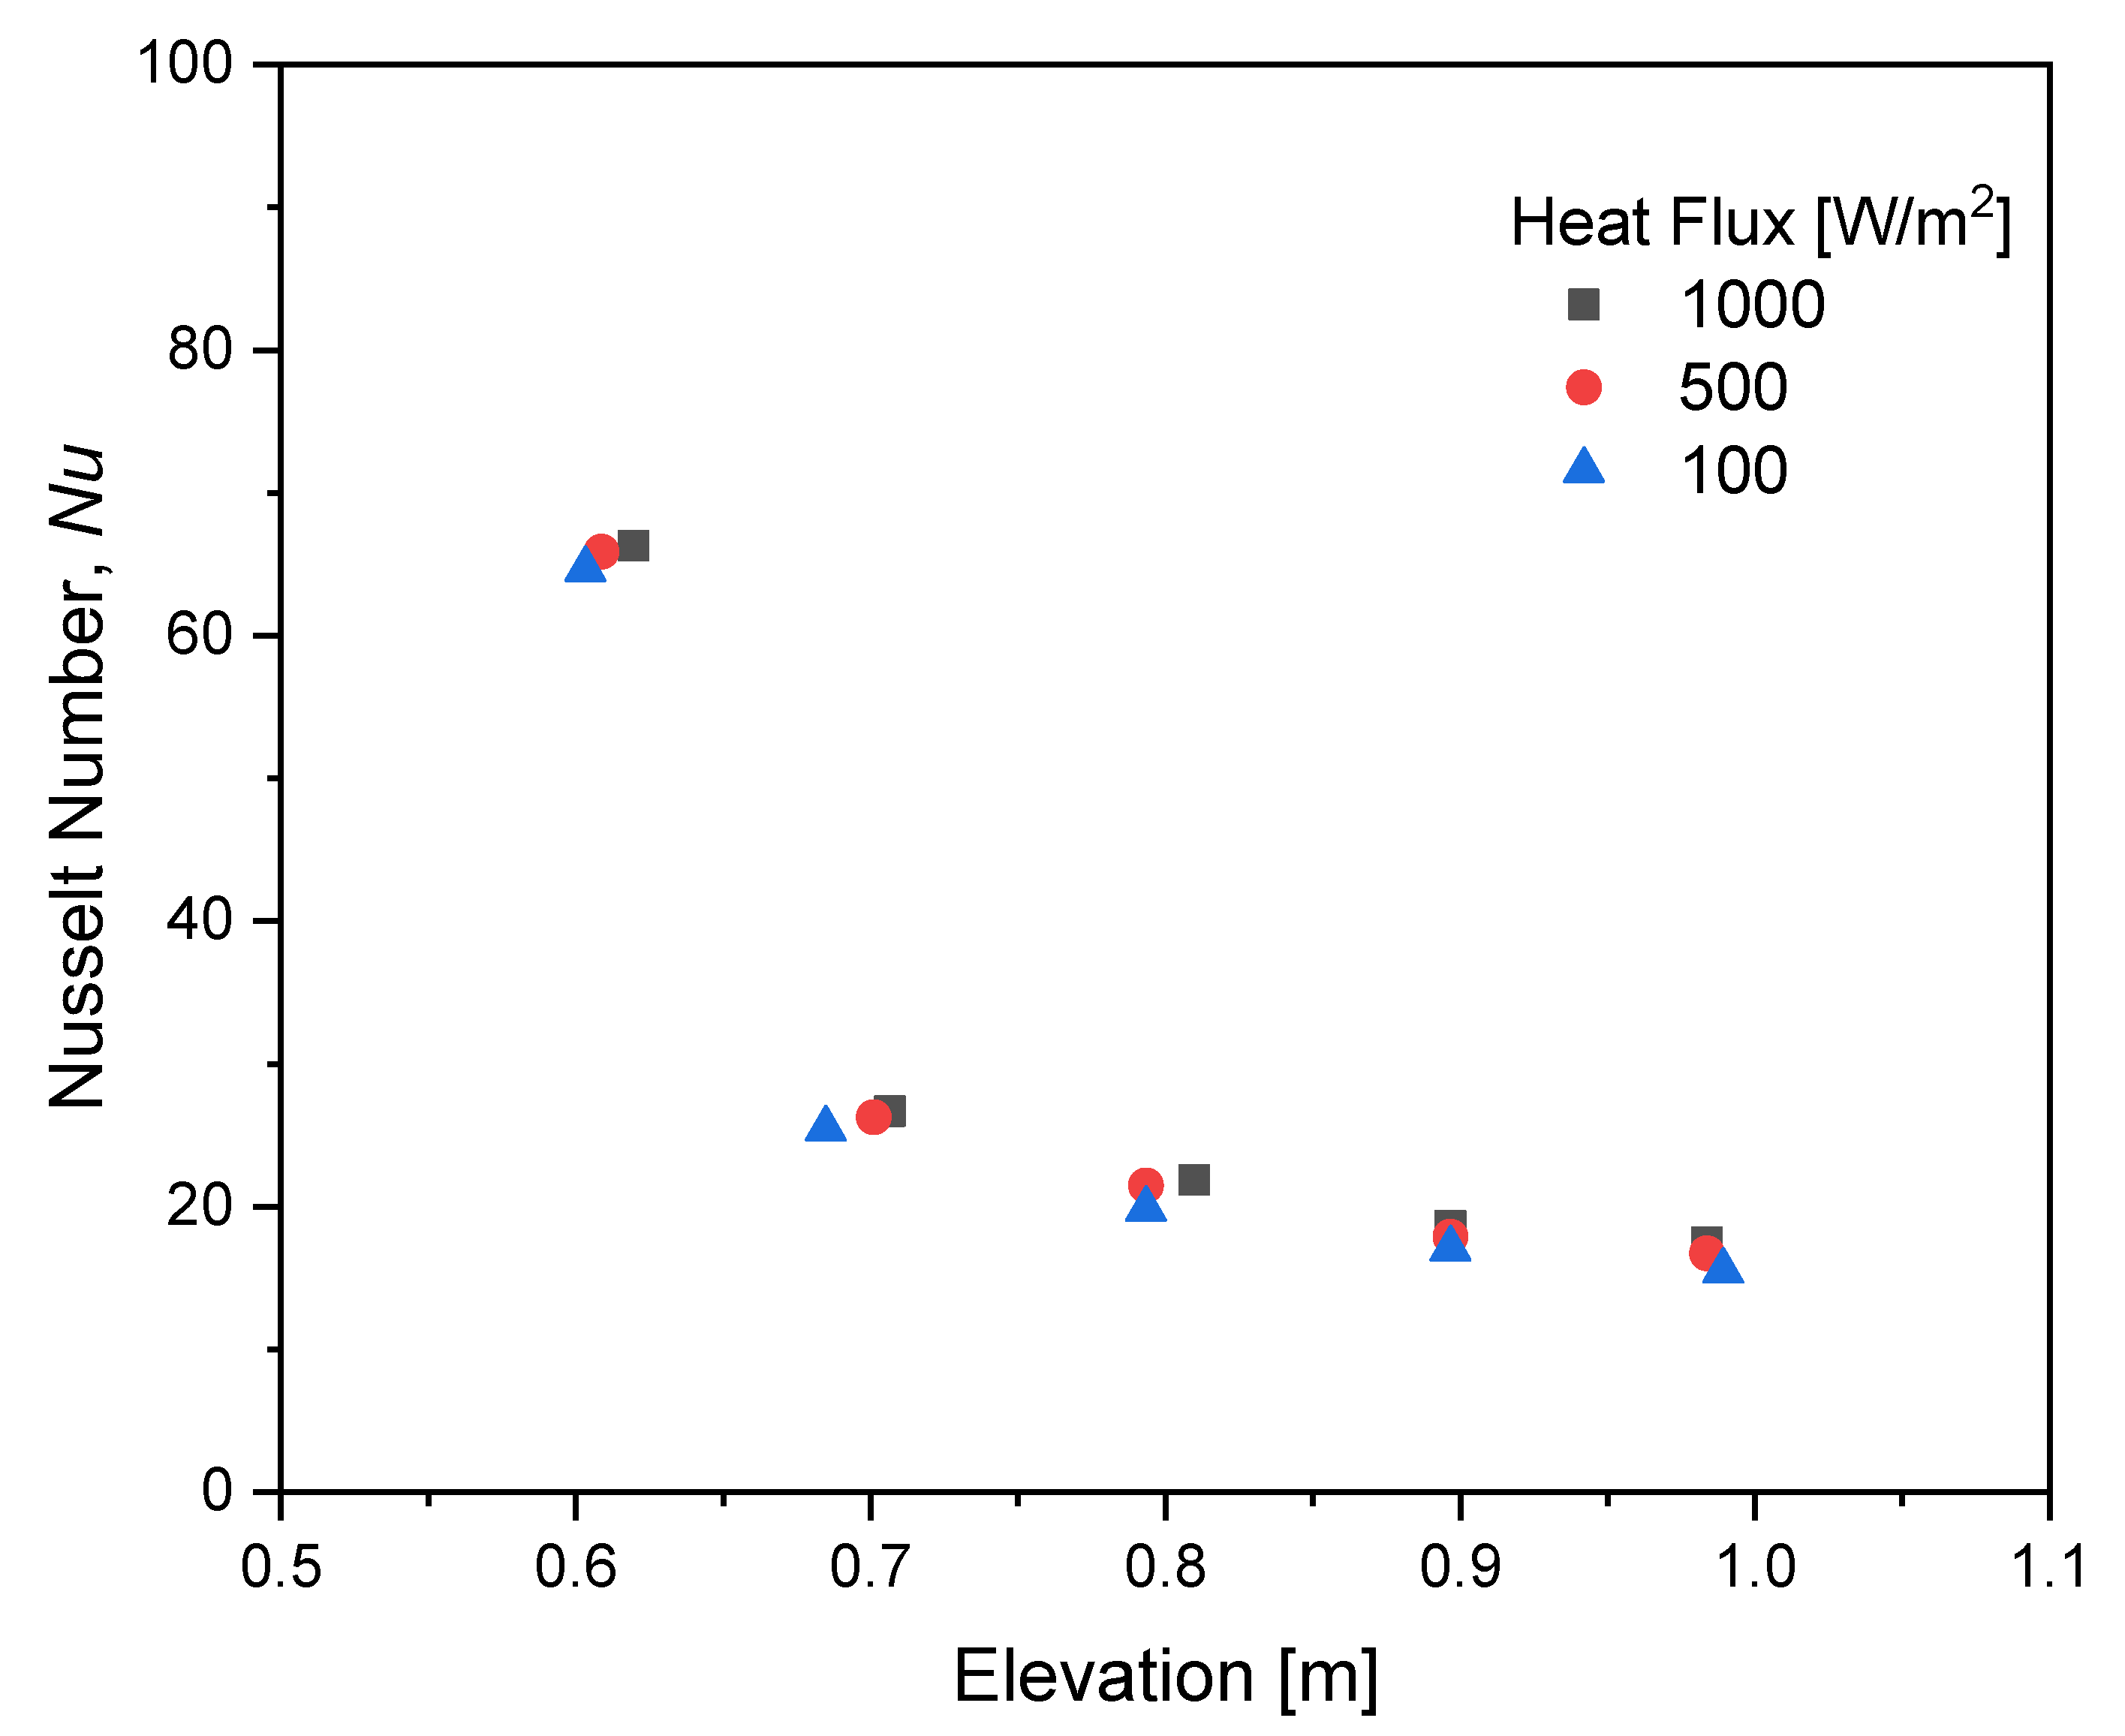
3.5. Influences of Heat Flux

Averages of the fluid temperatures at various elevations of the sub-channel are plotted in Figure 11 with surface heat flux as a parameter for the curves. The figure clearly shows that there was a general tendency in the curves that the fluid temperature increased as the elevation increased. This fact is consistent with what was discussed in the previous section. The curves in Figure 11 also show that the temperature gradients in the sub-channel axial direction decreased as the elevation increased. This happened because the influence of heat transfer from the cylinder surfaces penetrated more deeply at higher elevations; therefore, the transferred heat was distributed to a larger amount of water at higher elevations than at lower elevations. An obvious fact clearly shown in the figure is that the water temperature axial gradient increased as the heat flux increased.
The average surface temperatures of the active cylinders at various elevations of the sub-channel are plotted in Figure 12 with surface heat flux as a parameter for the curves. This figure shows similar tendencies to Figure 11, i.e., the average temperatures increased as elevation increased, the temperature gradients in the sub-channel axis direction decreased with elevation, and the temperature gradients in the sub-channel axis direction increased as heat flux increased. These phenomena occurred as a function of similar reasons to those discussed in the previous paragraph.

3.6. Heat Transfer Coefficient

Figure 13 presents the heat transfer coefficient (h) on a laminar flow regime with a Reynolds number range of 400 ≤ Re ≤ 1700. The large variation or difference in heat transfer coefficient at various positions was very large. Thus, for laminar flow, the heat transfer coefficient used to determine correlation was the local heat transfer coefficient. With the temperature difference still increasing as the altitude increased, the heat transfer coefficient also continued to decrease as the altitude increased, as shown in Figure 13. This is one indication that this test range was still in the developing flow region and was not fully developed thermally. Figure 14 illustrates the Nusselt Number (Nu) plotted against altitude. In the figure, it appears that the Nusselt number (Nu) still tended to decrease with increasing altitudes; therefore, it can be concluded that the flow was indeed still growing and not yet fully developed.

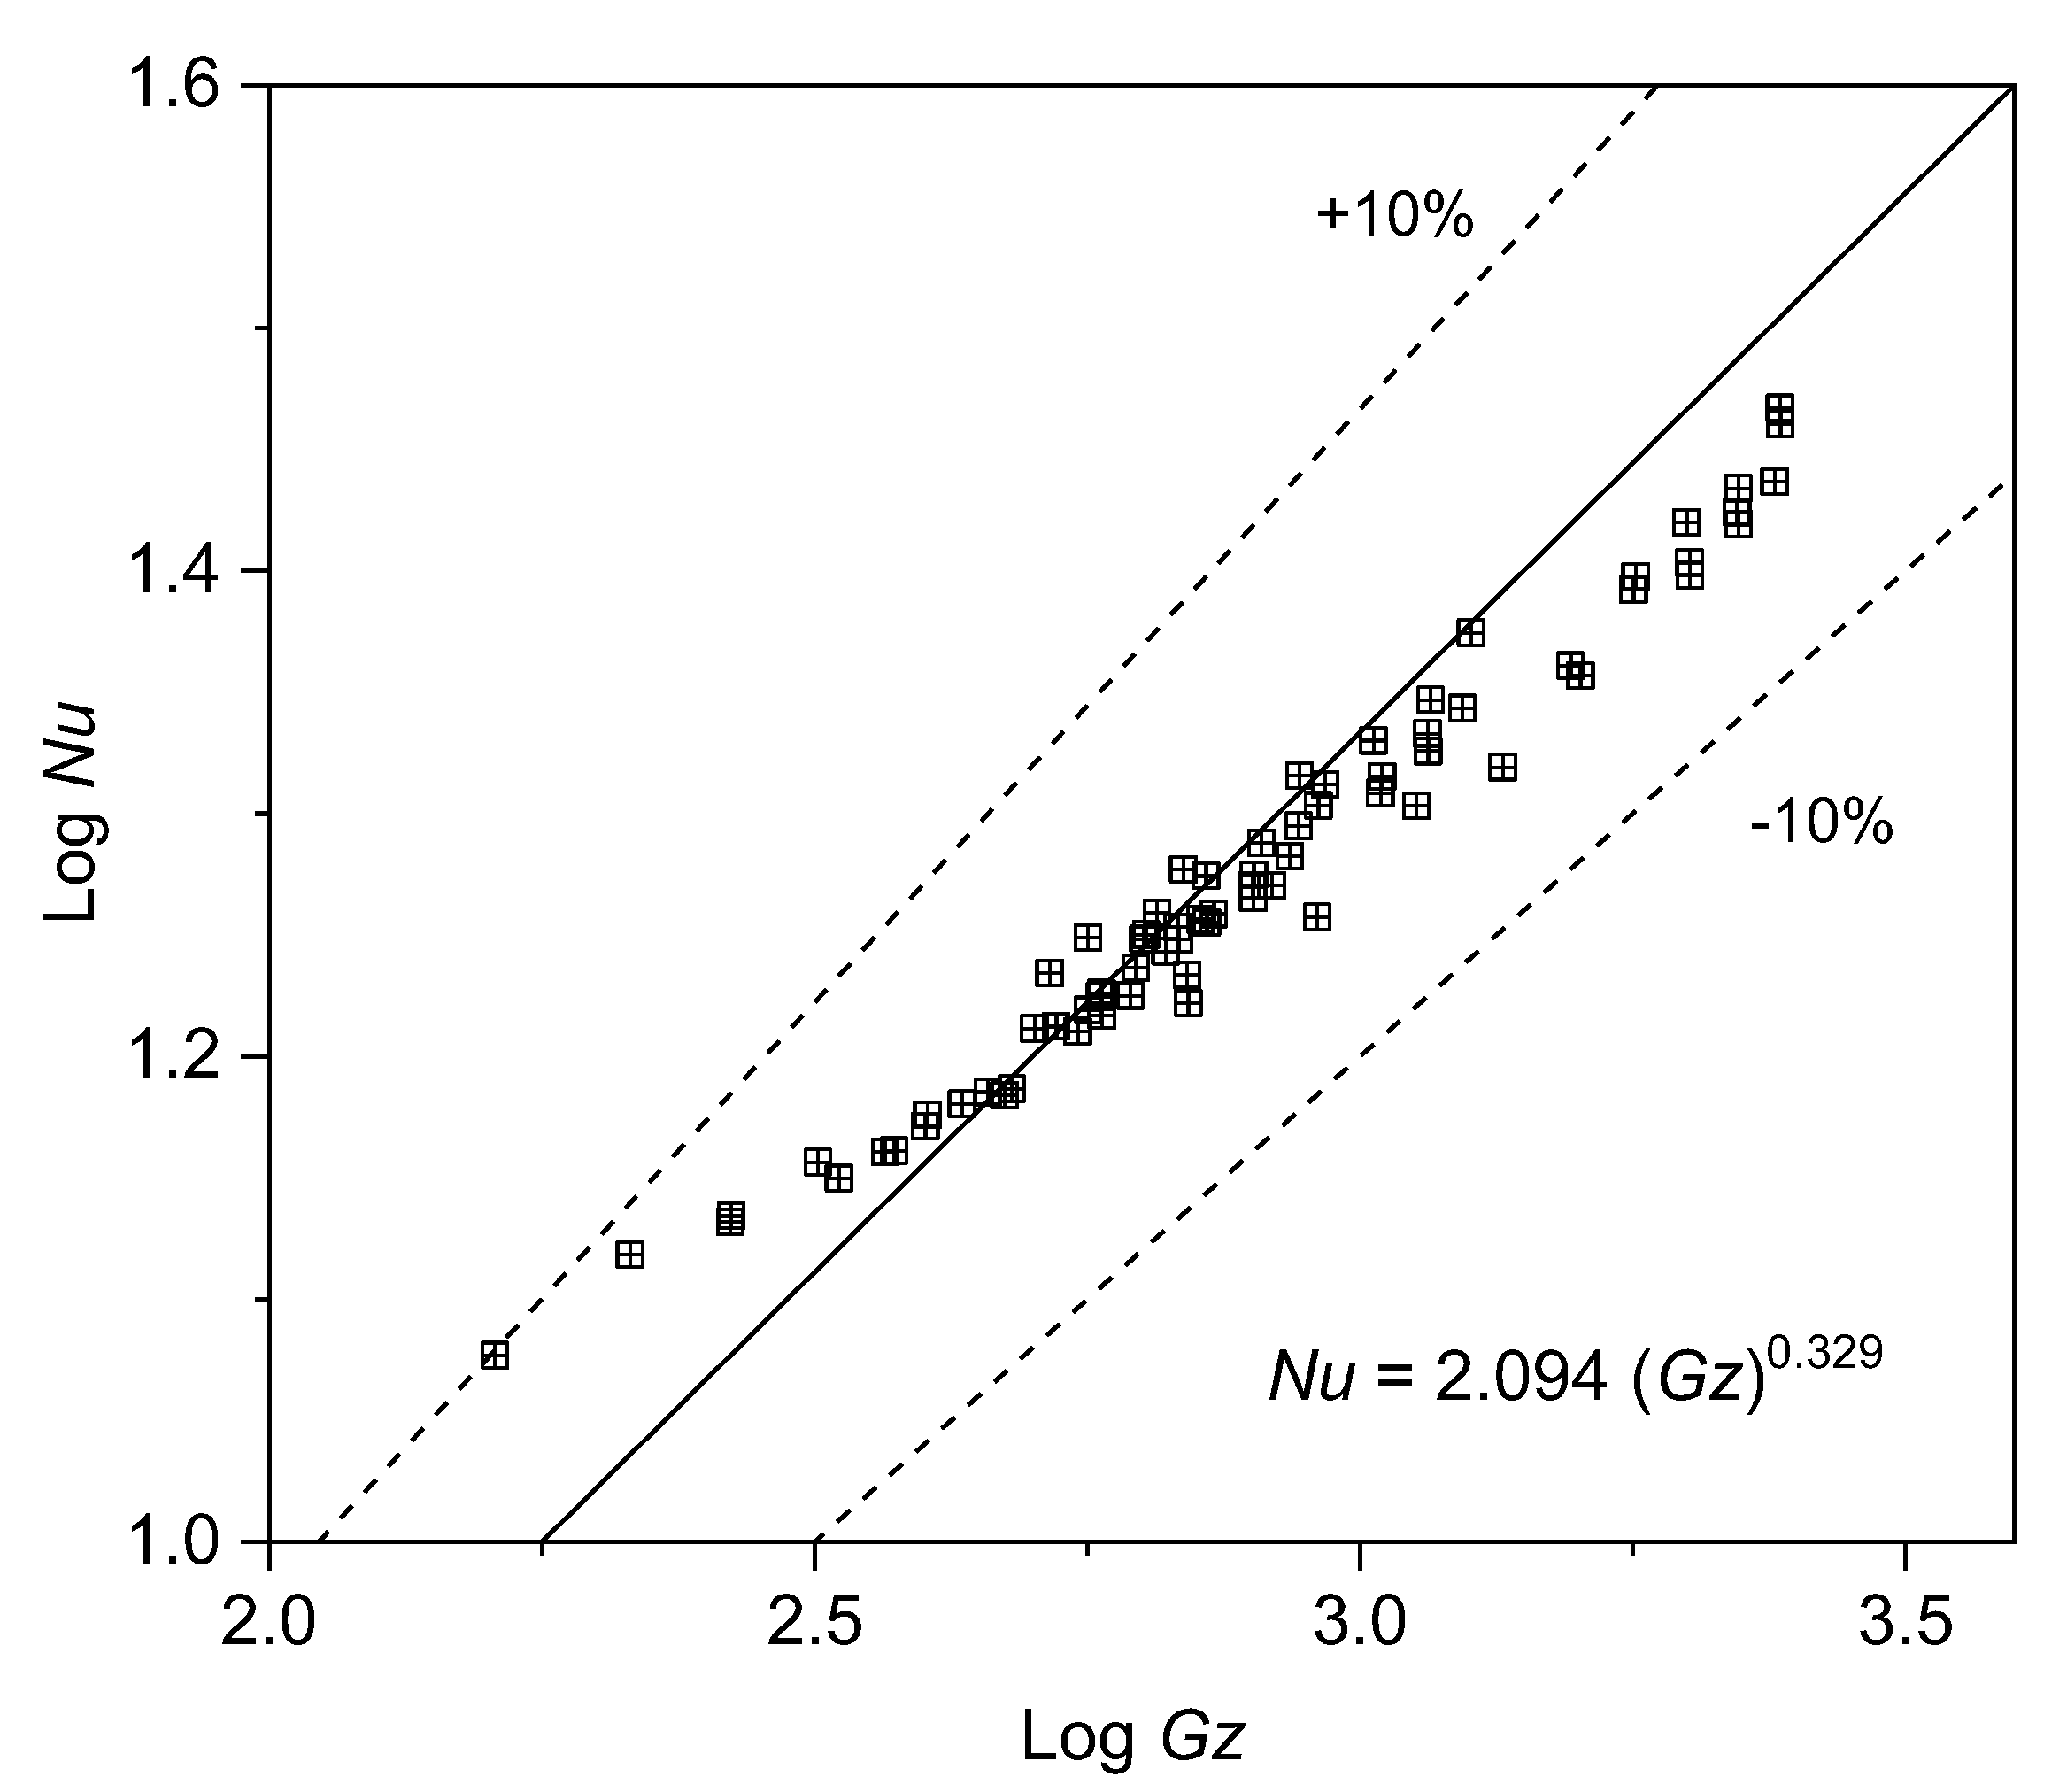
3.7. Development of Forced Convective Heat Transfer Correlation

The local heat transfer coefficient on the active cylinder surface can be calculated by using Equation (1). The value of heat flux is given as one of simulation inputs, the values of surface and fluid temperatures at any observed elevation can be retrieved from the CFD package. Therefore, the local heat transfer coefficient can be calculated. After calculating the local heat transfer coefficients at several elevations, the average heat transfer coefficient can be numerically calculated by using the following equation:
h ¯ = h d A s d A s h A i h A i
where As is surface area, and Ai is surface area of the i-the integration.

3.7.1. Physical Properties and Nusselt Number (Nu)

The bulk average temperature of the fluid can be represented by the mass flow weighted temperature average in the water square sub-channel, which can be retrieved from CFD software. If the fluid bulk temperature of the sub-channel is known, then all necessary fluid physical properties, such as thermal conductivity (k), dynamic viscosity (µ), kinematic viscosity (ν), and mass density ( ρ ) can be evaluated. Then, the Nusselt number can be calculated using its definition,
N u = h . ¯ D h k ,
where Dh is the hydrodynamic diameter of the sub-channel.

3.7.2. Graetz Number (Gz)

The Graetz number (Gz) of the fluid flow inside the sub-channel is defined by the following equation:
G z = Re Pr ( D h x )
By using Equations (1) and (14)–(16), the relationship between the Graetz number and Nusselt number can be plotted as shown in Figure 15. According to the data shown in Figure 15, the correlation equation obtained from the current study can be written as
Log (Nu) = 0.329 Log (Gz) + 0.321,
Nu = 2.094 (Gz) 0.329,
for the Graetz number range 161 ≤ Gz ≤ 2429.
Figure 15 shows the new convective correlation curves for the laminar flow regime in the sub-channel vertical square using data of Log Nu and Log Gz. The error obtained was less than 10% with the obtained equation Nu = 2.094 (Gz)0.329, for the Graetz number range 161 ≤ Gz ≤ 2429. Figure 16 presents a comparison with the correlation equation produced in [42]. Figure 16 shows that the equations generated from this research had the same pattern and simulation results for the sub-channel arrangement of the square with a P/D of 1.16 and Reynolds number (Re) in a range of 400 to 1700 with a laminar flow regime, when compared with the results obtained by El-Genk for a P/D of 1.25.

4. Conclusions

On the basis of the results obtained from the current simulation study, several conclusions can be drawn. The surface temperature distribution around the tangential direction of the active cylinders shows that the implementation of active and dummy cylinders in the current study can simulate sub-channels that exist in a real nuclear reactor core. The current study shows that the flow simulated in this study is in its developing condition (entrance region). A new convective heat transfer correlation for the developing region or laminar flow regime was obtained in this study for Reynolds number range 400 ≤ Re ≤ 1700 in the form of Nu = 2.094 Gz) 0.329 for the Graetz number range 161 ≤ Gz ≤ 2429.

Author Contributions

E.U., N.P.T., A.C.S., A.I.R. and J.H.P. contributed equally to this paper (the main contributor). Conceptualization and methodology, E.U. and N.P.T.; software, A.C.S. and A.I.R.; validation, E.U. and N.P.T.; formal analysis, J.H.P.; investigation, A.C.S. and A.I.R.; resources, E.U.; data curation, A.C.S.; writing—original draft preparation, E.U. and J.H.P.; writing—review and editing, E.U. and A.I.R.; visualization, N.P.T.; supervision, E.U.; project administration, J.H.P.; funding acquisition, J.H.P. All authors have read and agreed to the published version of the manuscript.

Funding

This research was funded by the LPDP and the Ministry of Research and Technology of Indonesia under contract number 05/E1/III/PRN/2020.

Data Availability Statement

Not applicable.

Acknowledgments

The authors would like to thank the LPDP and the Ministry of Research and Technology of Indonesia for funding this study under contract number 05/E1/III/PRN/2020.

Conflicts of Interest

The authors declare no conflict of interest.

References

  1. Todreas, N.E.; Kazimi, M.S. Nuclear System I; Taylor and Francis Publishers: New York, NY, USA, 1993. [Google Scholar]
  2. Kreith, F.; Manglik, R.M.; Bohn, M.S. Principles of Heat Transfer, 7th ed.; CENGAGE Learning, Inc.: Stamford, CT, USA, 2011. [Google Scholar]
  3. Holman, J.P. Heat Transfer, 10th ed.; McGraw-Hill Education: New York, NY, USA, 2009. [Google Scholar]
  4. Oosthuizen, P.H.; David, N. Introduction to Convective Heat Transfer Analysis; McGraw Hill: New York, NY, USA, 1999. [Google Scholar]
  5. Gkounta, A.A.; Benos, L.T.; Sofiadis, G.N.; Sarris, I.E. A printed-circuit heat exchanger consideration by exploiting an Al2O3-water nanofluid: Effect of the nanoparticles interfacial layer on heat transfer. Therm. Sci. Eng. Progress 2021, 22, 100818. [Google Scholar] [CrossRef]
  6. Chauhan, A.K.; Prasad, B.V.S.S.S.; Patnaik, B.S.V. Thermal hydraulics of rod bundles: The effect of eccentricity. Nucl. Eng. Des. 2013, 263, 218–240. [Google Scholar]
  7. Jensen, R.T.; Newel, D.L. Thermal Hydraulic Calculations to Support to Support Increase in Operating power in Mc. Clellen Nuclear Radiation Center (MNRC) TRIGA Reactor; The 1998 RELAP5 International User’s Seminar: College Station, TX, USA, 17–22 May 1998. [Google Scholar]
  8. Marcum, W.R.; Woods, B.G.; Hartman, M.R.; Reese, S.R.; Palmer, T.S.; Keller, S.T. Steady state thermal-hydraulic analysis of the Oregon State University TRIGA reactor using RELAP5-3D. Nucl. Sci. Eng. 2009, 162, 261–274. [Google Scholar] [CrossRef]
  9. Reis, P.A.; Costa, A.L.; Pereira, C.; Veloso, M.F.; Mesquita, A.Z.; Soares, H.V.; Barros, G.P. Assessment of a RELAP5 model for the IPR-R1 TRIGA research reactor. Ann. Nucl. Energy 2010, 37, 1341–1350. [Google Scholar] [CrossRef]
  10. Huda, M.Q.; Bhuiyan, S.I. Investigation of thermo-hydraulic parameters during natural convection cooling of TRIGA reactor. Annu. Nucl. Energy 2006, 33, 1079–1086. [Google Scholar] [CrossRef]
  11. Waluyo, A.; Tandian, N.P.; Umar, E. Studi perpindahan panas konveksi pada susunan silinder vertikal dalam reaktor nuklir atau penukar panas menggunakan program CFD. In Proceedings of the Prosiding Seminar Nasional Sains dan TeknologiNuklir PTNBR, Bandung, Indonesia, 3 June 2009. [Google Scholar]
  12. Ramadhan, A.I.; Umar, E.; Tandian, N.P.; Suwono, A. Comparative analysis of preliminary design core of TRIGA Bandung using fuel element plate MTR in Indonesia. AIP Conf. Proc. 2017, 1799, 030007. [Google Scholar]
  13. Umar, E.; Kamajaya, K.; Tandian, N.P.; Hardianto, T.; Suwono, A. An experimental study of natural convection in the hot-test channel of TRIGA 2000 kW. In Proceedings of the Pacific Basin Nuclear Conference, Australian Nuclear Association, Sydney, Australia, 15–20 October 2006. [Google Scholar]
  14. Umar, E. Prediction of mass flow rate and pressure drop in the coolant channel of the TRIGA 2000 reactor core. At. Indones. 2001, 27, 67–84. [Google Scholar]
  15. Umar, E.; Kamajaya, K.; Ramadhan, A.I. Evaluation of the pump capability of the primary cooling of TRIGA 2000 research reactor. J. Phys. Conf. Ser. 2020, 1493, 012018. [Google Scholar] [CrossRef]
  16. Petersen, J.F. Manual of STAT-A Fortran Program for calculating the natural convection heat transfer—fluid flow in an array of heated cylinders, General Atomic. 1989. [Google Scholar]
  17. Basuki, P.; Umar, E. Thermal hydraulic analysis of the Bandung TRIGA 2000 research reactor. In Proceedings of the 12th International Conference on Thermo-Fluids, Yogyakarta, Indonesia, 18 September 2021. [Google Scholar]
  18. Sohag, F.A.; Mohanta, L.; Cheung, F. CFD analyses of mixed and forced convection in a heated vertical rod bundle. Appl. Therm. Eng. 2017, 117, 85–93. [Google Scholar] [CrossRef]
  19. Chen, G.; Zhang, Z.; Tian, Z.; Appah, T. Research on the Sub-channel analysis method via CFD analysis for PWR. Nucl. Sci. Eng. 2017, 188, 270–281. [Google Scholar] [CrossRef]
  20. Saha, P.; Aksan, N.; Andersen, J.; Yan, J.; Simoneau, J.P.; Leung, L.; Bertrand, F.; Aoto, K.; Kamide, H. Issues and future direction of thermal-hydraulics research and development in nuclear power reactors. Nucl. Eng. Des. 2013, 264, 3–23. [Google Scholar] [CrossRef]
  21. Ferziger, J.H.; Perić, M. Computational Methods for Fluid Dynamics; Springer: Berlin, Germany, 2002. [Google Scholar]
  22. Henry, R.; Tiselj, I.; Matkovic, M. Natural and mixed convection in the cylindrical pool of TRIGA reactor. Heat Mass Transf. 2017, 53, 537–551. [Google Scholar] [CrossRef]
  23. Fiantini, R.; Umar, E. Fluid flow characteristics simulation on the original TRIGA 2000 reactor core design using computational fluid dynamics code. AIP Conf. Proc. 2010, 1244, 215–223. [Google Scholar]
  24. Umar, E.; Fiantini, R. Modification of the core cooling system of TRIGA 2000 reactor. AIP Conf. Proc. 2010, 1244, 224–231. [Google Scholar]
  25. Sarris, I.E.; Tsiakaras, P.; Song, S.; Vlachos, N. A three-dimensional CFD model of direct ethanol fuel cells: Anode flow bed analysis. Solis State Ion. 2006, 177, 2133–2213. [Google Scholar] [CrossRef]
  26. El-Genk, M.; Su, B.; Zhanxiong, G. Experimental studies of forced, combined and natural convection of water in vertical nine-rod bundles with a square lattice. Int. J. Heat Mass Transf. 1993, 36, 2359–2374. [Google Scholar] [CrossRef]
  27. Tandian, N.P.; Umar, E.; Hardianto, T.; Febriyanto, C. Experimental study of natural convective heat transfer in a vertical hexagonal sub channel. AIP Conf. Proc. 2012, 1448, 252–260. [Google Scholar]
  28. Mohanta, L.; Cheung, F.; Hoxie, C.L. Experimental study of laminar mixed convection in a rod bundle with mixing vane spacer grids. Nucl. Eng. Des. 2017, 312, 99–105. [Google Scholar] [CrossRef]
  29. Ramadhan, A.I.; Suwono, A.; Umar, E.; Tandian, N.P. Preliminary study for design core of nuclear research reactor of TRIGA Bandung using fuel element plate MTR. Eng. J. 2017, 21, 173–181. [Google Scholar] [CrossRef] [Green Version]
  30. Li, J.; Xiao, Y.; Zhang, Q. Development of a correlation for mixed convection heat transfer in rod bundles. Ann. Nucl. Energy 2021, 155, 108151. [Google Scholar] [CrossRef]
  31. Liu, D.; Gu, H. Mixed convection heat transfer in a 5 × 5 rod bundles. Int. J. Heat Mass Transf. 2017, 113, 914–921. [Google Scholar] [CrossRef]
  32. Liu, B.; He, S.; Moulinec, C.; Uribe, J. Sub-Channel CFD for nuclear fuel bundles. Nucl. Eng. Des. 2019, 355, 110318. [Google Scholar] [CrossRef]
  33. Ramadhan, A.I.; Lasman, A.N.; Septilarso, A. Correlation equations of heat transfer in nanofluid Al2O3-water as cooling fluid in a rectangular sub channel based CFD code. Int. J. Sci. Eng. 2015, 8, 120–124. [Google Scholar]
  34. Shamim, J.A.; Bhowmik, P.K.; Xiangyi, C.; Suh, K.Y. A new correlation for convective heat transfer coefficient of water–alumina nanofluid in a square array sub channel under PWR condition. Nucl. Eng. Des. 2016, 308, 194–204. [Google Scholar] [CrossRef]
  35. Debrah, S.K.; Shitsi, E.; Chabi, S.; Sahebi, N. Assessment of heat transfer correlations in the sub-channels of proposed rod bundle geometry for supercritical water reactor. Heliyon 2019, 5, e02927. [Google Scholar] [CrossRef] [PubMed]
  36. Chen, S.; Liu, D.; Liu, M.; Xiao, Y.; Gu, H. Numerical simulation and analysis of flow and heat transfer in a 5 × 5 vertical rod bundle with buoyancy effects. Appl. Therm. Eng. 2019, 163, 114221. [Google Scholar] [CrossRef]
  37. Qiu, Q.; Du, X.; Zhao, S.; Zhu, X.; Shen, S. Numerical study on heat transfer of SCW near the pseudo-critical temperature in a hexagon sub-channel. Nucl. Eng. Des. 2018, 331, 263–273. [Google Scholar] [CrossRef]
  38. Gu, H.Y.; Hu, Z.X.; Liu, D.; Li, H.B.; Zhao, M.; Cheng, X. Experimental study on heat transfer to supercritical water in 2 × 2 rod bundle with wire wraps. Exp. Therm. Fluid Sci. 2016, 70, 17–28. [Google Scholar] [CrossRef]
  39. Chen, J.; Gu, H.; Xiong, Z. A circumferentially non-uniform heat transfer model for sub channel analysis of tight rod bundles. Ann. Nucl. Energy 2018, 121, 50–61. [Google Scholar] [CrossRef]
  40. Dittus, W.; Boelter, L.M.K. Heat Transfer in Automobile Radiators of the Turbular Type. Int. Commun. Heat Mass Transf. 1985, 12, 3–22. [Google Scholar] [CrossRef]
  41. Kamajaya, K.; Hasanah, A.; Pane, J.S. Forced convection heat transfer studies on Al2O3-water nano-fluids in a vertical sub-channels. AIP Conf. Proceeding 2018, 1488, 261–269. [Google Scholar]
  42. El-Genk, M.; Bedrose, S.D.; Rao, D. Forced and combined convection of water in rod bundles. Heat Transf. Eng. 1990, 11, 32–43. [Google Scholar] [CrossRef]
Figure 1. Sketch of experiment test section (a) and its vertical cross-section (b).
Fluids 07 00207 g001
Figure 2. Horizontal cross-section of simulation test.
Fluids 07 00207 g002
Figure 3. Modeling, meshing, and boundary conditions of sub-channel vertical square.
Fluids 07 00207 g003
Figure 4. Nusselt number grid-independent test.
Fluids 07 00207 g004
Figure 5. Validation results for Nusselt number.
Fluids 07 00207 g005
Figure 6. Fluid flow contour in sub-channel with cylindrical square array for forced convection.
Fluids 07 00207 g006
Figure 7. Velocity distribution on sub-channel with cylindrical longitude arrangement on forced convection for laminar flow regime under distributor wall.
Fluids 07 00207 g007
Figure 8. Surface temperature distribution in sub-channel square model.
Fluids 07 00207 g008
Figure 9. Temperature contour in sub-channel square model.
Fluids 07 00207 g009
Figure 10. Contour of fluid temperature at various elevations from the fresh water inlet or velocity inlet ((a) = 0.60 m, (b) = 0.70 m, (c) = 0.80 m, (d) =0.90 m, and (e) = 1.0 m).
Fluids 07 00207 g010
Figure 11. Influences of heat flux on fluid temperature for a water inlet velocity of 1 m/s.
Fluids 07 00207 g011
Figure 12. Influences of heat flux on surface temperature for a water inlet velocity of 1 m/s.
Fluids 07 00207 g012
Figure 13. Heat transfer coefficient for laminar flow with variation of flow velocity at forced convection inlet with heat flux of 500 W/m2.
Fluids 07 00207 g013
Figure 14. Nusselt number (Nu) for laminar flow against altitude with variations in heat flux at various positions.
Fluids 07 00207 g014
Figure 15. A new convective correlation curve for laminar flow regime in sub-channel vertical square.
Fluids 07 00207 g015
Figure 16. The value comparison of convection in sub-channel vertical square (El-Genk for P/D = 1.25).
Fluids 07 00207 g016
Table 3. Grid-independent testing with different mesh sizes.
Mesh Size (mm)Grid ElementNuError (%)
0.11,381,804104.063947.048
0.21,618,68093.4183532.006
0.31,952,37989.0753825.869
0.42,023,09787.8059724.075
0.52,086,43674.352845.0652
Publisher’s Note: MDPI stays neutral with regard to jurisdictional claims in published maps and institutional affiliations.

