
Calculating the Emissions Impacts of Waste Electronics Recycling in Ontario, Canada

Ontario Center for Recycling Research, Brampton, ON L6S 2X5, Canada
C 2016, 2(2), 11; https://0-doi-org.brum.beds.ac.uk/10.3390/c2020011
Submission received: 3 February 2016
/
Revised: 1 April 2016
/
Accepted: 5 April 2016
/
Published: 11 April 2016
(This article belongs to the Special Issue Materials and Processes for Carbon Dioxide Capture and Utilisation)
Abstract
:This study highlights the economic and environmental challenges of recycling in Ontario, specifically examining the effect of attempting to increase the emissions target for the province’s Waste Electronics (WEEE) program. The findings from the cost model analysis found that Ontario’s Electronic Stewardship program reduces overall carbon emissions by approximately 205 thousand tonnes every year. This study also found that targeting specific materials for recovery could result in a scenario where the province could improve emissions offsets while reducing material management costs. Under our modeled scenario, as the tonnes of greenhouse gases (GHGs) avoided increases, the system cost per tonne of GHG avoided initially declines. However, after avoiding 215 thousand tonnes of GHGs (the optimal point), the system cost/tonne GHG avoided increases. To achieve an emissions target in excess of 215 thousand tonnes, the province will have to have to start recycling higher cost difficult to recycle materials (display monitors, computer peripherals, etc.).
1. Introduction
In 2015, the government of Ontario set a target of reducing greenhouse gas emissions by 15% below 1990 levels by the year 2020, and 37% below 1990 levels by the year 2030. This is seen as being part of a broader commitment at both the provincial and federal level to combat anthropogenic climate change [1]. The federal government has even agreed to an ambitious 195 country commitment to limit global warming to 2 degrees Celsius above pre-industrial levels. With a specific target in mind, the question policy planners now face is how best to achieve the goal of reduced greenhouse gas (GHG) emissions? To meet the 2030 target, Ontario’s emissions must decline by an average of 2.6% every year for the next 15 years [1].
As a means to encourage these reductions, the province has highlighted the waste management sector as being a primary driver of reduced carbon emissions through waste reduction, reuse and recycling [2]. The greenhouse gas benefits of recycling materials such as packaging and waste electronics represent a significant emissions sink that is key to understanding the positive contribution that the waste management industry makes to climate change mitigation [2]. Recycling has become a cornerstone of the province’s climate change strategy, and the mantra of the day has become “Increased recycling leads to increased carbon offsets”. While it is difficult to dispute the veracity of this statement (nor is it in the scope of this study to do so), are all recycling activities created equal? As a tangent to this question, what are the economic implications of carbon reduction?
To date, the emphasis of the research has been on quantifying the emissions impacts of diversion activity, but conspicuously absent from these discussions is what will it all cost. Using a systems based cost model, this study examines how emissions impacts and recycling system costs change depending on the types of material included in the waste electronics program. This study also models a scenario that attempts to maximize emissions offsets at the lowest possible cost. As far as can be ascertained, this is the first study of its kind to explore the relationship between waste electronics recycling, GHG abatement, and recycling system costs. Additionally, this study proposes a new metric by which to evaluate the efficacy of recycling initiatives, $/tCO2e: Dollars spent on recycling activity in order to reduce one tonne of carbon. The underlying goal of this study is to examine whether an optimal carbon reduction target exists for Ontario’s waste electronics recycling program.
Literature Review
The consideration of externalities (both economic and environmental) is critical when evaluating the merits of recycling initiatives. Most of the literature in favor of recycling cite the benefits of reducing the need to procure material from virgin sources [2] Recycling is seen as a potentially significant means to reduce carbon emissions impacts, promote resource stewardship and conservation and encourage a broader movement towards “sustainable living” [3]. However, participation in recycling initiatives remains low. It is estimated that while more than 75% of post-consumer waste can be recycled, only 30% of it actually is [4]. Canada as a whole and Ontario in particular do a particularly poor job with respect to recycling—the country ranks last in a list of OECD countries with respect to overall waste diversion, while Ontario is among the worst performing provinces in the country (with overall diversion rates of approximately 12%) [4]. This represents a significant opportunity for the nation’s waste management sector—even incremental improvements in overall diversion levels will have potentially significant impacts on various sustainability metrics (emissions impacts, etc.) This has obvious environmental benefits, in that depending on the material being recovered, recycling can reduce emissions output by a factor of 10x [5,6,7]). Increased recycling also reduces the quantities of material being sent to landfills, reducing the strain on landfill capacity and the need to site new landfills (which is becoming increasingly difficult in urban areas [8]. The authors of [9] even argue that the cost of recycling decreases relative to disposal over time, as landfill costs will increase as available capacity decreases.
As noted by [2], when materials are diverted from landfills for reuse or recycling, greenhouse gas emissions are affected in three ways. First, as with organic waste, if the material is methagenic, landfill methane emissions are eliminated, offset by a reduction in landfill carbon sequestration. Second, the energy inputs used to manufacture certain materials from virgin materials are significantly greater than those required from recycled material. As a result, recycling reduces total energy expenditure used during manufacturing processes, reducing GHG emissions [2]. Finally, reduction in the need to procure virgin wood by encouraging the recycling of printed paper and packaging subsequently resulting in additional forest carbon sequestration (as virgin tree stocks are no longer being harvested) [2].
However, the total greenhouse emissions “embedded” in a final product (be it made from recycled or virgin inputs) is highly variable and sensitive to the energy grid mix being used, distance to end markets, collection characteristics of waste/recycling activity and logistics of material flows [10]. As such, credibly quantifying the emissions impacts of waste management (and by proxy, recycling) activity has proven difficult. In a comparison of emissions credits for a range of household recyclables in studies [11,12] differences in emissions GHG impacts of recycling ranged by as much as 400% percent. While a significant percentage of these differences can be explained by differences in the energy grid mix (as an example, Canadian industries tend to rely more heavily on hydroelectricity as opposed to coal, and as a result, have lower GHG intensities from energy production), there is no one commonly accepted methodology for quantifying GHG impacts [6]. With this in mind, despite these uncertainties, it is commonly accepted that the upstream greenhouse gas benefits of recycling makes a significant positive contribution to climate change mitigation [13].
Studies conducted by [4,11,14,15] also find that recycling activity contributes to job creation (recycling creates 7x more jobs when compared to disposal), gross domestic product and value added measures. Even when the jobs displaced from recycling activity are accounted for, recycling positively impacts employment levels and the economy as a whole.
However, the benefits of recycling—reduced emissions, job creation, etc., are generally accrued by parties external of the municipality [16]. The jobs created by recycling generally occur “downstream” from the point of collection—at processing plants that are sometimes located in other provinces, states and even countries. Tangent to this point, there is considerable debate as to whether the external benefits of recycling can be quantified in any credible way. The authors of [17] found that the methodologies used to estimate job creation, emissions savings, etc. vary from study to study, and it remains unclear as to whether these numbers are accurate.
This paper does not attempt to offer any definitive guidance regarding the appropriateness of recycling as a sustainability strategy. Instead, it quantifies the environmental impacts of the residential recycling program for packaging waste and attempts to quantify the cost of doing so.
2. Results and Discussion
Quantifying the Emissions Impacts of the Waste Electronics Program (Baseline Scenario vs. Modeled Scenario)
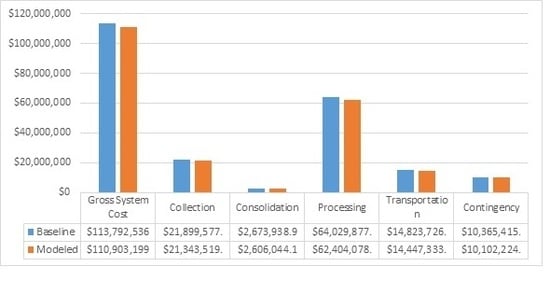
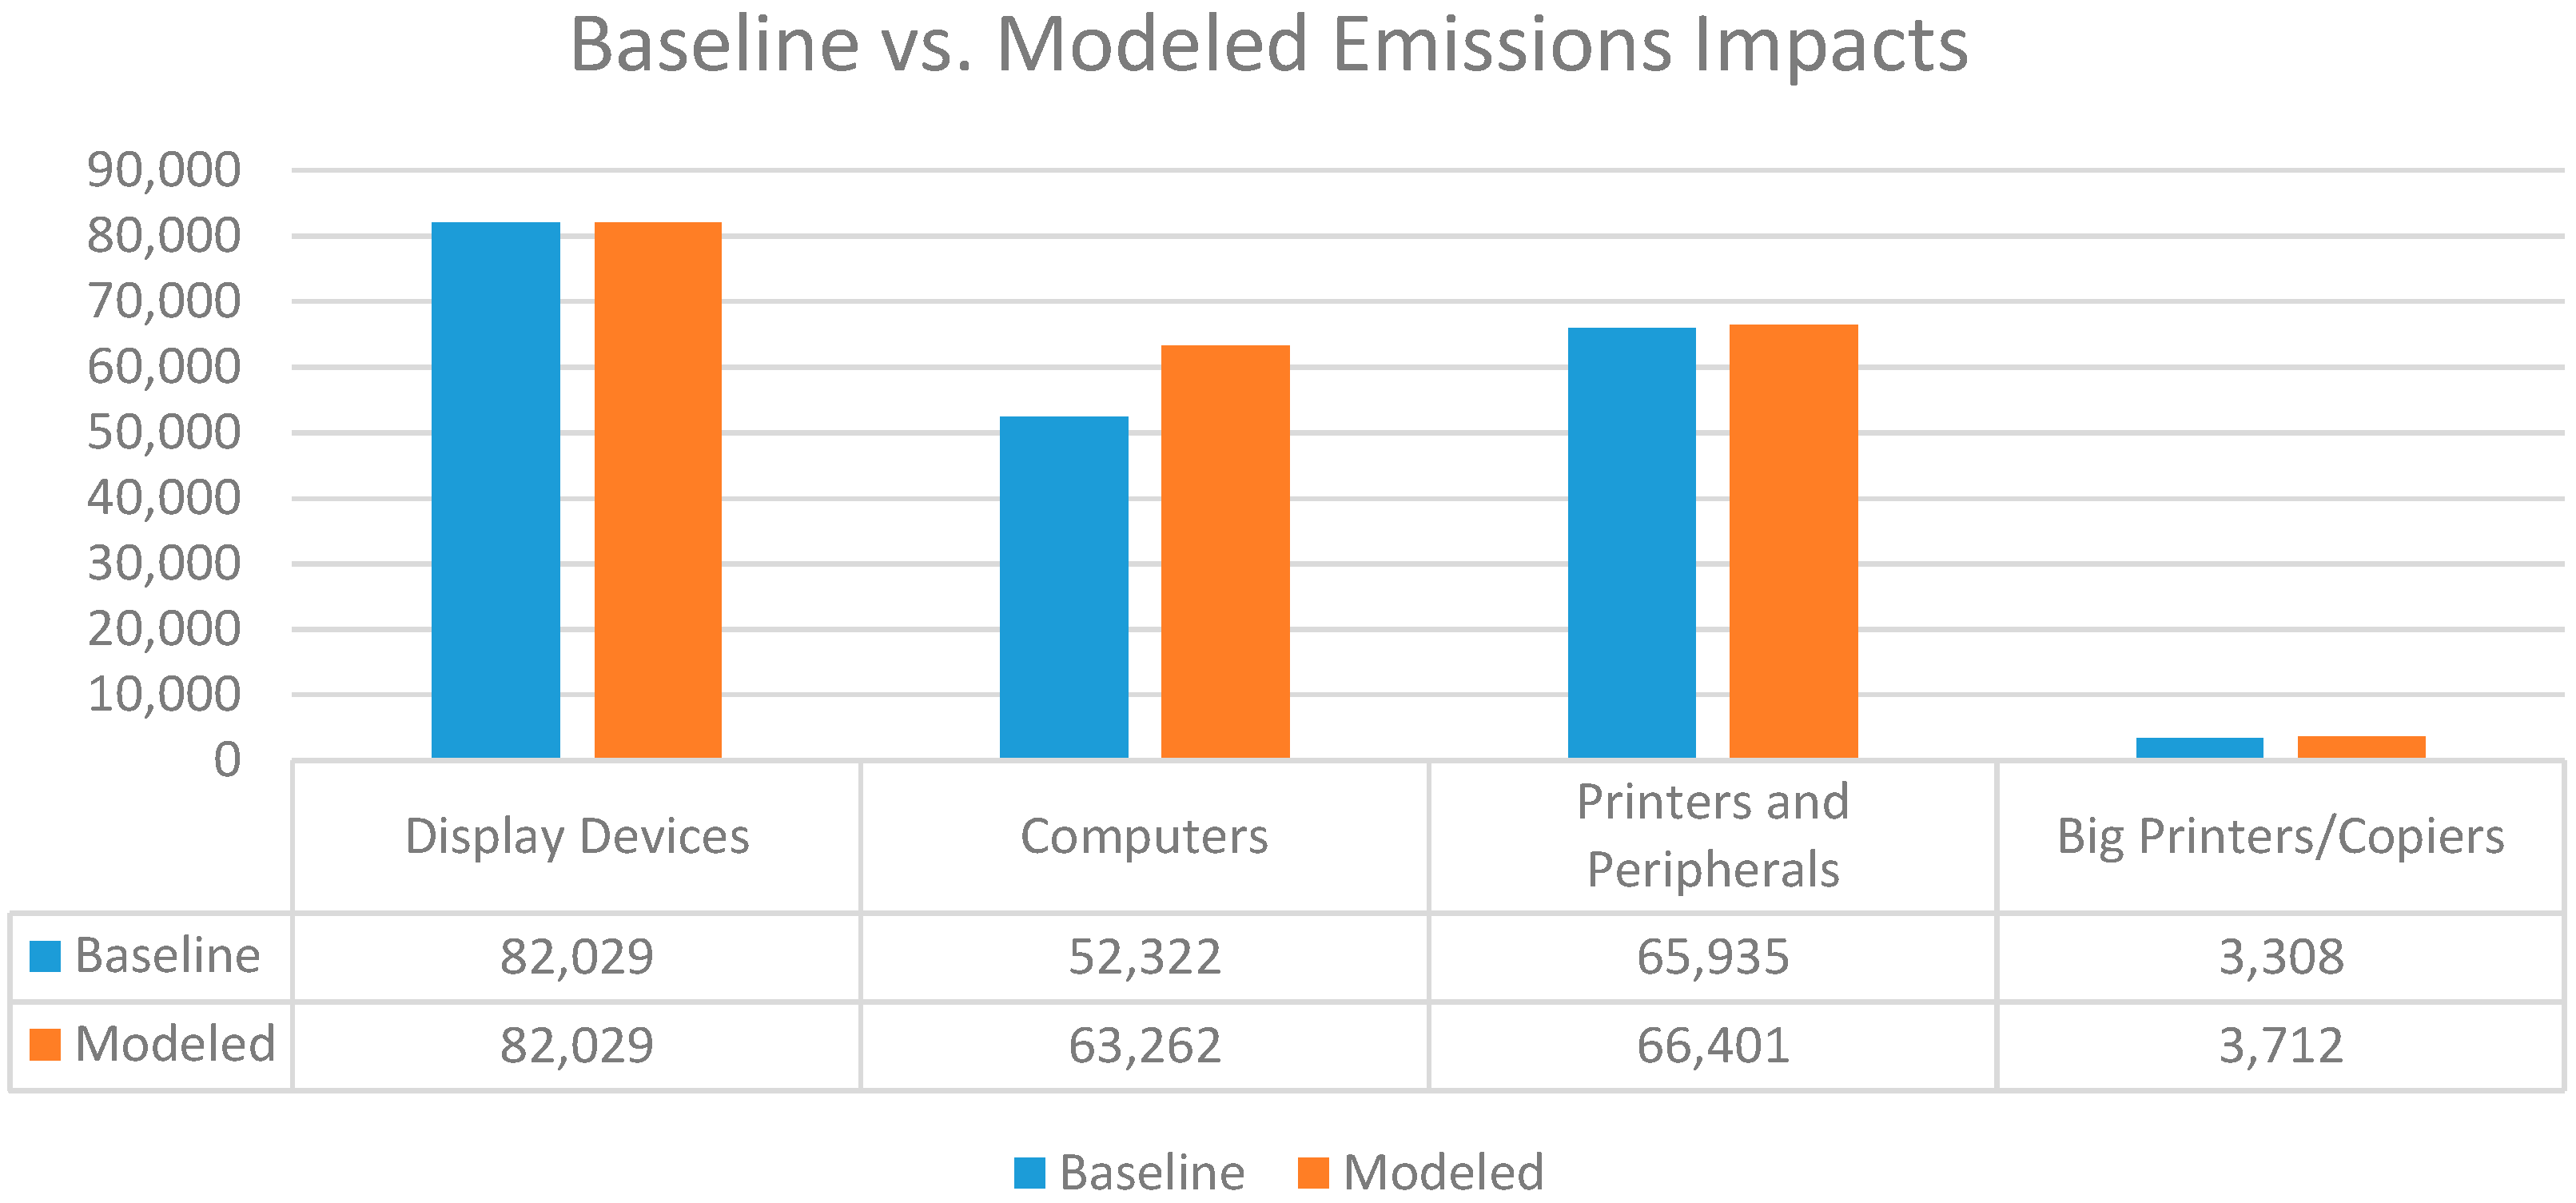
Figure 1 and Figure 2 below compares the emissions impacts and costs of recycling activity for our baseline and modeled scenarios. Table 1 summarizes how the recovery of materials have changed under the modeled scenario.
The baseline scenario models the system “as is”, using the recovered tonnes as reported by Ontario Electronic Stewardship. Conversely, the modeled scenario attempts to optimize the mix of materials being recovered by the Waste Electronics program, specifically targeting materials with the highest emissions impacts with the lowest material management costs (Expressed as materials with lower $/TCO2e values).
In the baseline scenario, total emissions credits attributable to recycling activity are 205 thousand tonnes of CO2e, with the greatest emissions savings coming from display devices, printers and peripherals. Under the modeled “optimal” system, emissions offsets increase to 215 thousand tonnes, with the greatest emissions savings increase observed in the personal and portable computer category.
Perhaps the most salient finding from the modeled results can be seen in Figure 2, where both system costs and recycling rates have actually decreased despite experiencing an increase in emissions offsets (net system costs decreased by approximately $2.9 million dollars). While this may seem like a counter-intuitive result (lower recycling rates and higher emissions offsets), given that the model has chosen to prioritize materials with the lowest costs and highest emissions credits, it is possible to simultaneously drive both economic and environmental goals. The model (as shown in Table 1) actually proposes focusing recycling efforts on computers and floor standing printers/copiers, as these materials are (a) readily recyclable and (b) relative to other materials, and result in greater emissions offsets when recycled.
This finding highlights that it is possible to decouple the link between recycling and emissions offsets. If the goal of the recycling system on aggregate is to reduce GHG emissions, then recycling the broadest range of materials may not be the most desirable or effective option.
3. Materials and Methods
3.1. Data Sources
For the purposes of this study, data for Ontario’s residential recycling system was obtained from Ontario Electronic Stewardship and the Waste Diversion Ontario (WDO). Each year, the WDO requests that Ontario Electronic report operational program information regarding performance of the program. Data collected includes information on the quantities of material recovered, the types of material recovered and the operating and capital costs associated with the management and collection of waste electronics.
The information collected is used to calculate material specific fees by Ontario Electronic Stewardship [18]. The fee allocation model allocates municipal recycling costs to individual materials based on activity based costing principles and a distribution of common costs. These costs have to be distributed to individual materials on the basis that a material specific net cost reflects the costs of end of life material management for that material. Some of these cost drivers include:
(a) The weight and volume (density (m3)) of the material;
(b) The amount of labour it consumed;
(c) The amount of time it consumed for all activities (includes time spent collecting, transporting and sorting each material);
(d) The amount of floor space and capital equipment it used;
(e) The number of compartments in the truck and/or the area (equipment, bunker, etc.) it occupied;
(f) The number of loads of material moved;
(g) The number of bales produced.
In 2014, the net cost for managing the residential Waste Electronics program was approximately $113 million dollars [19].
3.2. Description of Study Site
Ontario is Canada’s most populous province, situated between 41°85′ N and 51°28′ N and 95°48′ W and 74°74′ W, with a total land mass of 1,076,395 km2. Ontario remains at the forefront of recycling initiatives and legislation, recognized as one of only three provinces in Canada to implement an extended producer responsibility scheme (EPR) for household recyclables. Residential and commercial waste diversion programs exist for MHSW (Material Hazardous or Special Waste), WEEE (Waste Electrical and Electronics Equipment), automobile tires, and printed paper and packaging (Blue Box) materials. Each of these programs exist under the oversight of Waste Diversion Ontario, (WDO), and a non-crown corporation created under Ontario’s 2002 Waste Diversion Act [19]. The WDO was established to develop, implement and manage waste diversion programs for stakeholders from both private and public sectors [19]. Ontario Electronic Stewardship is the industry funding organization for waste electrical and electronic equipment approved by the Minister under section 26 of the Ontario Regulations Act [19].
Under provincial regulation O. Reg. 320/09 [20], waste electrical and electronic equipment” means a device that is waste, that requires an electric current to operate and that is,
(a) A household appliance, whether used inside or outside a home,
(b) Information technology equipment,
(c) Telecommunications equipment,
(d) Audio-visual equipment,
(e) A toy, leisure equipment or sports equipment,
(f) An electrical or electronic tool, but not including a large-scale stationary industrial tool,
(g) A navigational, measuring, monitoring, medical or control instrument.
3.3. Description of Waste Electronics Materials
Data used in this study pertains to materials found in the Ontario Electronics Stewardship waste electronics program. The following material categories are “parent” categories, of which a range of consumer electronics belong to. As an example, computer peripherals includes, mice, keyboard, webcams, microphones, etc. These include:
- Computer Monitors
- Display Devices (18”–45”)
- Desktop Computers
- Portable Laptop Computers
- Desktop and portable printing, copying machines
- Telephones and telephone answering machines
- Cellular Devices and Pagers
- Computer Peripherals
- Personal/Portable (CD Players, MP3 Players, etc.)
- Home/Non Portable
- Home Theatre in a Box
- Aftermarket Vehicle Radio
- Floor Standing Printing Devices
- Floor Standing Copying Devices
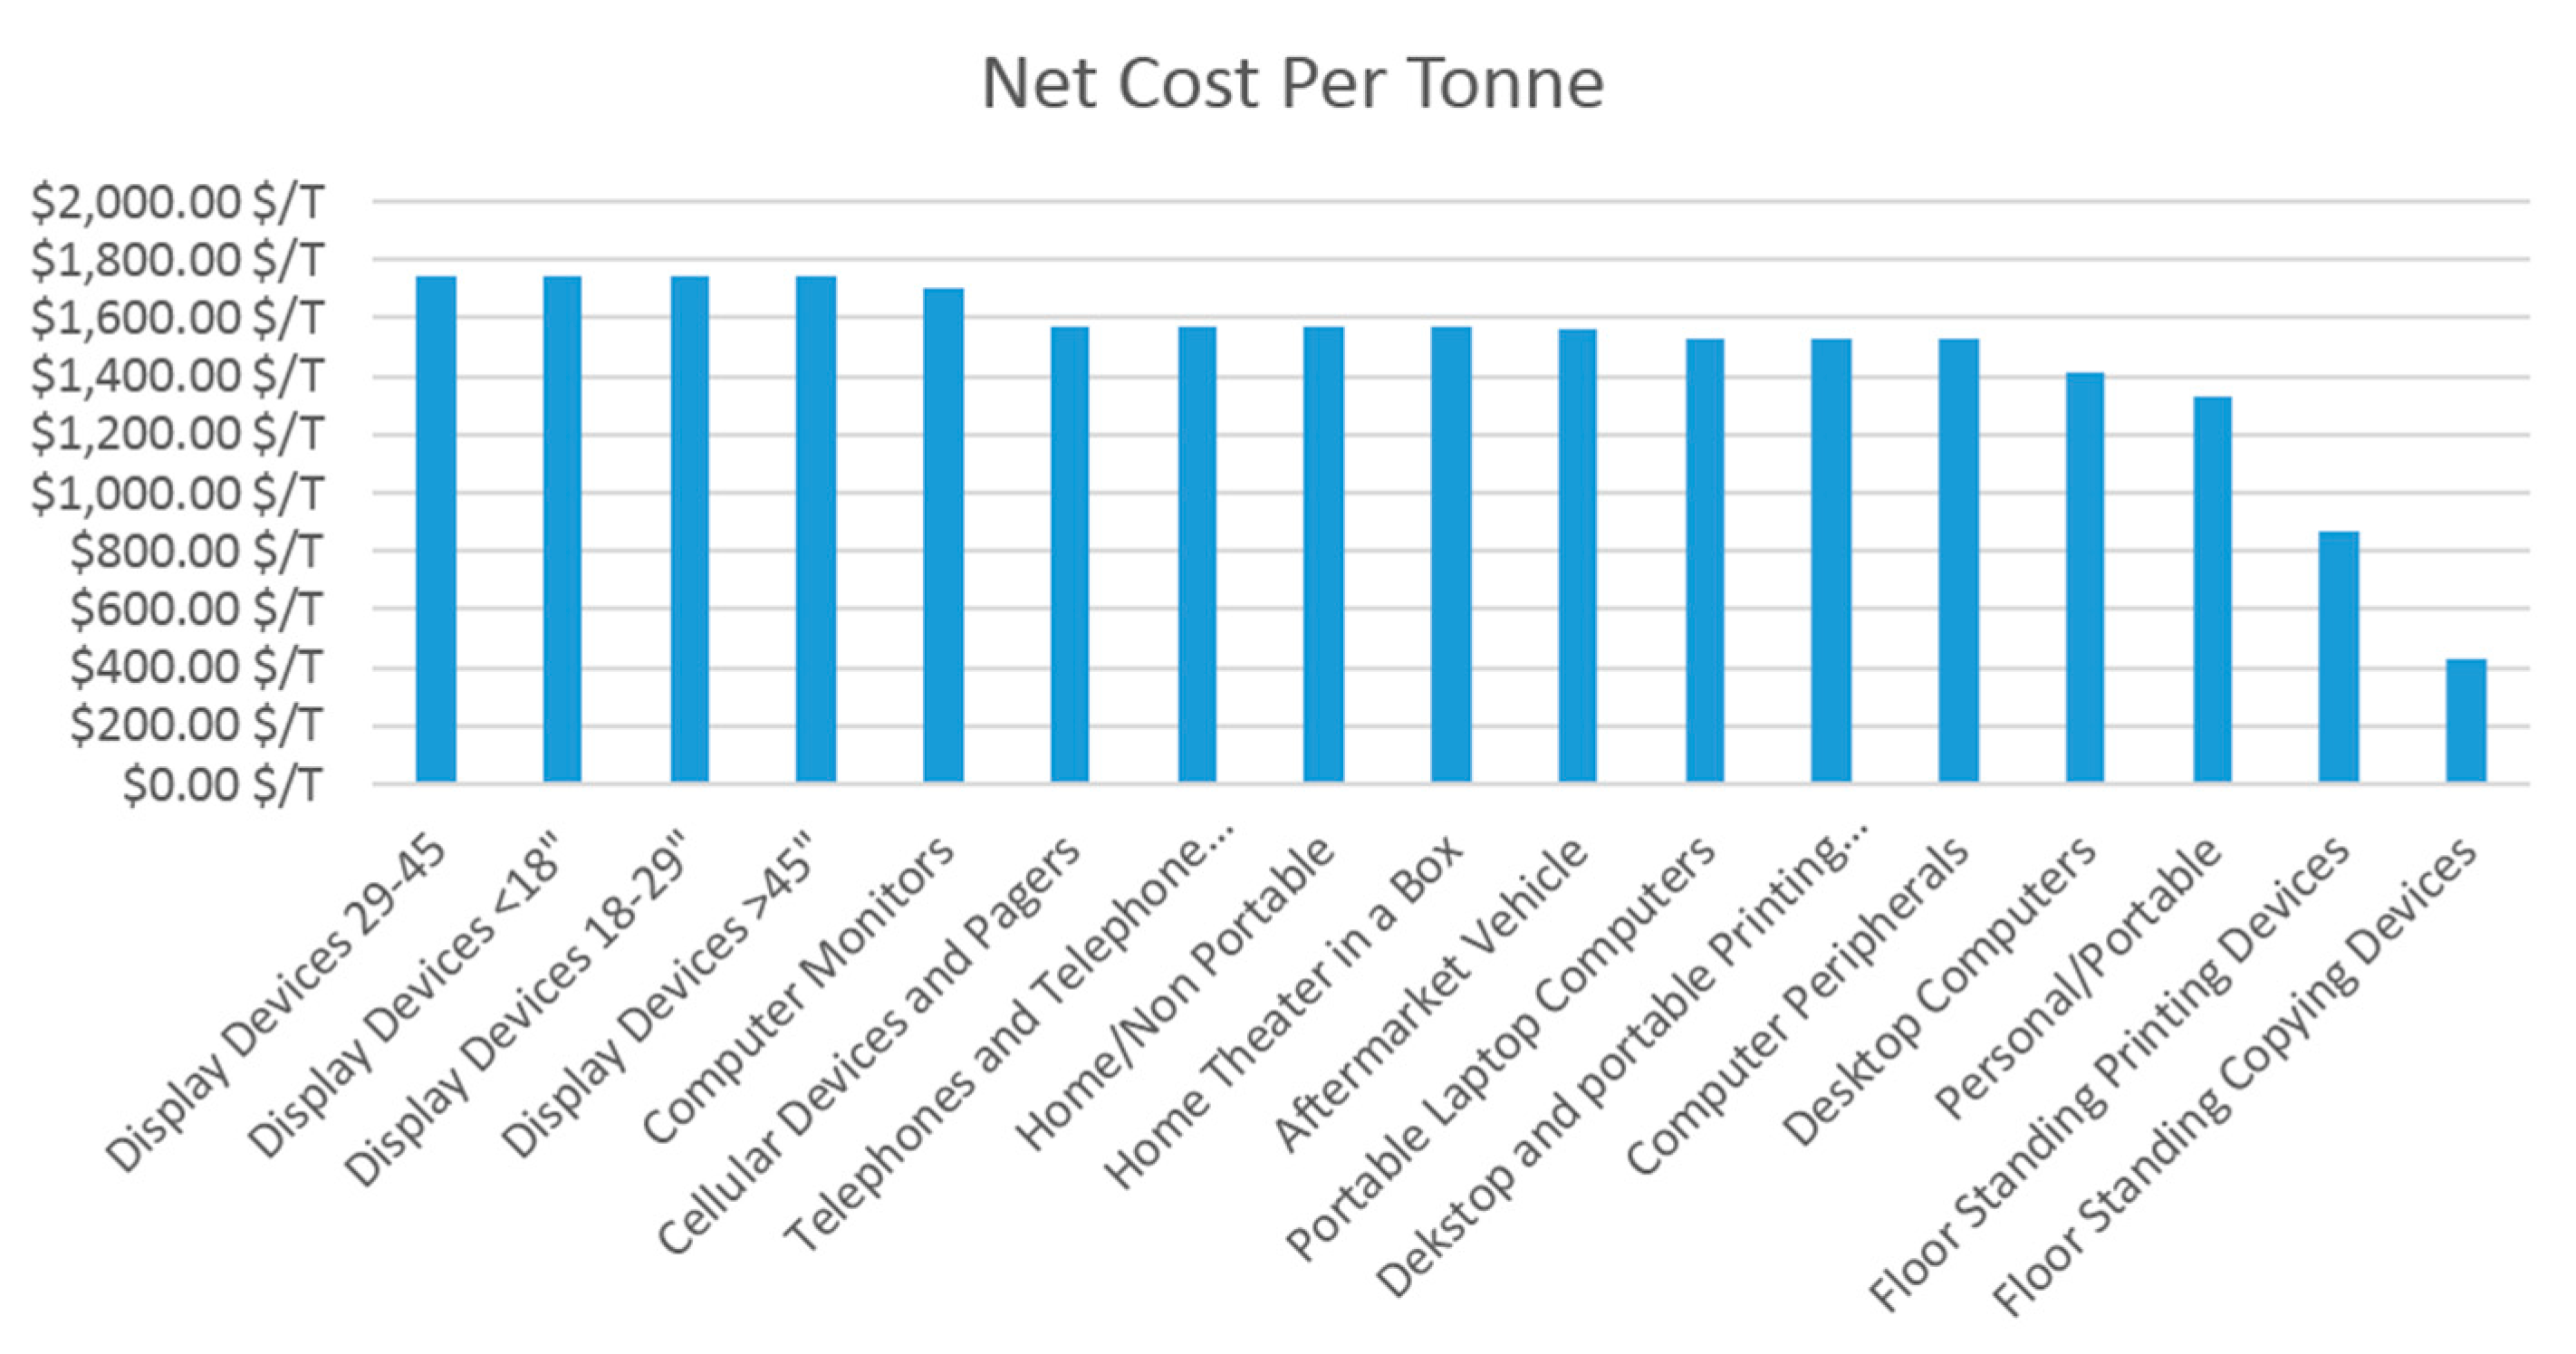
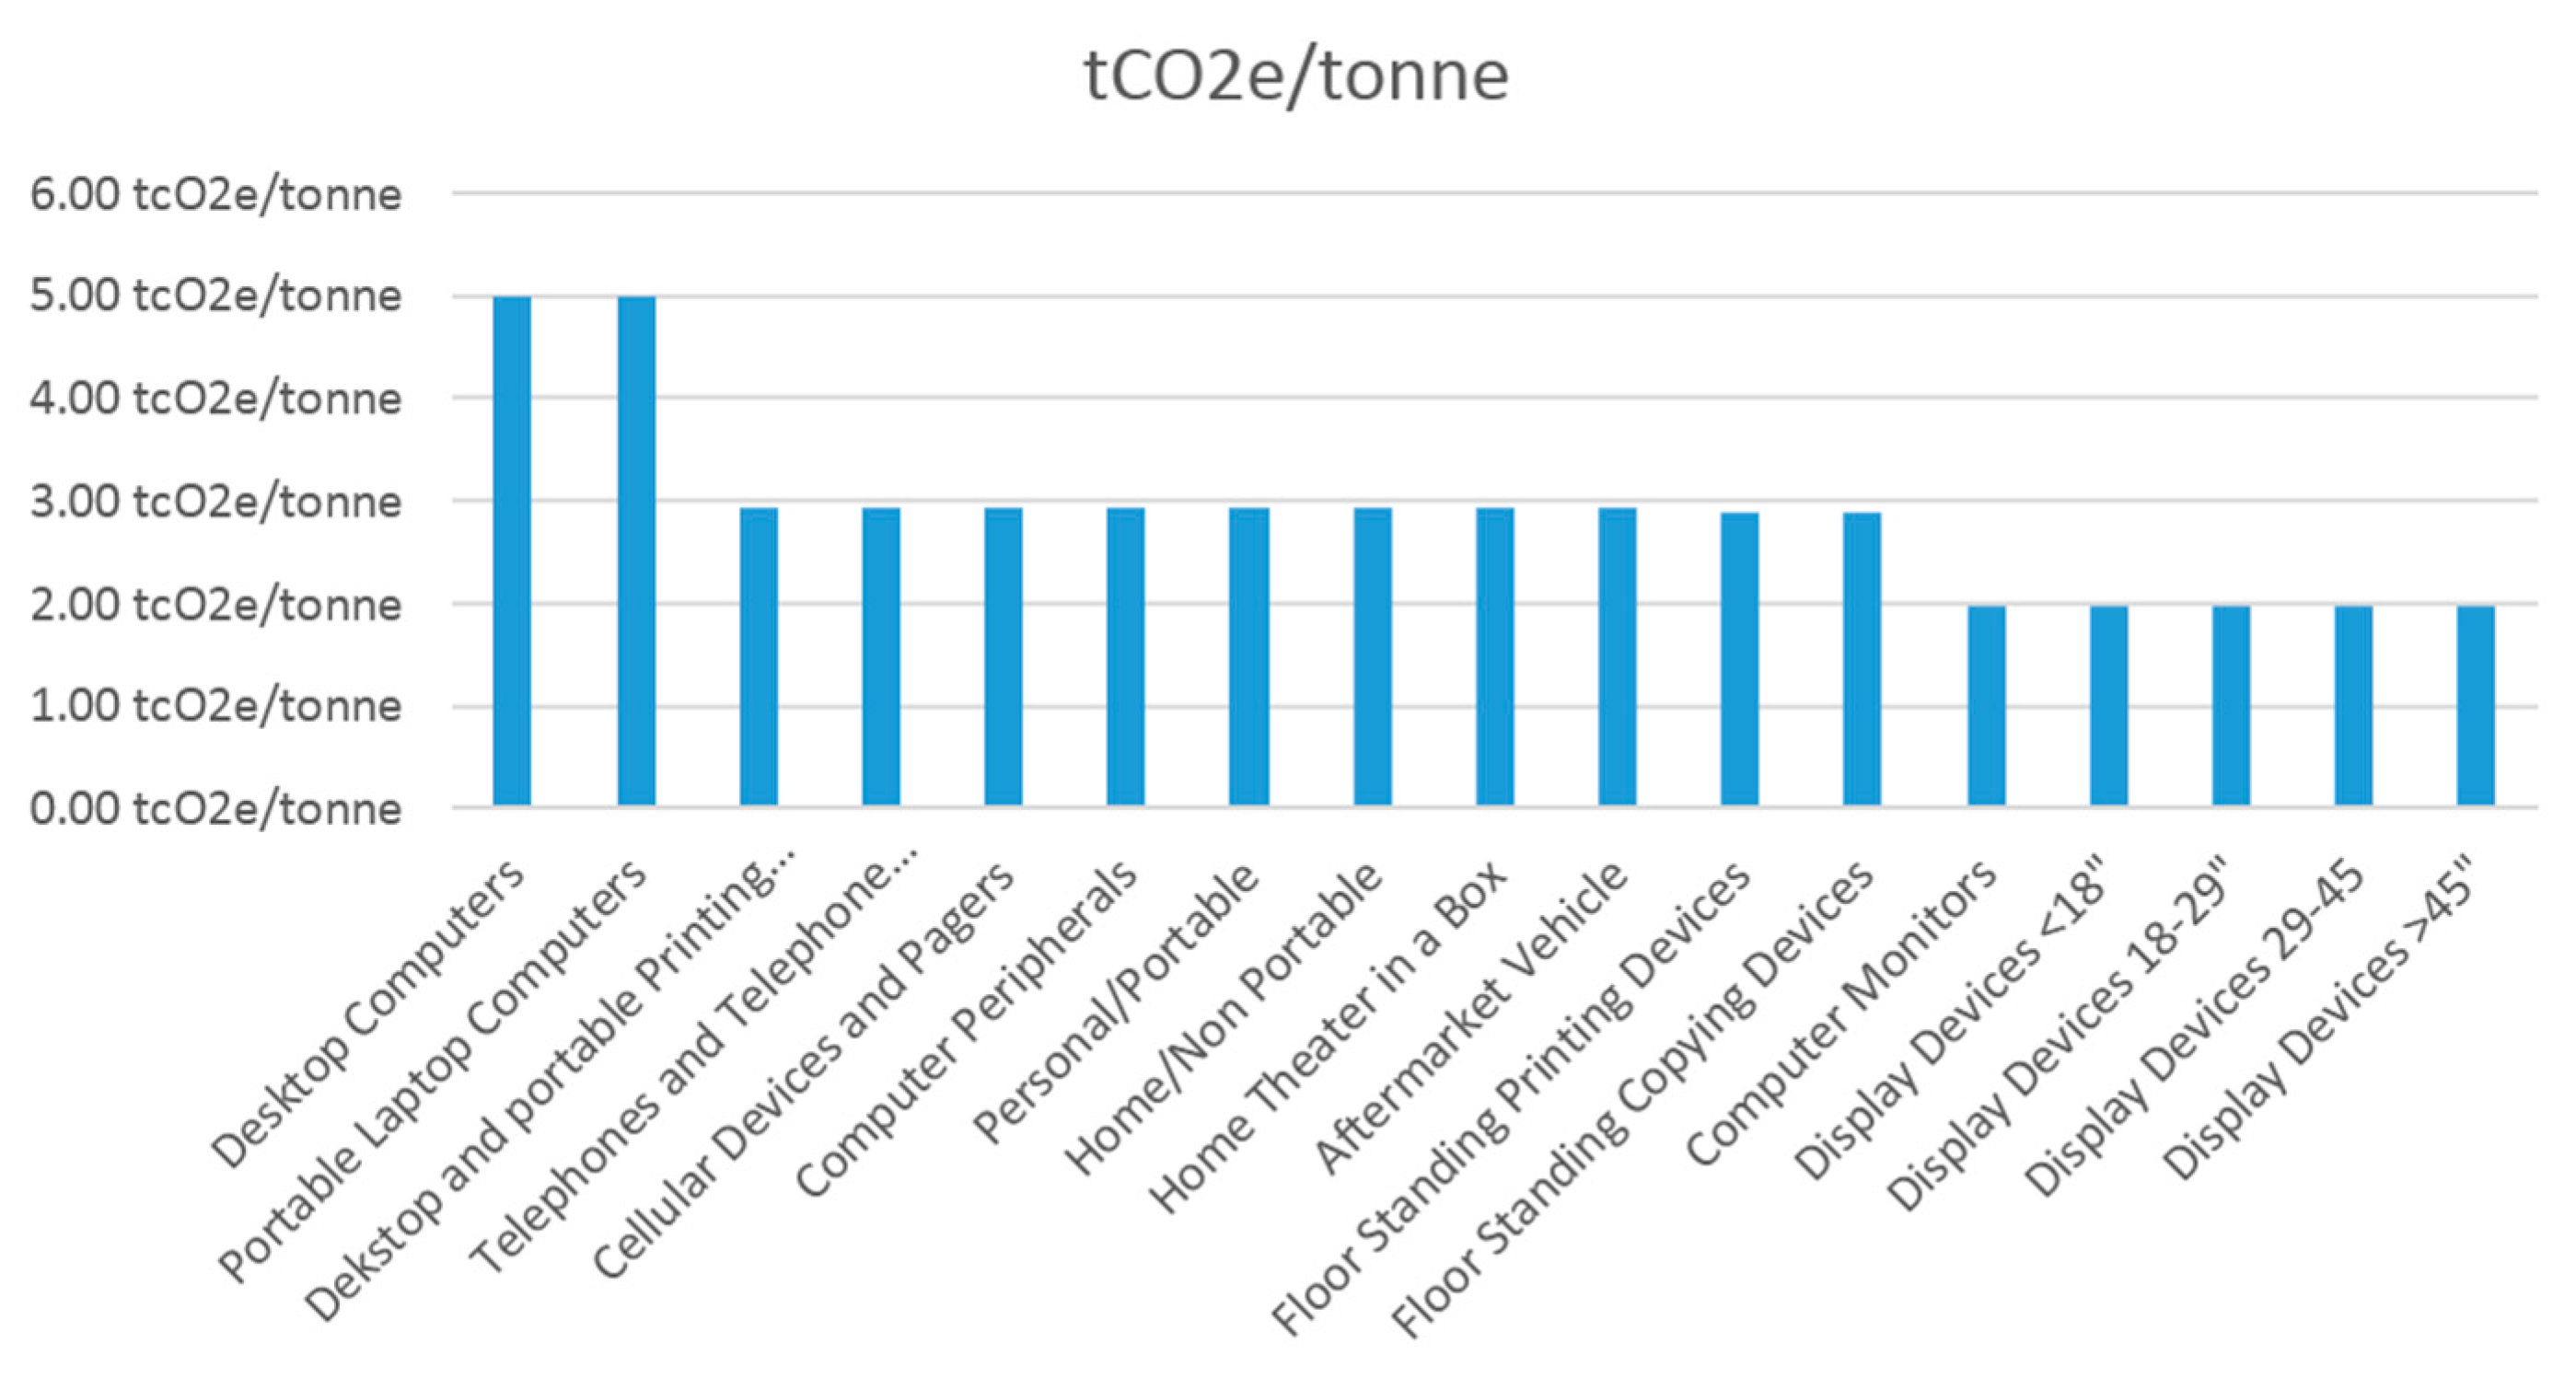
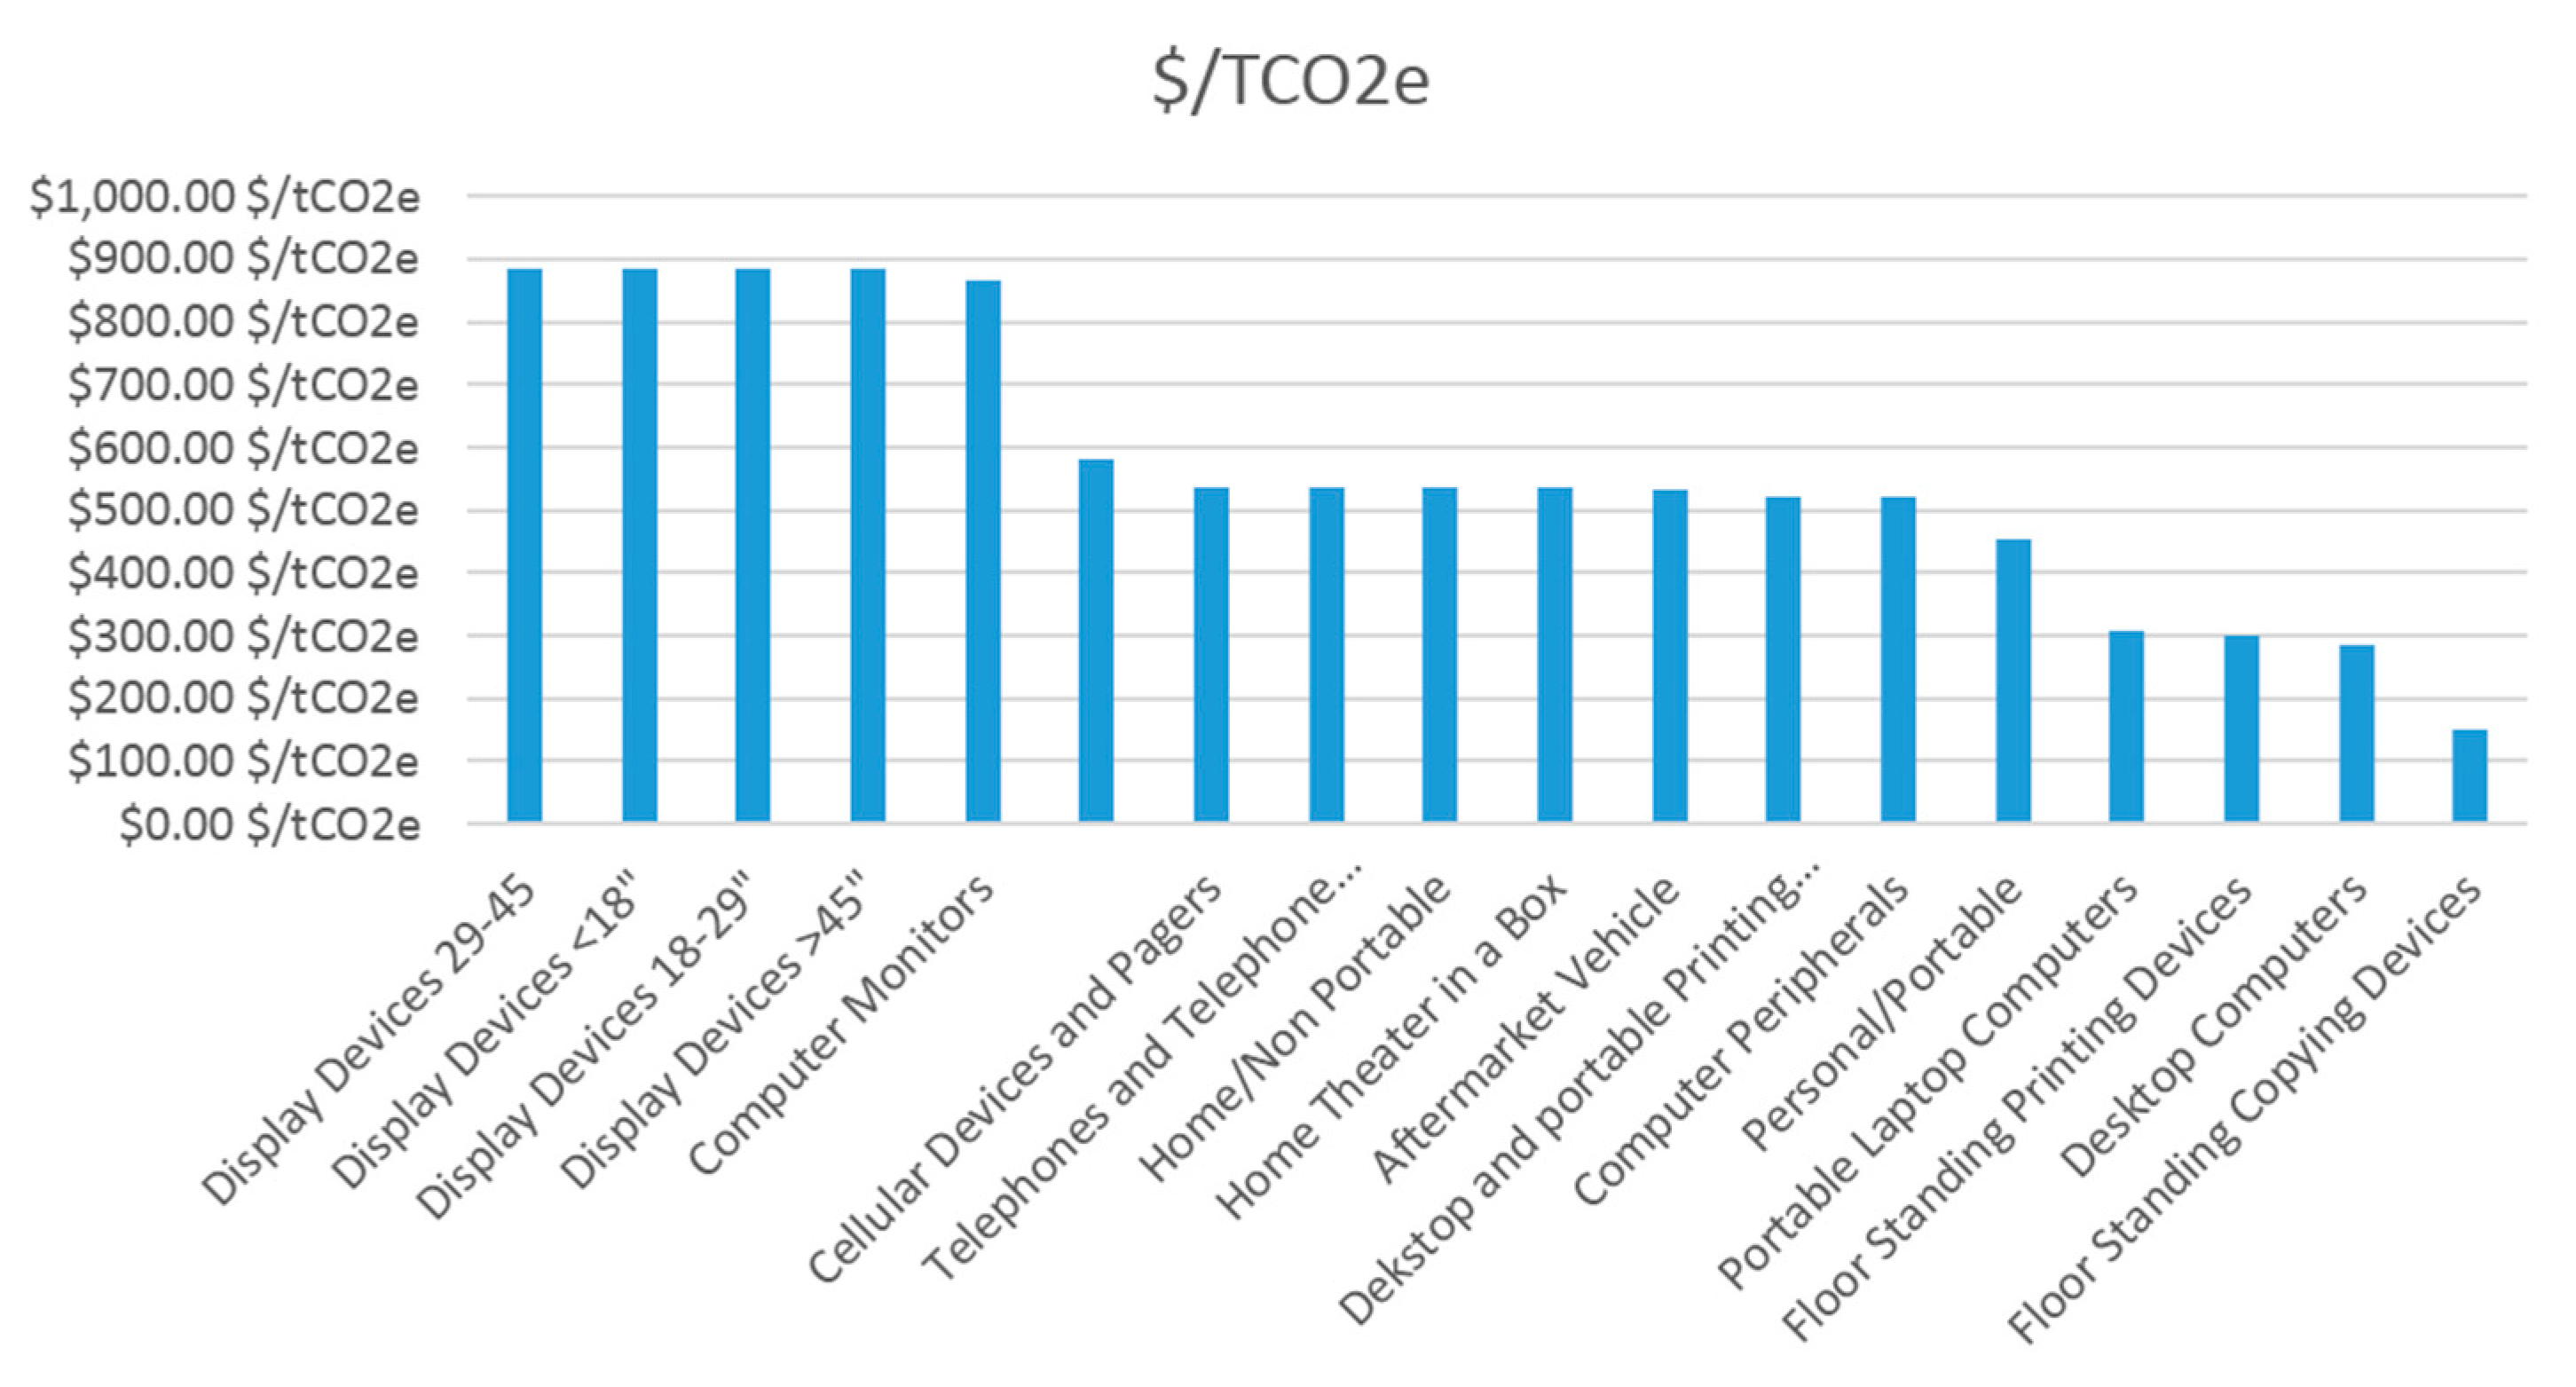
Figure 3, Figure 4 and Figure 5 compare the net cost of material management, emissions credits and $/tonne CO2 avoided for the full range of Waste Electronics materials. Net cost of material management is calculated by taking the gross cost of material management and subtracting revenue from the sale of marketed material (Equation (1): Gross Cost − Sales Revenue = Net Cost). Net cost is used in lieu of gross costs, as it is the actual cost of recycling incurred by the service provider. Revenue is calculated using the average price reported by service providers for the sale of processed and baled materials. Composition based costing principles are used to allocate revenue to individual material categories (i.e., what is the average composition and value of the materials found in a VCR). Ontario Electronic Stewardship does not publicly report average composition or weights used in cost calculations. The emissions credit is calculated using the Environment Canada Greenhouse Gases Calculator for waste management (2013). This calculator is based on the US Environment Protection Agency Waste Reduction Model (WARM) (2015). The Environment Canada model has been adapted to reflect Ontario’s energy grid mix and transport distances (for collection, distance to landfill and distance to end markets). The emissions coefficient is calculated by comparing the emissions associated with virgin material extraction, procession, transportation and manufacturing with recycling collection, sorting, processing and transportation. $/tCO2 avoided (Dollars spent for every tonne of CO2e) is calculated by dividing the net cost of material management by the emissions credit for each of the materials included in the program (Equation (2): Net Cost/Emission credit = $/tCO2e).
Note: These figures are based on the cost to manage waste electronics in Ontario and may not be indicative of the costs incurred in other jurisdictions.
Figure 1 and Figure 3 above show that floor standing printing and copying devices, as well as personal and portable computers, on average, tend to have the lowest costs of material management and $ spent for every tonne of CO2e avoided. Conversely, display devices (computer monitors and televisions), on average, have significantly higher net costs and $/tCO2e. This, in part, is attributable to the low recyclability and high costs of material management for these materials.
3.4. Description of Environment Canada Greenhouse Gase (GHG) Calculator
The Environment Canada GHG Calculator for waste management is designed to help municipalities and other stakeholders estimate the GHG emissions impacts from different waste management practices, including recycling, composting, energy from waste and landfilling [22]. The life cycle methodology used to estimate emissions coefficients for various waste management activities is based on the United States Environment Protection Agency’s Waste Reduction Model (which has been in development since 1993). The Environment Canada GHG Calculator builds and expands on the WARM model by:
- Using Canadian GHG emissions factors for materials commonly found in the Canadian waste stream
- Includes anaerobic digestion as a waste management treatment option
- Expands the list of materials included in the calculator to better reflect Canada’s waste stream, i.e., inclusion of white goods and waste electronics
- The use of province specific fuel generation to reflect regional differences in the energy grid mix.
While the methodologies used to quantify GHG impacts attributable to waste management activities are inexact, the Environment Canada GHG Calculator is widely regarded as the industry standard for estimating material specific emissions coefficients [21]. A more detailed description of the assumptions surrounding the methodology can be found on Environment Canada’s website ([21]).
3.5. Description of Model
To quantify the full effects of waste electronics materials on system and material specific costs, a GHG cost model was developed to achieve the following: (a) calculate the total emissions impacts for the WEEE program; (b) model a scenario that attempts to maximize avoided GHG emissions at the lowest possible cost by changing the mix of materials being recovered; and (c) if possible, identify an optimal GHG target for the WEEE program.
The cost model developed for this study used data collected from the Ontario Electronic Stewardship program plan, and the Environment Canada GHG Calculator, and was created in Microsoft Excel. The cost model allows users to model the following:
- Users can alter material tonnes recovered or material revenues to re-calculate impact on WEEE system costs, diversion levels and emissions impacts.
- Users can set a WEEE system goal emissions target (currently set at 215,000 CO2/e). The model calculates the impact on Waste Electronics system costs and recycling rates (To achieve the goal emissions target) by increasing diversion for the materials with the lowest net cost and highest emissions credits.
- Users can select the value of a proposed carbon credit and calculate the potential value of carbon offsets for the WEEE program (by material type).
3.6. Key Model Assumptions
All cost and recovery data used in the cost model used the values as reported by Ontario Electronic Stewardship and the WDO. All reasonable efforts were made to maintain data integrity by performing as little data manipulation as possible. For example, if display devices were targeted for removal, the model would take its reported net cost per tonne, multiply it by the number of tonnes reported as recycled/diverted, and subtract that total from overall system costs. Data would need to be recalculated with respect to the distribution of common costs. By removing a material from the program, their share of overall common costs would need to be redistributed among the remaining materials. This was a calculated figure, and was done on the basis of a material’s contribution to overall waste electronics generation.
A potential limitation of this cost model is that it assumes a linear relationship between the quantity of material recycled and cost of material management. The marginal cost of recycling may actually increase as the quantity of recovered material increases (as additional investments in collection, infrastructure, etc. are required to manage additional materials). However, given that there is no information regarding existing system capacity, it is assumed that the recycling system is capable of accommodating all of the material presently available for collection.
Readers are cautioned from using the model results prescriptively. Given the inherent uncertainties in attempting to credibly quantify GHG emissions, the cost model should be seen as a “directional” tool. It is designed to highlight that not all materials are created equal with respect to the environmental and economic benefits of recycling activity.
4. Conclusions and Policy Implications
This study highlights the economic and environmental challenges of recycling in Ontario, specifically examining the effect of attempting to increase the emissions target for the province’s waste electronics program. The findings from the cost model analysis found that Ontario’s WEEE program reduces overall carbon emissions by approximately 205 thousand tonnes every year. This study also found that targeting specific materials for recovery could result in a scenario where the province could improve emissions offsets while reducing material management costs. Under our modeled scenario, as the tonnes of GHGs avoided increases, the system cost per tonne of GHG decreases. This is achieved by focusing on readily recyclable and high emissions offsets material, i.e., desktop and portable computers (using the $/tCO2e metric).
This study raises the question: At what point is it no longer economically feasible or desirable to recover a resource? Many of Ontario’s policy planners and electronics producers have questioned whether decreasing emissions justifies a potential increase in the cost of managing the recycling system. These concerns have been echoed in jurisdictions across North America and Europe, as municipal planners must weigh the benefits of recycling against rising material management costs [23].
As recycling system costs continue to increase, both municipalities and packaging producers have questioned whether decreasing emissions justifies a potential increase in the cost of managing the recycling system. These concerns have been echoed in jurisdictions across North America and Europe, as municipal planners must weigh the social and environmental benefits of recycling against rising material management costs. While the scenario modeled in this study reflects Ontario specific costs and recycling data, the overarching message—namely that what is being recycled is more important than how much is being recycled—can be transposed to other areas.
While this paper is reluctant to offer recommendations regarding the appropriateness of recycling as a means to reduce carbon emissions, policy planners need to be both adaptive and proactive in designing a system that is capable of responding to Ontario’s changing environmental priorities. The province has clearly signaled its intention to move towards a carbon cap and trade system and has set a preliminary emissions target for the province at 15% below 1990 levels. While the waste management sector is expected to play a critical role in helping Ontario achieve this target, we must be recognize that offsetting additional carbon comes at a cost (incremental offsets over and above the amount currently being offset by the WEEE program`). The policy question is whether these additional costs are worth the avoided emissions. Further to that point, if recycling is no long considered an environmentally/economically preferable solution, what is considered a suitable alternative?
There is a need to address the long term tenability of recycling initiatives and the notion that “more is better” with respect to waste diversion. While much of the current dialogue surrounding waste management revolves around increasing recycling rates and reducing GHG impacts, one must take a step back and ask whether a higher recycling rate should be the focal point of policy objectives. Are there metrics beyond recycling rates and emissions impacts that need to be considered when evaluating the long term sustainability of waste management systems?
While movements towards more sustainable waste management options should certainly be promoted, we must recognize that the most sustainable system is not necessarily the one that recycles the most material. Though recycling is a central component of developing sustainable waste management systems, its adoption must be weighed against budgetary, social and environmental considerations. The careful balancing act between continuous improvement in diversion, GHG abatement and cost containment is a topic that requires increased academic attention.
Acknowledgments
Funding for this project was received from the Ontario Center for Recycling Research, a not for profit organization devoted to advancing understanding of waste management issues in Canada.
Author Contributions
Calvin Lakhan was responsible for data collection, analysis and manuscript preparation.
Conflicts of Interest
The authors declare no conflict of interest.
References
- Ministry of the Environment and Climate Change (MOECC). Climate Change Strategy. Available online: https://www.ontario.ca/page/climate-change-strategy (accessed on 6 December 2015).
- Ontario Waste Management Association. Greenhouse Gas Emissions and the Ontario Waste Management Industry White Paper. 2015. Available online: http://www.owma.org/About/tabid/120/ctl/DisplayAttachment/mid/511/AnnotationId/0752ab47-a9a9-e511-8dc5-00155d607900/ShowOpenSaveDlg/1/Default.aspx (accessed on 11 December 2015).
- Unruh, J. Recycle Everything: Why We Must, How We Can; CreateSpace Independent Publishing Platform: New York, NY, USA, 2010. [Google Scholar]
- Conference Board of Canada. Opportunities for Ontario’s Waste: Economic Impacts of Waste Diversion in North America. 2014. Available online: http://www.conferenceboard.ca/e-library/abstract.aspx?did=6233 (accessed on 15 December 2015).
- Corrections to Published Carbon Storage Factors for Mixed Municipal Waste. Memorandum to Parties Interested in Carbon Sequestration from Municipal Solid Waste. Available online: https://www3.epa.gov/warm/pdfs/Sequestration_Correction2_102708.pdf (accessed on 4 January 2016).
- ICF. Determination of the Impact of Waste Management Activities on Greenhouse Gas Emissions. Available online: http://www.rcbc.ca/files/u3/ICF-final-report.pdf (accessed on 8 April 2016).
- Mabee, W.E.; Calvert, K.; Manion, N.C.; Stephen, J.D.; Earley, S. Circular economies and Canada’s forest sector. In Proceedings of the Greening Work in a Chilly World Conference, University of Toronto/York University, Toronto, ON, Canada, 18 November 2011.
- Sachs, N. Planning the funeral at the birth: Extended producer responsibility in the European union and the Unites States. Harv. Environ. Law Rev. 2006, 30, 51–98. [Google Scholar]
- Highfill, J.; Mcasey, M. Municipal waste management: Recycling and landfill space constraints. J. Urban Econ. 1997, 41, 118–136. [Google Scholar] [CrossRef]
- Lox, F. Waste Management—Life Cycle Analysis of Packaging; Final Report; Belgian Packaging Institute: Zellik, Belgium, 1994. [Google Scholar]
- Measuring the Environmental Benefits of Ontario’s Blue Box, MHSW and WEEE Diversion. Available online: https://www.ontario.ca/document/measuring-environmental-benefits-ontarios-blue-box-mhsw-and-weee-diversion-final-report (accessed on 17 December 2015).
- United States Environmental Protection Agency. Documentation for Greenhouse Gas Emission and Energy Factors Used in the Waste Reduction Model. Available online: http://www3.epa.gov/warm/SWMGHGreport.html (accessed on 26 December 2015).
- Sheehan, B.; Spiegelman, H. EPR in the US and Canada. Resour. Recycl. 2005, 3, 18–21. [Google Scholar]
- National Recycling Coalition Inc. U.S. Recycling Economic Information Study. Available online: http://www.epa.gov/osw/conserve/tools/rmd/rei-rw/pdf/n_report.pdf (accessed on 19 January 2016).
- United States Environmental Protection Agency. Municipal Solid Waste in the United States 2007 Facts and Figures; USEPA: Washington, DC, USA, 2007. [Google Scholar]
- Mayers, K.; Butler, S. Producer responsibility organizations development and operations. J. Ind. Ecol. 2013, 17, 277–289. [Google Scholar] [CrossRef]
- Pollin, R.; Peltier-Garrett, H. Building a Green Economy: Employment Effects of Green Energy Investments for Ontario; Political Economy Research Institute, University of Massachusetts: Amherst, MA, USA, 2009. [Google Scholar]
- Ontario Electronic Stewardship. Annual Program Plan. Available online: http://ontarioelectronicstewardship.ca/wp-content/uploads/2014/02/program_plan_jul10_2009.pdf (accessed on 19 December 2015).
- Waste Diversion Ontario. About WDO. Available online: http://www.wdo.ca/content/?path=page81+item35937 (accessed on 19 December 2015).
- Ministry of the Environment and Climate Change. Ontario Environmental Protection Act: Ontario Regulation 320/09. Available online: http://www.e-laws.gov.on.ca/html/source/regs/english/2009/elaws_src_regs_r04274_e.htm (accessed on 4 January 2016).
- Ontario Electronic Stewardship. Final Revised Waste Electrical and Electronic Equipment Program Plan. Available online: http://ontarioelectronicstewardship.ca/wp-content/uploads/2014/02/program_plan_jul10_2009.pdf (accessed on 19 December 2015).
- (GHG) Calculator for Waste Management. Available online: https://www.ec.gc.ca/gdd-mw/default.asp?lang=En&n=D6A8B05A-1 (accessed on 20 December 2015).
- Boyce, J. Recycling of Non Renewable Resource and the Least Cost First Principle; Department of Economics, University of Calgary: Calgary, AB, USA, 2012. [Google Scholar]
Figure 1.
Baseline vs. Modeled Scenario (CO2e).

Figure 2.
Baseline vs. Modeled Scenario.

Figure 3.
Net cost per tonne for Waste Electronics (WEEE) materials (Adapted from [21]).
Figure 3.
Net cost per tonne for Waste Electronics (WEEE) materials (Adapted from [21]).

Figure 4.
Emissions credits for WEEE (tCO2e).

Figure 5.
$ spent for every tonne CO2e avoided (by Material Type).


| Change in Individual Material Tonnages | ||
|---|---|---|
| Display Devices | −4013 T | 36,776 |
| Computers | 2190 T | 10,475 |
| Printers and Peripherals | 159 T | 22,482 |
| Big Printers/Copiers | 140 T | 1285 |
© 2016 by the author. Licensee MDPI, Basel, Switzerland. This article is an open access article distributed under the terms and conditions of the Creative Commons by Attribution (CC-BY) license ( http://creativecommons.org/licenses/by/4.0/).
Share and Cite
MDPI and ACS Style
Lakhan, C. Calculating the Emissions Impacts of Waste Electronics Recycling in Ontario, Canada. C 2016, 2, 11. https://0-doi-org.brum.beds.ac.uk/10.3390/c2020011
AMA Style
Lakhan C. Calculating the Emissions Impacts of Waste Electronics Recycling in Ontario, Canada. C. 2016; 2(2):11. https://0-doi-org.brum.beds.ac.uk/10.3390/c2020011
Chicago/Turabian StyleLakhan, Calvin. 2016. "Calculating the Emissions Impacts of Waste Electronics Recycling in Ontario, Canada" C 2, no. 2: 11. https://0-doi-org.brum.beds.ac.uk/10.3390/c2020011
Note that from the first issue of 2016, this journal uses article numbers instead of page numbers. See further details here.