
Carbon Nanofibers Grown on Large Woven Cloths: Morphology and Properties of Growth

Abstract
:
1. Introduction
2. Materials and Methods
2.1. Substrate
- (1)
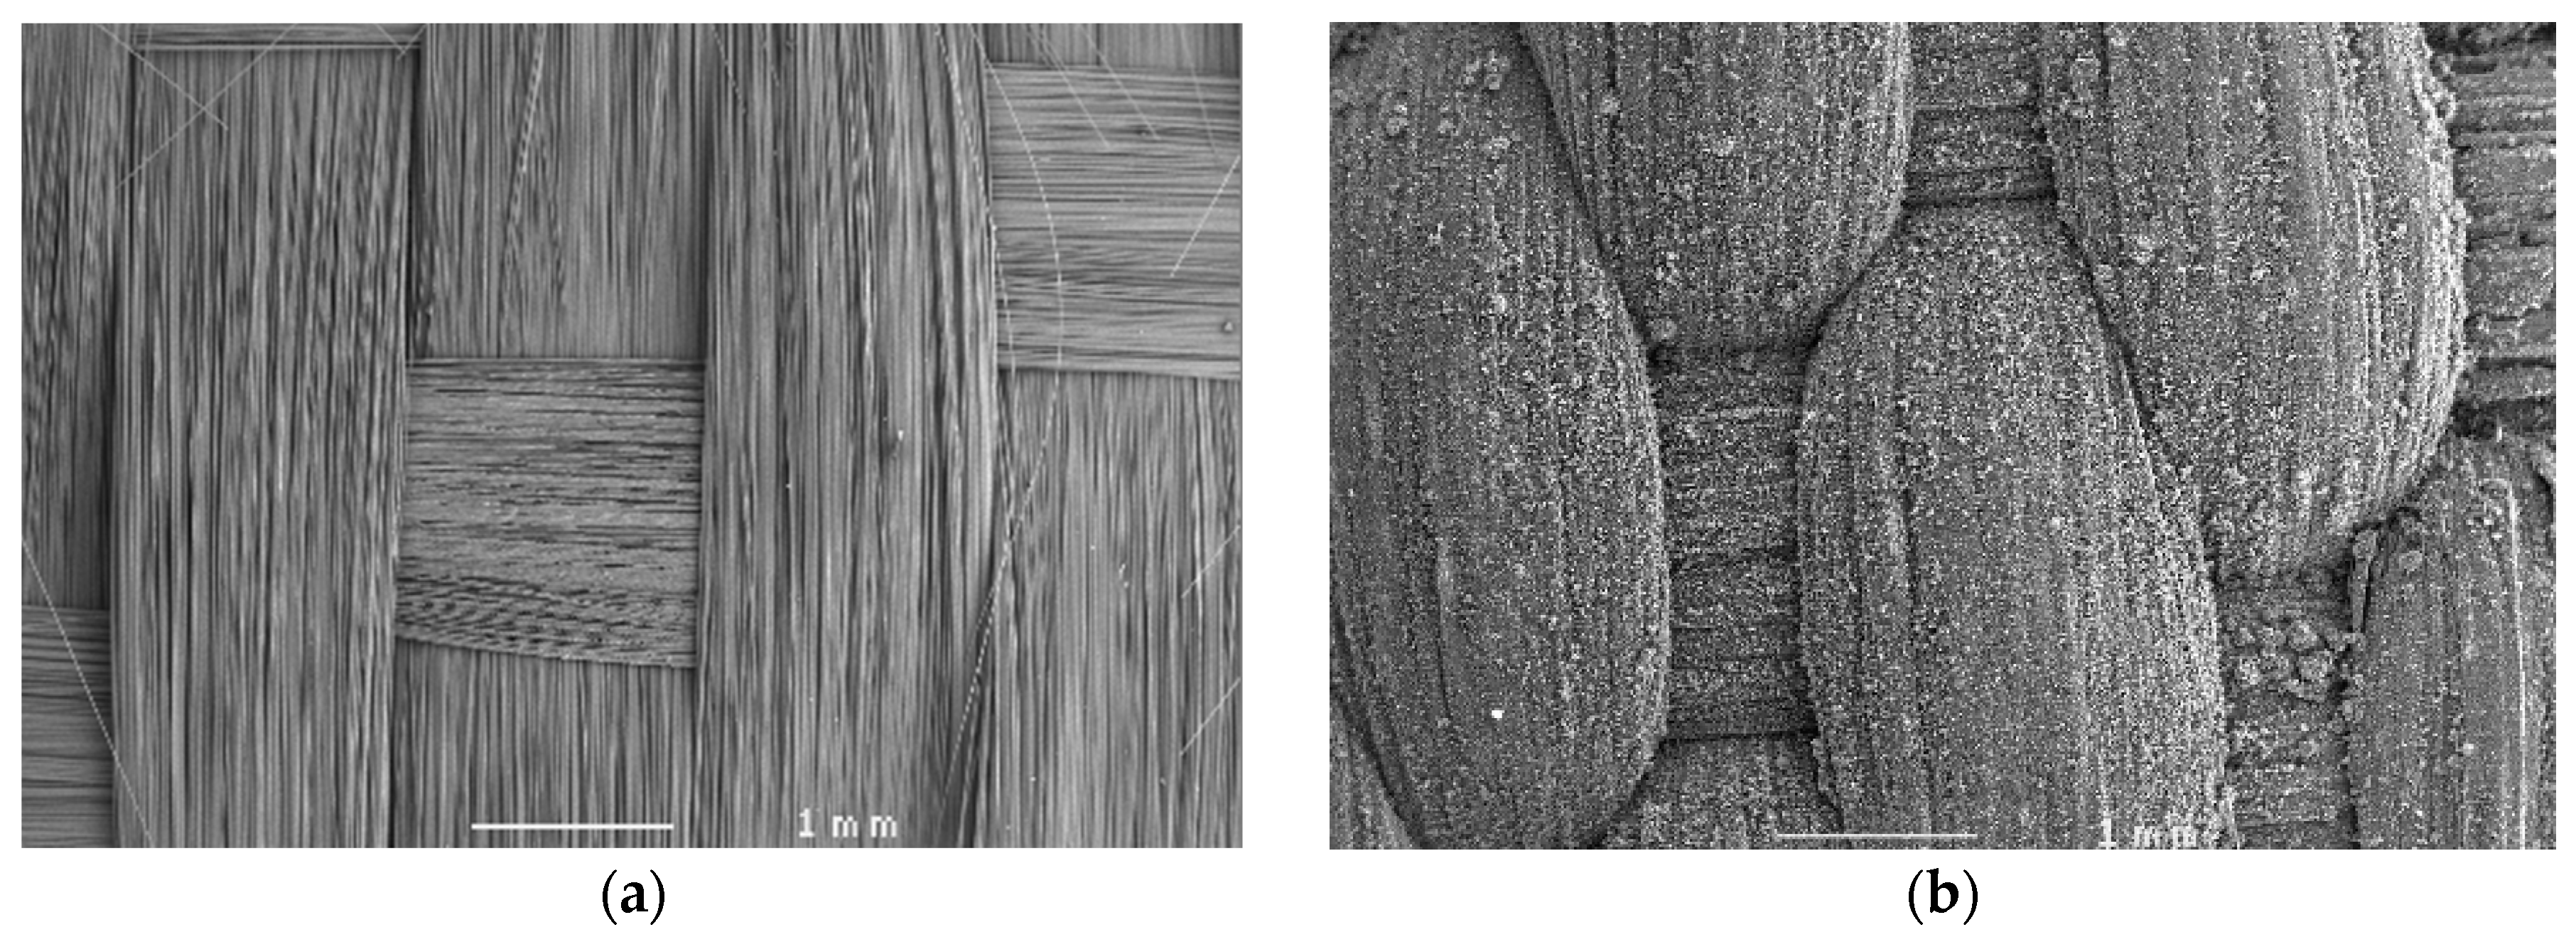
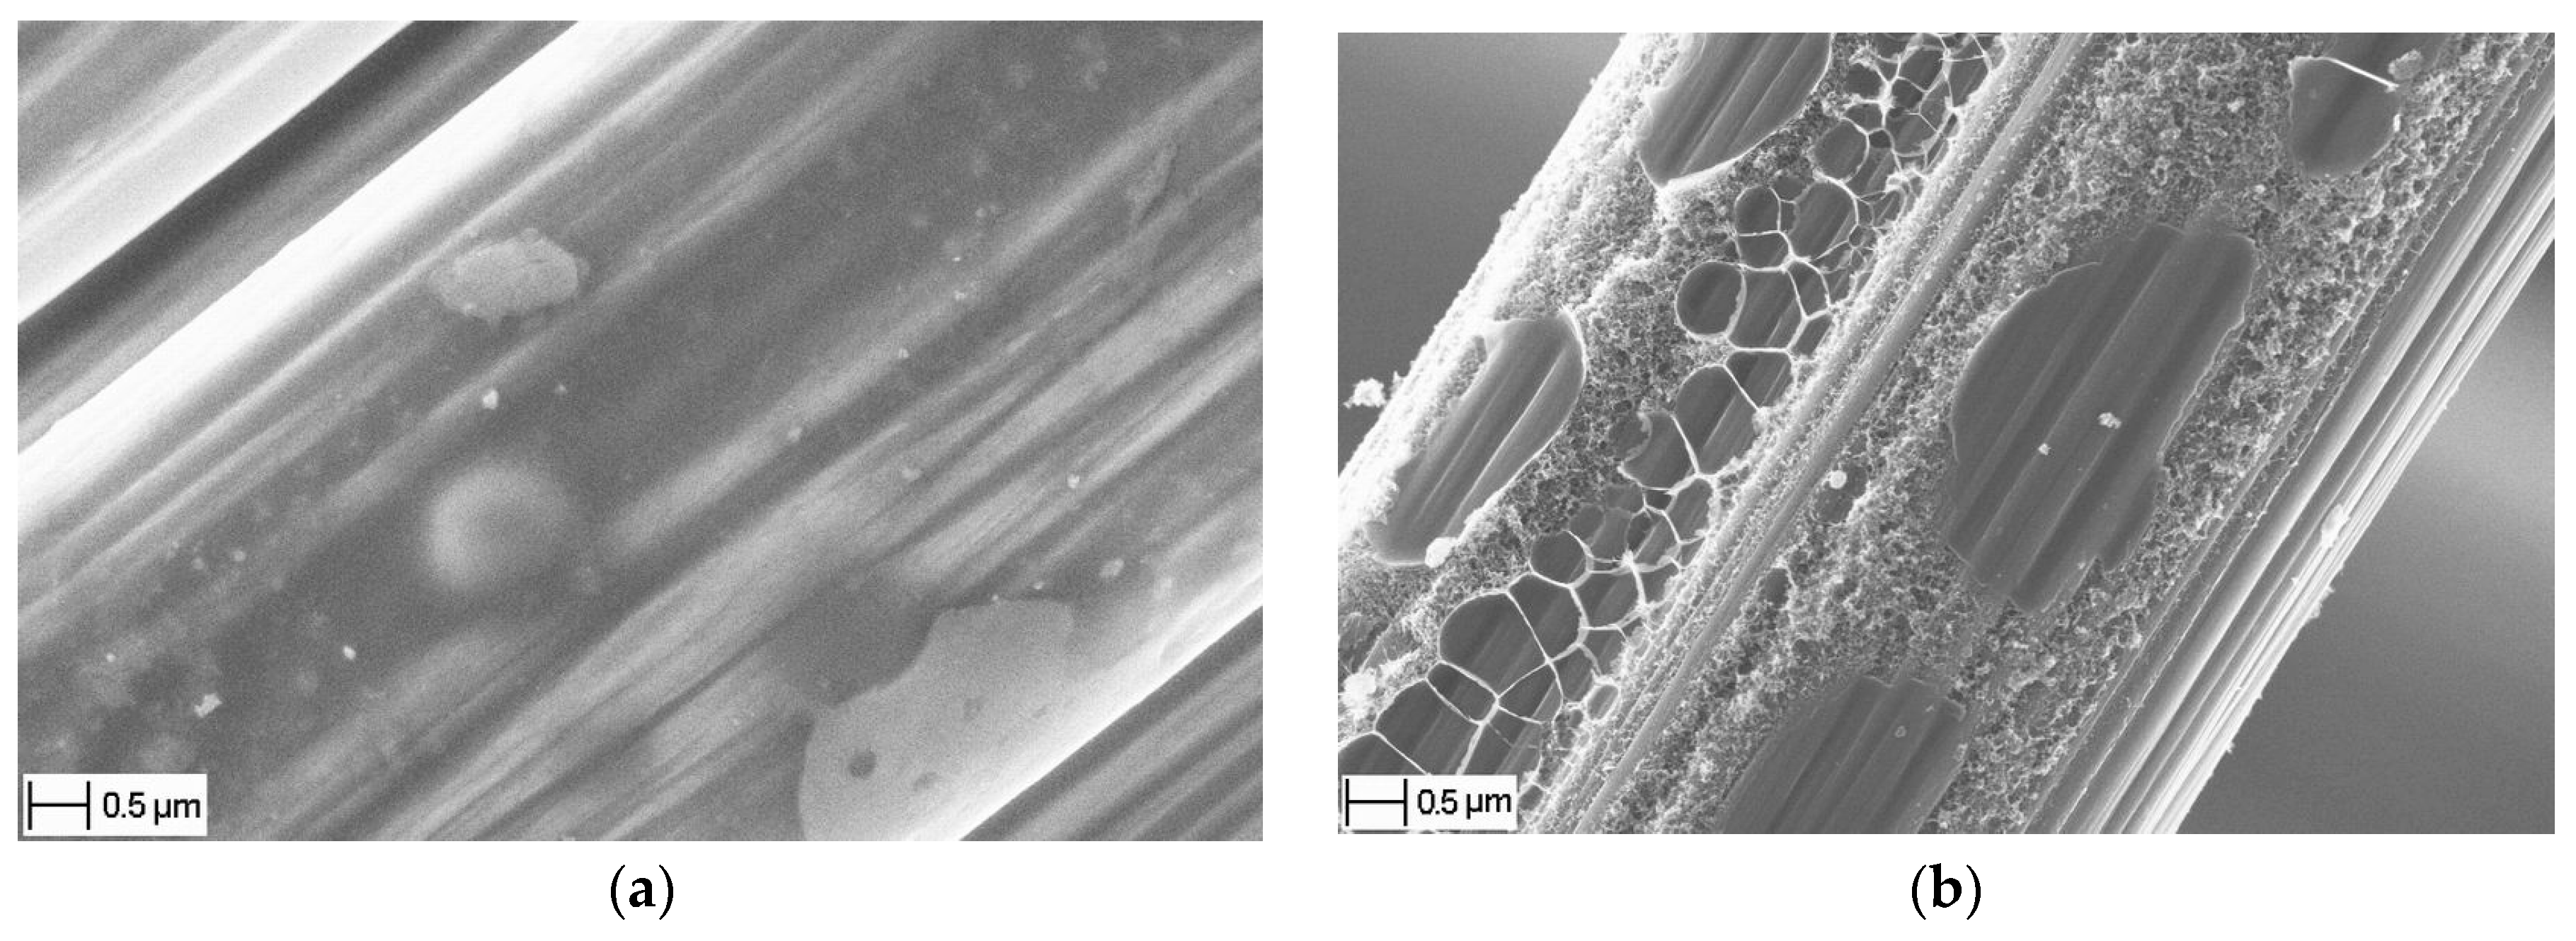
- “Sized” fabric (TenCate CD 0286 050 000 0000) having the original Torayca standard sizing by about 1% of the fabric weight [13]. This fabric is suitable for impregnation with an epoxy matrix. The sizing has many functions; for the carbon fibers the main one is to prevent their damage during winding, prepregging, or weaving operations [14]. In the present case the exact chemical composition of the sizing is unknown but it is based on an uncured epoxy. Its typical appearance is shown in Figure 1a, where it bonds together many fibers.
- (2)
- “Base” fabric (TenCate CD 0286 050 000 8212) which is the “sized” fabric partially de-sized for a better compatibility with a PPS matrix. Essentially, there are two methods: (a) heating at 330–430 °C for 2–4 h or (b) heating at 380–520 °C for 15 ± 5 min and then at 190–250 °C for 3–5 h. It is important that “... the carbon fibers remain unaffected and the epoxy material is aged or neutralized and loses its tacky character” [15]. This means that the sizing is just “neutralized” but not removed completely. This fabric is used as the substrate material for CNF growth for most of the tests presented in this paper.
- (3)
- “Desized” fabric prepared by heating the “base” one up to 400 °C or 600 °C in N2 atmosphere for about 30 min. It is used solely to reveal the effect of the high temperature, without any CNF growth. Weighing of the samples before and after this treatment shows a 0.5% weight loss. As seen in Figure 1b, the sizing is indeed not removed completely but rather carbonized forming a sort of sintered incrustation.
2.2. Chemical Vapor Deposition
2.3. Test Eqiupment
3. Results
3.1. Meso- and Micro-Level Uniformity of the Growth
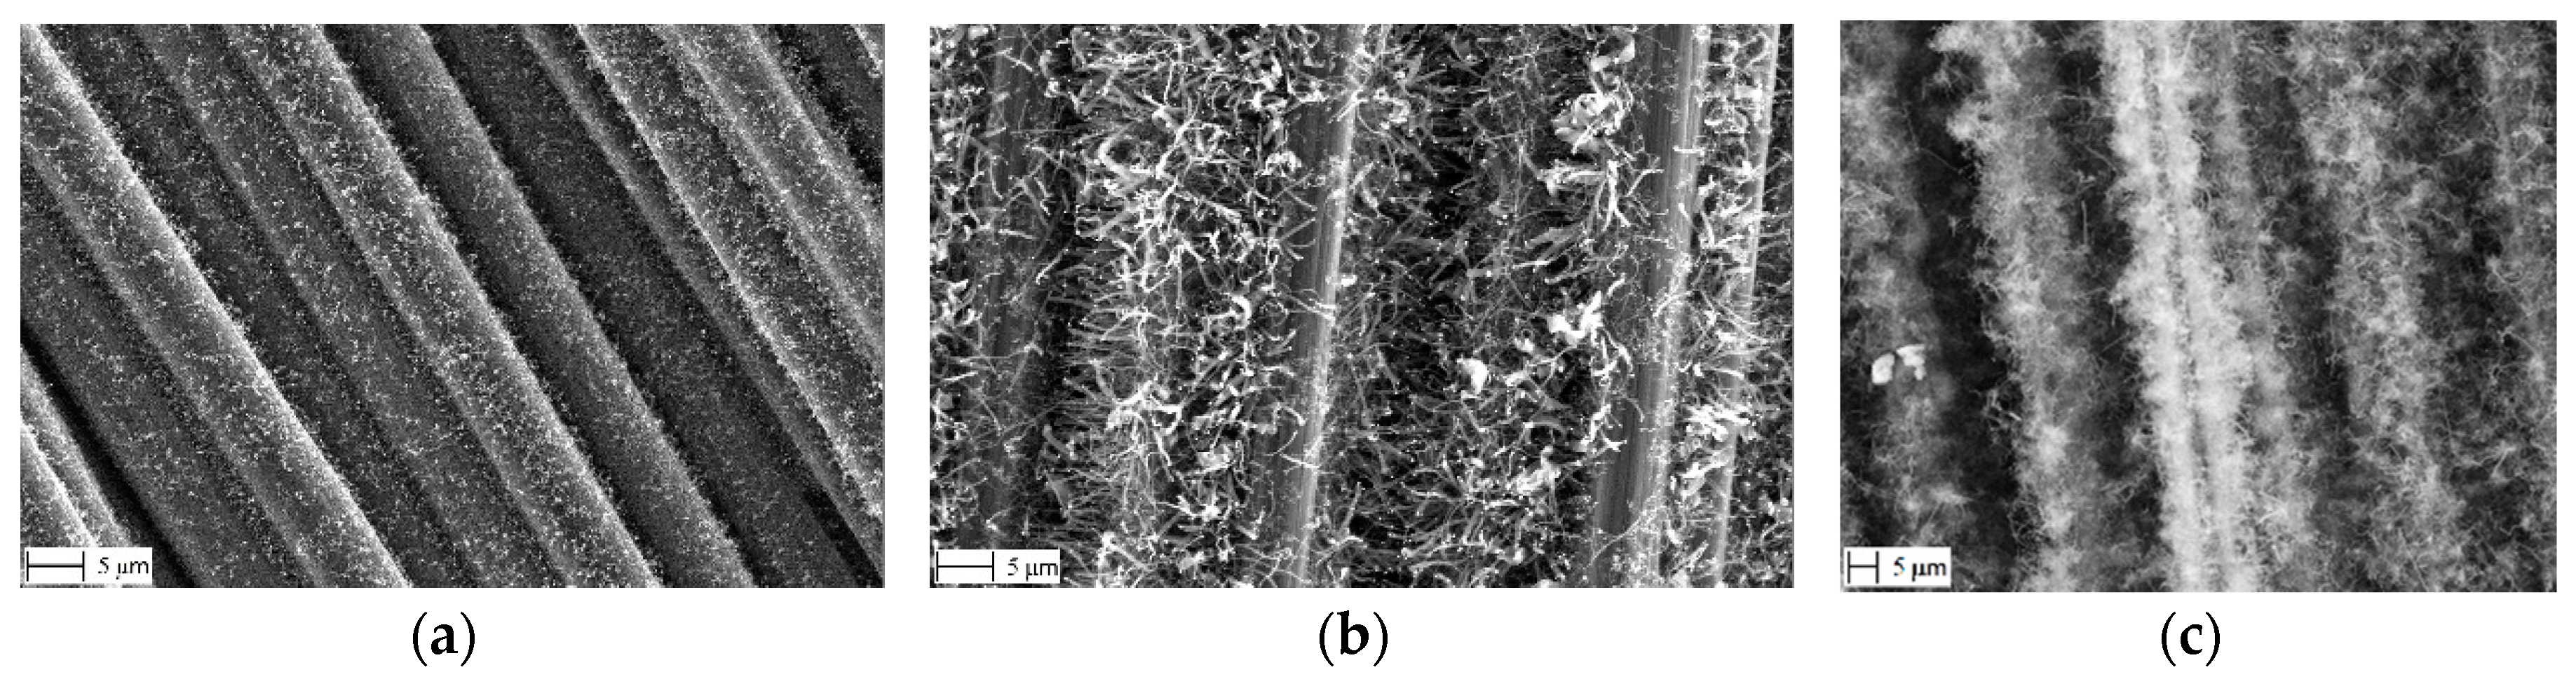
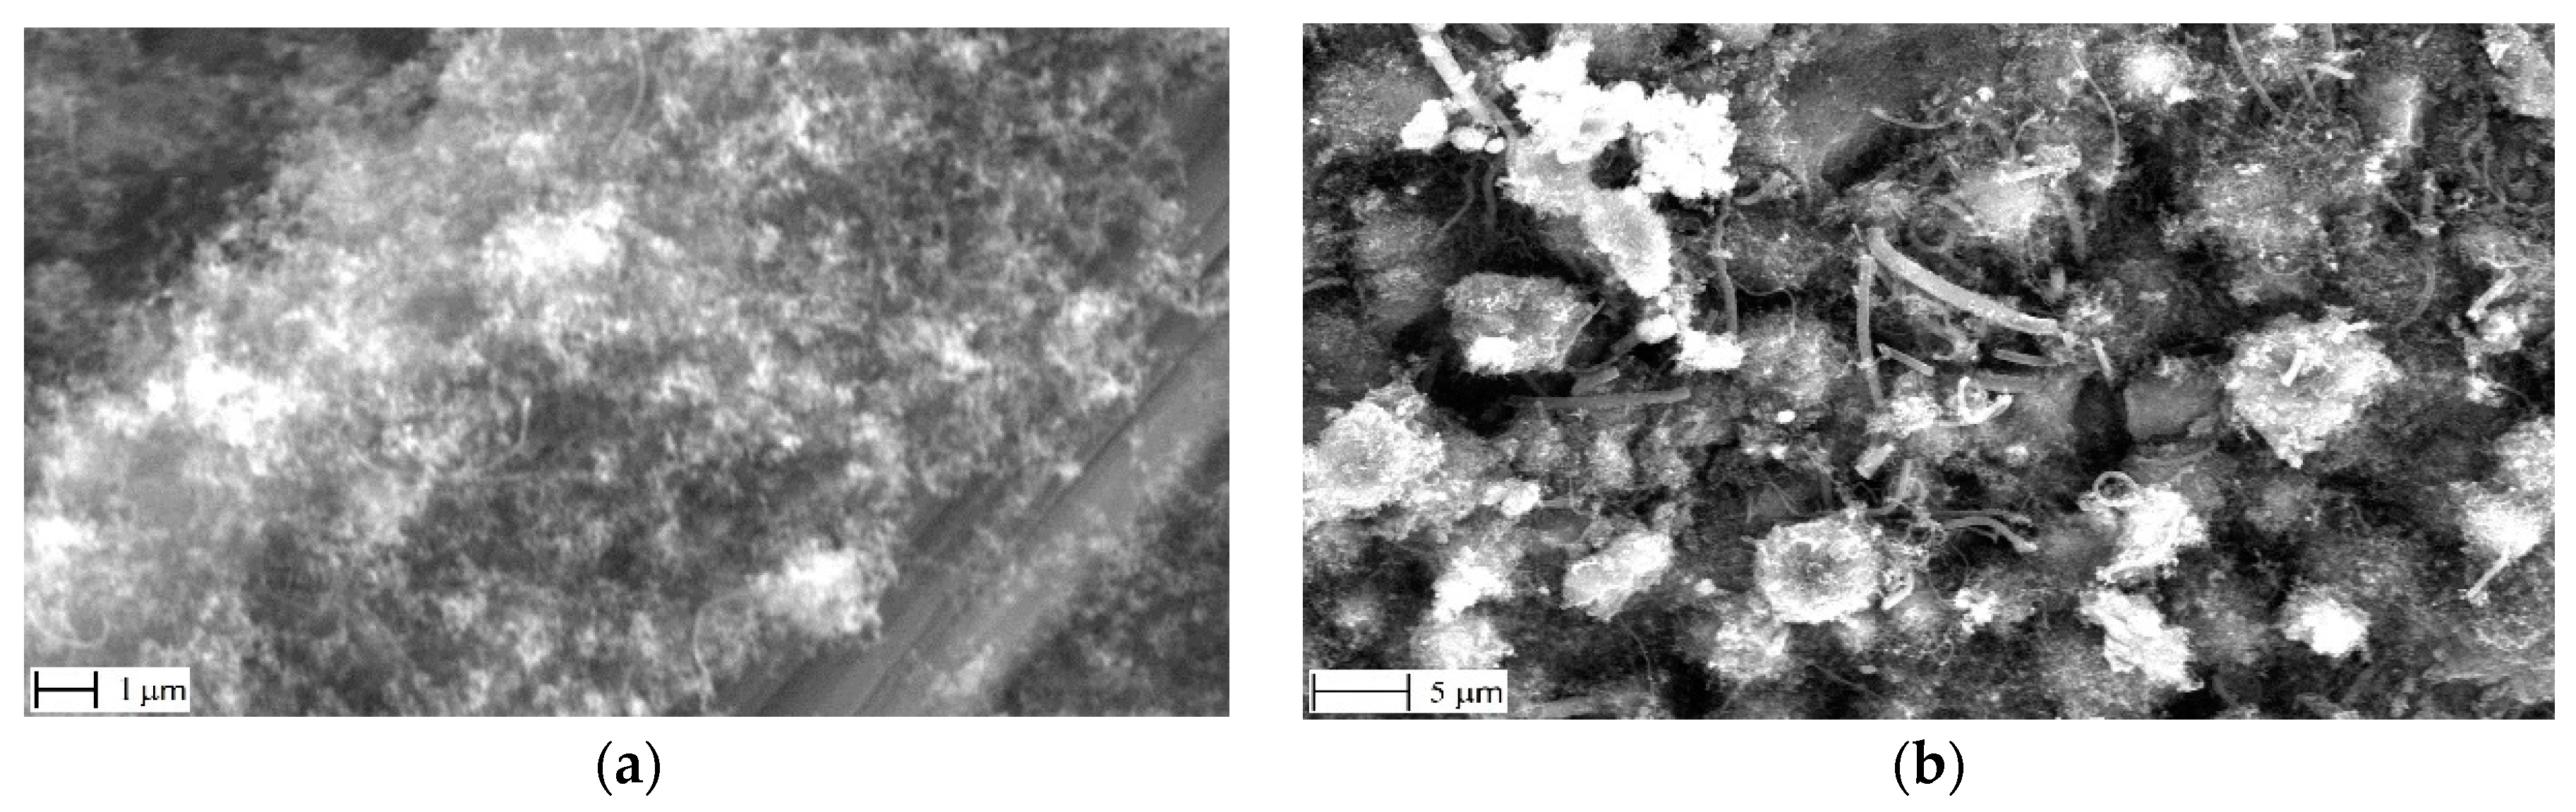
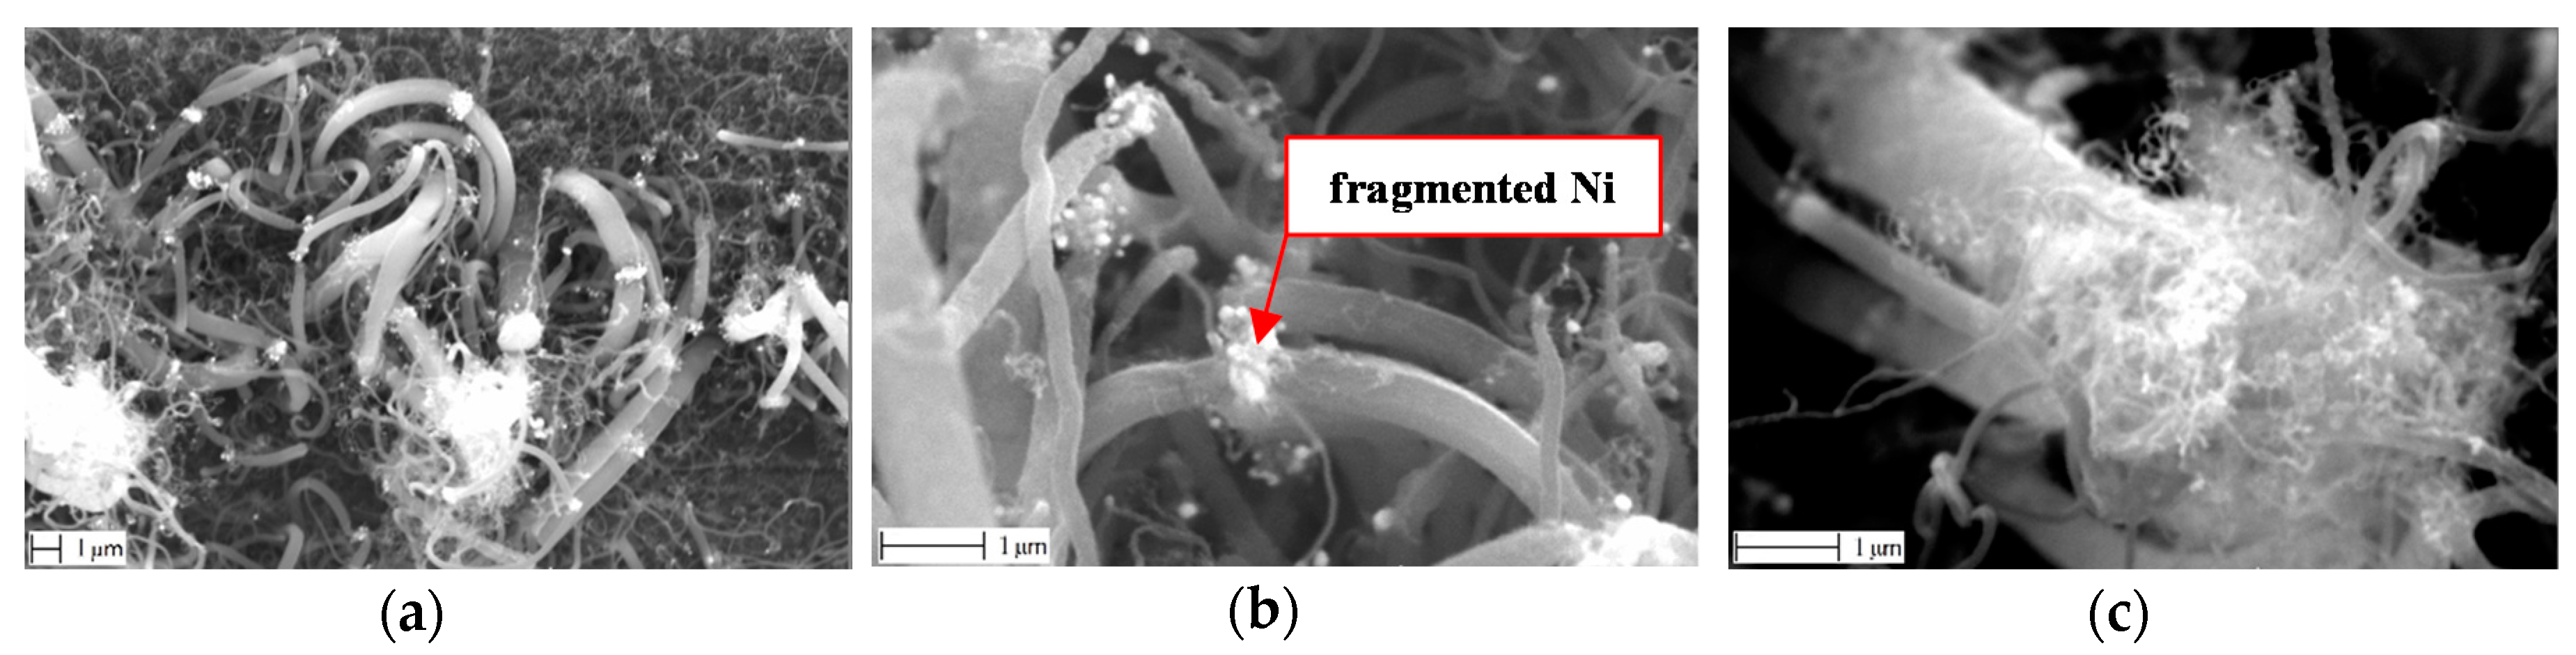
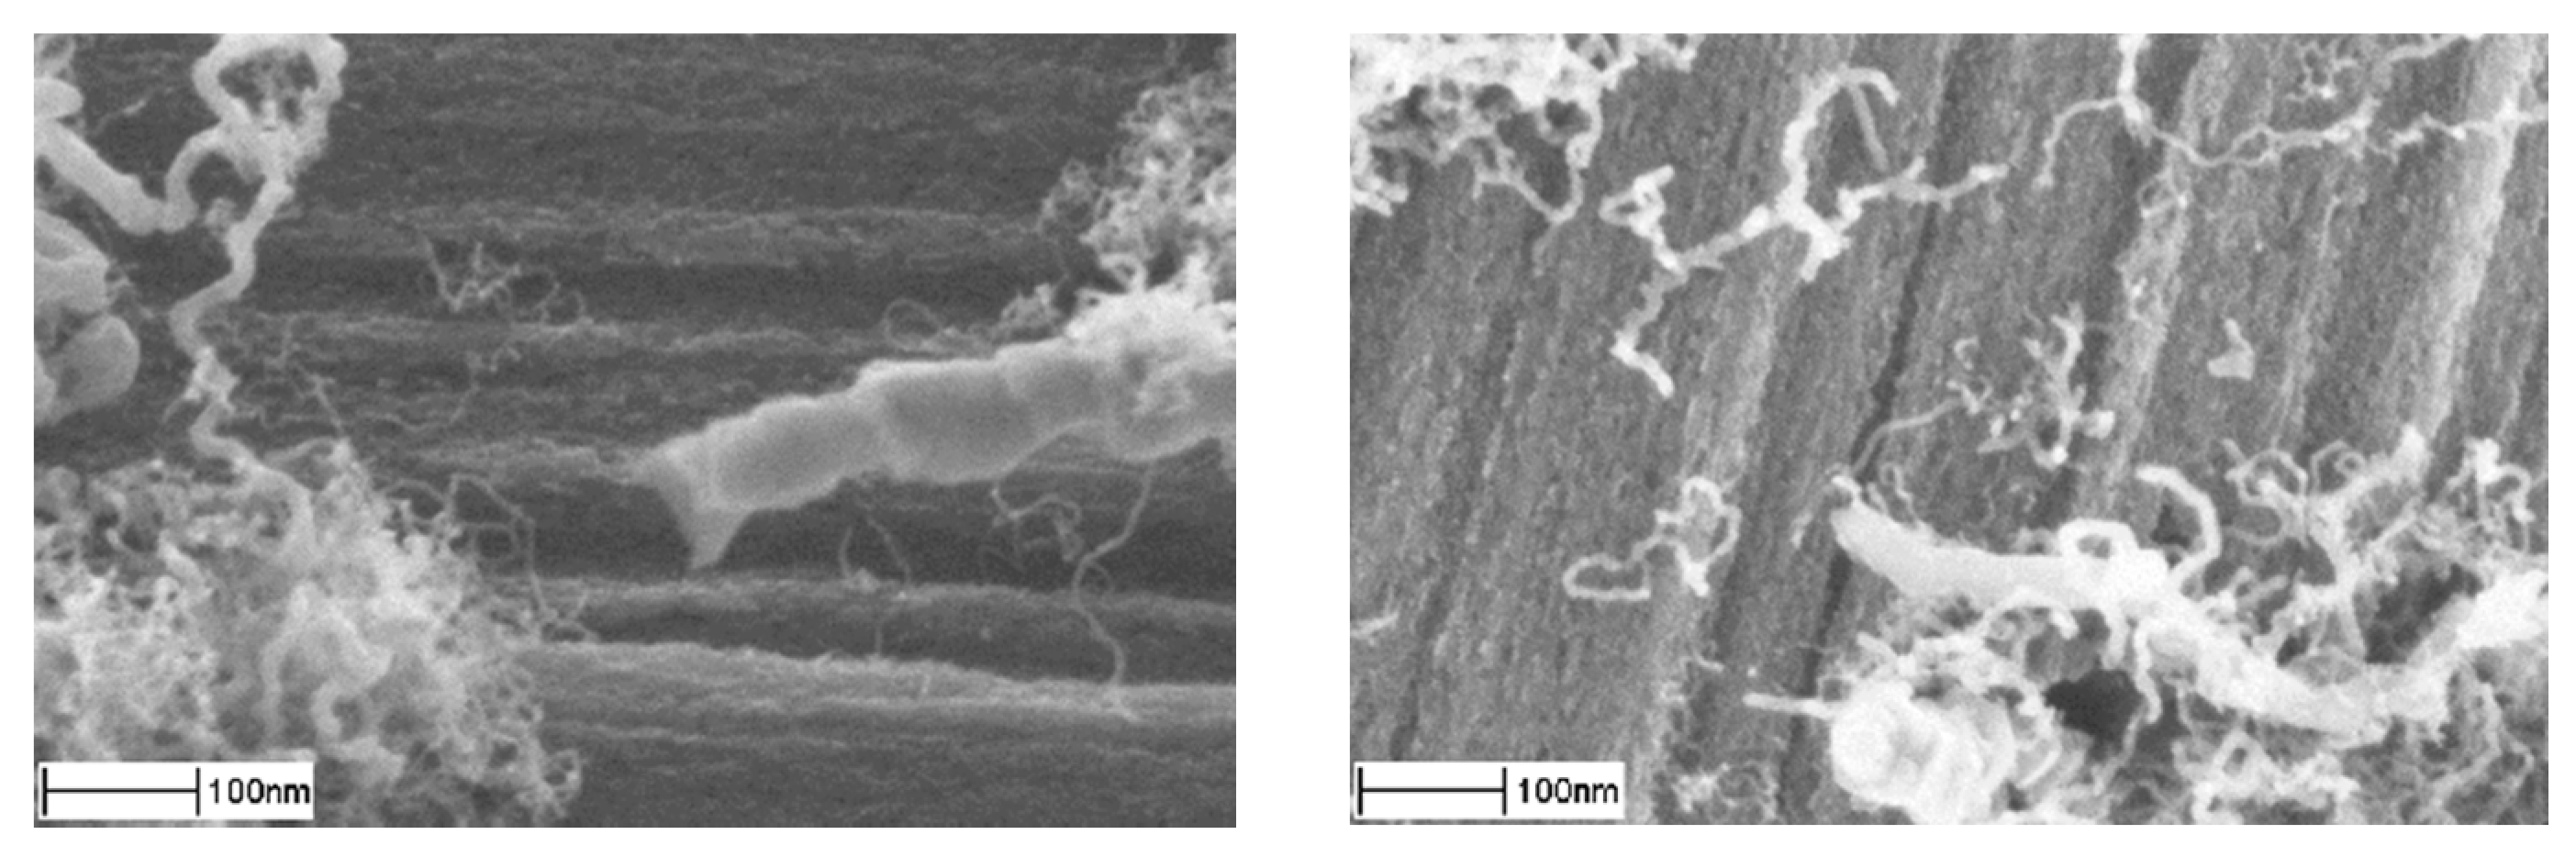
3.2. Nano-Scale Morphology of the Growth
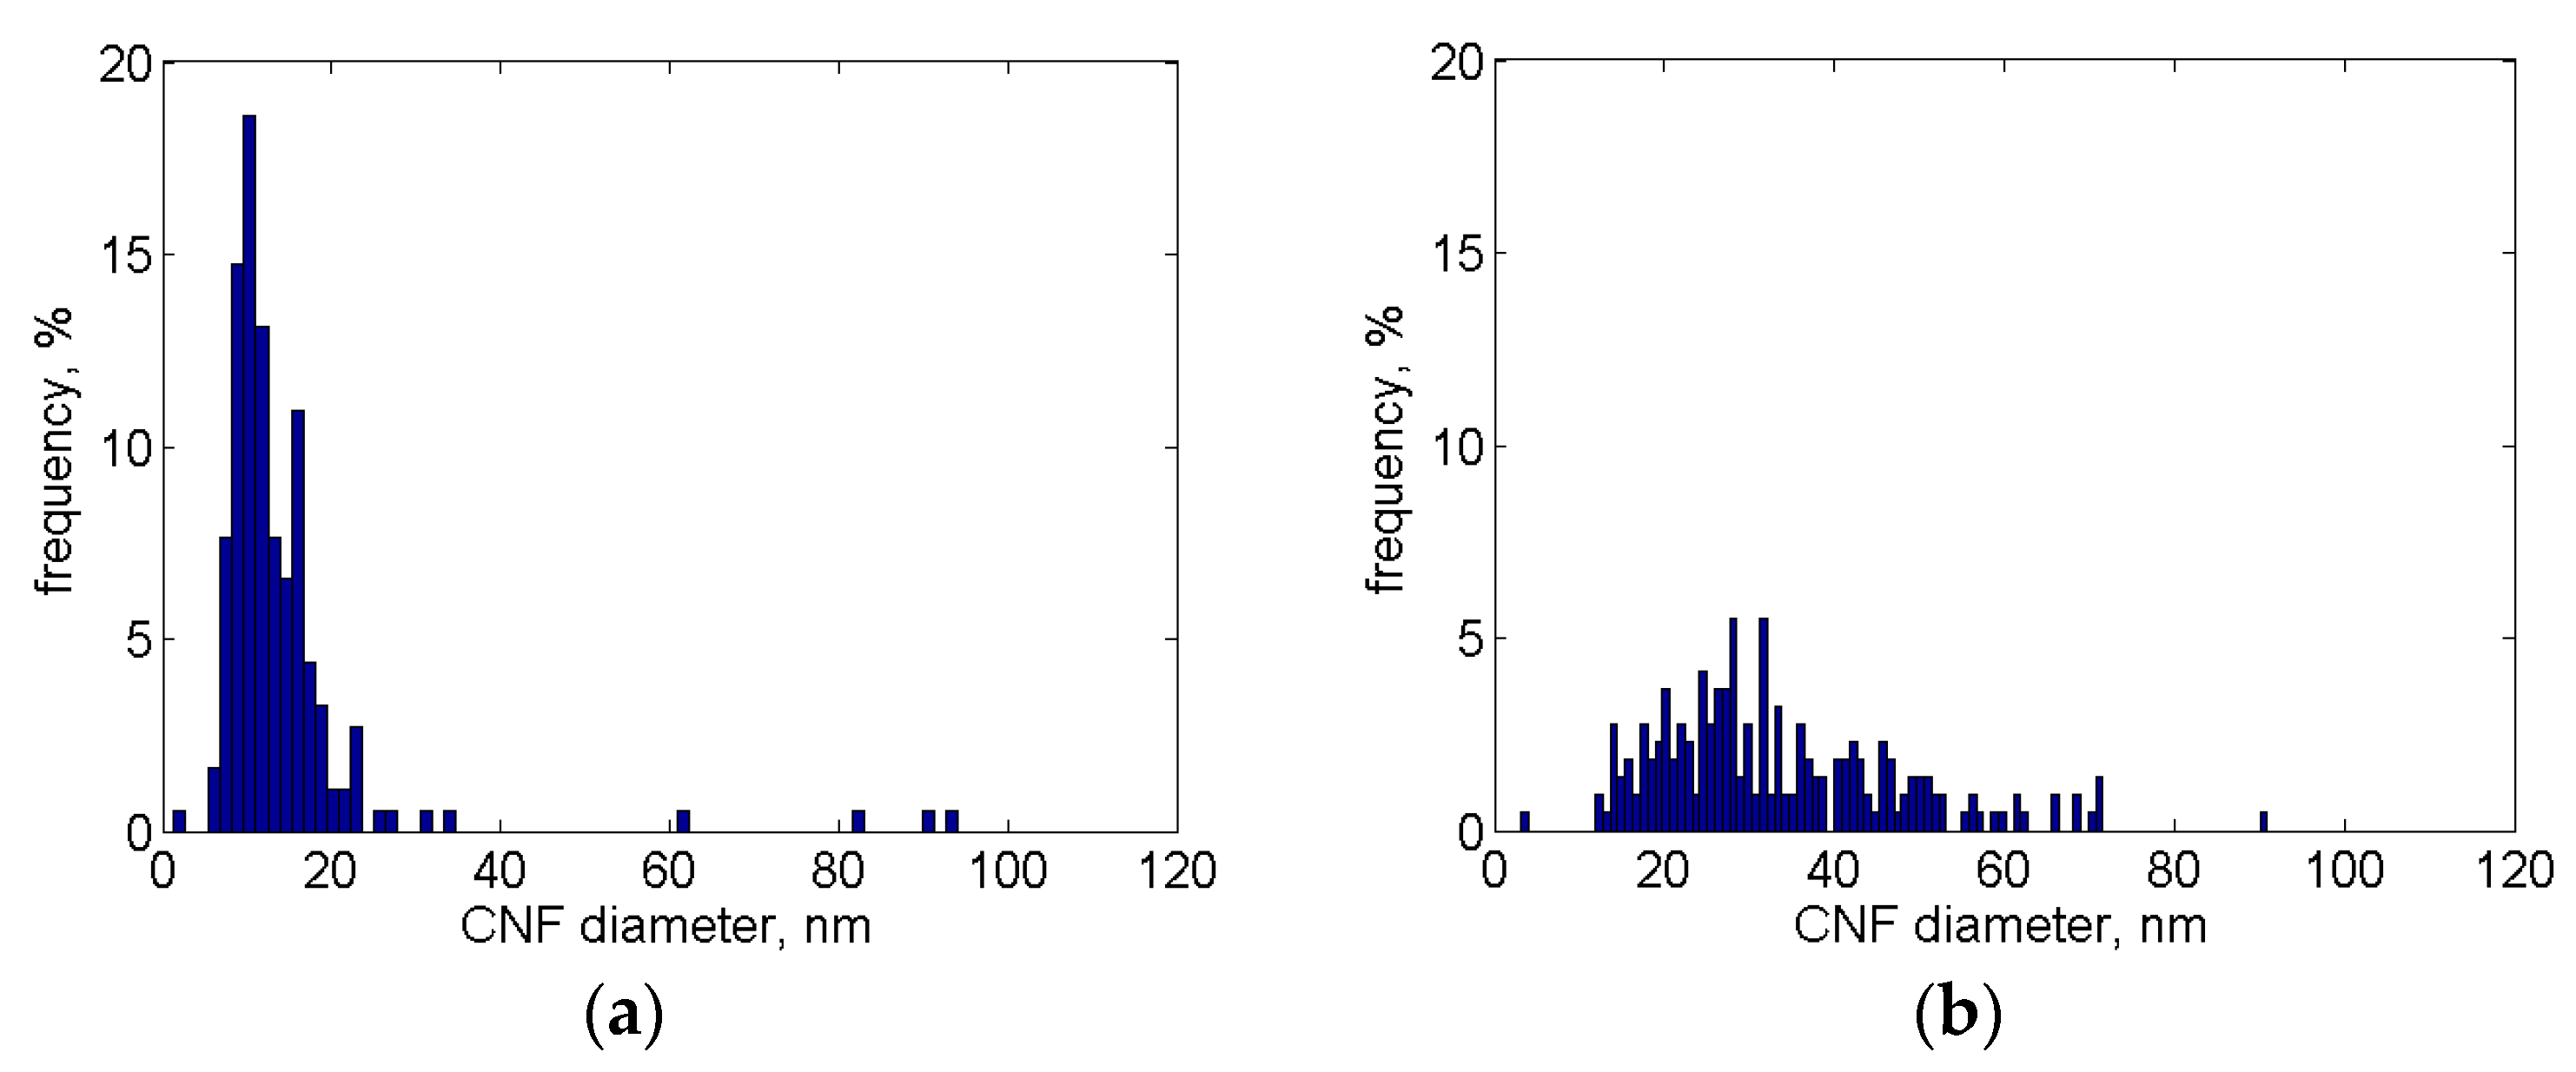
3.3. Ni Particles Sizes and CNF Diameters
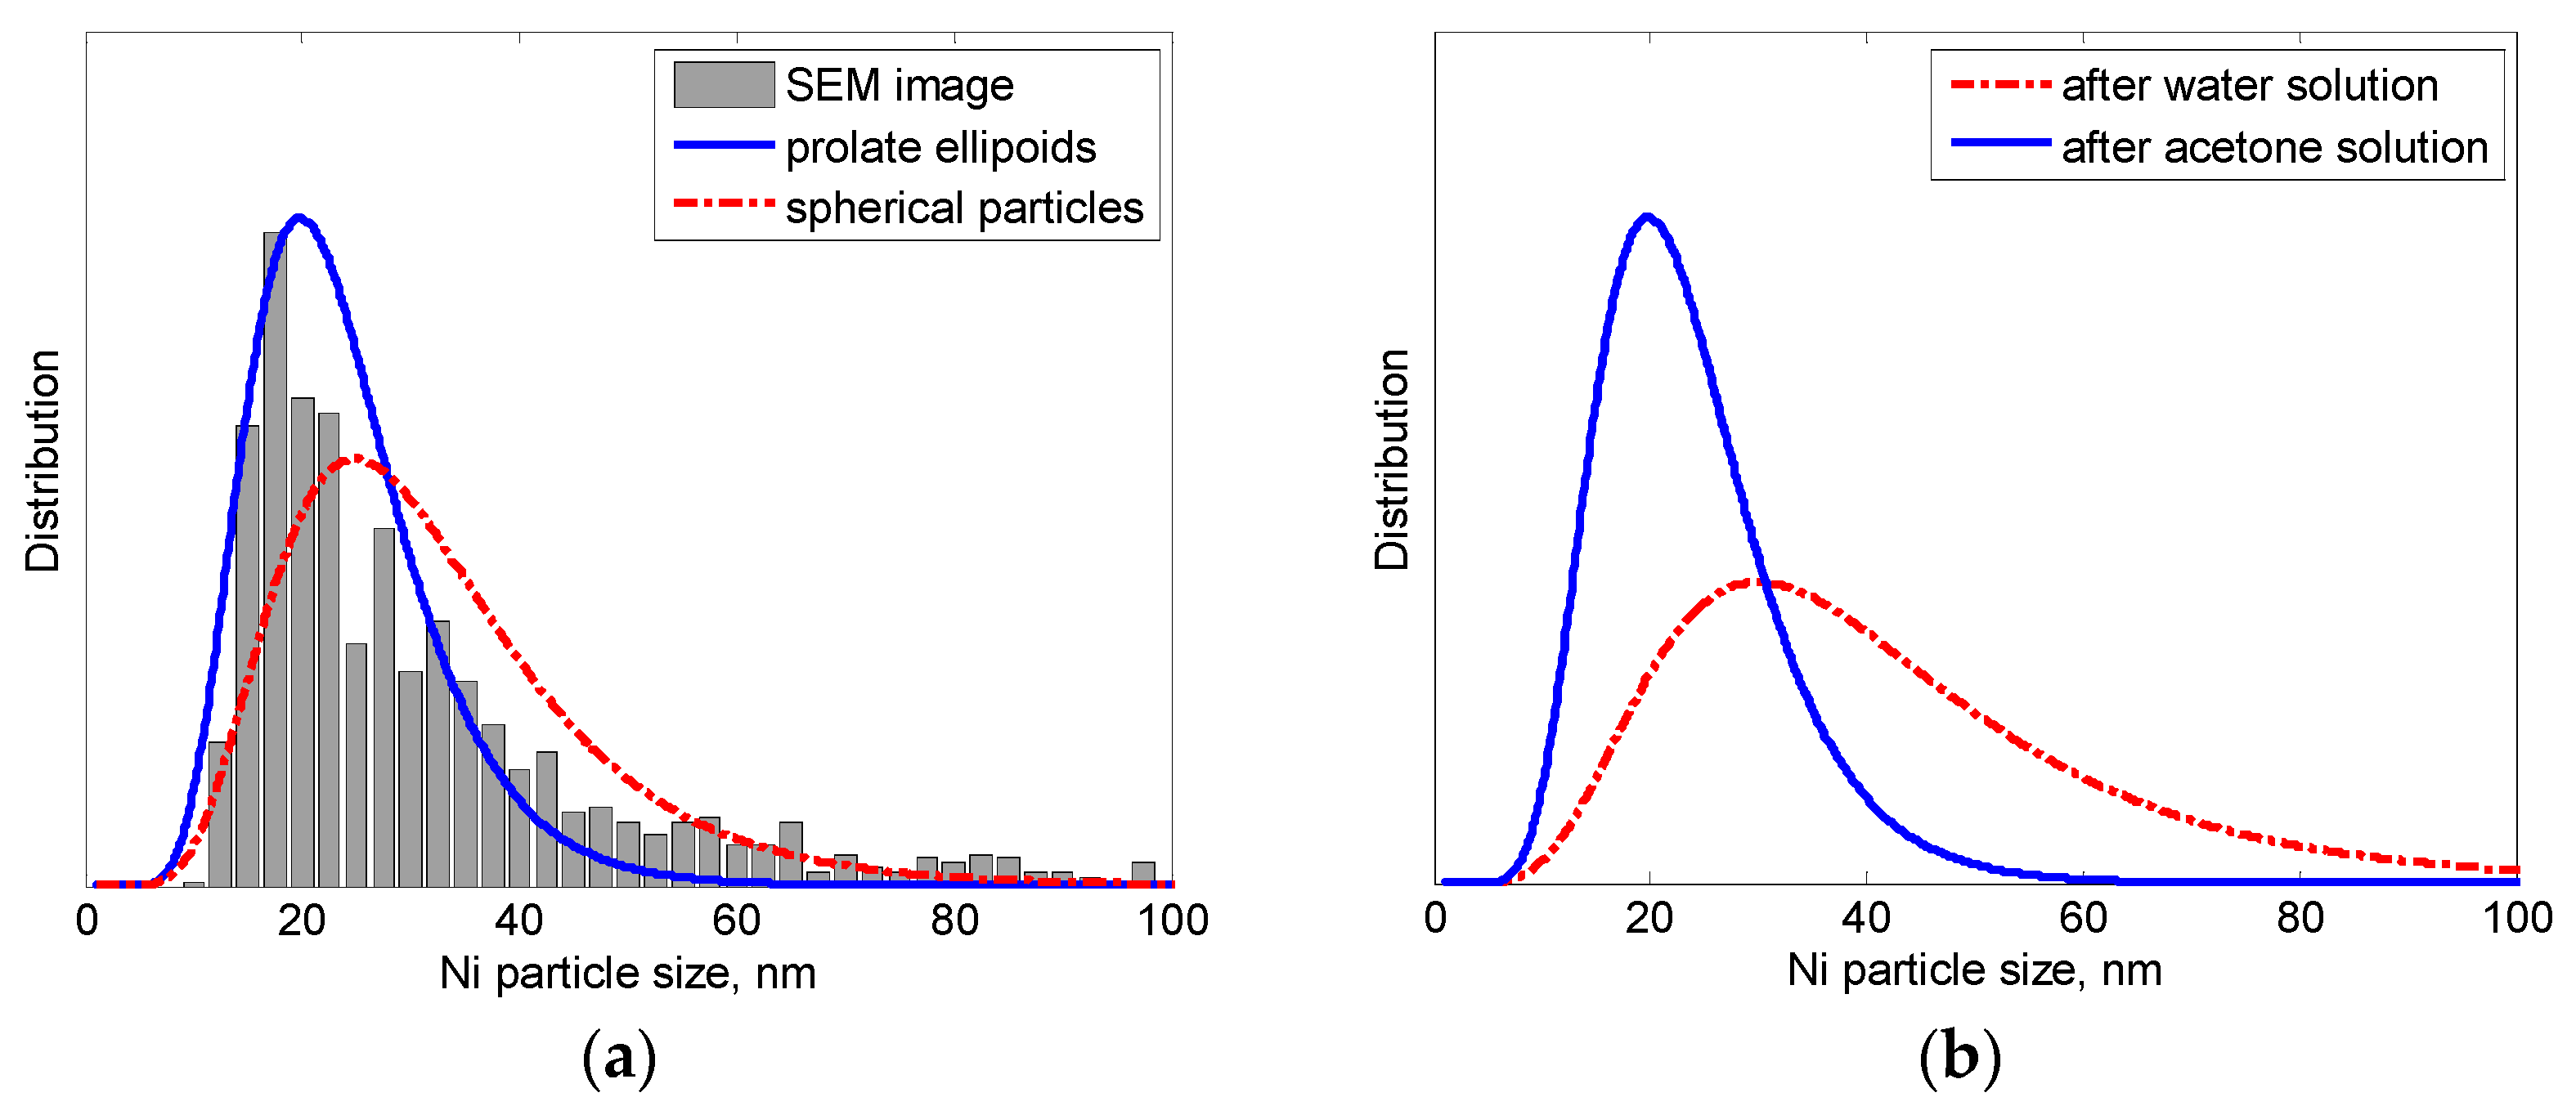
3.3.1. SEM Analysis
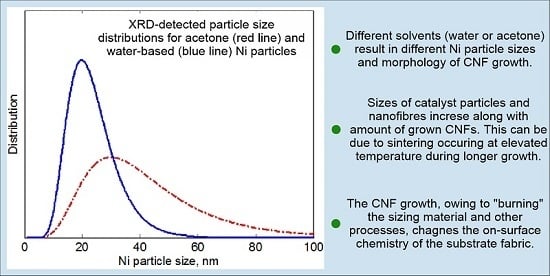
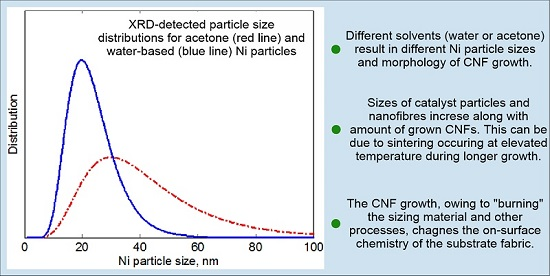
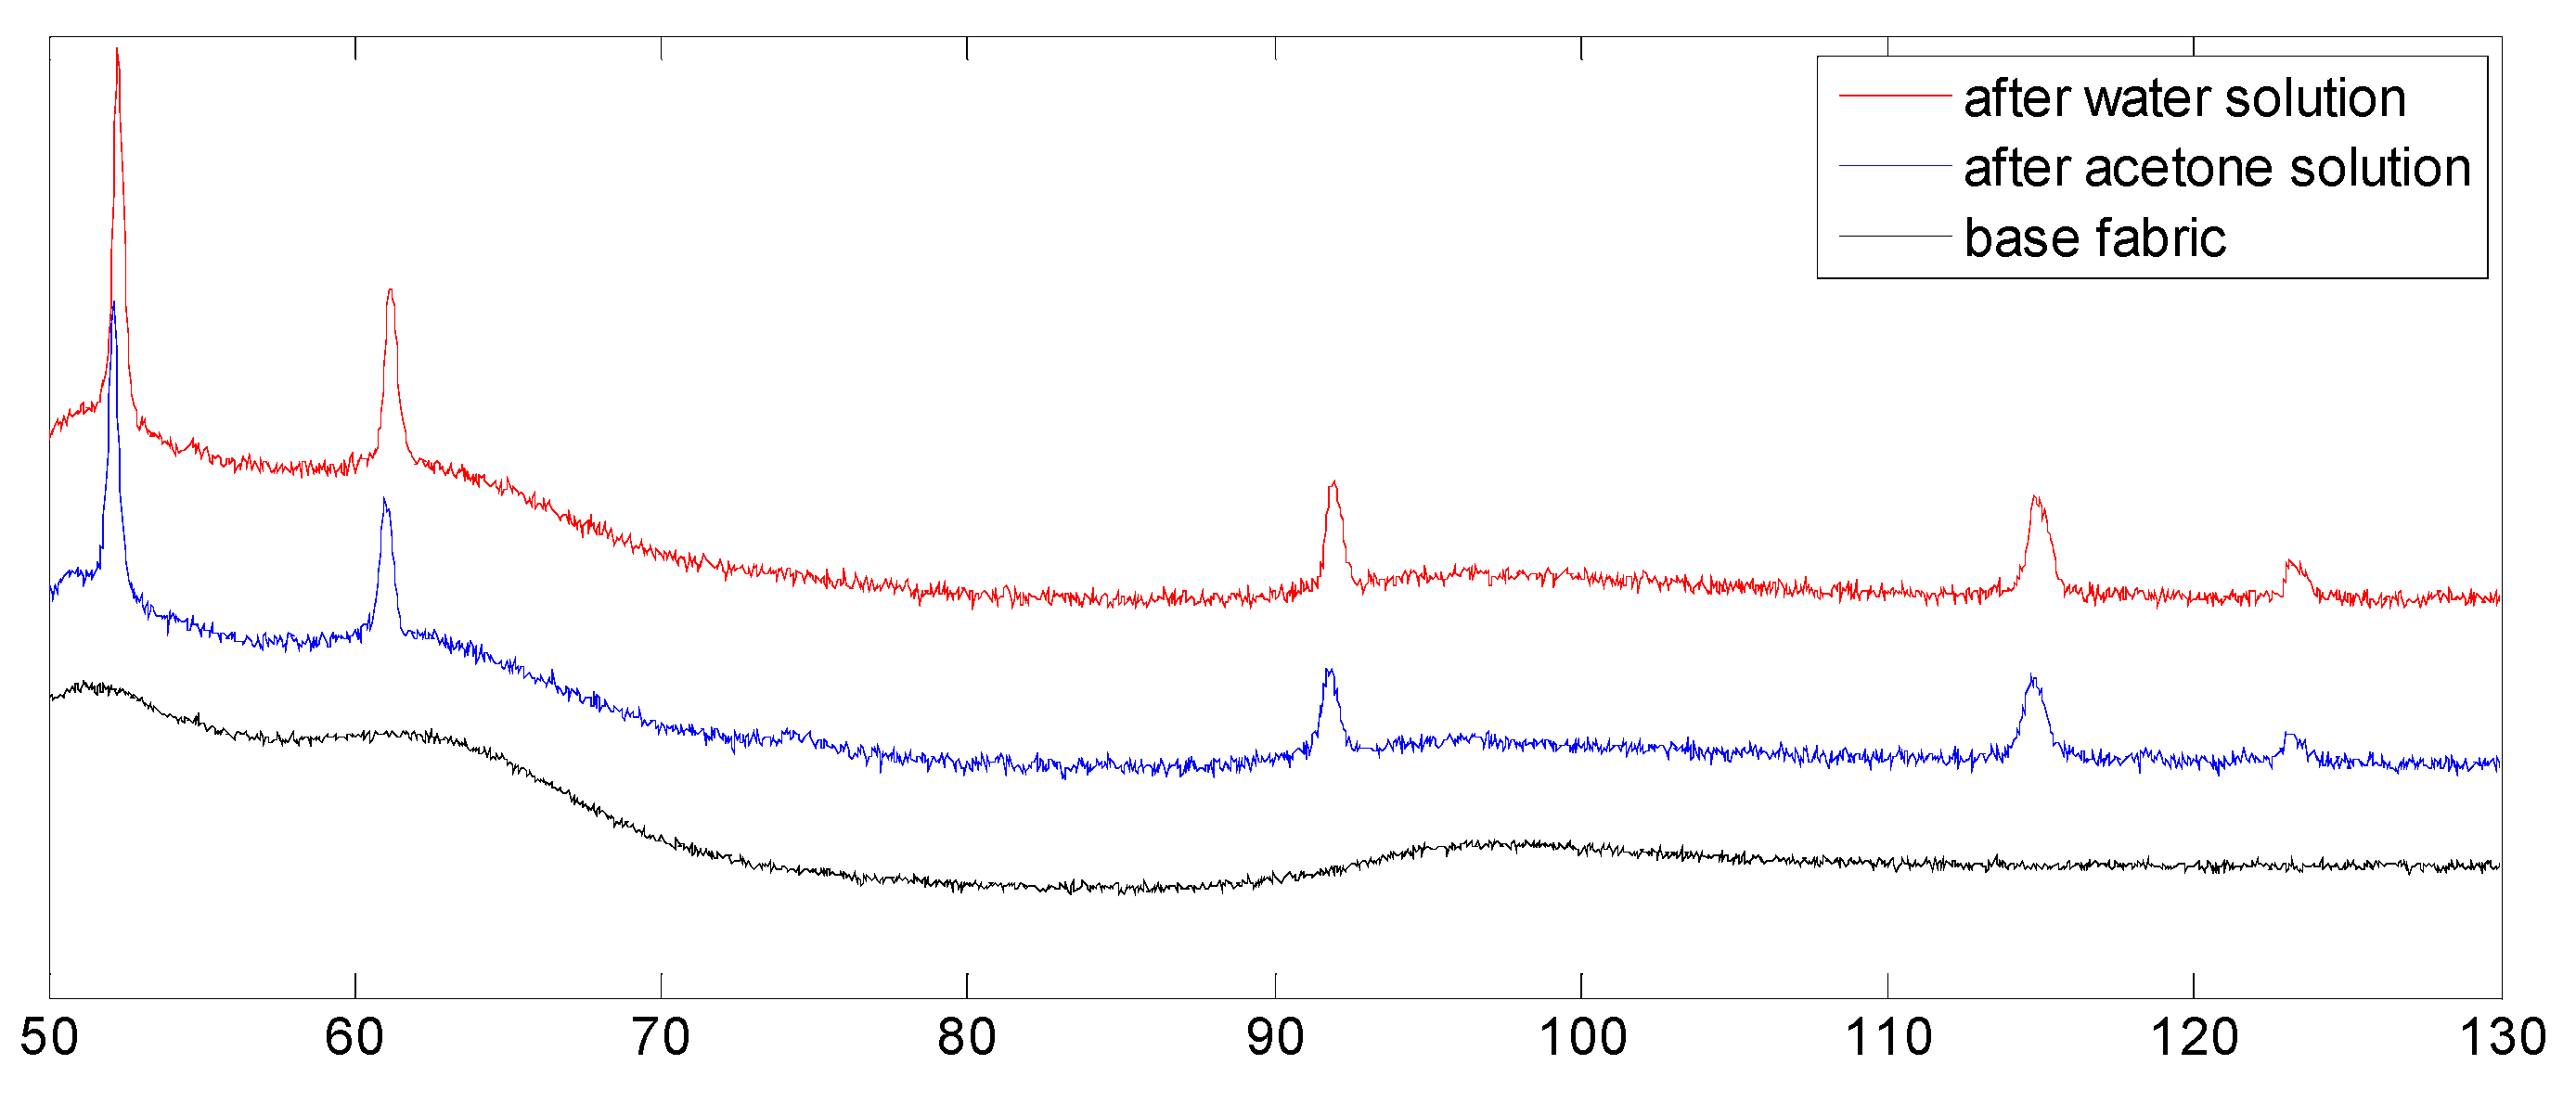
3.3.2. XRD Analysis
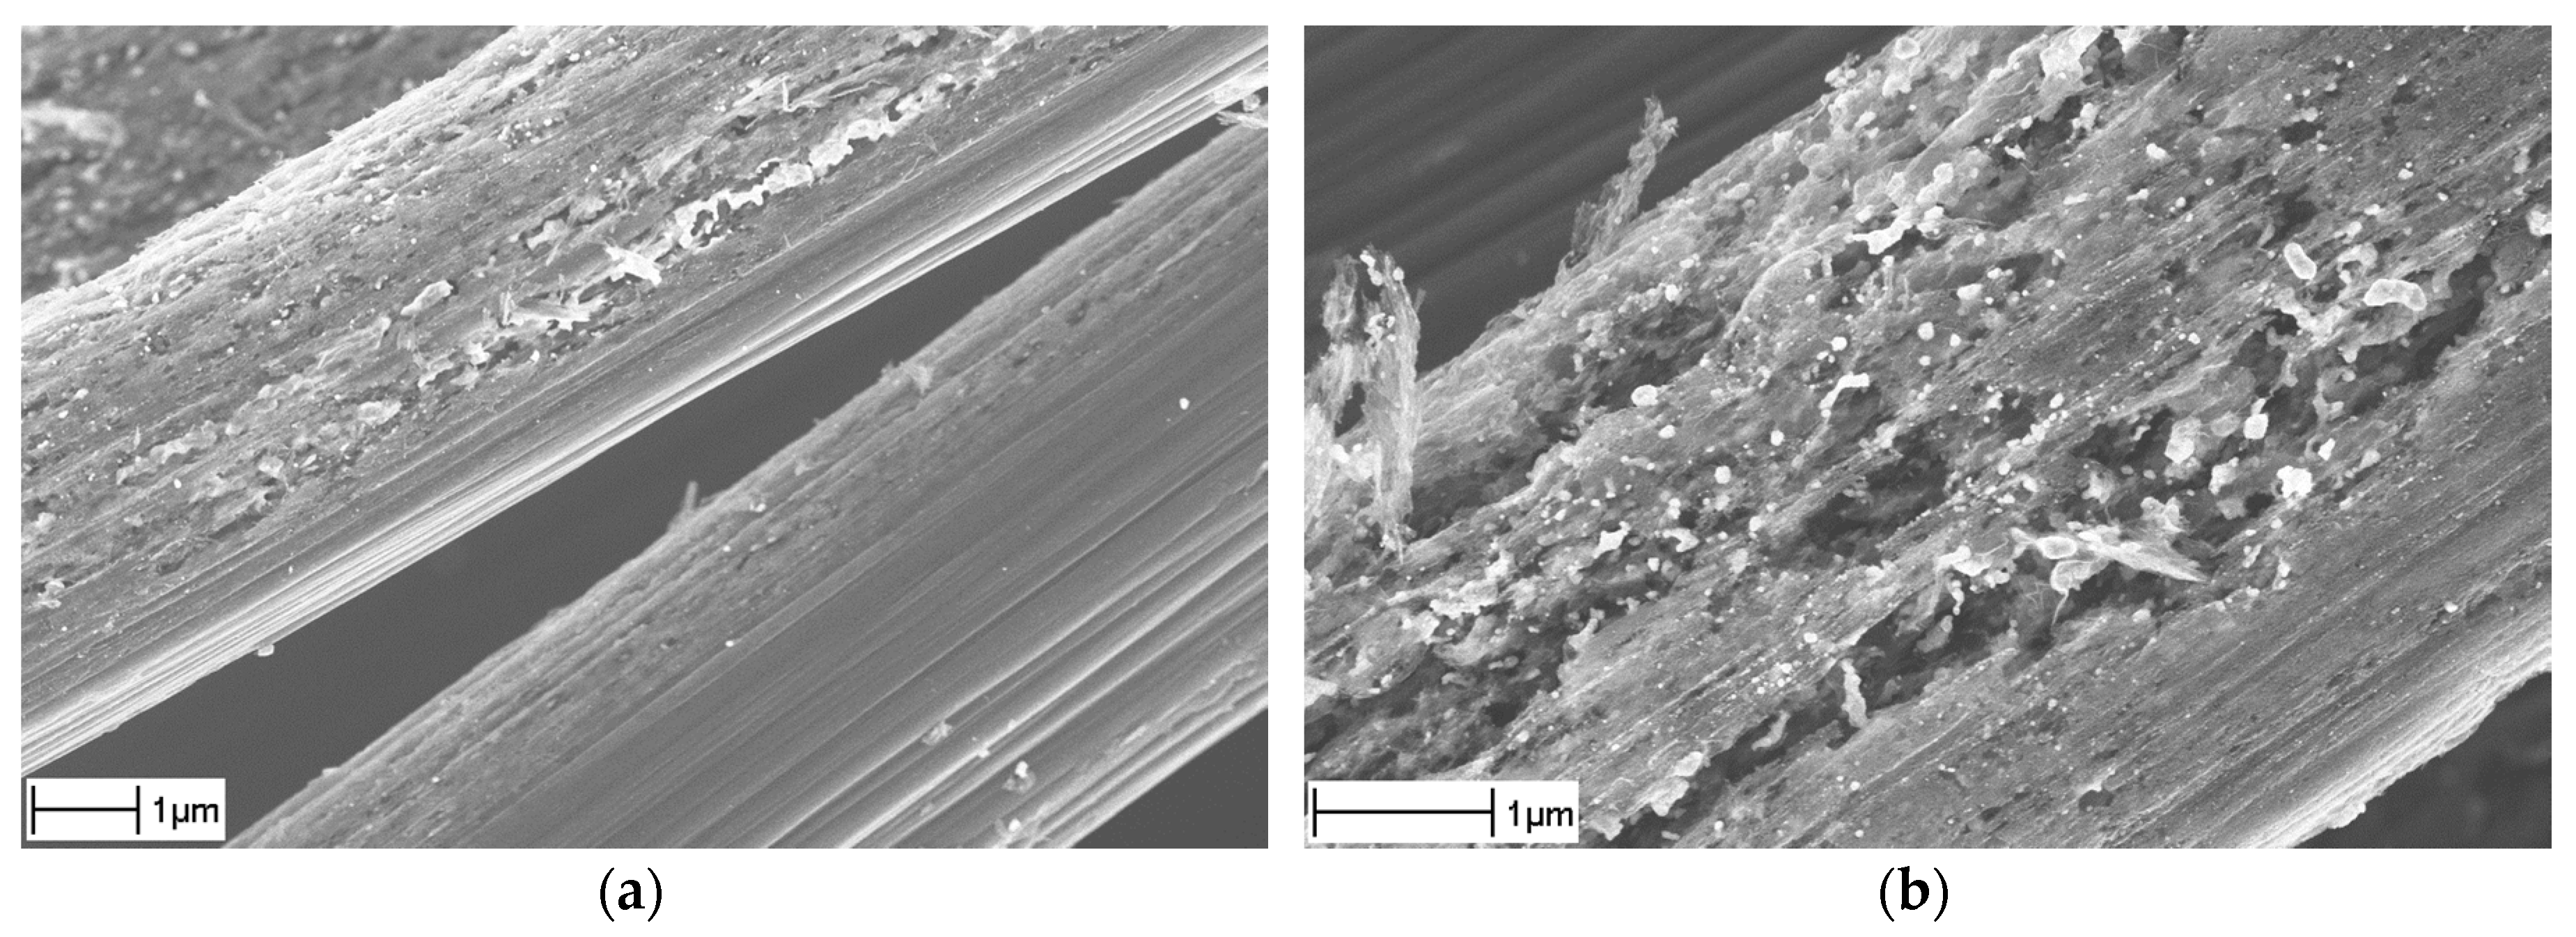
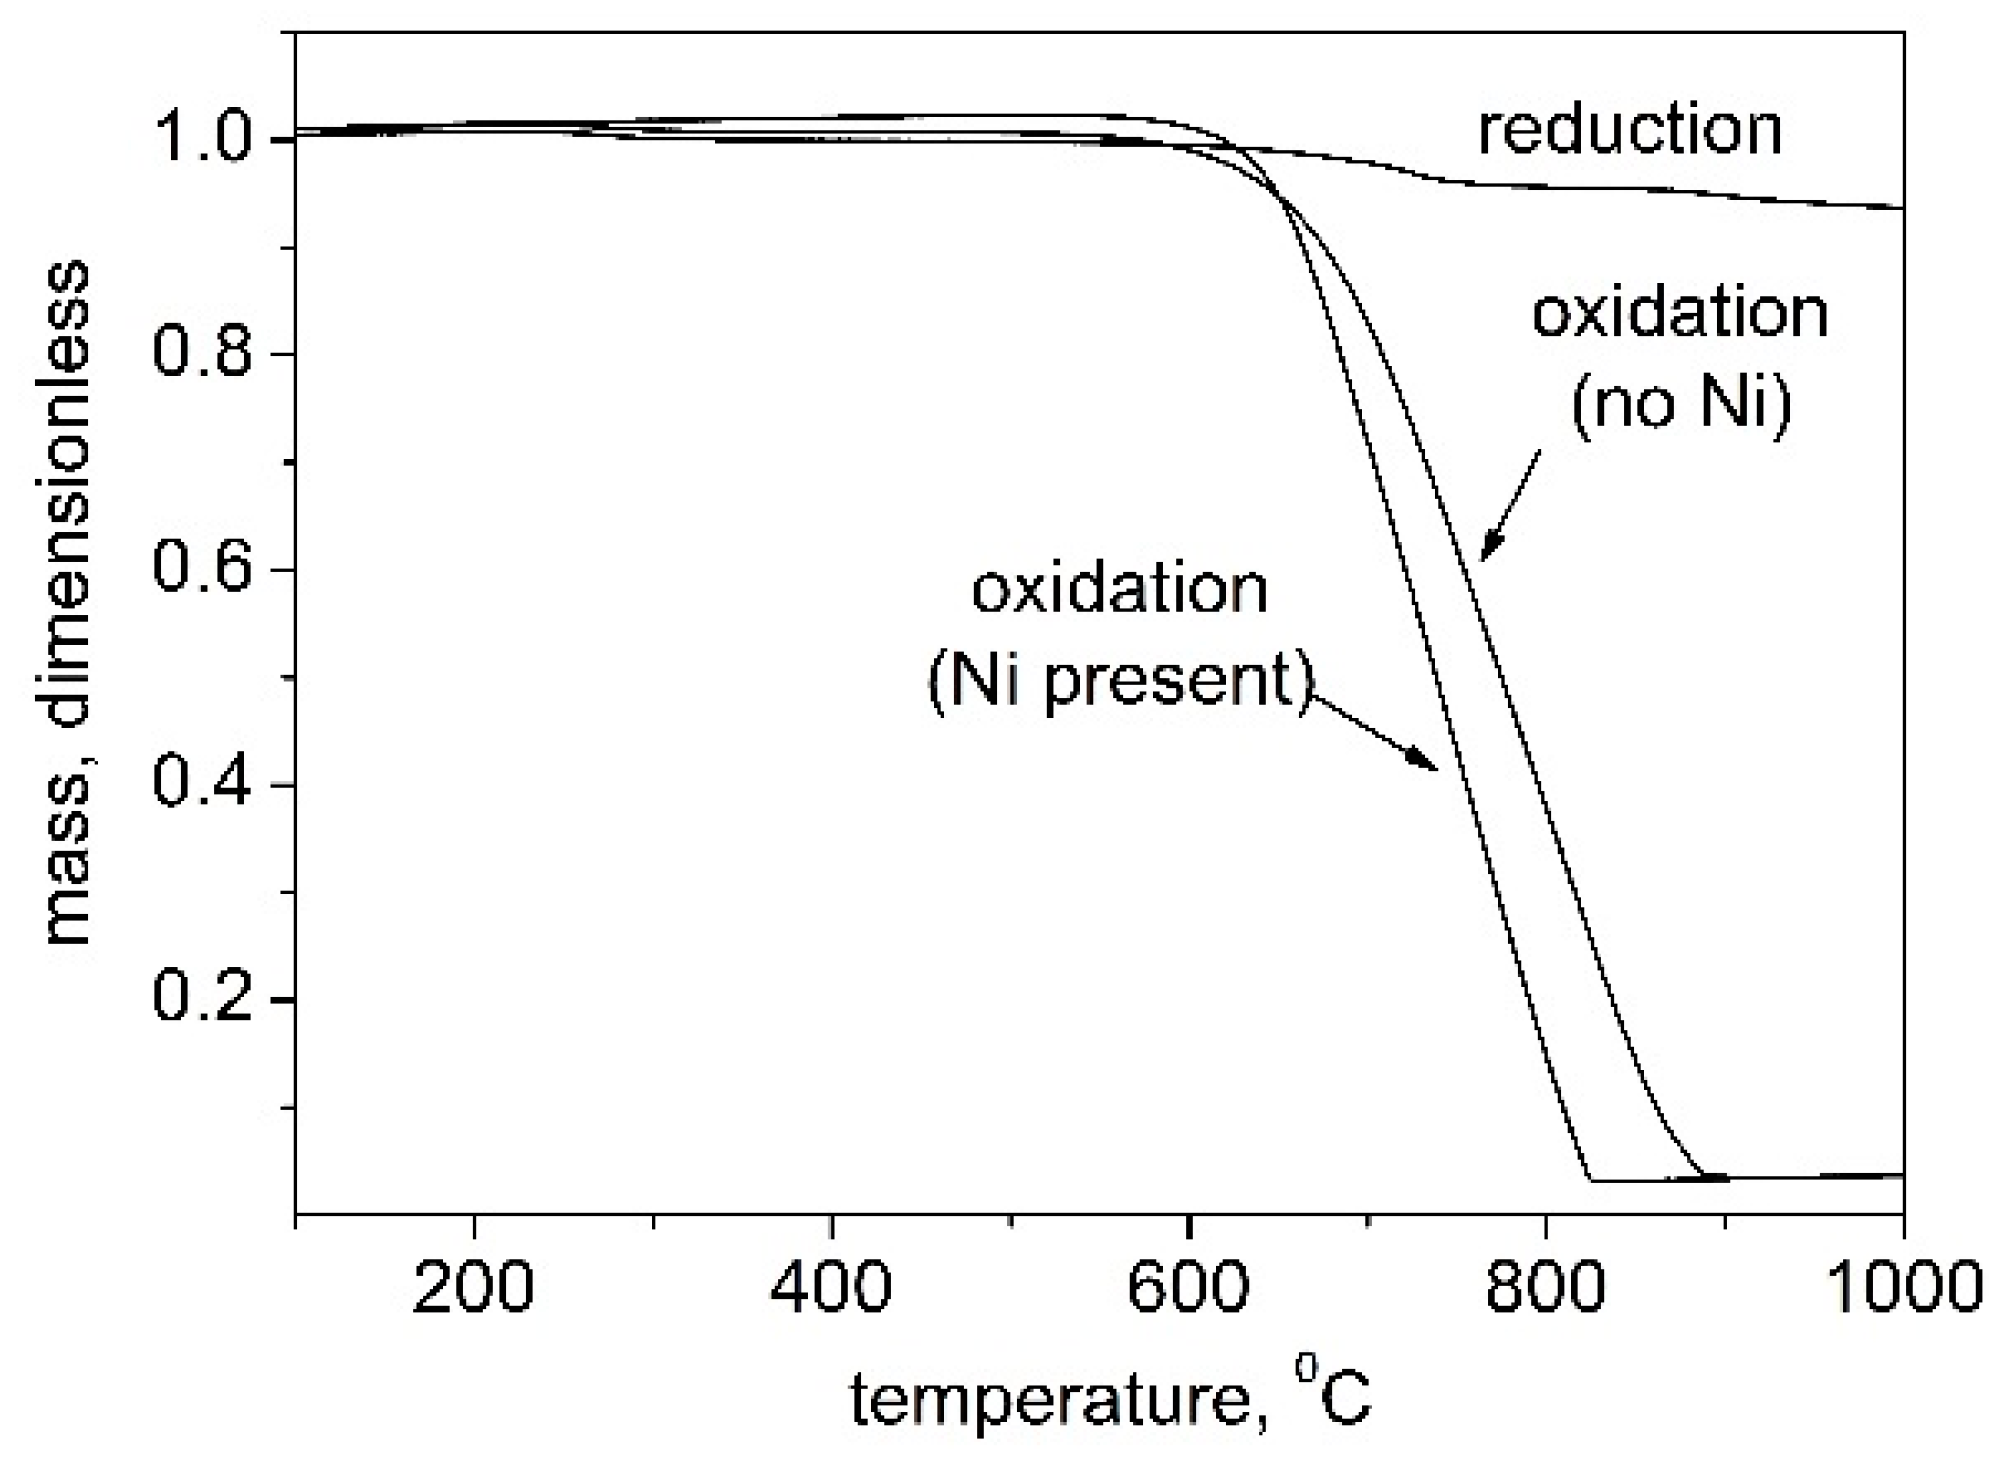
3.4. Erosion of Carbon Fibers
3.5. Resulting Chemical Composition
3.5.1. X-ray Flourescence Analysis
3.5.2. X-ray Photoelectron Spectroscopy Analysis
4. Conclusions
- CNFs can successfully be grown on a large fabric in situ with density and morphology potentially suitable for production of composites.
- Specifics of the Ni catalyst deposition process influence the uniformity of the distribution of a CNF “forest” and, to a lesser extent, its morphology; particularly, the CNF morphology depends on the catalyst loading and the solvent used for Ni(NO3)2 deposition.
- The fiber surface functional groups significantly change after the growth of CNFs.
Acknowledgments
Author Contributions
Conflicts of Interest
Abbreviations
| CNFs | Carbon Nanofibers |
| CNTs | Carbon Nanotubes |
| CVD | Chemical Vapor Deposition |
| PPS | Polyphenylene sulfide |
| SEM | Scanning Electron Microscope |
| XRD | X-ray Diffraction |
| XRF | X-ray Flourescence |
| XPS | X-ray Photoelectron Spectroscopy |
Appendix


References
- Karger-Kocsis, J.; Mahmood, H.; Pegoretti, A. Recent advances in fiber/matrix interphase engineering for polymer composites. Prog. Mater. Sci. 2015, 73, 1–43. [Google Scholar] [CrossRef] [Green Version]
- Kotanjac, Ž.; Lefferts, L.; Koissin, V.; Warnet, L.; Akkerman, R. Synthesis of carbon nanofibers on large woven cloth. C J. Carbon Res. 2015, 1, 2–15. [Google Scholar] [CrossRef]
- De Greef, N.; Magrez, A.; Couteau, E.; Locquet, J.-P.; Forró, L.; Seo, J.W. Growth of carbon nanotubes on carbon fibers without strength degradation. Phys. Status Solidi B 2012, 249, 2420–2423. [Google Scholar] [CrossRef]
- Jia, Z. Effect of surface treatment on the structure and properties of para-aramid fibers by phosphoric acid. Fibers Polym. 2013, 14, 59–64. [Google Scholar]
- Park, S.-J. Carbon Fibers; Springer: Rotterdam, The Netherlands, 2014. [Google Scholar]
- Chen, W.; Qian, X.-M.; He, X.-Q.; Liu, Z.-Y.; Liu, J.-P. Surface modification of Kevlar by grafting carbon nanotubes. J. Appl. Polym. Sci. 2011, 123, 1983–1990. [Google Scholar] [CrossRef]
- Lee, G.; Kim, K.J.; Yu, W.; Youk, J.H. The effect of the surface roughness of carbon fibers on CNT growth by floating-catalyst chemical vapour deposition. Int. J. Nanotechnol. 2013, 10, 800–810. [Google Scholar] [CrossRef]
- Steiner, S.A.; Li, R.; Wardle, B.L. Circumventing the mechanochemical origins of strength loss in the synthesis of hierarchical carbon fibers. ACS Appl. Mater. Interfaces 2013, 5, 4892–4903. [Google Scholar] [CrossRef] [PubMed]
- Zhao, Z.-G.; Ci, L.-J.; Cheng, H.-M.; Bai, J. The growth of multi-walled carbon nanotubes with different morphologies on carbon fibers. Carbon 2005, 43, 651–673. [Google Scholar] [CrossRef]
- Tzengm, S.-S.; Hung, K.-H.; Ko, T.-H. Growth of carbon nanofibers on activated carbon fiber fabrics. Carbon 2006, 44, 859–865. [Google Scholar] [CrossRef]
- Fan, W.; Wang, Y.; Chen, J.; Yuan, Y.; Li, A.; Wang, Q.; Wang, C. Controllable growth of uniform carbon nanotubes/carbon nanofibers on the surface of carbon fibers. RSC Adv. 2015, 5, 75735–75745. [Google Scholar] [CrossRef]
- Ghaemi, F.; Ahmadian, A.; Yunus, R.; Ismail, F.; Rahmanian, S. Effects of thickness and amount of carbon nanofiber coated carbon fiber on improving the mechanical properties of nanocomposites. Nanomaterials 2016, 6, 1–16. [Google Scholar] [CrossRef]
- Torayca® T300 Technical Data Sheet No. CFA-002. Avaliable online: www.toraycfa.com/pdfs/T300JDataSheet.pdf (accessed on 25 April 2016).
- Morgan, P. Carbon Fibers and Their Composites; CRC Press Taylor & Francis Group: Boca Raton, FL, USA, 2005. [Google Scholar]
- TenCate. U.S. Patent 7,252,726 B2, 7 August 2007.
- Lomov, S.V.; Gorbatikh, L.; Kotanjac, Ž.; Koissin, V.; Houlle, M.; Rochez, O.; Karahan, M.; Mezzo, L.; Verpoest, I. Compressibility of carbon woven fabrics with carbon nanotubes/nanofibers grown on the fibers. Compos. Sci. Technol. 2011, 71, 315–325. [Google Scholar] [CrossRef]
- Hou, Y.; Kondoh, H.; Ohta, T.; Gao, S. Size-controlled synthesis of nickel nanoparticles. Appl. Surface Sci. 2005, 241, 218–222. [Google Scholar] [CrossRef]
- Kumar, A.; Shankar, R.; Saxena, A.; Mozumdar, S. Controlled synthesis of size-tunable nickel and nickel oxide nanoparticles using water-in-oil microemulsions. Adv. Nat. Sci. Nanosci. Nanotechnol. 2013, 4, 025009. [Google Scholar] [CrossRef]
- De Riccardis, M.F.; Carbone, D.; Makris, T.D.; Giorgi, R.; Lisi, N.; Salernitano, E. Anchorage of carbon nanotubes grown on carbon fibers. Carbon 2006, 44, 671–674. [Google Scholar] [CrossRef]
- Subramanian, V.; Wolf, E.E.; Kamat, P.V. Catalysis with TiO2/gold nanocomposites. Effect of metal particle size on the Fermi level equilibration. J. Am. Chem. Soc. 2004, 126, 4943–4950. [Google Scholar] [CrossRef] [PubMed]
- Tyurin, A. Particle size tuning in silver-polyacrylonitrile nanocomposites. eXPRESS Polym. Lett. 2010, 4, 71–78. [Google Scholar] [CrossRef]
- De Greef, N.; Zhang, L.; Magrez, A.; Forró, L.; Locquet, J.-P.; Verpoest, I.; Seo, J.W. Direct growth of carbon nanotubes on carbon fibers: Effect of the CVD parameters on the degradation of mechanical properties of carbon fibers. Diamond Relat. Mater. 2015, 51, 39–48. [Google Scholar] [CrossRef]
- Dai, Z.; Shi, F.; Zhang, B.; Li, M.; Zhang, Z. Effect of sizing on carbon fiber surface properties and fibers/epoxy interfacial adhesion. Appl. Surface Sci. 2011, 257, 6980–6985. [Google Scholar] [CrossRef]
- Luo, U.; Zhao, Y.; Duan, Y.; Du, S. Surface and wettability property analysis of CCF300 carbon fibers with different sizing or without sizing. Mater. Des. 2011, 32, 941–946. [Google Scholar] [CrossRef]
- Hammer, G.E.; Drzal, L.T. Graphite fiber surface analysis by X-ray Photoelectron Spectroscopy and Polar/dispersive Free Energy Analysis. Appl. Surface Sci. 1980, 4, 340–355. [Google Scholar] [CrossRef]
- Reis, M.J.; Botelho Do Rego, A.M.; Lopes Da Silva, J.D.; Soares, M.N. An XPS study of the fiber-matrix interface using sized carbon fibers as a model. J. Mater. Sci. 1995, 30, 118–126. [Google Scholar] [CrossRef]


| Specimen | Solution | Ni Size Range, nm | Ni Size Max, nm | CNF Diam. Range, nm | CNF Diam. Max, nm | Test |
|---|---|---|---|---|---|---|
| no CNF growth | acetone | 5–70 | 10 | n/a | n/a | SEM, XRD |
| no CNF growth | water | 5–60 | 20 | n/a | n/a | XRD |
| 0.7 wt % CNFs | acetone | 15–115 | 20 | --- | --- | SEM |
| 5.0 wt % CNFs | acetone | --- | --- | 5–35 | 10 | SEM |
| 16.0 wt % CNFs | acetone | 25–115 | 50 | 15–70 | 30 | SEM |
| Mo | Zn | Cu | Fe | Cr | P | Ca | Sn | S | Si | Ni | |
|---|---|---|---|---|---|---|---|---|---|---|---|
| base fabric | --- | --- | 2.2 | 0.43 | 1.24 | 0.16 | 0.25 | 0.20 | 0.15 | 1.35 | --- |
| 1.4 wt % CNFs | --- | 15.5 | 2.3 | 0.51 | 1.32 | 0.14 | 0.68 | 0.28 | 0.38 | 1.37 | 60 |
| 7.1 wt % CNFs | 0.79 | 6.4 | 2.5 | 2.8 | 7.6 | 0.13 | 0.71 | 0.29 | 0.75 | 1.31 | 47 |
| C | N | O | Na | Si | Cl | Ca | Ni | |
|---|---|---|---|---|---|---|---|---|
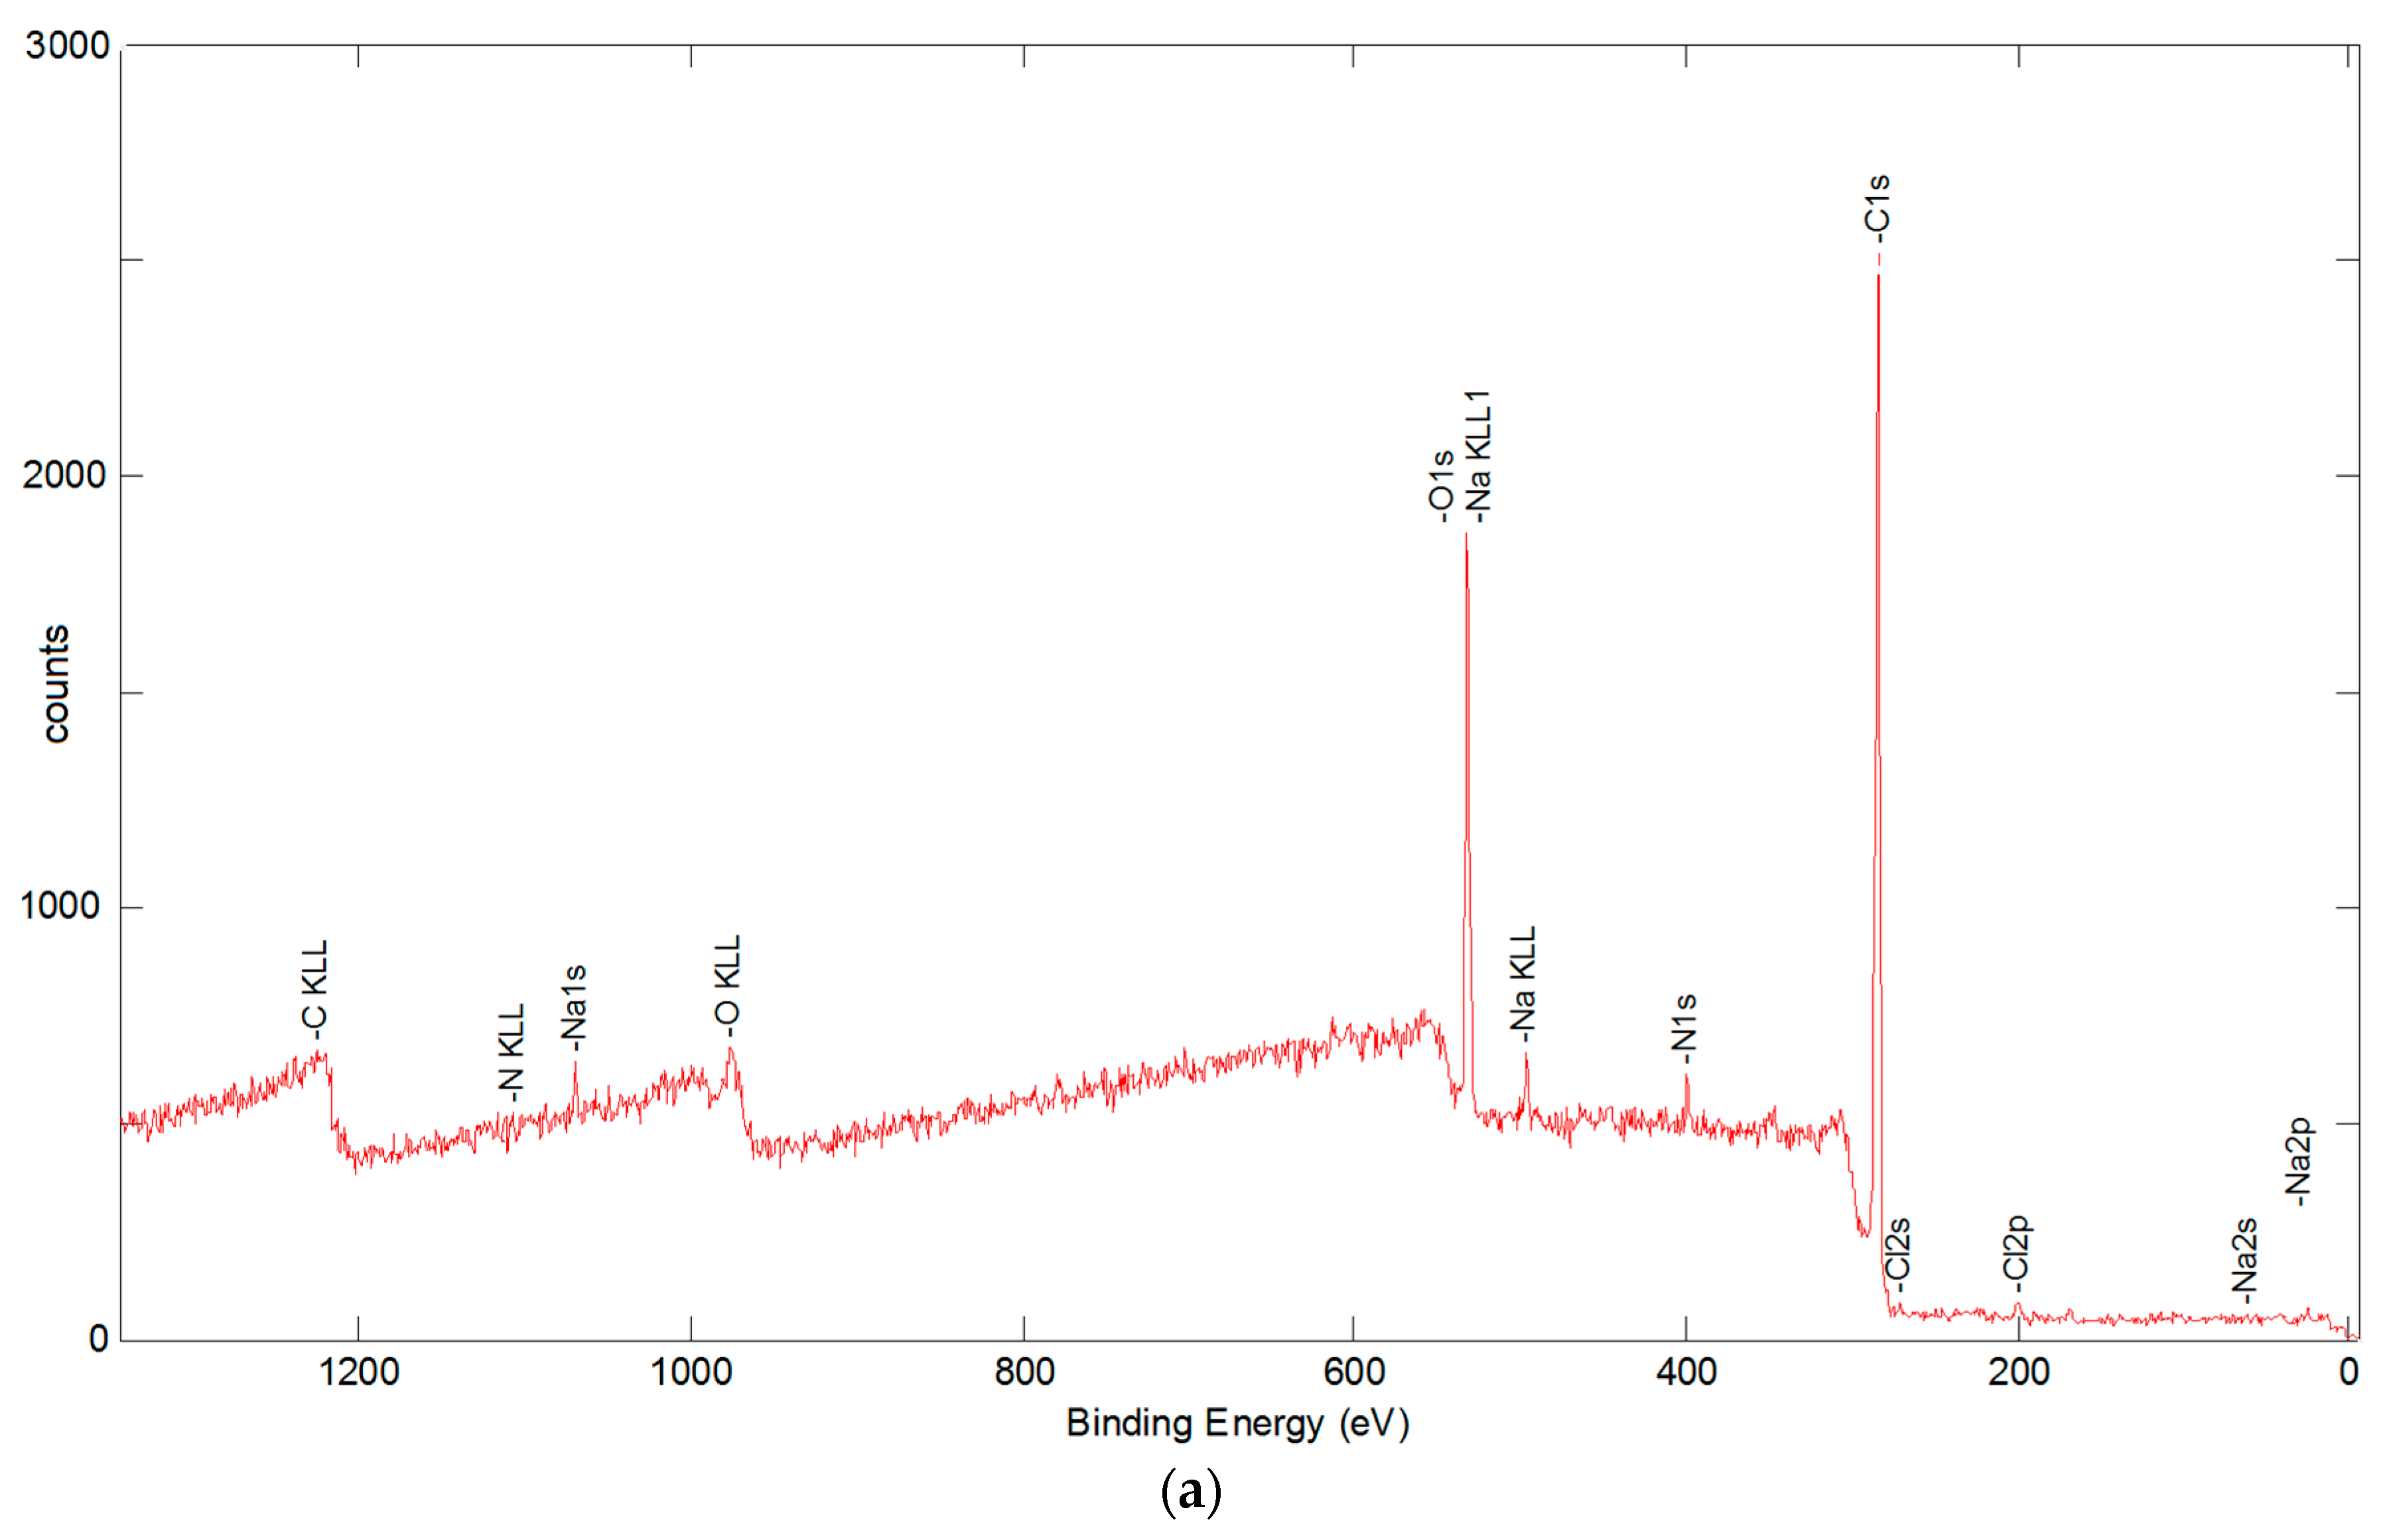
| sized | 74.21 | 4.30 | 20.72 | (0.19) | (0.07) | 0.36 | 0.15 | --- |
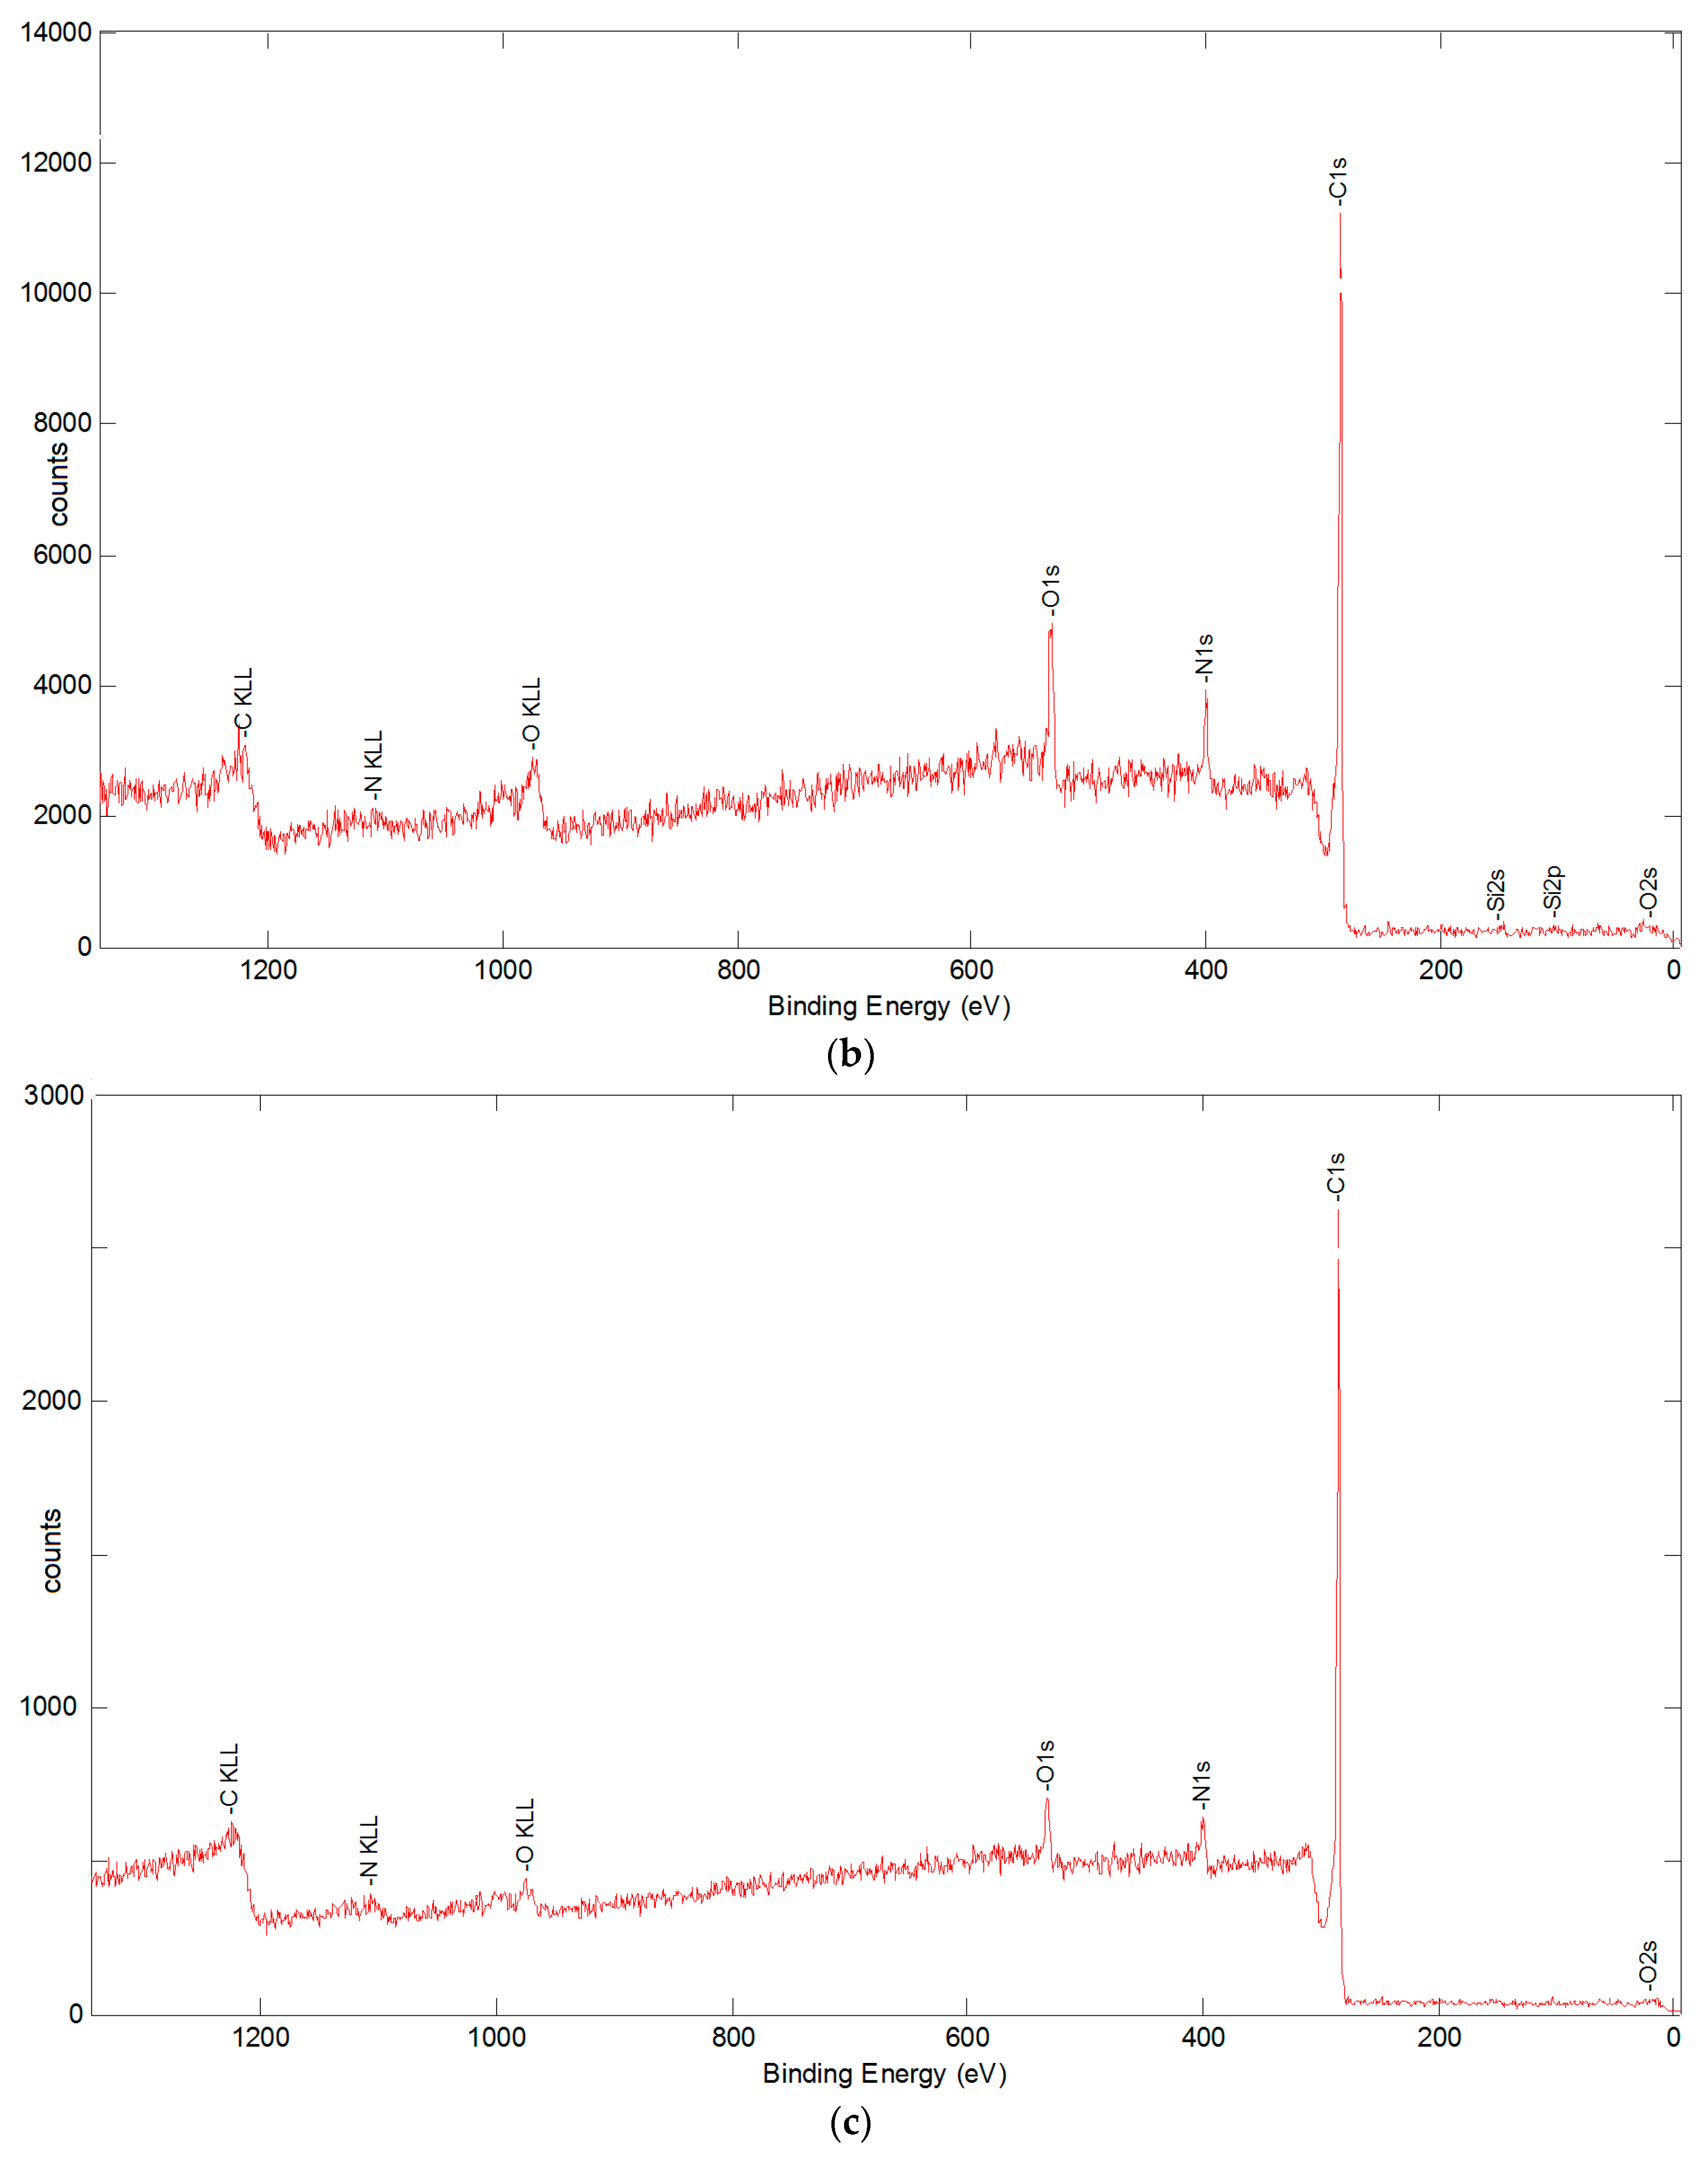
| desized at 400 °C | 82.76 | 8.38 | 8.31 | (0.11) | (0.26) | (0.04) | (0.14) | --- |
| desized at 600 °C | 87.78 | 6.71 | 4.99 | (0.12) | 0.31 | (0.03) | (0.05) | --- |
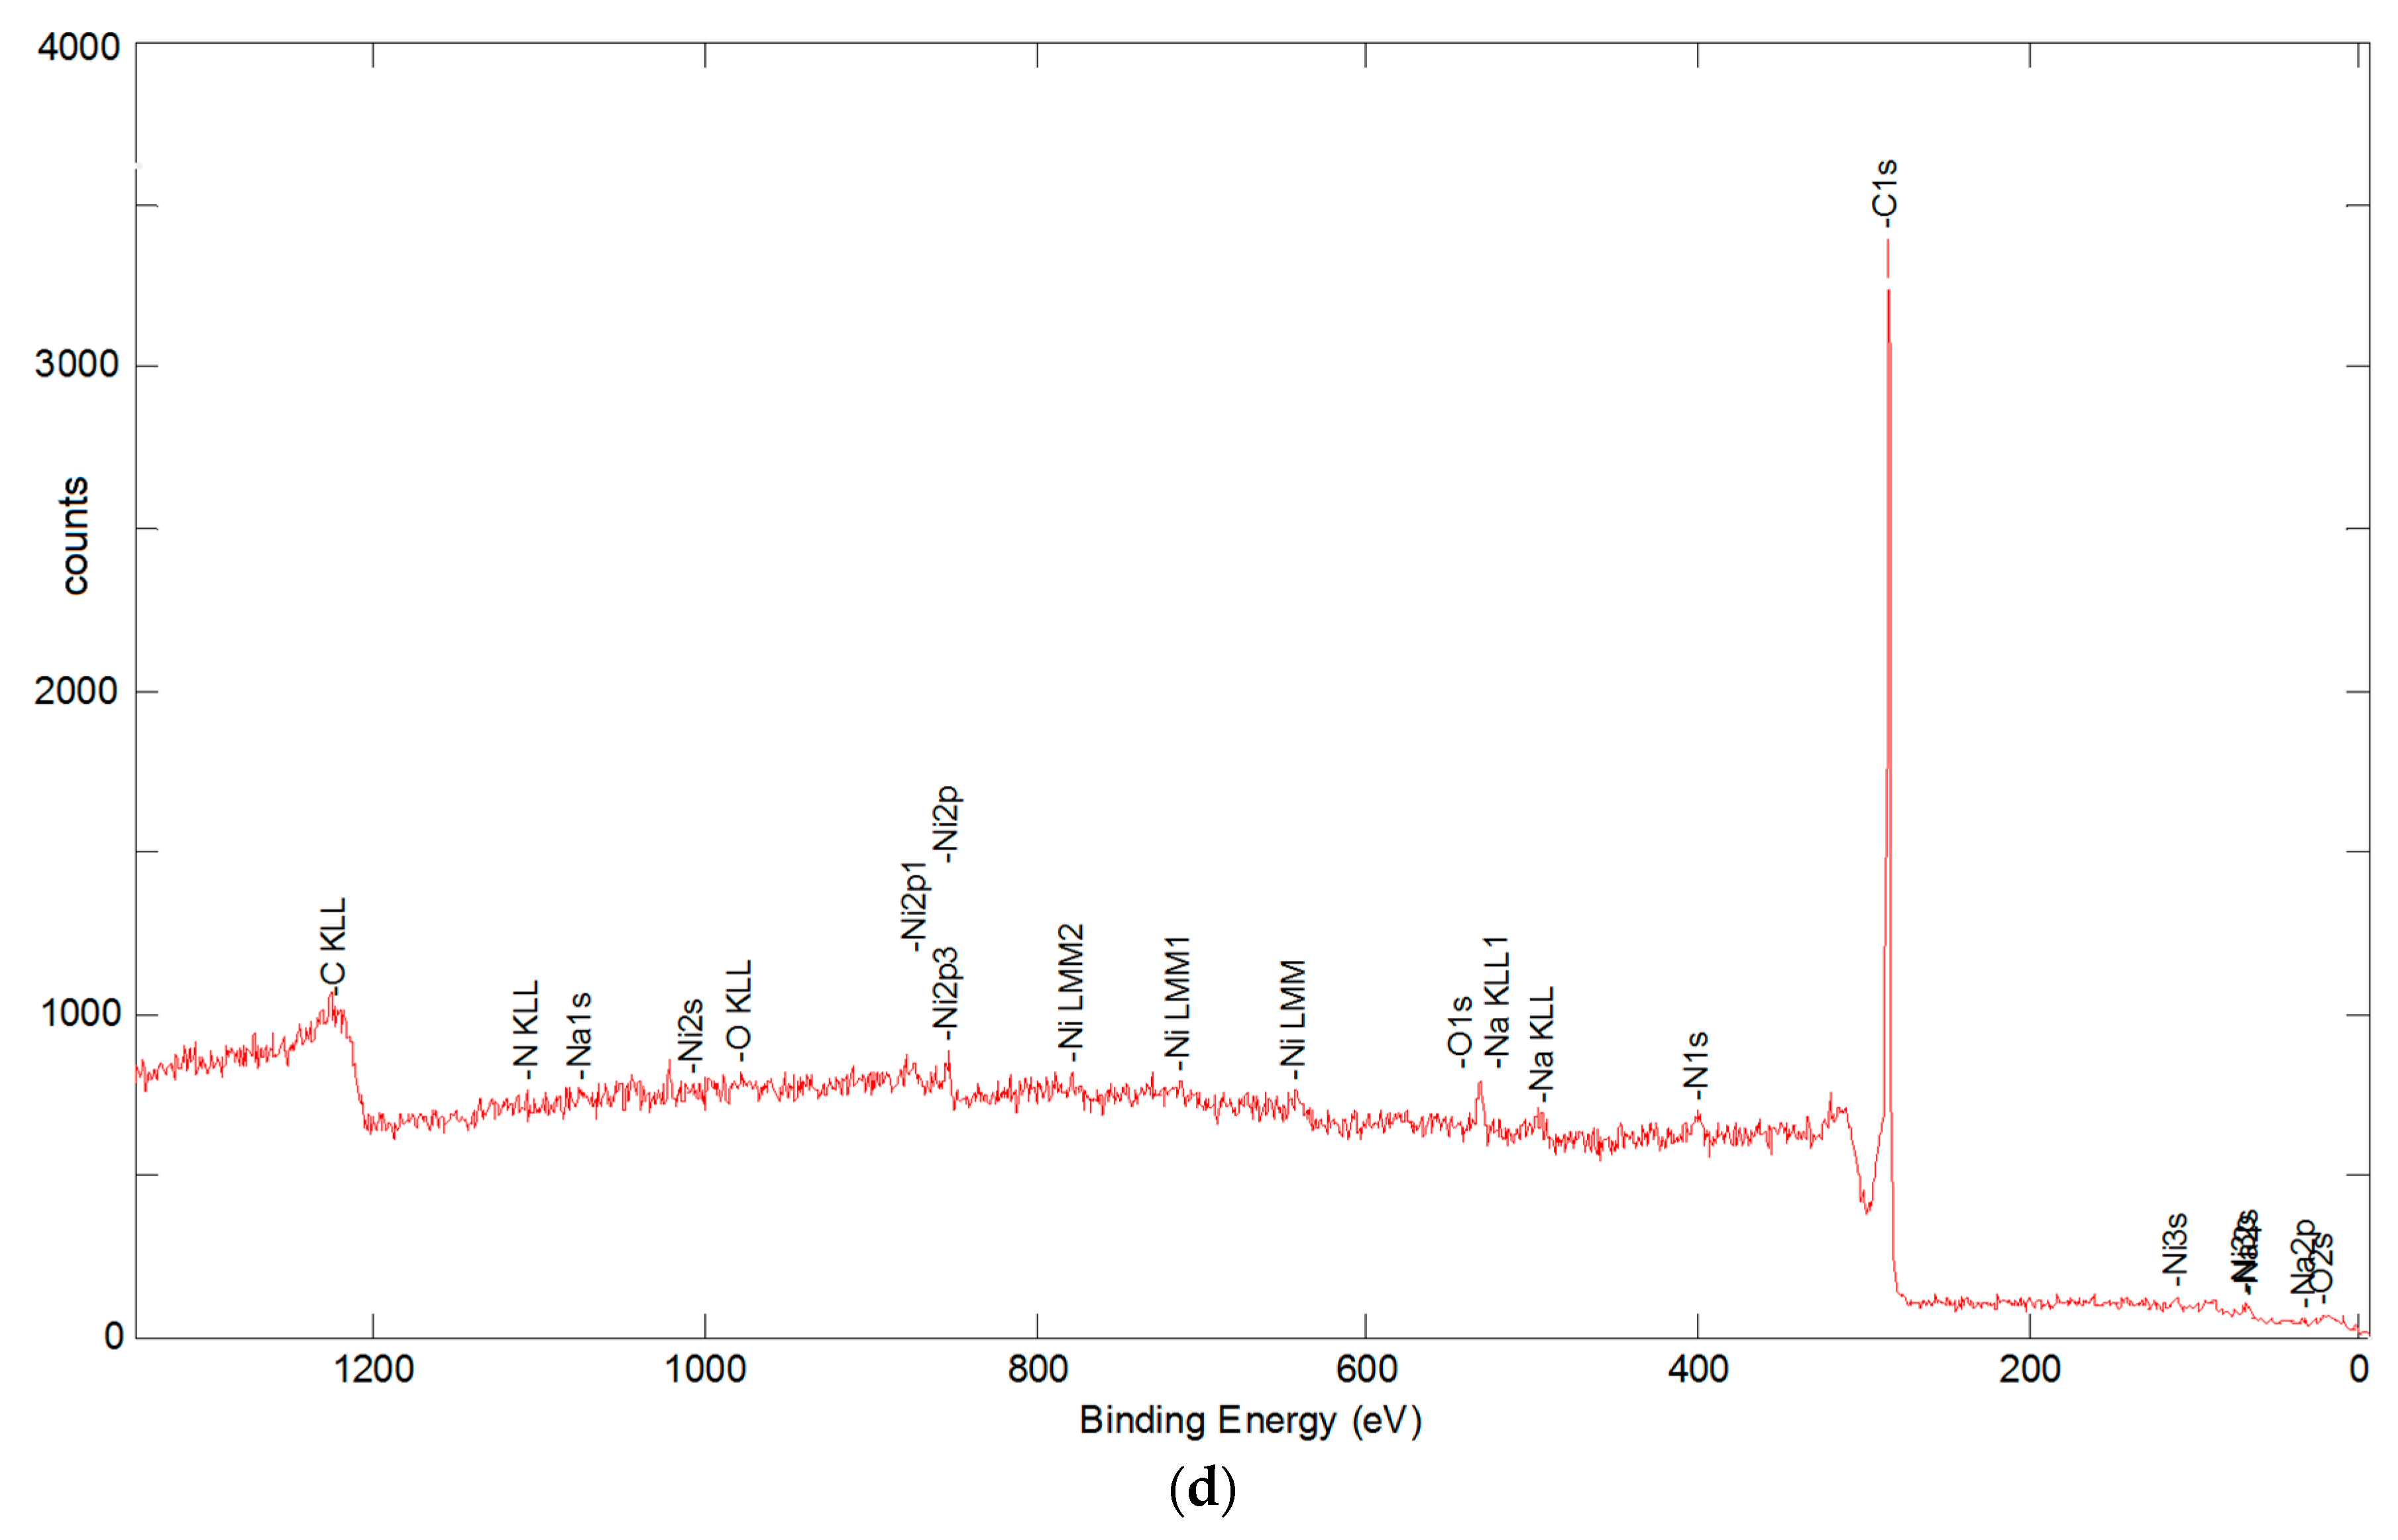
| 1.4 wt % CNFs, acetone solution | 94.93 | 2.07 | 2.18 | --- | --- | --- | --- | 0.81 |
| Functional Groups | C-C*-C | C-C*-O, etc. | N-C=O, etc. | C-C=O | O-C-O, etc. |
|---|---|---|---|---|---|
| Band Energy, eV | ref = 284.8 | ref + 1.5 | ref + 3.5 | ref + 4.5 | ref + > 5.5 |
| sized | 51.9 | 43.8 | --- | 4.3 | --- |
| desized at 400 °C | 64.9 | 17.6 | 8.0 | --- | 9.5 |
| desized at 600 °C | 69.1 | 14.8 | 6.8 | --- | 9.3 |
| 1.4 wt % CNFs, acetone solution | 71.7 | 10.7 | 5.8 | --- | 12.8 |
© 2016 by the authors. Licensee MDPI, Basel, Switzerland. This article is an open access article distributed under the terms and conditions of the Creative Commons Attribution (CC-BY) license ( http://creativecommons.org/licenses/by/4.0/).
Share and Cite
Koissin, V.; Bor, T.; Kotanjac, Ž.; Lefferts, L.; Warnet, L.; Akkerman, R. Carbon Nanofibers Grown on Large Woven Cloths: Morphology and Properties of Growth. C 2016, 2, 19. https://0-doi-org.brum.beds.ac.uk/10.3390/c2030019
Koissin V, Bor T, Kotanjac Ž, Lefferts L, Warnet L, Akkerman R. Carbon Nanofibers Grown on Large Woven Cloths: Morphology and Properties of Growth. C. 2016; 2(3):19. https://0-doi-org.brum.beds.ac.uk/10.3390/c2030019
Chicago/Turabian StyleKoissin, Vitaly, Ton Bor, Željko Kotanjac, Leon Lefferts, Laurent Warnet, and Remko Akkerman. 2016. "Carbon Nanofibers Grown on Large Woven Cloths: Morphology and Properties of Growth" C 2, no. 3: 19. https://0-doi-org.brum.beds.ac.uk/10.3390/c2030019