High-Surface-Area Mesoporous Activated Carbon from Hemp Bast Fiber Using Hydrothermal Processing

 ,
,
Abstract
:
1. Introduction
2. Materials and Methods
2.1. Materials
2.2. Preparation of Hemp-Derived Activated Carbon (HAC)
2.3. Instrumentation
3. Results
4. Conclusions
- ➢
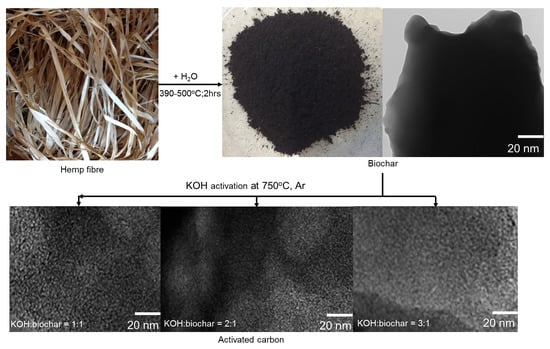
- Hemp-fiber-derived highly mesoporous activated carbon (HAC) with large surface area and pore volume was synthesized.
- ➢
- The final product was found to be insensitive to the synthesis temperature of the intermediate product (biochar).
- ➢
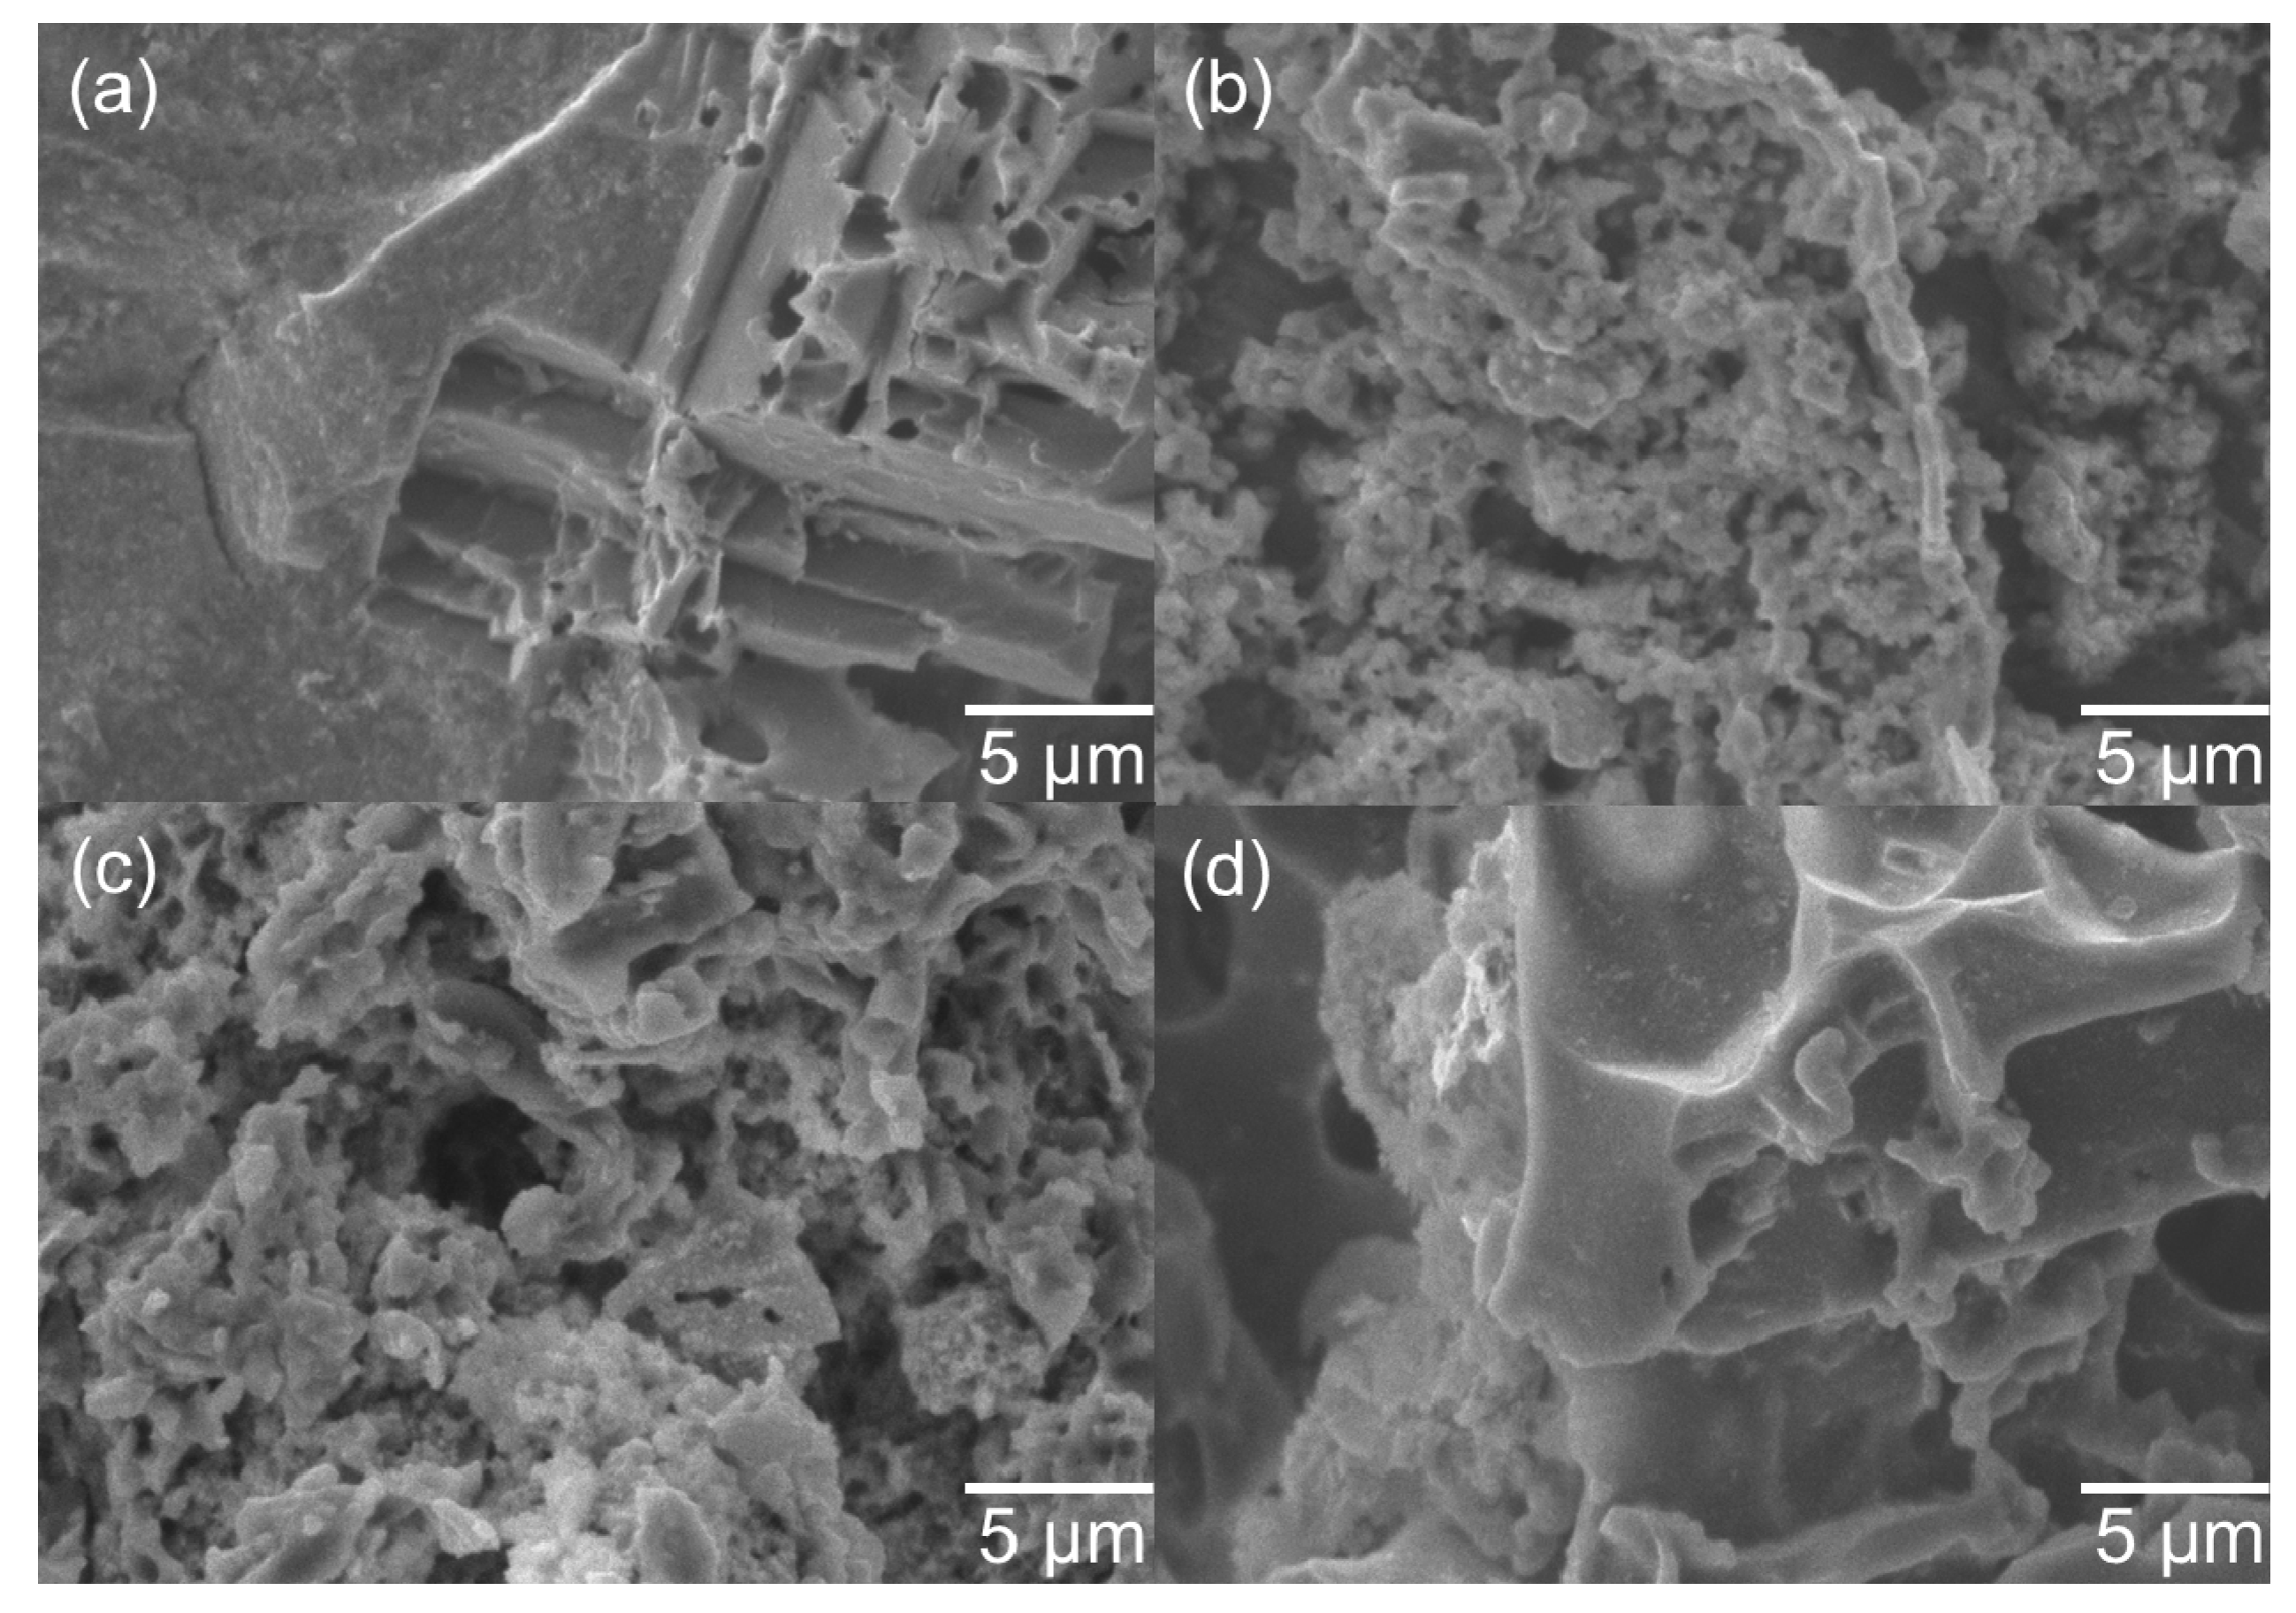
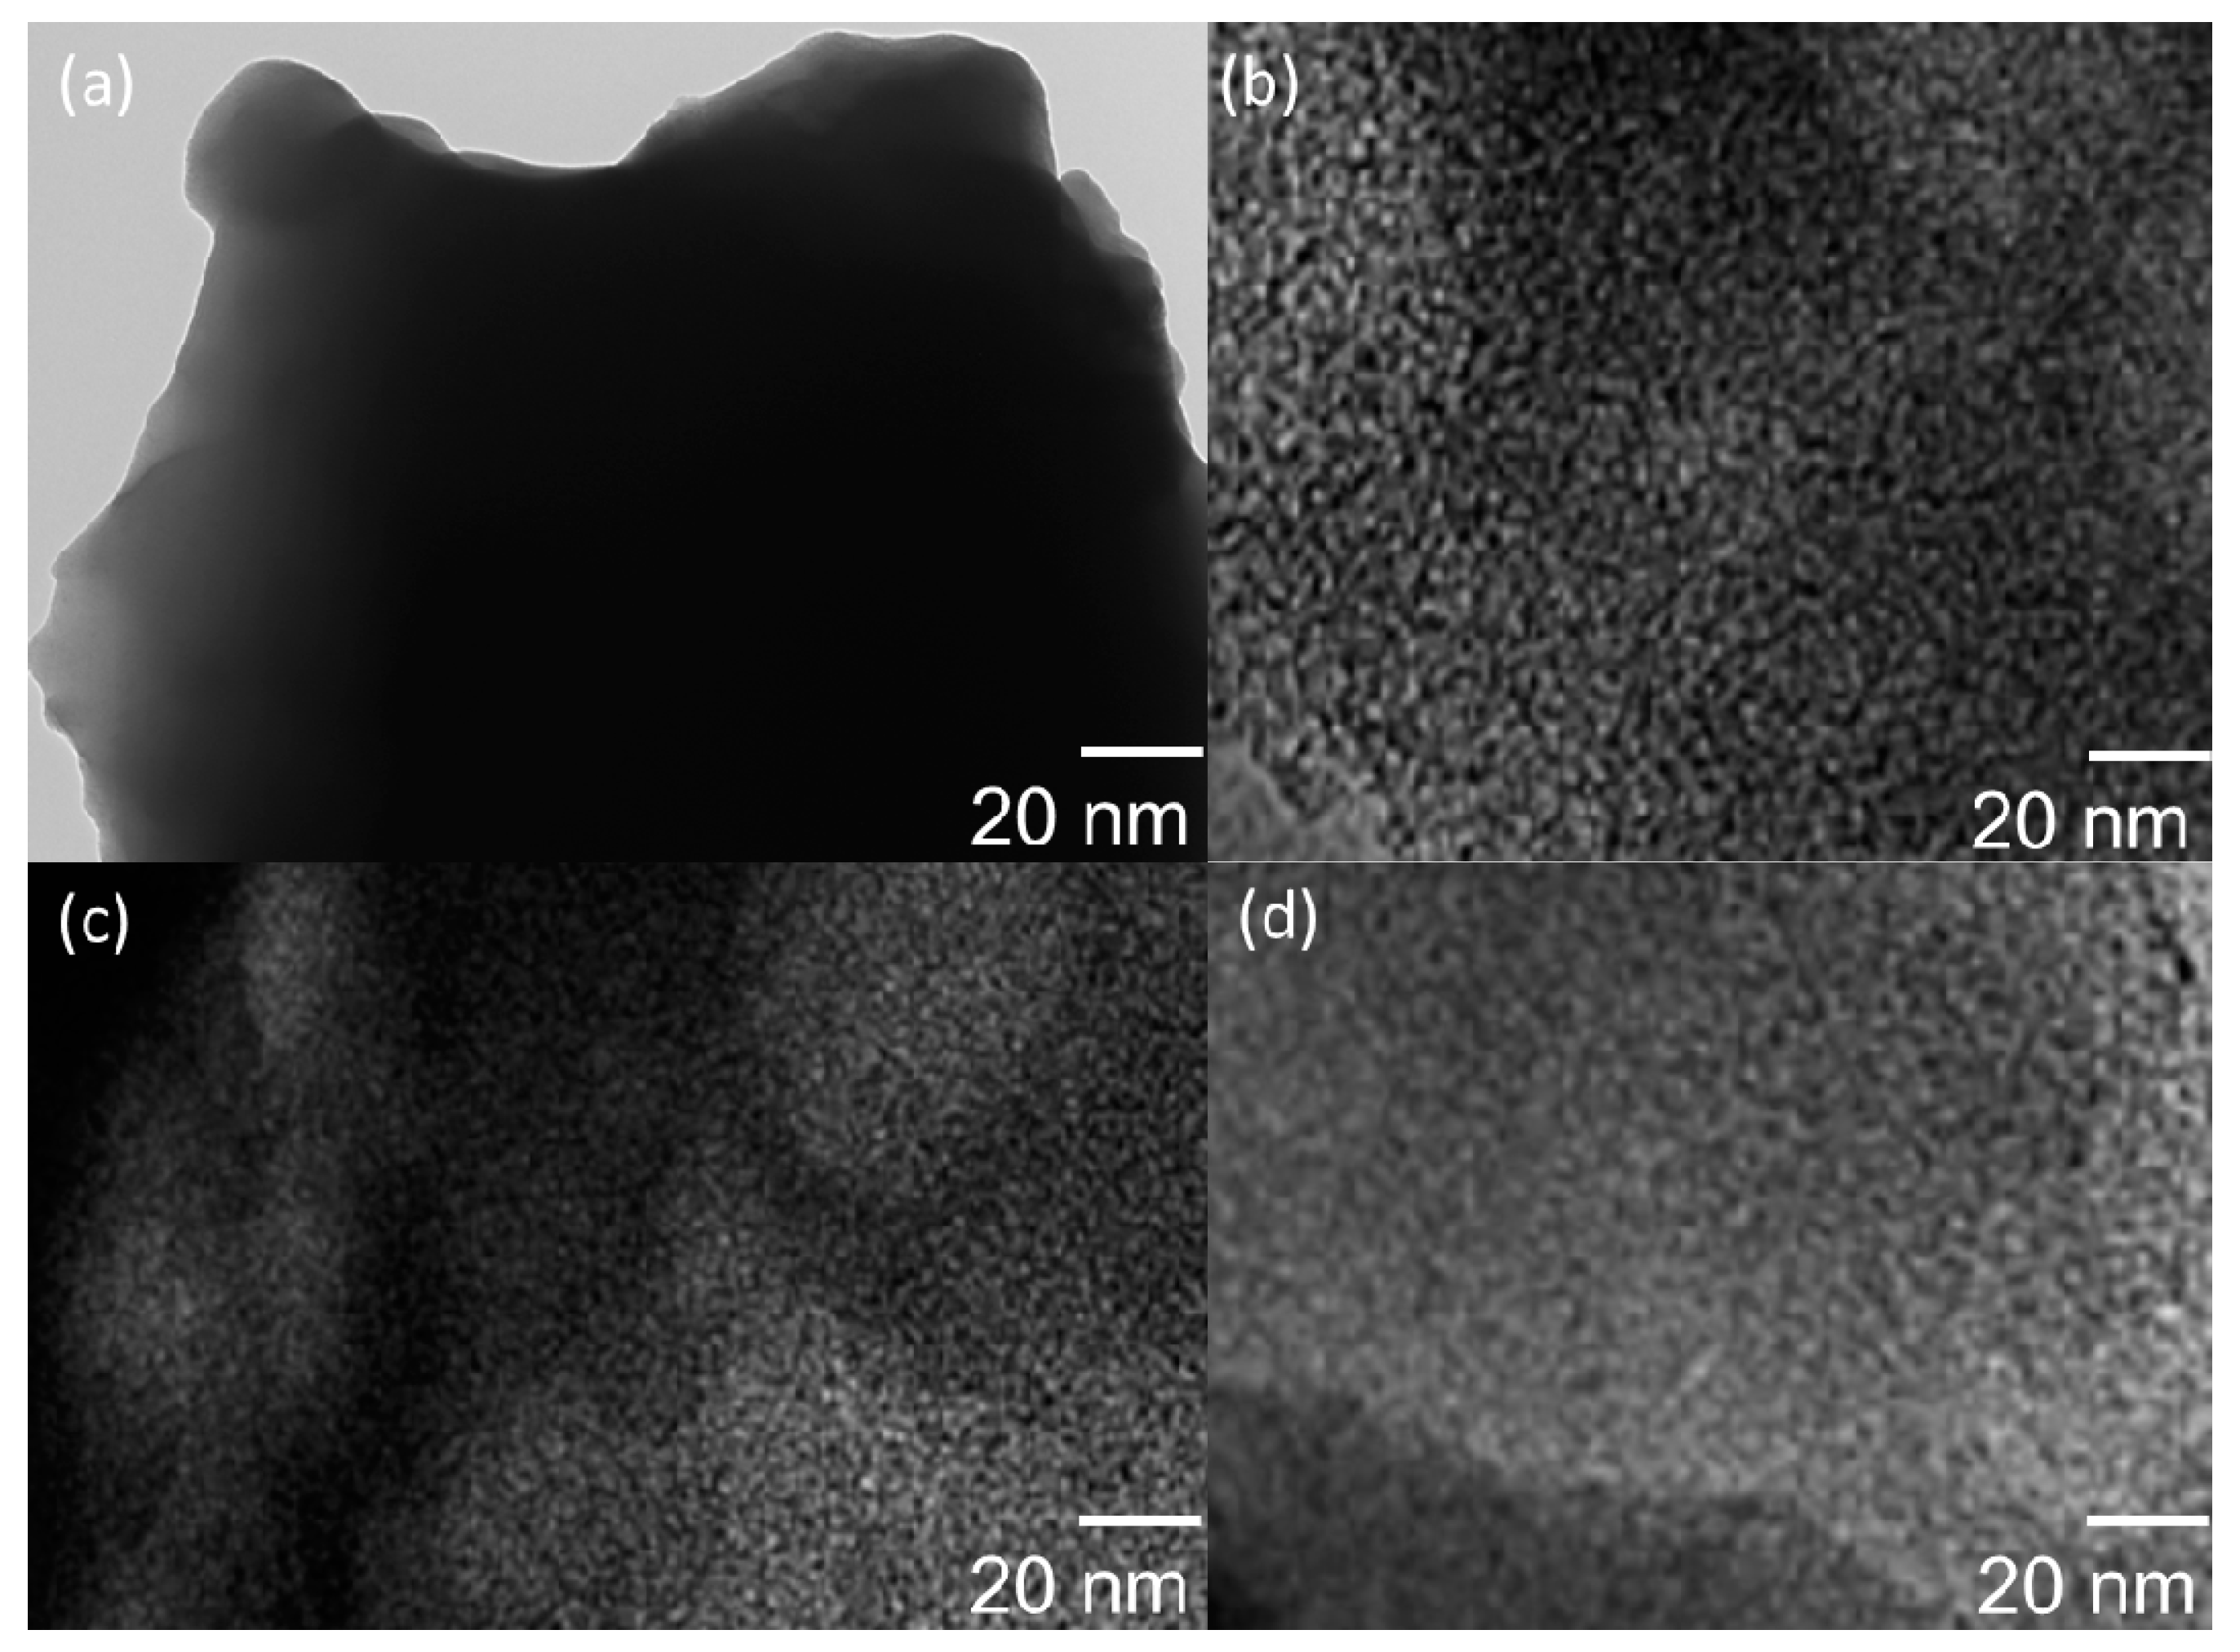
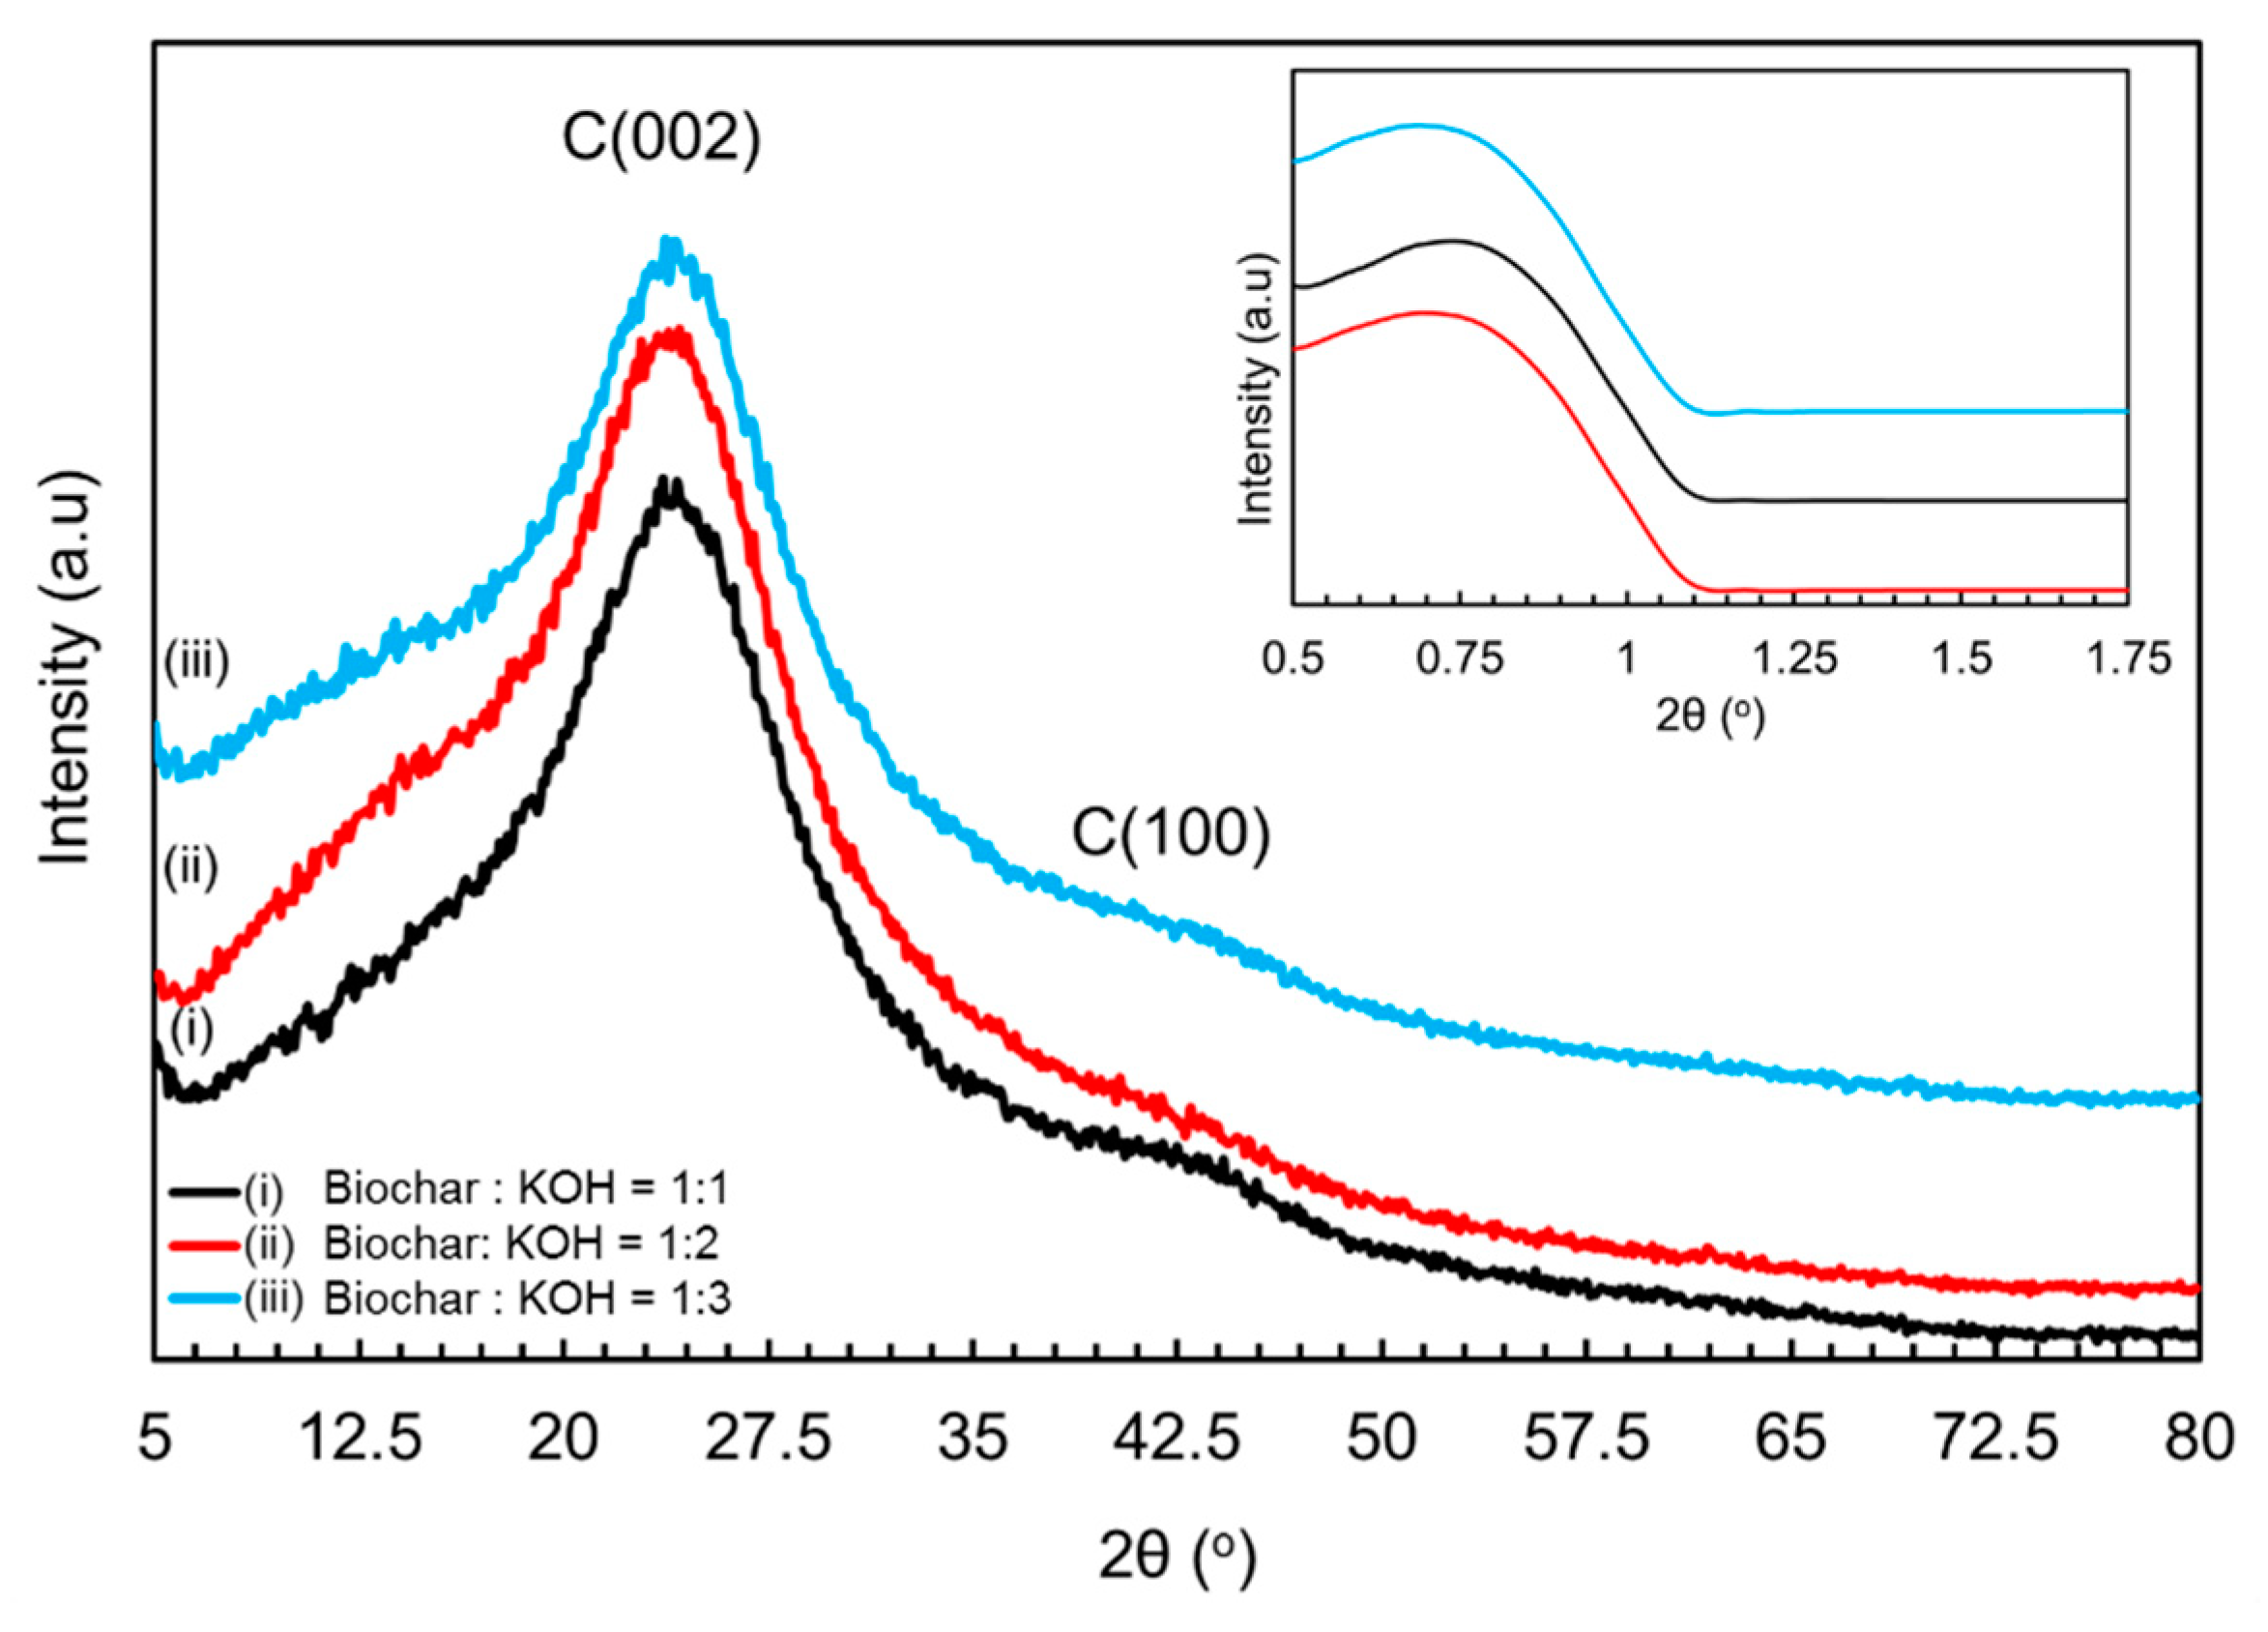
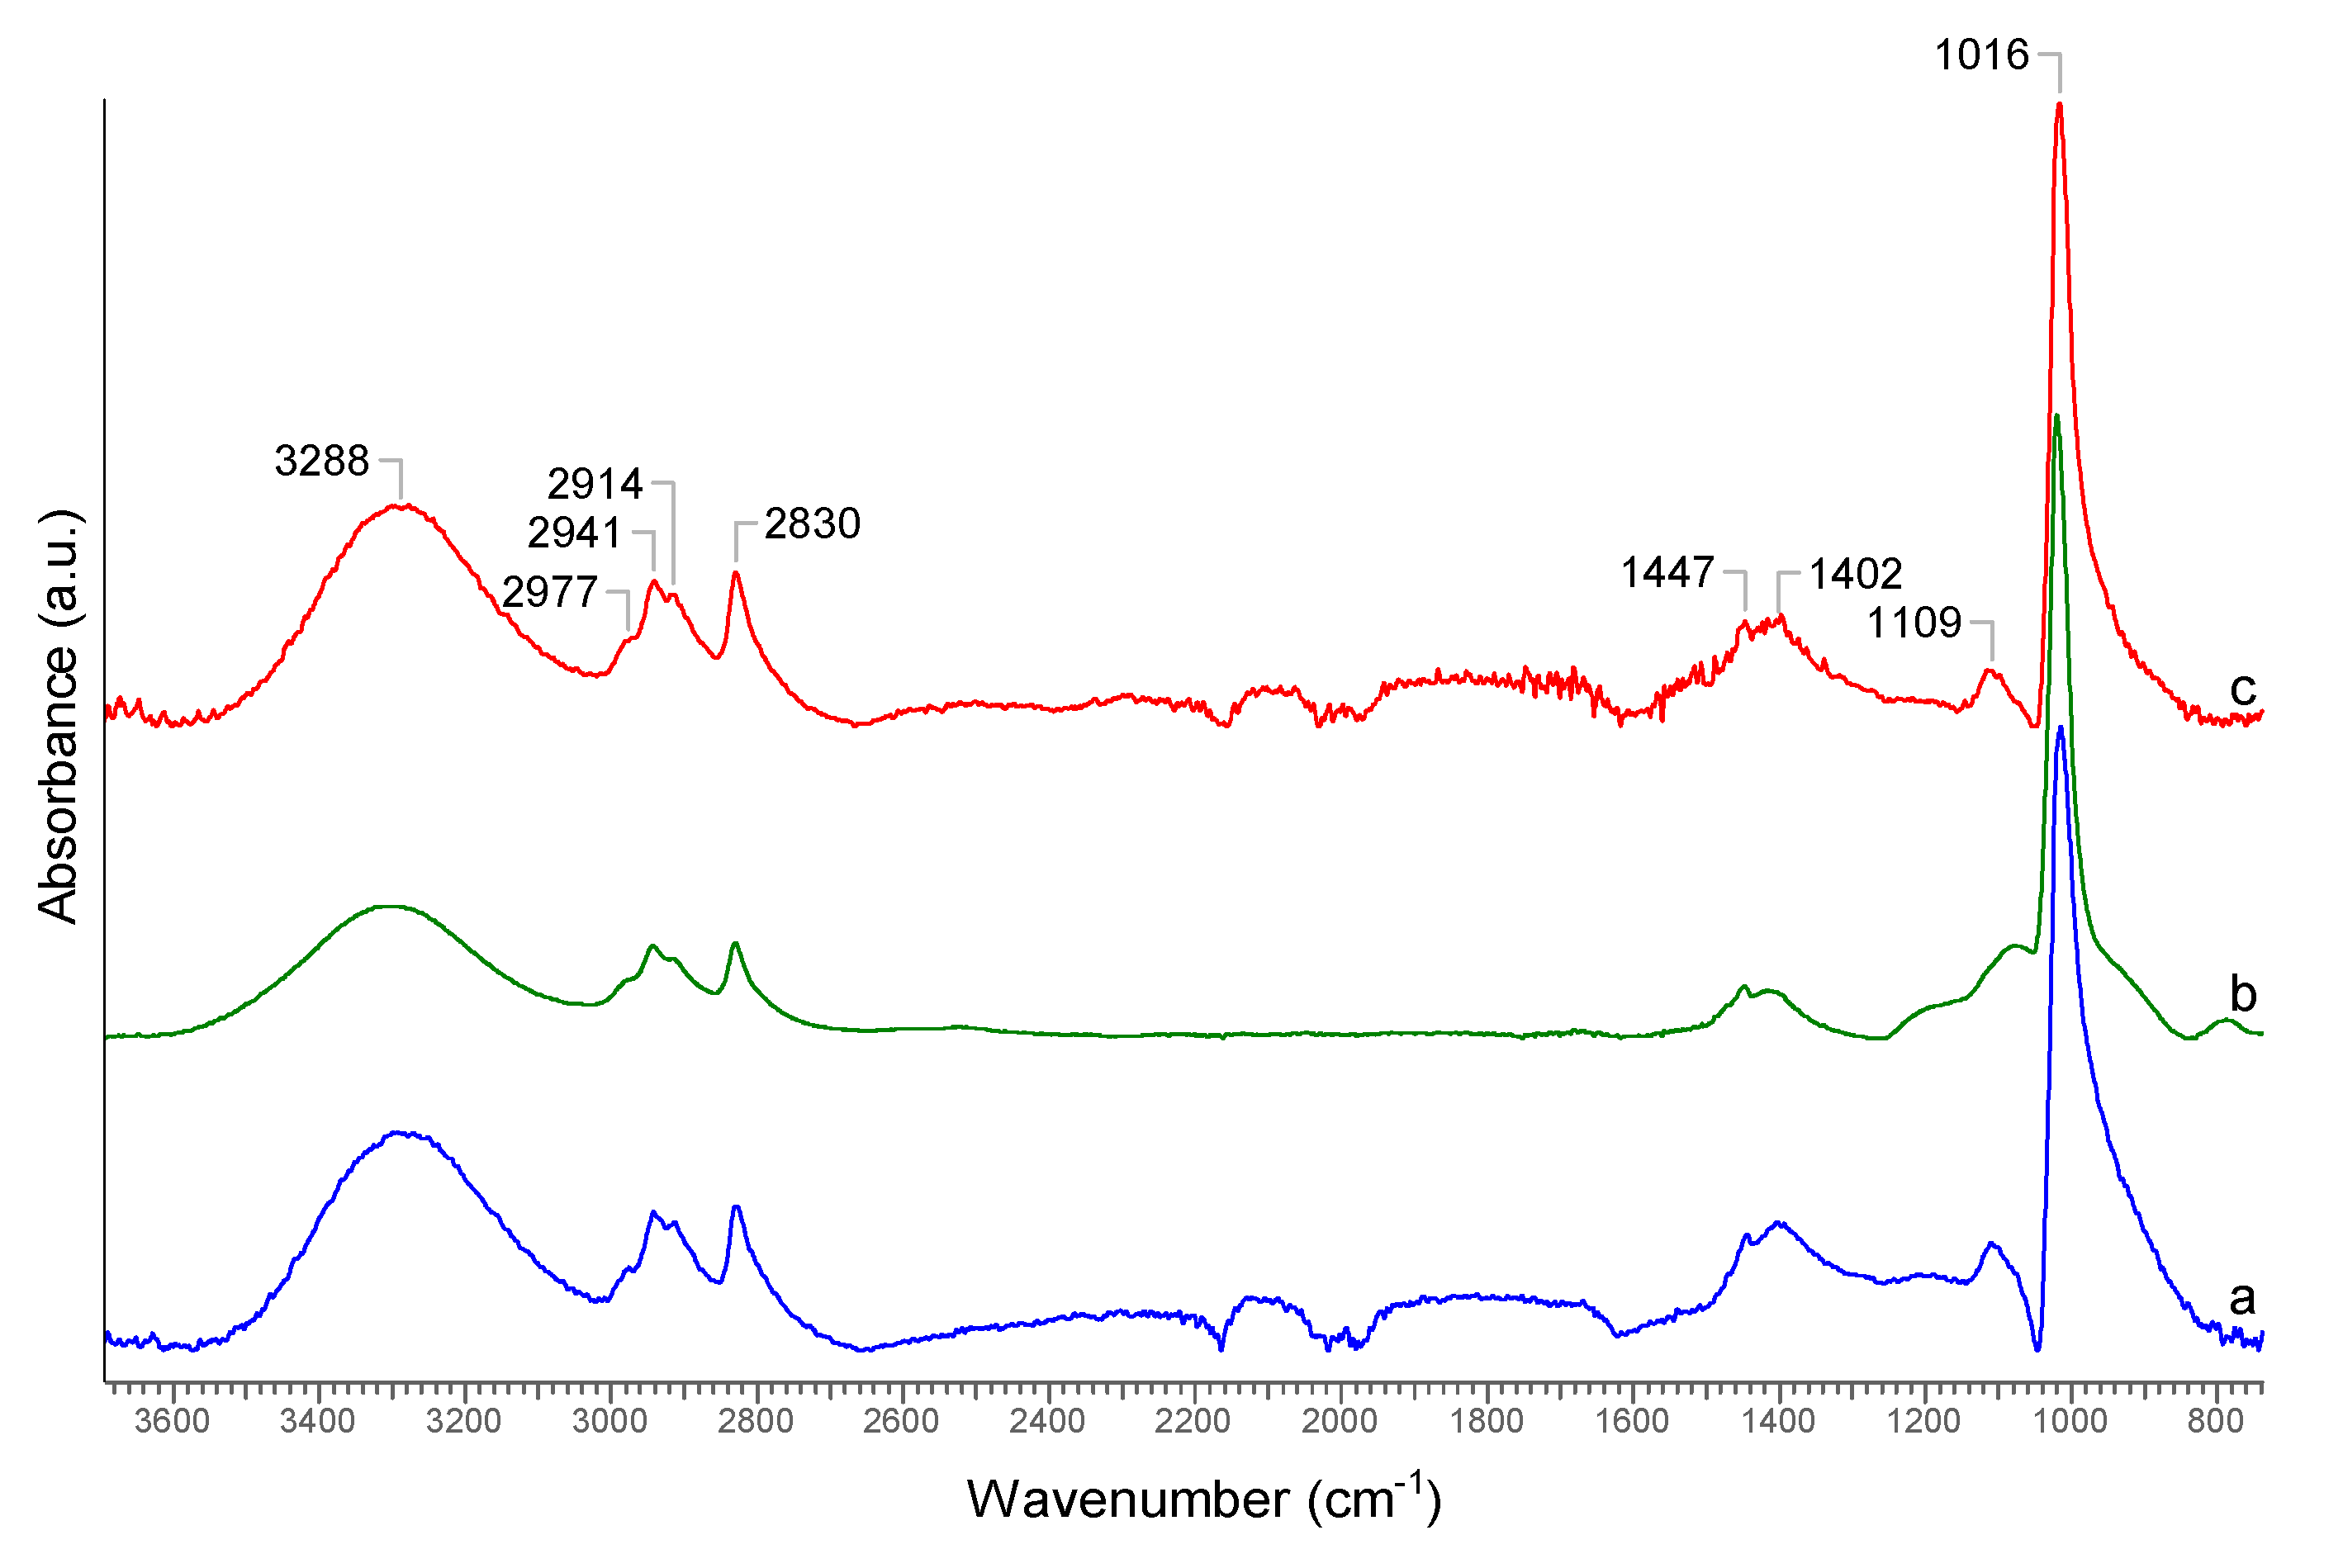
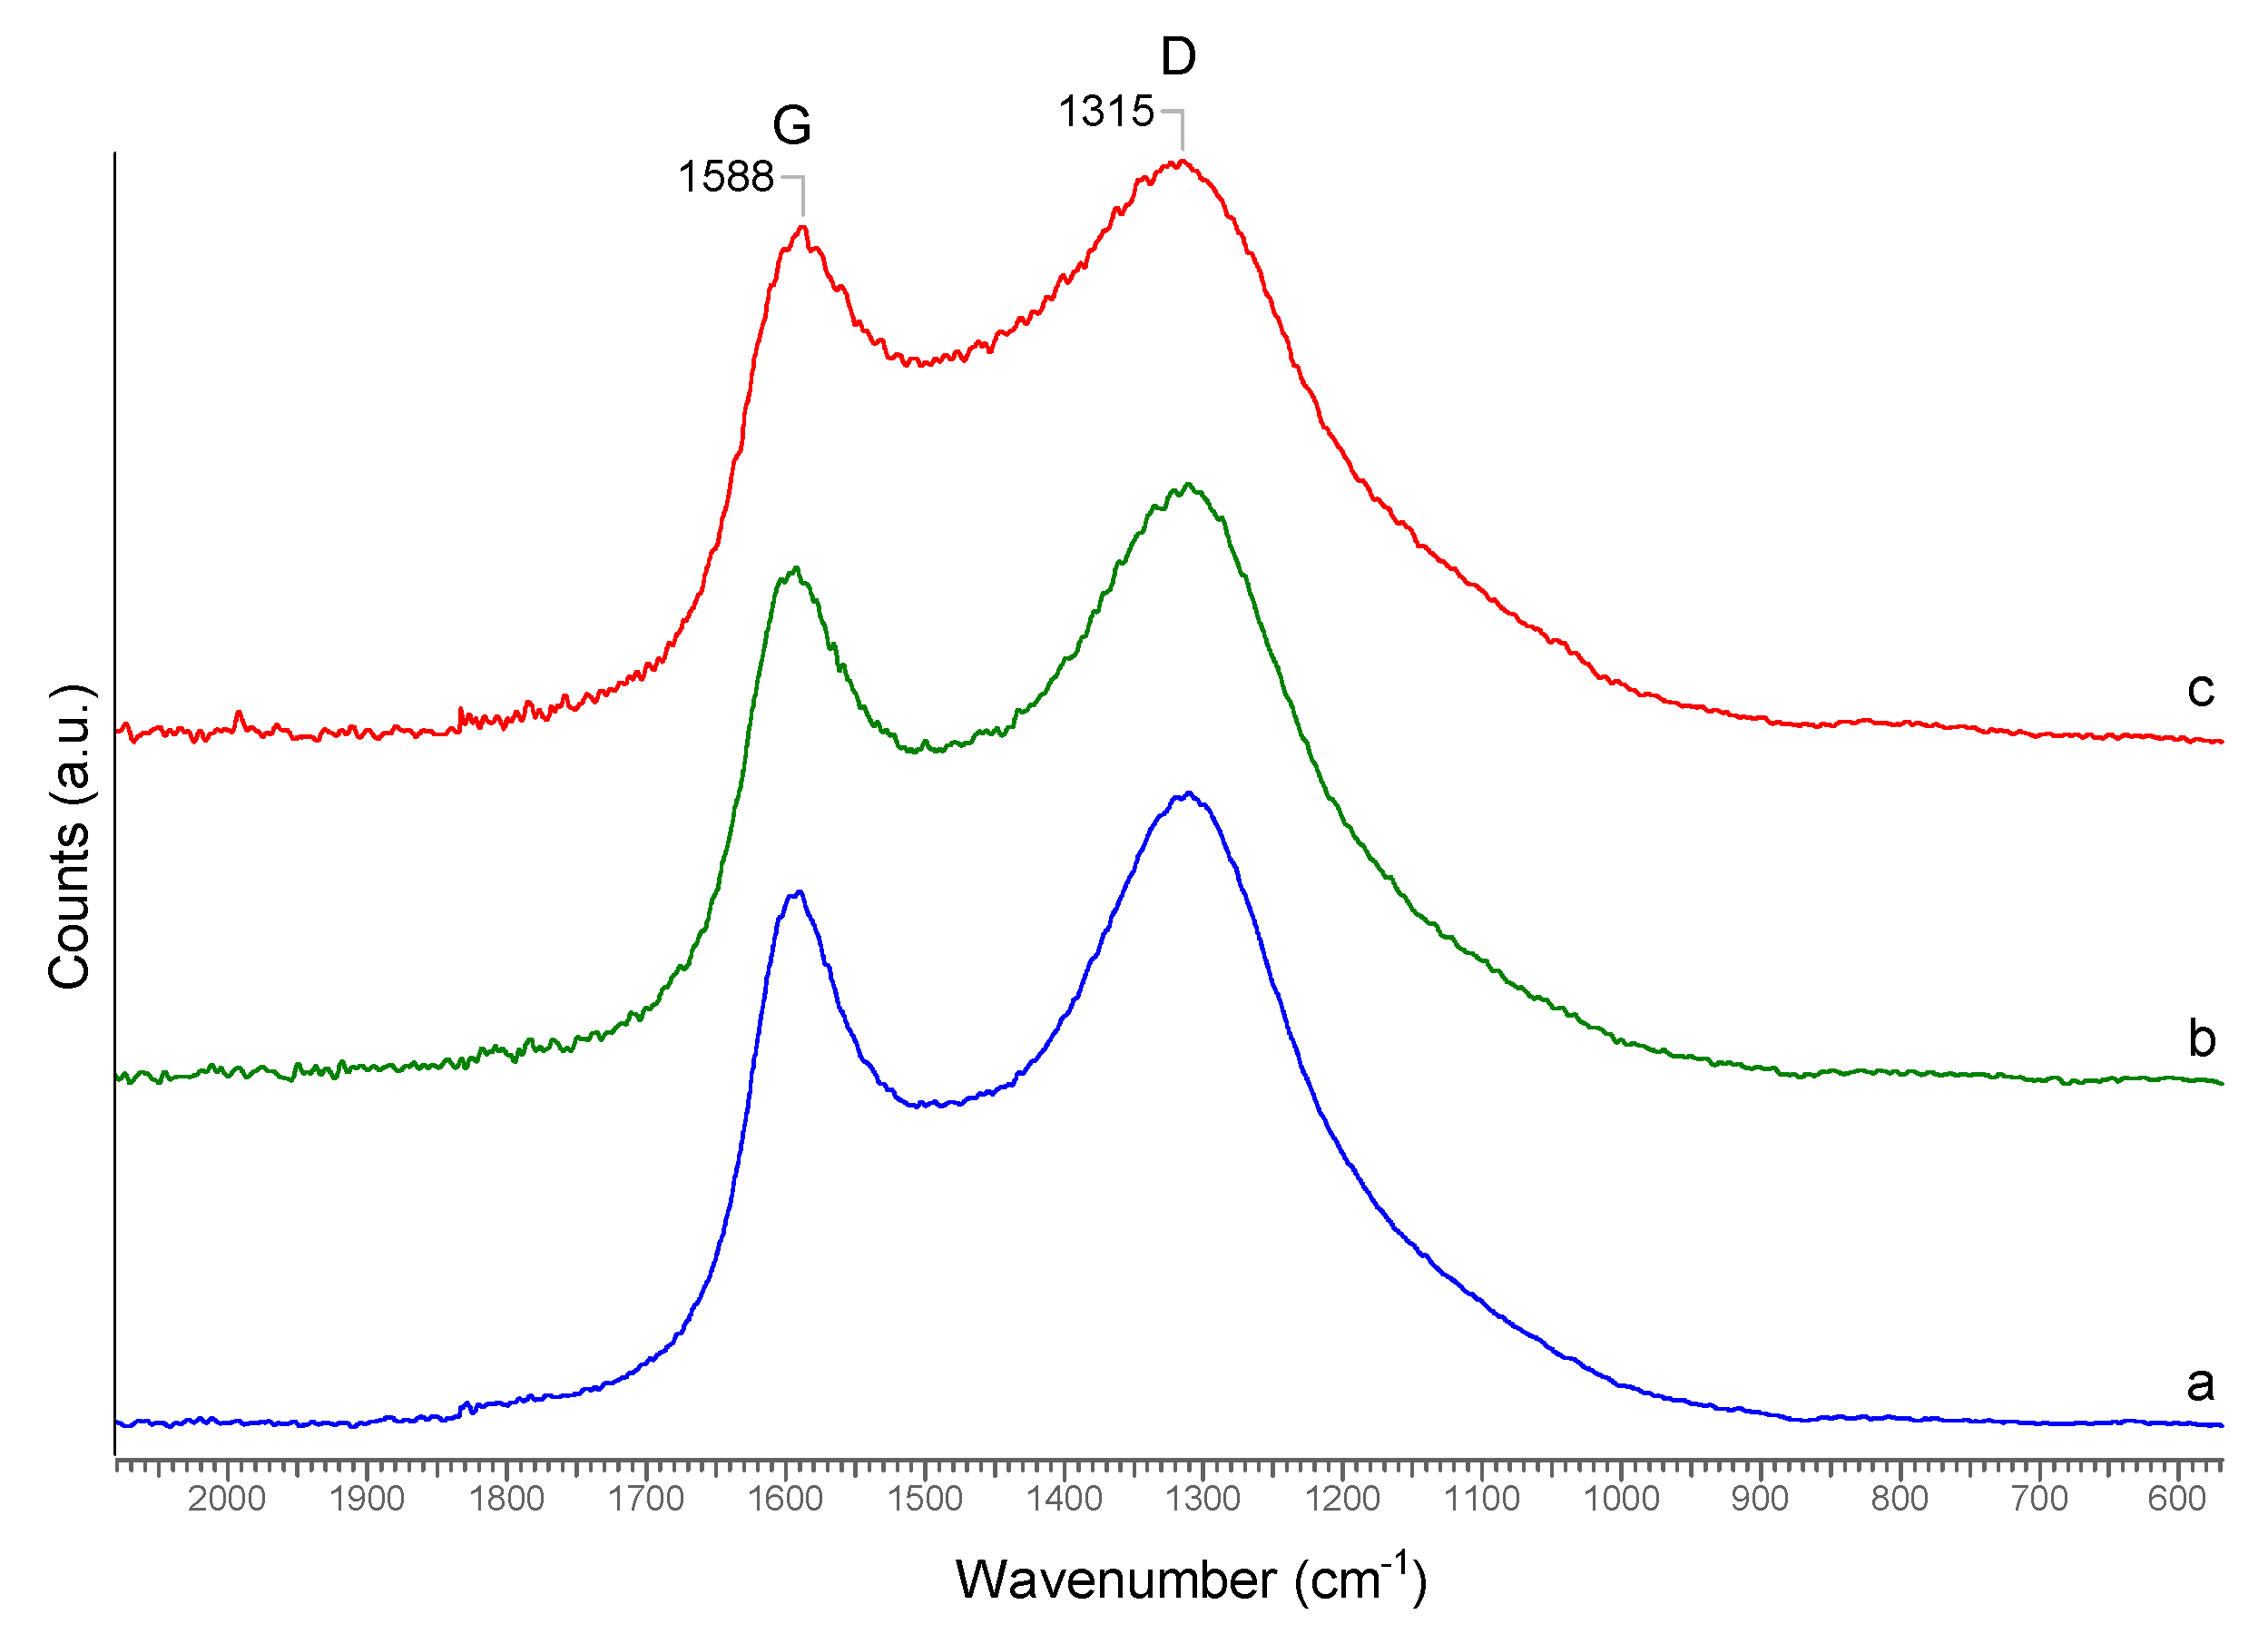
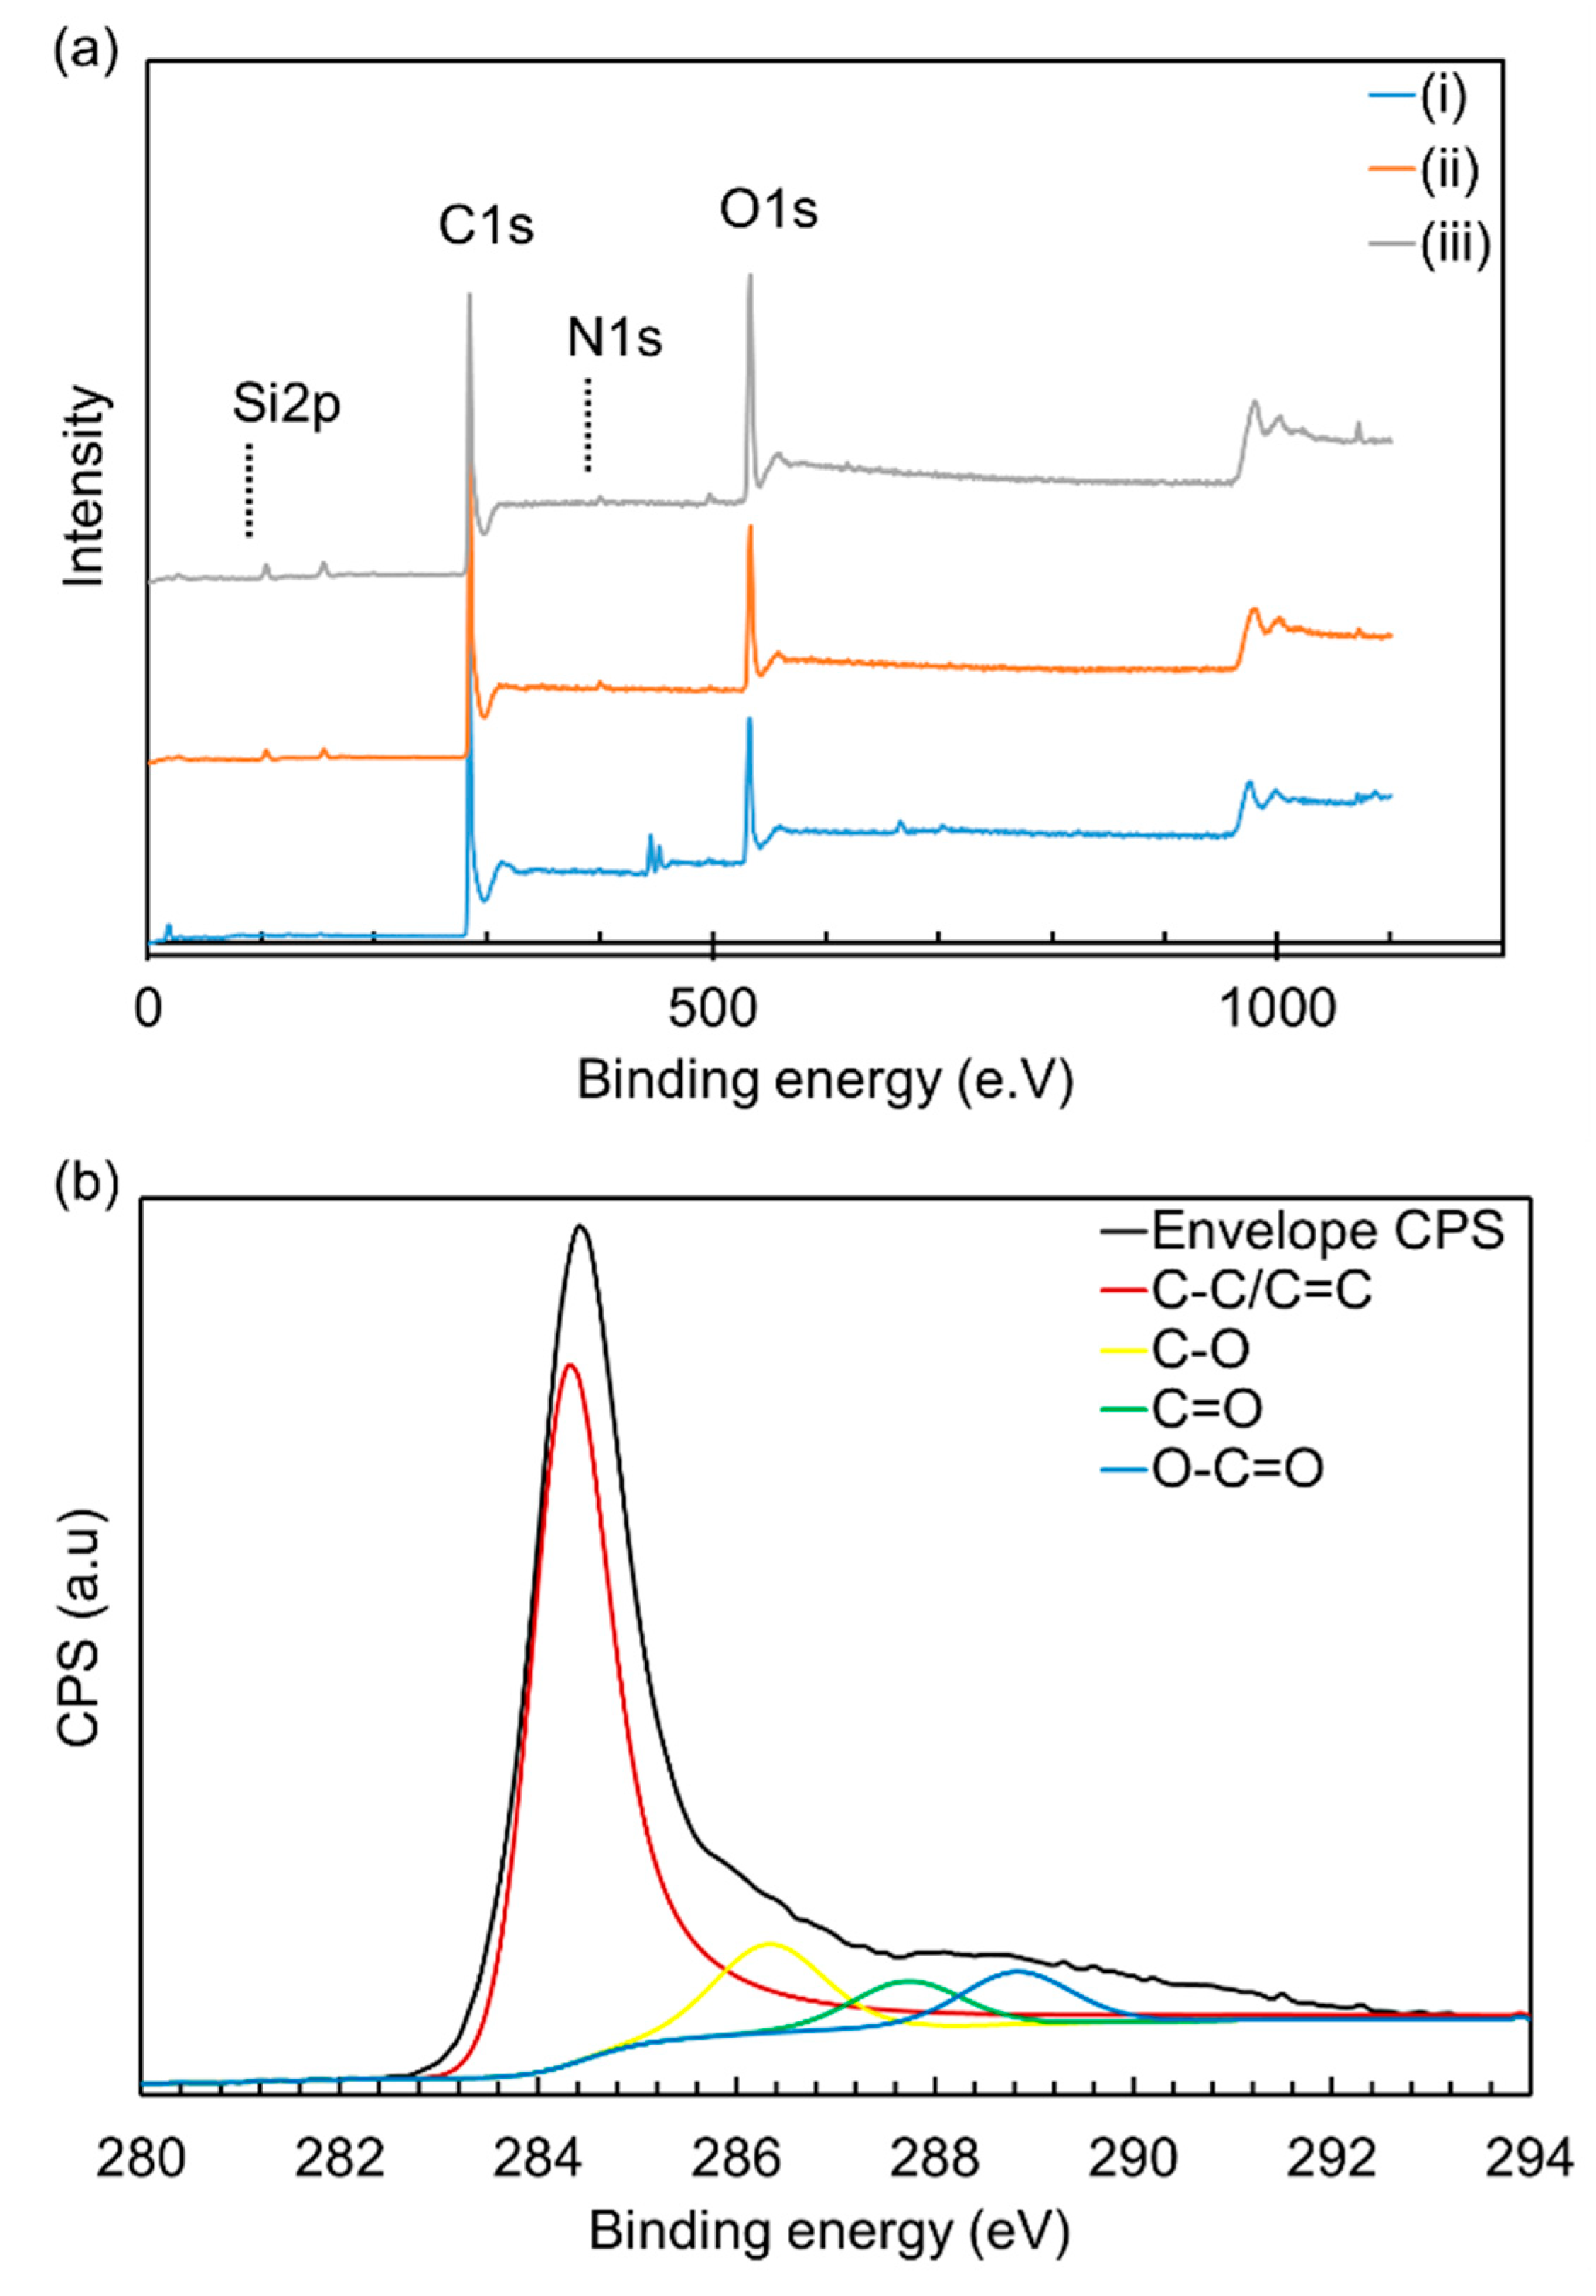
- Surface morphologies of HAC were confirmed using several physicochemical techniques such as BET, SEM, TEM, XRD, FTIR, Raman, and XPS analysis.
Supplementary Materials
Author Contributions
Funding
Acknowledgments
Conflicts of Interest
References
- Jain, A.; Balasubramanian, R.; Srinivasan, M. Hydrothermal conversion of biomass waste to activated carbon with high porosity: A review. Chem. Eng. J. 2016, 283, 789–805. [Google Scholar] [CrossRef]
- Li, X.; Liu, S.; Huang, Y.; Zheng, Y.; Harper, D.P.; Zheng, Z. Preparation and Foaming Mechanism of Pyrocarbon Foams Controlled by Activated Carbon as the Transplantation Core. ACS Sustain. Chem. Eng. 2018, 6, 3515–3524. [Google Scholar] [CrossRef]
- Kim, M.-H.; Kim, K.-B.; Park, S.-M.; Roh, K.C. Hierarchically structured activated carbon for ultracapacitors. Sci. Rep. 2016, 6, 21182. [Google Scholar] [CrossRef] [PubMed] [Green Version]
- Ba, H.; Wang, W.; Pronkin, S.; Romero, T.; Baaziz, W.; Nguyen-Dinh, L.; Chu, W.; Ersen, O.; Pham-Huu, C. Biosourced Foam-Like Activated Carbon Materials as High-Performance Supercapacitors. Adv. Sustain. Syst. 2018, 2. [Google Scholar] [CrossRef]
- Bansal, R.; Donnet, J.; Stoeckli, F. Active Carbon; Marcell Dekker: New York, NY, USA, 1988. [Google Scholar]
- Bardestani, R.; Kaliaguine, S. Steam activation and mild air oxidation of vacuum pyrolysis biochar. Biomass Bioenergy 2018, 108, 101–112. [Google Scholar] [CrossRef]
- Tay, T.; Ucar, S.; Karagöz, S. Preparation and characterization of activated carbon from waste biomass. J. Hazard. Mater. 2009, 165, 481–485. [Google Scholar] [CrossRef] [PubMed]
- Li, S.; Han, K.; Li, J.; Li, M.; Lu, C. Preparation and characterization of super activated carbon produced from gulfweed by KOH activation. Microporous Mesoporous Mater. 2017, 243, 291–300. [Google Scholar] [CrossRef]
- Afdhol, M.; Amiliana, R.; Hanafi, A. Preparation of Activated Carbon from Palm Shells Using KOH and ZnCl2 as the Activating Agent. In Proceedings of the IOP Conference Series: Earth and Environmental Science, Iasi, Romania, 17–18 May 2018. [Google Scholar]
- Hemp Fibres Better Than Graphene. Available online: http://www.bbc.com/news/science-environment-28770876 (accessed on 19 April 2018).
- Wang, H.; Xu, Z.; Kohandehghan, A.; Li, Z.; Cui, K.; Tan, X.; Stephenson, T.; King’ondu, C.K.; Holt, C.M.B.; Olsen, B.C.; et al. Interconnected Carbon Nanosheets Derived from Hemp for Ultrafast Supercapacitors with High Energy. ACS Nano 2013, 7, 5131–5141. [Google Scholar] [CrossRef] [PubMed]
- Yang, R.; Liu, G.; Xu, X.; Li, M.; Zhang, J.; Hao, X. Surface texture, chemistry and adsorption properties of acid blue 9 of hemp (Cannabis sativa L.) bast-based activated carbon fibers prepared by phosphoric acid activation. Biomass Bioenergy 2011, 35, 437–445. [Google Scholar] [CrossRef]
- Rosas, J.; Bedia, J.; Rodríguez-Mirasol, J.; Cordero, T. HEMP-derived activated carbon fibers by chemical activation with phosphoric acid. Fuel 2009, 88, 19–26. [Google Scholar] [CrossRef]
- Subramanian, V.; Luo, C.; Stephan, A.; Nahm, K.; Thomas, S.; Wei, B. Supercapacitors from activated carbon derived from banana fibers. J. Phys. Chem. C 2007, 111, 7527–7531. [Google Scholar] [CrossRef]
- Roman, S.; Nabais, J.V.; Ledesma, B.; González, J.; Laginhas, C.; Titirici, M. Production of low-cost adsorbents with tunable surface chemistry by conjunction of hydrothermal carbonization and activation processes. Microporous Mesoporous Mater. 2013, 165, 127–133. [Google Scholar] [CrossRef] [Green Version]
- Liu, Z.; Zhang, F.-S. Removal of copper(II) and phenol from aqueous solution using porous carbons derived from hydrothermal chars. Desalination 2011, 267, 101–106. [Google Scholar] [CrossRef]
- White, R.J.; Yoshizawa, N.; Antonietti, M.; Titirici, M.-M. A sustainable synthesis of nitrogen-doped carbon aerogels. Green Chem. 2011, 13, 2428–2434. [Google Scholar] [CrossRef]
- Fellinger, T.P.; White, R.J.; Titirici, M.M.; Antonietti, M. Borax-Mediated Formation of Carbon Aerogels from Glucose. Adv. Funct. Mater. 2012, 22, 3254–3260. [Google Scholar] [CrossRef]
- Fernandez, M.; Ledesma, B.; Román, S.; Bonelli, P.; Cukierman, A. Development and characterization of activated hydrochars from orange peels as potential adsorbents for emerging organic contaminants. Bioresour. Technol. 2015, 183, 221–228. [Google Scholar] [CrossRef] [PubMed]
- Gao, F.; Shao, G.; Qu, J.; Lv, S.; Li, Y.; Wu, M. Tailoring of porous and nitrogen-rich carbons derived from hydrochar for high-performance supercapacitor electrodes. Electrochim. Acta 2015, 155, 201–208. [Google Scholar] [CrossRef]
- Islam, M.A.; Tan, I.; Benhouria, A.; Asif, M.; Hameed, B. Mesoporous and adsorptive properties of palm date seed activated carbon prepared via sequential hydrothermal carbonization and sodium hydroxide activation. Chem. Eng. J. 2015, 270, 187–195. [Google Scholar] [CrossRef] [Green Version]
- Zhu, X.; Liu, Y.; Qian, F.; Zhou, C.; Zhang, S.; Chen, J. Role of hydrochar properties on the porosity of hydrochar-based porous carbon for their sustainable application. ACS Sustain. Chem. Eng. 2015, 3, 833–840. [Google Scholar] [CrossRef]
- Ding, L.; Zou, B.; Li, Y.; Liu, H.; Wang, Z.; Zhao, C.; Su, Y.; Guo, Y. The production of hydrochar-based hierarchical porous carbons for use as electrochemical supercapacitor electrode materials. Coll. Surf. A Physicochem. Eng. Asp. 2013, 423, 104–111. [Google Scholar] [CrossRef]
- Unur, E.; Brutti, S.; Panero, S.; Scrosati, B. Nanoporous carbons from hydrothermally treated biomass as anode materials for lithium ion batteries. Microporous Mesoporous Mater. 2013, 174, 25–33. [Google Scholar] [CrossRef]
- Gong, Y.; Wang, H.; Wei, Z.; Xie, L.; Wang, Y. An efficient way to introduce hierarchical structure into biomass-based hydrothermal carbonaceous materials. ACS Sustain. Chem. Eng. 2014, 2, 2435–2441. [Google Scholar] [CrossRef]
- Romero-Anaya, A.J.; Ouzzine, M.; Lillo-Ródenas, M.; Linares-Solano, A. Spherical carbons: Synthesis, characterization and activation processes. Carbon 2014, 68, 296–307. [Google Scholar] [CrossRef]
- Sevilla, M.; Fuertes, A.B. Sustainable porous carbons with a superior performance for CO2 capture. Energy Environ. Sci. 2011, 4, 1765–1771. [Google Scholar] [CrossRef]
- Falco, C.; Marco-Lozar, J.P.; Salinas-Torres, D.; Morallon, E.; Cazorla-Amorós, D.; Titirici, M.-M.; Lozano-Castelló, D. Tailoring the porosity of chemically activated hydrothermal carbons: Influence of the precursor and hydrothermal carbonization temperature. Carbon 2013, 62, 346–355. [Google Scholar] [CrossRef] [Green Version]
- Sevilla, M.; Fuertes, A.; Mokaya, R. High density hydrogen storage in superactivated carbons from hydrothermally carbonized renewable organic materials. Energy Environ. Sci. 2011, 4, 1400–1410. [Google Scholar] [CrossRef]
- Falco, C.; Sieben, J.M.; Brun, N.; Sevilla, M.; Van der Mauelen, T.; Morallón, E.; Cazorla-Amorós, D.; Titirici, M.M. Hydrothermal Carbons from Hemicellulose-Derived Aqueous Hydrolysis Products as Electrode Materials for Supercapacitors. ChemSusChem 2013, 6, 374–382. [Google Scholar] [CrossRef] [PubMed]
- Yang, S.-Y.; Chang, K.-H.; Huang, Y.-L.; Lee, Y.-F.; Tien, H.-W.; Li, S.-M.; Lee, Y.-H.; Liu, C.-H.; Ma, C.-C.M.; Hu, C.-C. A powerful approach to fabricate nitrogen-doped graphene sheets with high specific surface area. Electrochem. Commun. 2012, 14, 39–42. [Google Scholar] [CrossRef]
- Islam, M.A.; Ahmed, M.; Khanday, W.; Asif, M.; Hameed, B. Mesoporous activated carbon prepared from NaOH activation of rattan (Lacosperma secundiflorum) hydrochar for methylene blue removal. Ecotoxicol. Environ. Saf. 2017, 138, 279–285. [Google Scholar] [CrossRef] [PubMed]
- Foo, K.; Hameed, B. Preparation and characterization of activated carbon from pistachio nut shells via microwave-induced chemical activation. Biomass Bioenergy 2011, 35, 3257–3261. [Google Scholar] [CrossRef]
- Foo, K.; Hameed, B. Utilization of rice husks as a feedstock for preparation of activated carbon by microwave induced KOH and K2CO3 activation. Bioresour. Technol. 2011, 102, 9814–9817. [Google Scholar] [CrossRef] [PubMed]
- Lu, Y.; Zhang, S.; Yin, J.; Bai, C.; Zhang, J.; Li, Y.; Yang, Y.; Ge, Z.; Zhang, M.; Wei, L. Mesoporous activated carbon materials with ultrahigh mesopore volume and effective specific surface area for high performance supercapacitors. Carbon 2017, 124, 64–71. [Google Scholar] [CrossRef]
- Zhao, D.; Feng, J.; Huo, Q.; Melosh, N.; Fredrickson, G.H.; Chmelka, B.F.; Stucky, G.D. Triblock copolymer syntheses of mesoporous silica with periodic 50 to 300 angstrom pores. Science 1998, 279, 548–552. [Google Scholar] [CrossRef] [PubMed]
- Zou, L.; Li, L.; Song, H.; Morris, G. Using mesoporous carbon electrodes for brackish water desalination. Water Res. 2008, 42, 2340–2348. [Google Scholar] [CrossRef] [PubMed]
- Suganuma, S.; Nakajima, K.; Kitano, M.; Yamaguchi, D.; Kato, H.; Hayashi, S.; Hara, M. Hydrolysis of cellulose by amorphous carbon bearing SO3H, COOH, and OH groups. J. Am. Chem. Soc. 2008, 130, 12787–12793. [Google Scholar] [CrossRef] [PubMed]
- Infraed and Ramn Characteristic Group Frequencies. Available online: https://www.researchgate.net/profile/Muzammil_Iqbal2/post/Authentic_IR_spectral_database/attachment/59d6591679197b80779aebbd/AS:540994395439105@1505994523971/download/Infrared+and+Raman+Characteristic+Group+Frequencies+by+George+Socrates.pdf (accessed on 19 April 2018).
- Barkauskas, J.; Dervinyte, M. Investigation of the functional groups on the surface of activated carbons. J. Serbian Chem. Soc. 2004, 69, 363–375. [Google Scholar] [CrossRef]
- Reina, A.; Jia, X.; Ho, J.; Nezich, D.; Son, H.; Bulovic, V.; Dresselhaus, M.S.; Kong, J. Large area, few-layer graphene films on arbitrary substrates by chemical vapor deposition. Nano Lett. 2008, 9, 30–35. [Google Scholar] [CrossRef] [PubMed]
- Liu, Y.; Zhao, Y.; Li, K.; Wang, Z.; Tian, P.; Liu, D.; Yang, T.; Wang, J. Activated carbon derived from chitosan as air cathode catalyst for high performance in microbial fuel cells. J. Power Sources 2018, 378, 1–9. [Google Scholar] [CrossRef]
- Xu, S.; Yong, L.; Wu, P. One-pot, green, rapid synthesis of flowerlike gold nanoparticles/reduced graphene oxide composite with regenerated silk fibroin as efficient oxygen reduction electrocatalysts. ACS Appl. Mater. Interfaces 2013, 5, 654–662. [Google Scholar] [CrossRef] [PubMed]
- Maslova, O.; Ammar, M.; Guimbretière, G.; Rouzaud, J.-N.; Simon, P. Determination of crystallite size in polished graphitized carbon by Raman spectroscopy. Phys. Rev. B 2012, 86. [Google Scholar] [CrossRef]
- Matthews, M.; Pimenta, M.; Dresselhaus, G.; Dresselhaus, M.; Endo, M. Origin of dispersive effects of the Raman D band in carbon materials. Phys. Rev. B 1999, 59. [Google Scholar] [CrossRef]
- Tai, Z.; Zhang, Q.; Liu, Y.; Liu, H.; Dou, S. Activated carbon from the graphite with increased rate capability for the potassium ion battery. Carbon 2017, 123, 54–61. [Google Scholar] [CrossRef]
- Keeping, M.; Reynolds, O. Silicon in agriculture: New insights, new significance and growing application. Ann. Appl. Biol. 2009, 155. [Google Scholar] [CrossRef]
- Yang, D.; Velamakanni, A.; Bozoklu, G.; Park, S.; Stoller, M.; Piner, R.D.; Stankovich, S.; Jung, I.; Field, D.A.; Ventrice, C.A. Chemical analysis of graphene oxide films after heat and chemical treatments by X-ray photoelectron and Micro-Raman spectroscopy. Carbon 2009, 47, 145–152. [Google Scholar] [CrossRef]
- Seah, M. The quantitative analysis of surfaces by XPS: A review. Surf. Interface Anal. 1980, 2, 222–239. [Google Scholar] [CrossRef]
- Burke, G.M.; Wurster, D.E.; Berg, M.J.; Veng-Pedersen, P.; Schottelius, D.D. Surface characterization of activated charcoal by X-ray photoelectron spectroscopy (XPS): Correlation with phenobarbital adsorption data. Pharm. Res. 1992, 9, 126–130. [Google Scholar] [CrossRef] [PubMed]
- Smíšek, M.; Černý, S. Active Carbon: Manufacture, Properties and Applications; Elsevier Publishing Company: New York, NY, USA, 1970; Volume 12. [Google Scholar]
- Lillo-Ródenas, M.; Cazorla-Amorós, D.; Linares-Solano, A. Understanding chemical reactions between carbons and NaOH and KOH: An insight into the chemical activation mechanism. Carbon 2003, 41, 267–275. [Google Scholar] [CrossRef]
- Lillo-Ródenas, M.; Juan-Juan, J.; Cazorla-Amorós, D.; Linares-Solano, A. About reactions occurring during chemical activation with hydroxides. Carbon 2004, 42, 1371–1375. [Google Scholar] [CrossRef]
- Viculis, L.M.; Mack, J.J.; Kaner, R.B. A chemical route to carbon nanoscrolls. Science 2003, 299, 1361. [Google Scholar] [CrossRef] [PubMed]


| Sample | Biochar Synthesis Temperature (°C) | Activating Reagent | Weight Ratio of Biochar and Activating Reagent | BET Surface Area (m2/g) | Langmuir Surface Area (m2/g) | Pore Volume (cm3/g) | Average Pore Size (nm) |
|---|---|---|---|---|---|---|---|
| Hemp-Derived Biochar | -- | -- | -- | 2 | 3 | 0.001 | -- |
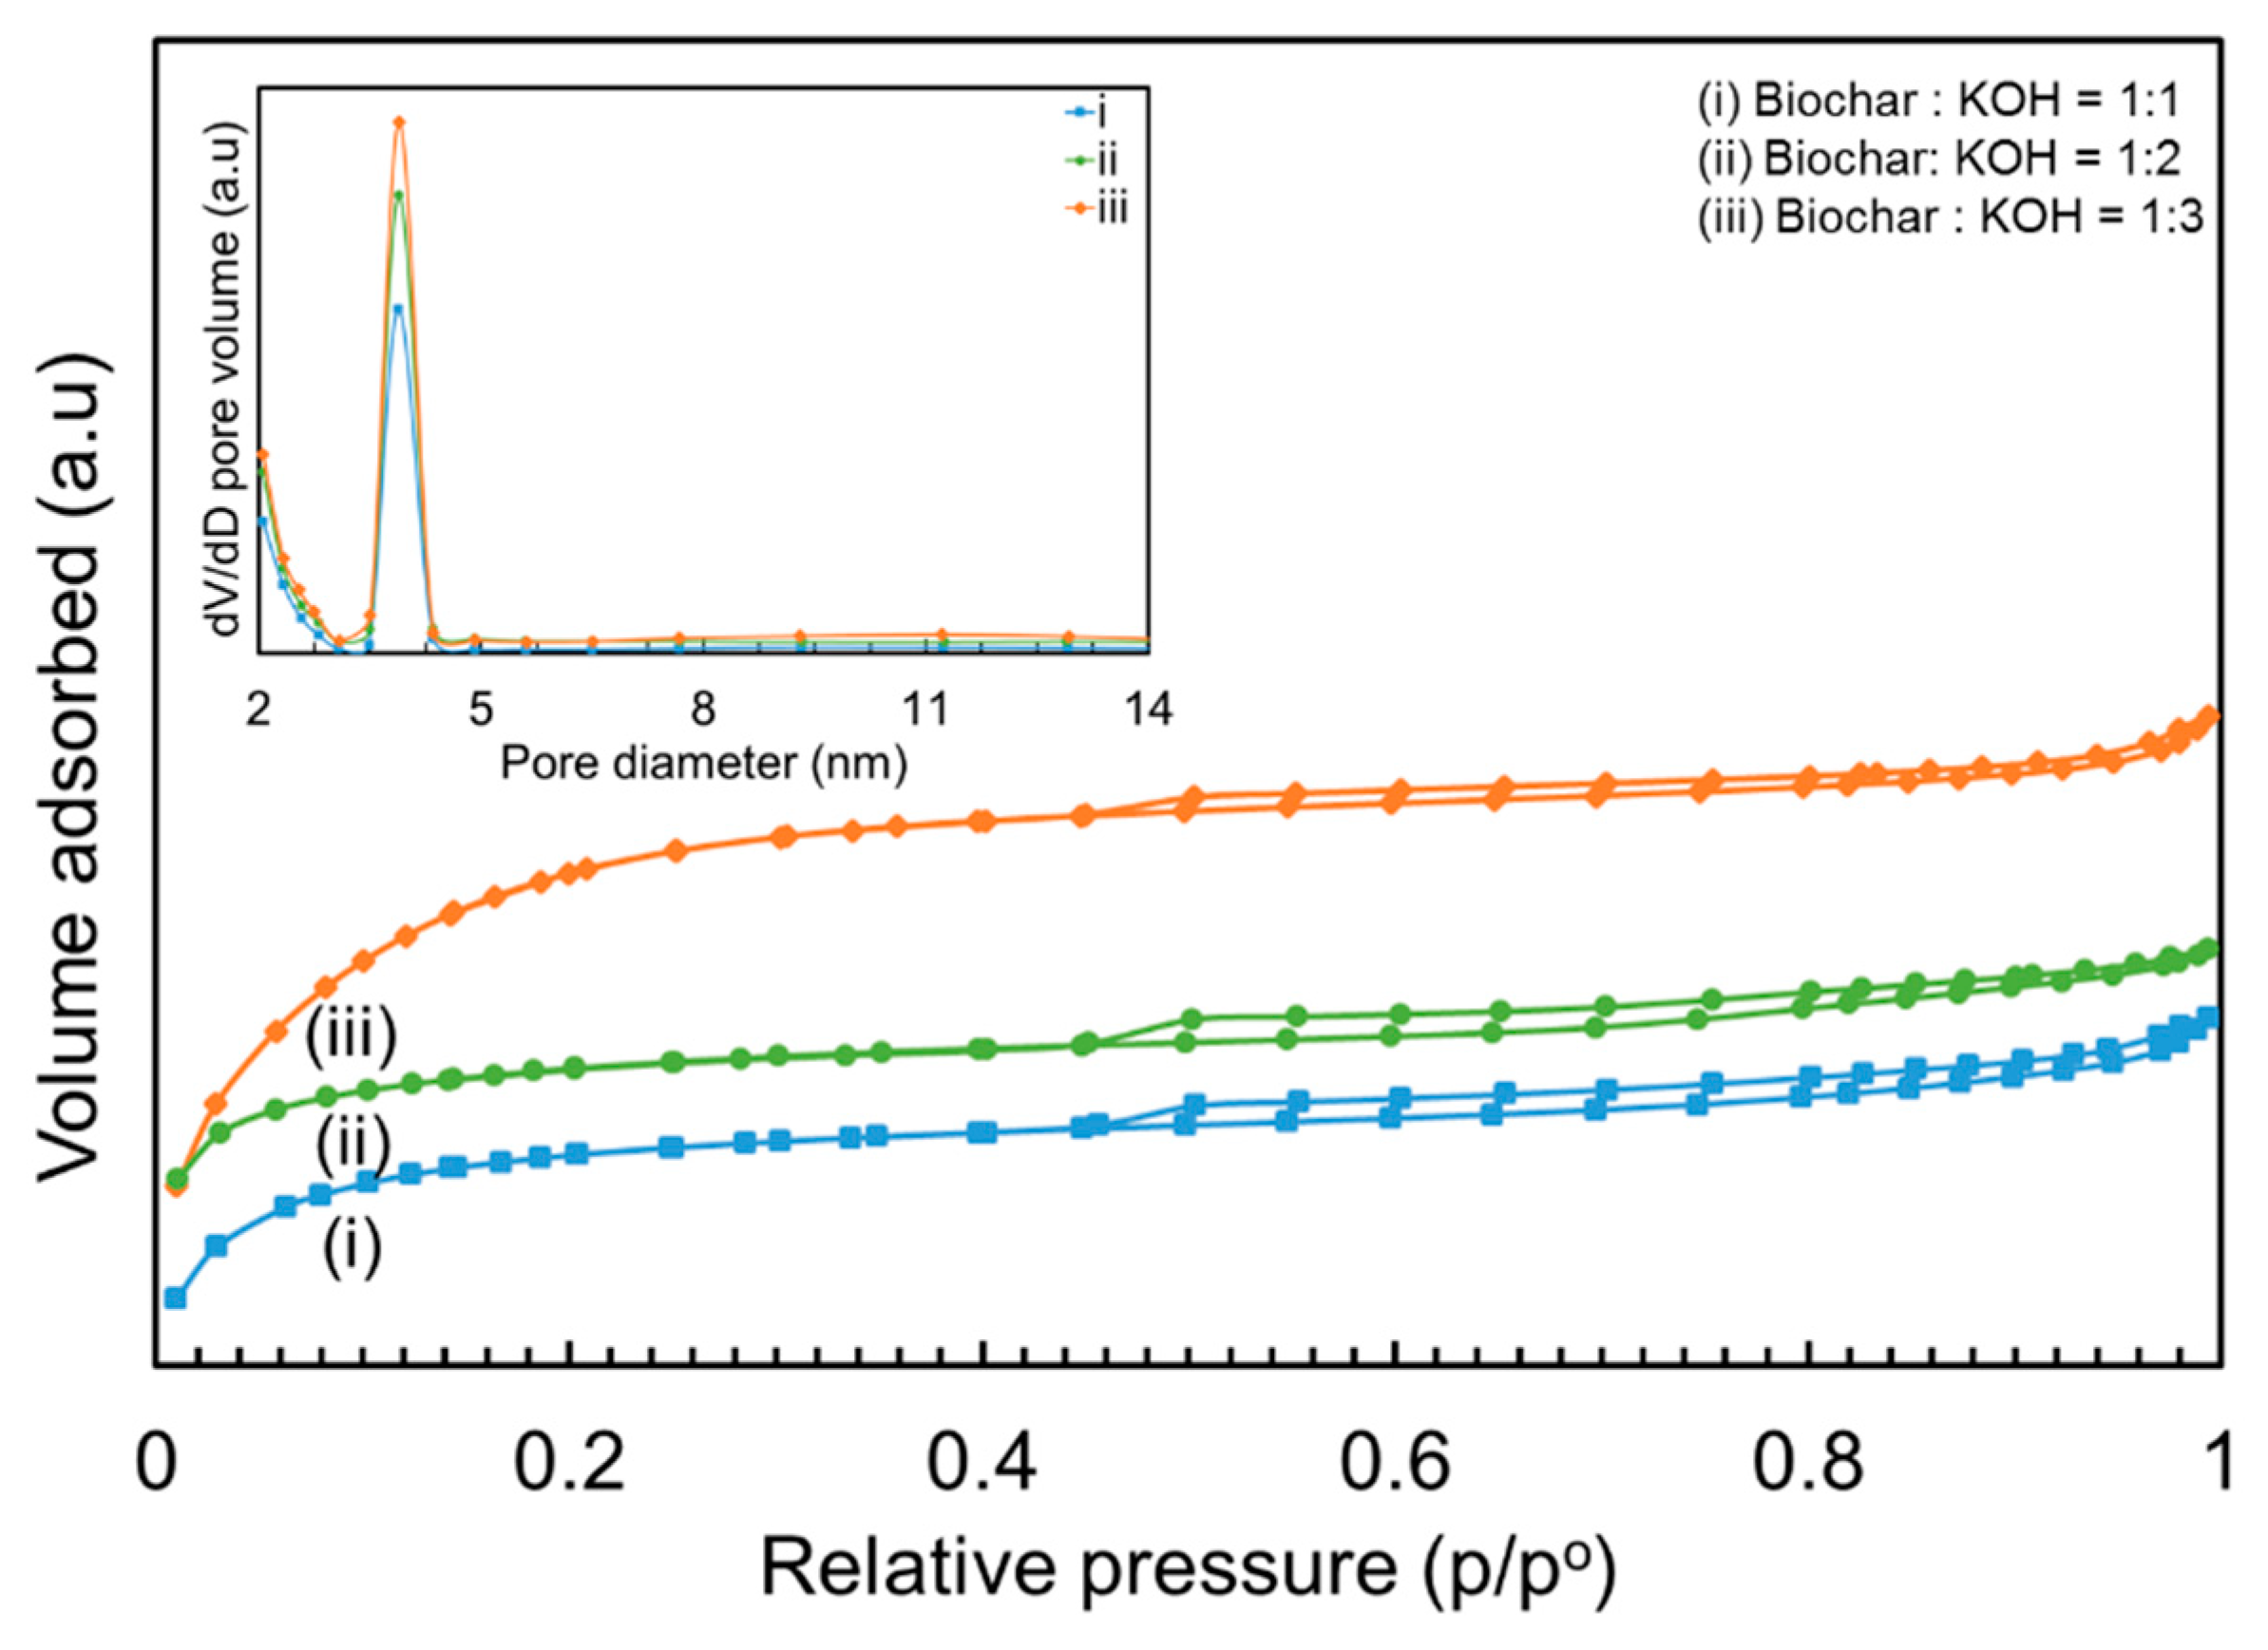
| HAC | 390 | KOH | 1:1 | 1566 | 2078 | 0.810 | 4.6 |
| 450 | KOH | 1:1 | 1587 | 2090 | 0.811 | 4.6 | |
| 500 | KOH | 1:1 | 1598 | 2101 | 0.813 | 4.6 | |
| 390 | KOH | 1:2 | 1992 | 2647 | 1.011 | 4.3 | |
| 390 | KOH | 1:3 | 2425 | 3363 | 1.216 | 2.9 | |
| 390 | NaOH | 1:1 | 1252 | 1673 | 0.662 | 4.3 | |
| 390 | NaOH | 1:2 | 1851 | 2525 | 0.925 | 3.1 | |
| 390 | NaOH | 1:3 | 2124 | 2848 | 1.017 | 2.9 |
| Biomass Feedstocks | Activator Used | BET Surface Area (m2/g) |
|---|---|---|
| Walnut shell [15] | CO2 | 379 |
| Sunflower stem [15] | CO2 | 438 |
| Olive stone [15] | CO2 | 438 |
| Rice husk [16] | CO2 | 446 |
| Glucose/ovalbumin [17] | -- | 476 |
| Pinewood [16] | CO2 | 569 |
| Glucose/borax [18] | -- | 614 |
| Orange peel [19] | CO2 | 618 |
| Glucose [20] | KOH | 1197 |
| Palm date seed [21] | NaOH | 1282 |
| Desert shrub [22] | ZnCl2 | 1296 |
| Rice husk [23] | H3PO4 | 1498 |
| Hazelnut shell [24] | KOH | 1700 |
| Glucose [25] | KOH | 1704 |
| Sucrose [26] | H3PO4 | 2120 |
| Glucose [26] | NaOH | 2129 |
| Starch [27] | KOH | 2190 |
| Rye straw [28] | KOH | 2200 |
| Eucalyptus sawdust [29] | KOH | 2252 |
| Corncobs [30] | KOH | 2300 |
| Hemp bast fiber (this study) | KOH | 2425 |
| Ratios | λ = 785 nm | λ = 633 nm | λ = 514 nm | |||
|---|---|---|---|---|---|---|
| ID/IG | ΓG (cm−1) | ID/IG | La (nm) | ID/IG | La (nm) | |
| 1:1 | 1.37 | 92.8 | 1.112 ± 0.007 | 7.46 ± 0.05 | 1.008 ± 0.043 | 4.33 ± 0.18 |
| 1:2 | 1.37 | 102.2 | 1.105 ± 0.035 | 7.50 ± 0.24 | 1.028 ± 0.017 | 4.24 ± 0.07 |
| 1:3 | 1.44 | 111.7 | 1.191 ± 0.016 | 6.96 ± 0.09 | 1.071 ± 0.020 | 4.07 ± 0.08 |
| Ratios | Atomic Percentages | |||
|---|---|---|---|---|
| C | O | N | Si | |
| 1:1 | 80.0 | 16.6 | 1.1 | 2.3 |
| 1:2 | 73.1 | 22.4 | 1.1 | 3.4 |
| 1:3 | 70.7 | 24.2 | 0.9 | 4.2 |
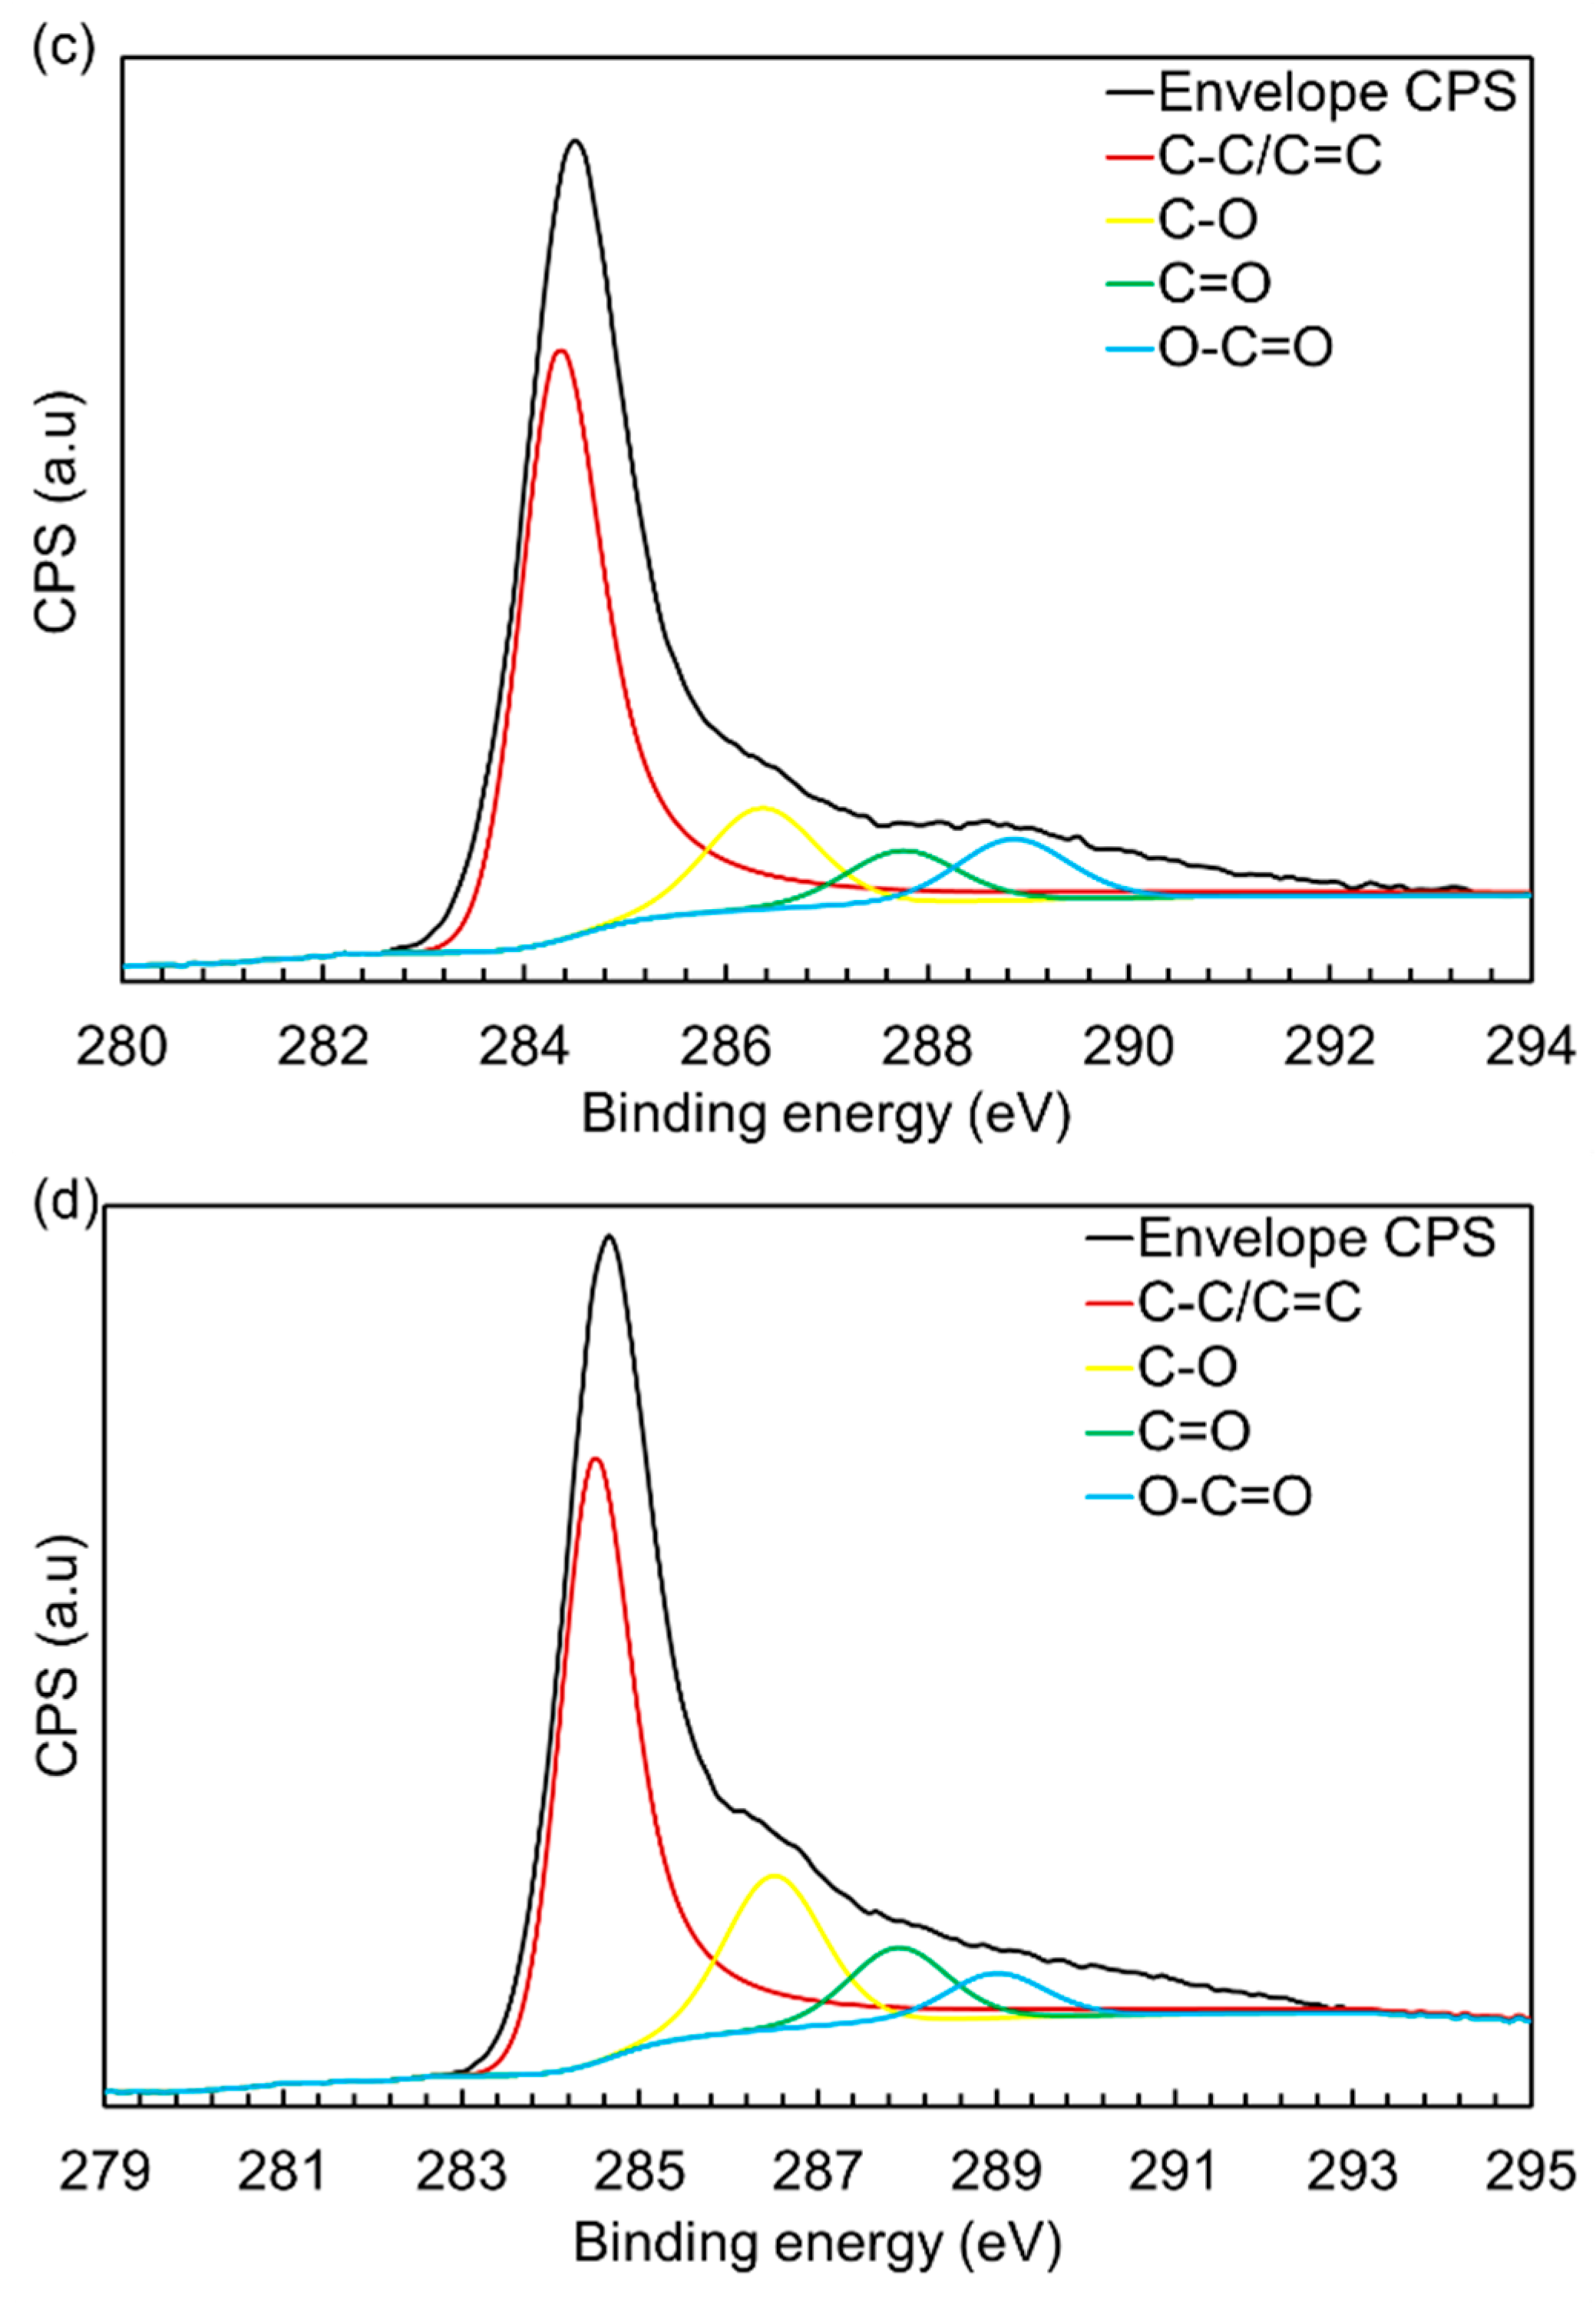
| Samples | Ratios | Percentages of Relative Content | |||
|---|---|---|---|---|---|
| C–C/C=C | C–O | C=O | O–C=O | ||
| HAC | 1:1 | 78.3 | 10.3 | 5.4 | 6.0 |
| 1:2 | 76.1 | 11.2 | 5.9 | 6.8 | |
| 1:3 | 75.1 | 12.2 | 6.5 | 6.2 | |
| SuperChar | - | 73.4 | 15.7 | 5.7 | 5.1 |
| Darco KB-B | - | 78.1 | 12.8 | 6.2 | 2.9 |
| Norit B Supra | - | 78.6 | 15.1 | 2.6 | 3.7 |
| Norit U.S.P. XX | - | 84.9 | 8.8 | 3.2 | 3.1 |
© 2018 by the authors. Licensee MDPI, Basel, Switzerland. This article is an open access article distributed under the terms and conditions of the Creative Commons Attribution (CC BY) license (http://creativecommons.org/licenses/by/4.0/).
Share and Cite
Hossain, M.Z.; Wu, W.; Xu, W.Z.; Chowdhury, M.B.I.; Jhawar, A.K.; Machin, D.; Charpentier, P.A. High-Surface-Area Mesoporous Activated Carbon from Hemp Bast Fiber Using Hydrothermal Processing. C 2018, 4, 38. https://0-doi-org.brum.beds.ac.uk/10.3390/c4030038
Hossain MZ, Wu W, Xu WZ, Chowdhury MBI, Jhawar AK, Machin D, Charpentier PA. High-Surface-Area Mesoporous Activated Carbon from Hemp Bast Fiber Using Hydrothermal Processing. C. 2018; 4(3):38. https://0-doi-org.brum.beds.ac.uk/10.3390/c4030038
Chicago/Turabian StyleHossain, Md Zakir, Wei Wu, William Z. Xu, Muhammad B. I. Chowdhury, Anil Kumar Jhawar, Devin Machin, and Paul A. Charpentier. 2018. "High-Surface-Area Mesoporous Activated Carbon from Hemp Bast Fiber Using Hydrothermal Processing" C 4, no. 3: 38. https://0-doi-org.brum.beds.ac.uk/10.3390/c4030038