Microwave-Driven Plasma-Mediated Methane Cracking: Product Carbon Characterization


1
John and Willie Leone Family Department of Energy and Mineral Engineering and the EMS Energy Institute, Penn State University, University Park, PA 16802, USA
2
H Quest Vanguard Inc., 750 William Pitt Way, Pittsburgh, PA 15238, USA
*
Author to whom correspondence should be addressed.
C 2018, 4(4), 61; https://0-doi-org.brum.beds.ac.uk/10.3390/c4040061
Submission received: 1 October 2018
/
Revised: 20 October 2018
/
Accepted: 1 November 2018
/
Published: 8 November 2018
(This article belongs to the Special Issue Plasma Processing for Carbon-based Materials)
Abstract
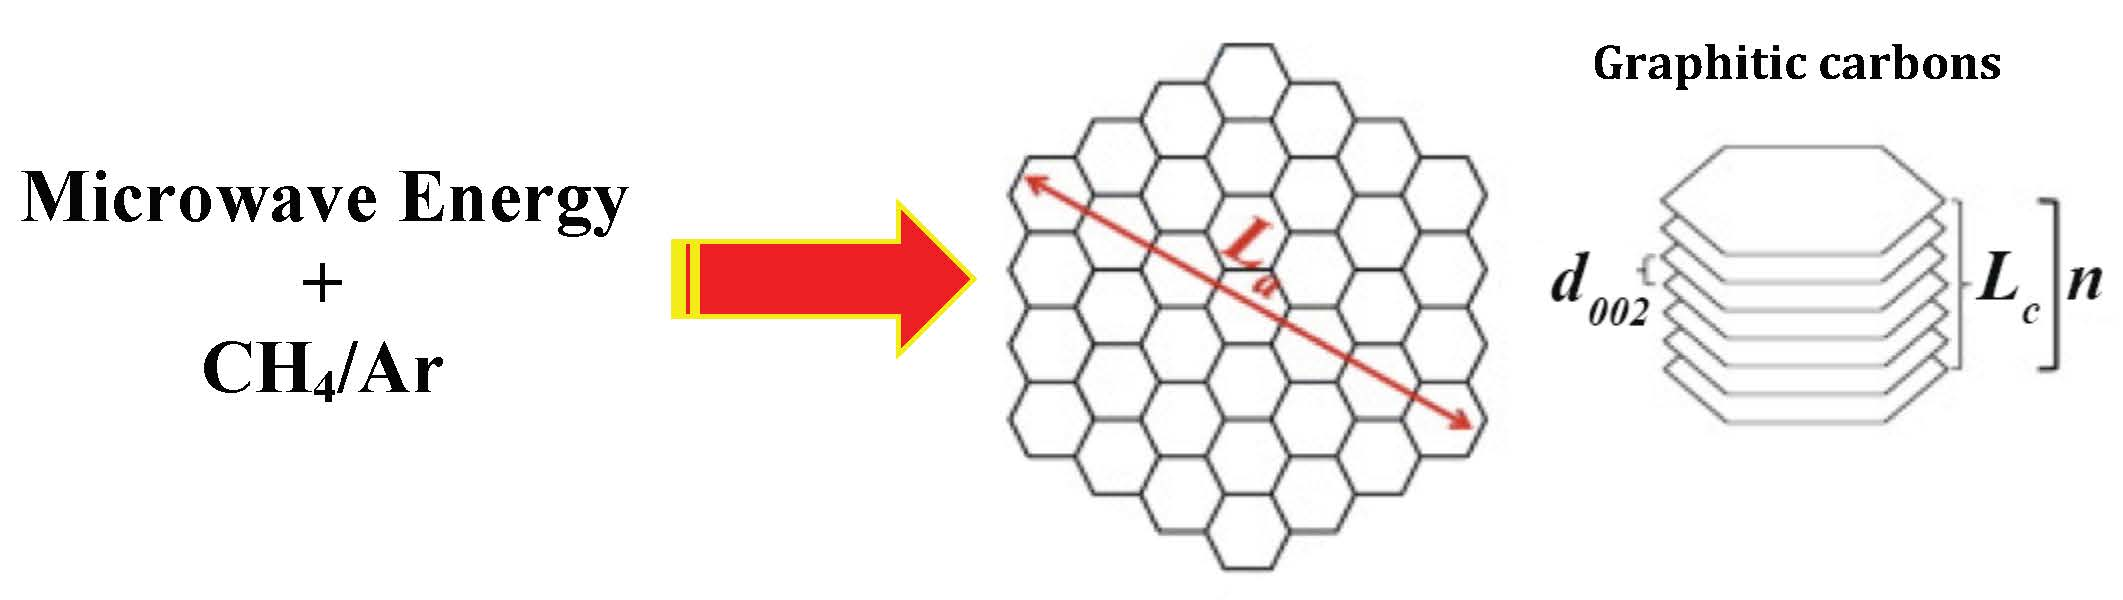
:Methane is the primary industrial H2 source, with the vast majority produced by steam reforming of methane—a highly CO2- and water-intensive process. Alternatives to steam reforming, such as microwave-driven plasma-mediated methane decomposition, offer benefits of no water consumption and zero CO2 process emissions while also producing solid carbon formed by pyrolytic reactions and aided by a plasma reactive environment. The economic viability of pyrolytic methane decomposition as a hydrogen source will depend upon the commercial applications of the solid carbon product—which, in turn, will depend upon its physical and chemical characteristics. This study focuses on material characterization of the solid carbon (secondary) product. Characterization by high-resolution transmission electron microscopy reveals forms ranging from graphitic to amorphous. Thermogravimetric analyses reveal three forms by their differing oxidative reactivity, while X-ray diffraction analyses support the different crystalline forms as suggested by Thermogravimetric analysis. Plasma perturbation of the radical pool, elevating radical temperatures and boosting concentrations, is proposed as altering the reaction paths towards solid carbon formation, resulting in the different sp2 forms.

1. Introduction
This study focuses on the carbon produced by plasma-mediated methane decomposition. As background, while hydrogen is envisioned as the energy carrier (fuel) of the future, at present-day, it is a crucial feedstock for various manufacturing industries and petroleum refining. Presently, 25 million metric tons are produced annually worldwide from varied fossil fuels [1], with the United States producing nearly 11 million tons annually, mainly from steam reforming of natural gas (~95%) for use in oil refineries, methanol, and ammonia production [2]. Steam reforming of methane (SMR), the present industrial practice produces 13.7 kg CO2 (equiv)/kg of net hydrogen [3], and consumes 19.8 L of water per kg of hydrogen [4].
Recognizing both present day H2 consumption and costs of present production processes, attention has focused on more sustainable methods, such as thermal decomposition [5]. The benefits include reduced water requirements and lowered CO2 emissions, dependent upon the source of the thermal energy and whether cooling is required. However, stripping H2 from methane requires a temperature of 1200 °C, with an associated energy cost of 74.8 kJ/mole CH4 [2,6,7]. For this reason, considerable study has been given to catalyzed decomposition, lowering the temperature and thermal energy input using metals, oxides, or carbons as catalysts [7].
Thermocatalytic decomposition of methane is an attractive alternative to conventional steam reforming because the process does not generate CO/CO2 byproducts or consume water resources, so the need for water-gas shift and CO2 removal stages, along with stock desulfurization and steam generation, are eliminated. Moreover, the energy requirement for catalytic methane cracking (37.4 kJ/mole of H2) is approximately half that for steam reforming (63.3 kJ/mole of H2) [7]. However, metals and oxides suffer from coking and intolerance to poisons, such as sulfur, whereas carbon is resilient [7,8,9]. However, all forms of carbon studied, to date, deactivate, imposing a cost and limitation for scale-up [9,10].
Microwave (MW) decomposition offers non-thermal processing using high energy electrons to initiate methane decomposition, thereby lowering the required temperature and associated energy input [11]. Moreover, the MW approach offers a green path for the H2 from methane, as no water is required with zero CO2 emission [11,12]. With industrial scale MW systems having 70–80% electrical conversion efficiency to MW radiation [13,14], the energy economics have favorable potential. Nominally, even thermally driven methane decomposition has an energy efficiency of ~60%, comparable to SMR [15].
Thermal decomposition of methane using carbon as a catalyst has been studied for H2 generation [2,7]. Muradov et al., in particular, presented experimental data on the catalytic activity of different carbon materials ranging from varied carbon blacks, carbon nanotubes, assorted activated carbons, and other chars and cokes [16]. Studies using microwave heating (MW) are fewer. Fidalgo et al., using a fixed bed reactor, noted the formation of carbon nanofibers on the activated carbon surface using the activated carbon both as catalyst and as microwave receptor for CH4 decomposition [17]. Dominguez, also using a fixed bed reactor, sought to combine microwave heating with the use of a low-cost granular activated carbon as catalyst for the production of CO2-free hydrogen by methane decomposition in a fixed bed quartz-tube flow reactor [18]. In a recent study, Muradov et al. reported on the thermal decomposition of natural gas and methane using plasma-generated carbon aerosols [19]. Produced using a modified gliding arc plasma, these carbons were tested for their catalytic activity in a second, separate reactor and later measurement. Though the nanostructure was noted to be irregular, the single blurred high resolution transmission electron micrograph (HRTEM) image that was presented did not allow further assessment.
In prior reported studies, the MW processing has been employed in Wave Liquefaction™, (WL™), a patented technology for the conversion of coal to liquids [20]. The focused MW energy induces rapid heating of coal particles within the non-equilibrium plasma environment, while methane is simultaneously partially decomposed into both H-atoms and methyl radicals. Methane decomposition products actively cap free radicals formed by secondary pyrolysis reactions, while also serving to upgrade products [21]. The result is higher conversion yield and selectivity to liquid products [21]. Prior papers have reported these results with detailed speciation by GC-MS [22]. In general, MW energy offers a number of advantages over conventional heating: rapid, noncontact heating, and volumetric heating with quick start-up and shutdown.
In this study, we sought to study the effects of rapid and selective heating of the MW upon the carbon aerosol formed and the plasma activation of the methane, in concert. Gas-to-particle conversion is known in hydrocarbon processing by plasmas [23]. In thermal plasmas, temperature drives pyrolysis processes with the plasma features being secondary. Past a threshold concentration, polycyclic aromatic hydrocarbons form and cluster to begin particle formation and growth. In non-thermal plasmas, the plasma characteristics, such as electron concentration and energy distribution, are far more important as these now drive radical formation and ensuing reactions [24]. The former process is akin to soot formation in flames, wherein combustion reactions drive the pyrolysis reactions, with additional contributions from oxidative reactions and intermediates. The latter process is differentiated by non-equilibrium distributions of energetic species and energy across modes, ranging from electronic to translational.
Though the focus of methane decomposition is normally on hydrogen as the primary product of interest, if MW conversion is to be conducted at scale, the quantity of solid carbon product generated would be vast. For example, producing ~2% of the present-day H2 consumed worldwide would yield ~3 million metric tons of solid carbon [2], roughly 25% of the annual carbon black production worldwide. Separate from such a large-scale quantity, the economics of the process will be improved if this carbon has commercial value. This latter aspect is essentially a necessity while developing the technology towards scale [25]. Potential uses include reinforcing and filler applications, presently met by carbon blacks, graphite powder applications, electric and electronic applications, construction material, as substitute for metallurgical coke, or even for soil amendment [26]. This is the motivation for this characterization study of the carbon produced by MW pyrolysis of methane, reported here.
2. Materials and Methods
2.1. Reactor and Supporting Equipment
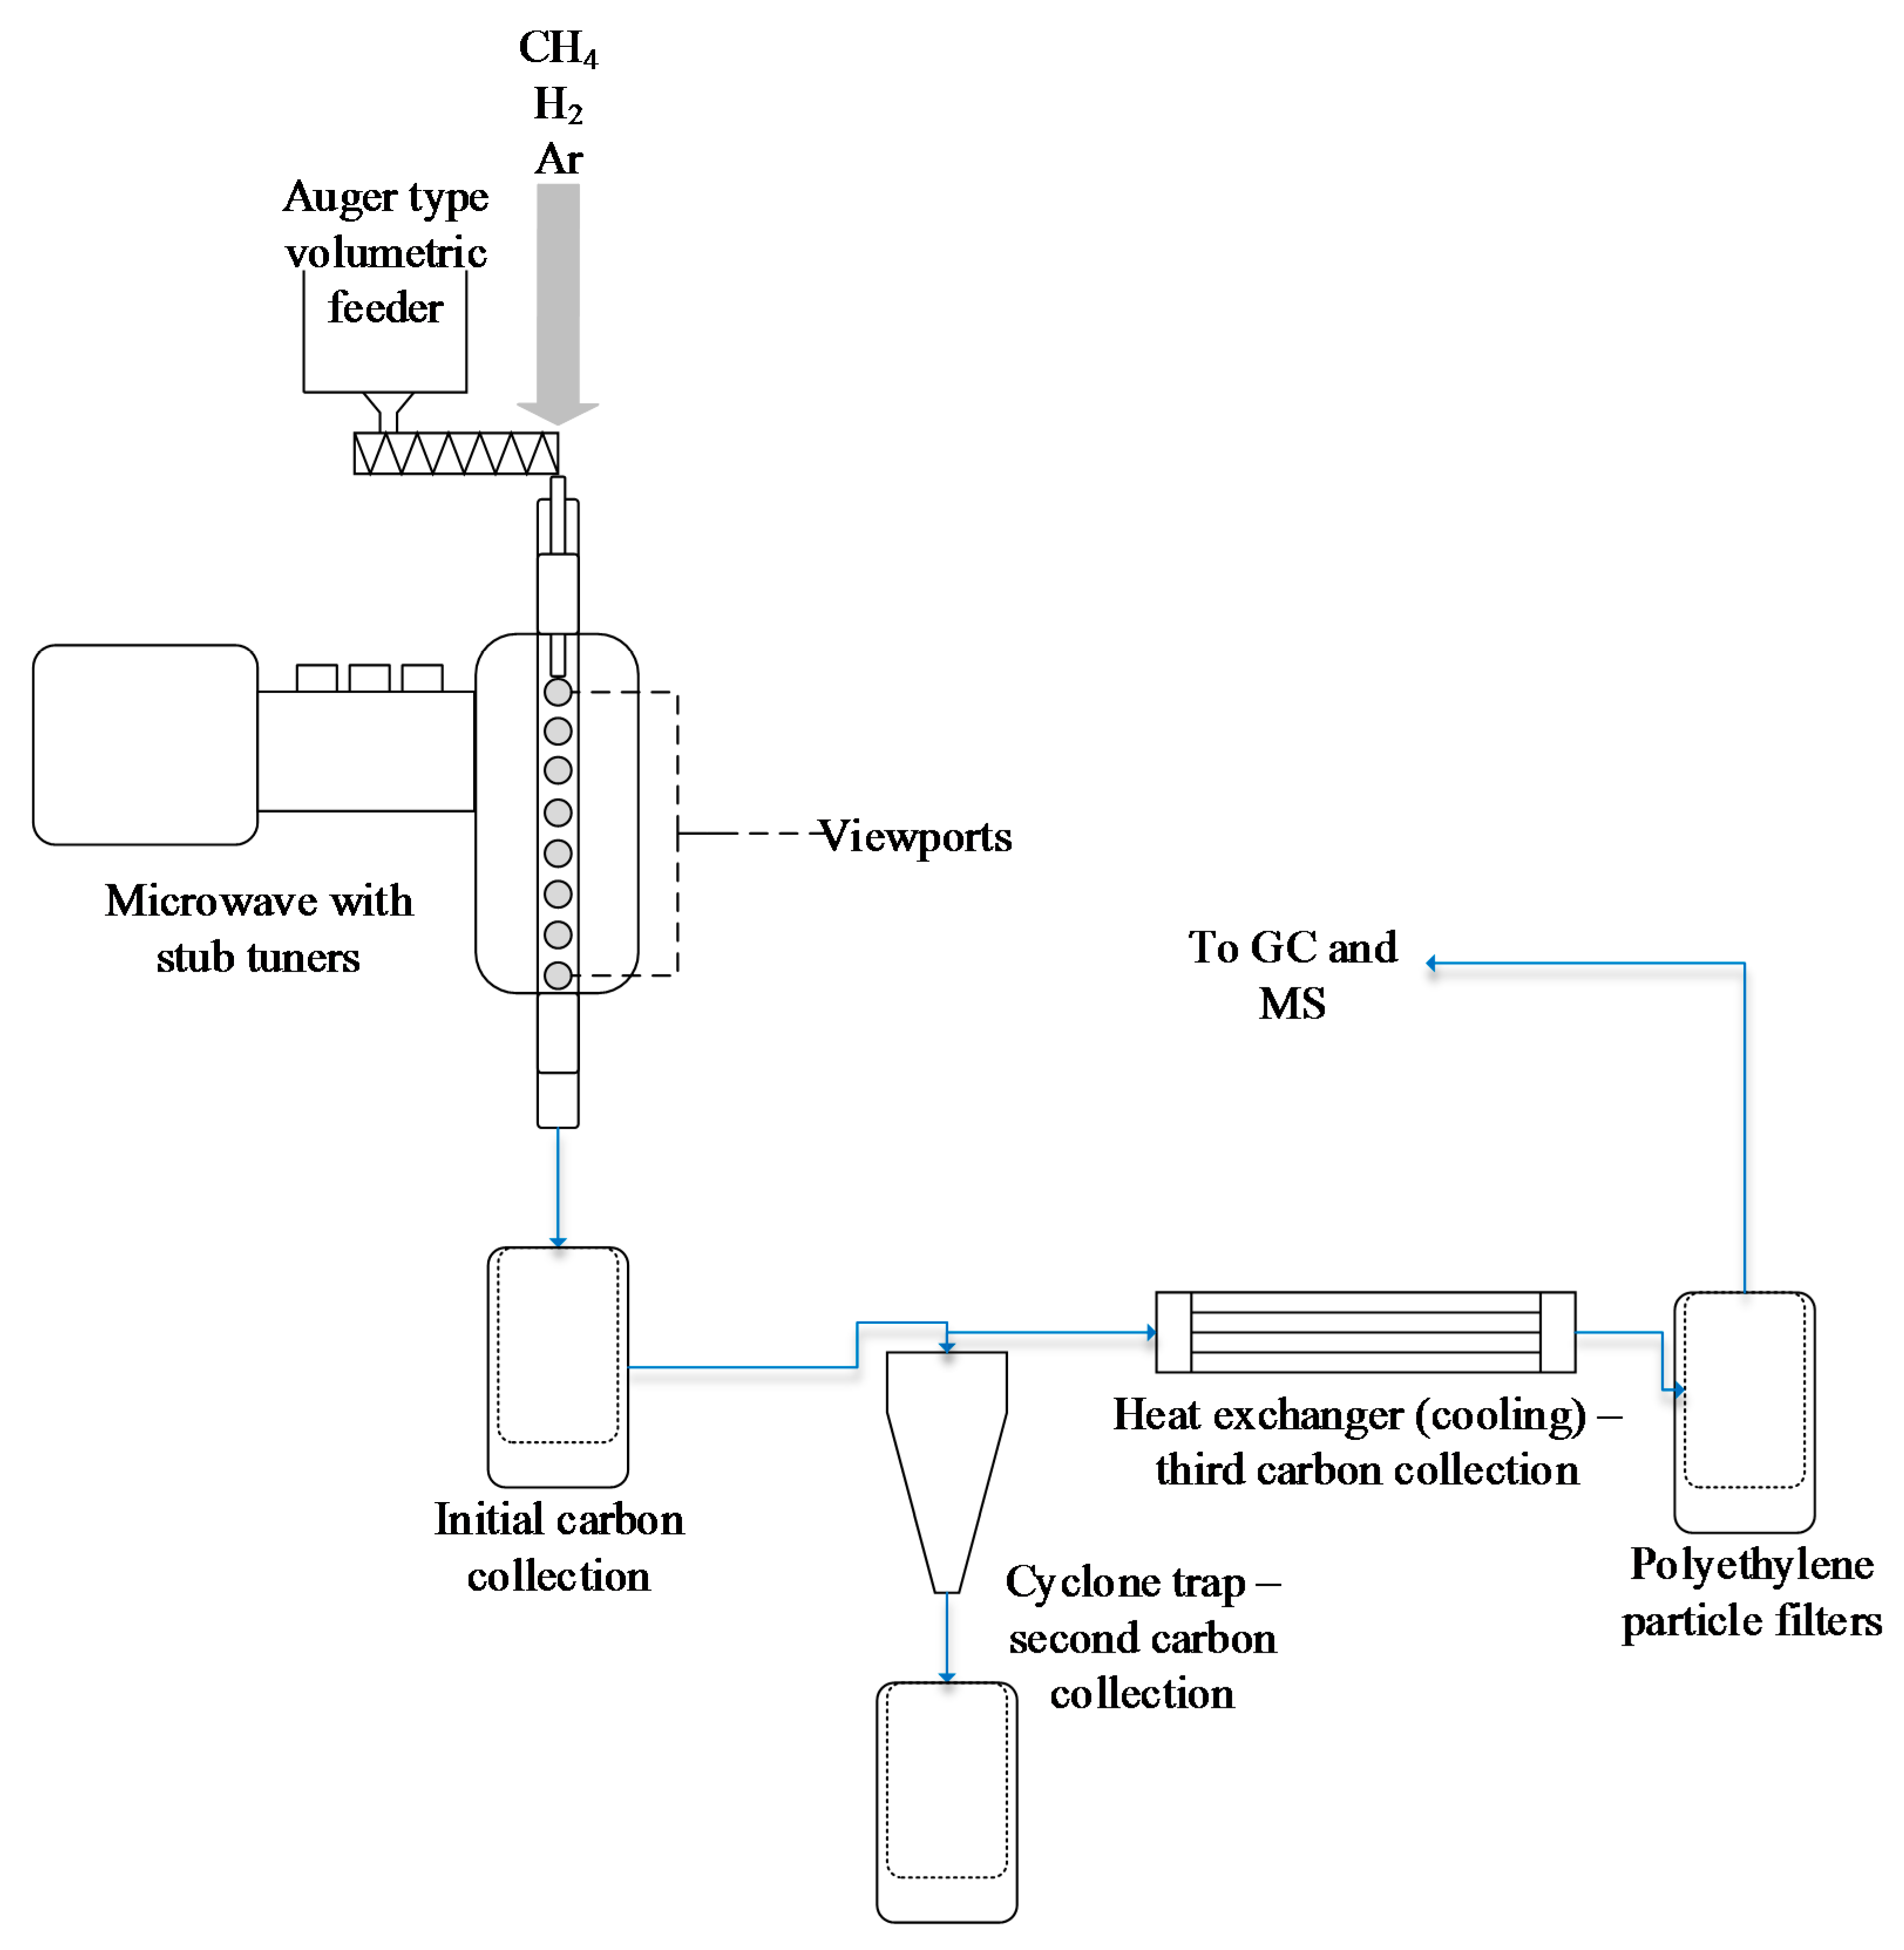
Figure 1 is an experimental schematic. Key components include the MW reactor, feed gases, and product gas/solid separation. Microwave energy at 2.45 GHz, variable between 3–4 kW, is cross-coupled into a flow reactor. The reactor consisted of a 50.8 mm (O.D.) quartz tube, oriented vertically.
The resonant mode shape, as predicted by simulations, was azimuthally uniform, with axial mode profile dependent upon gas composition. Due to the sizing of the cavity and position of the coupler, coupling efficiency to this mode was typically 50–60% (i.e., 40–50% reflected power). The reacting flow extended well past the coupling waveguide, facilitating optical diagnostics along the reactor column, as illustrated in Figure 1. The microwave input to the reaction cavity was controlled by 3 stub tuners. Wave LiquefactionTM (WLTM) is a novel process developed by H Quest Vanguard, Inc., which applies focused microwave energy to create localized and intense thermochemical reaction zones to promote direct, clean, and efficient conversion of hydrocarbon, including fossil fuels such as coal and natural gas.
Gas ratios are optimized for the particular hydrocarbon feedstock conversion process. For application of WL™ technology in methane decomposition to H2 and premium carbon products, the volumetric flow methane to Ar ratio was varied between 1:3.5 to 1:18, with supplemental hydrogen equivalent to 1/3 to 1/5 the methane flow. Experiments were performed varying the gas flow rates. Gases were introduced through a plate distributor for directional control. Reactor residence times are sub-second, and conversions are performed at atmospheric pressure.
Solid feed, for specific experiments, were fed into the reaction cavity using an auger-type volumetric feeder, with maximum flow rate of 1.7 kg/hr. for carbon black (Vulcan XC72). Solid carbon products are collected in 3 zones: an initial collection point immediately downstream of the reaction cavity, outlet of the cyclone trap, and from cooling of the gases that escape the cyclone trap. The gas is then further filtered through polyethylene particle, filters, to remove any residual particles before being analyzed using a gas chromatograph) and a mass spectrometer with 1–200 amu range.
Spectroscopic data collection was performed using a fiber-optically coupled Ocean Optics HR2000+ES spectrometer fitted with UV–NIR grating. Optical emission spectra were collected using a 4 μm diameter optical fiber with input collimating lens. The reaction cavity had viewports along the length of the cavity for process monitoring. All optical emission spectra are spectrally calibrated using a Hg/Ar lamp, and corrected for instrument response function using a NIST-traceable HTS-94 tungsten lamp as spectral calibration standard.
2.2. Solid Analysis
Solid products from the above experiments were analyzed using various analytical methods (SEM, HRTEM, XRD, TGA, and gas adsorption) to determine the structural and compositional characteristics.
2.2.1. SEM and TEM
Samples were placed on double sided carbon tape and top down secondary electron images were captured in a Nova NanoSEM 630 at 5 keV. Brightfield TEM images and high-resolution TEM (HRTEM) images were acquired from a 200 keV microscope (Talos F200X). The samples were placed on a lacey carbon grid for TEM after dispersing in methanol.
2.2.2. X-ray Diffraction
X-ray powder diffraction (XRD) pattern of the samples were obtained using a PANalytical Empyrean X-Ray Diffractometer (Westborough, MA, USA) with a Cu source, 1/2° divergence slit, and 10 mm beam mask. Background subtraction and peak deconvolution of the XRD pattern was performed using JADE® software, which also calculated the d002 layered plane spacing as per the Bragg equation. The carbon lamellae length (La) and layered plane stacking height (Lc) were calculated applying the Scherrer equation:
where K, the dimensionless shape factor, is 1.84 for Lc and 0.89 for La, λ is the Cu Kα radiation wavelength (1.54 Å), β is the line broadening at FWHM in radians, and θ is the angle.
2.2.3. Thermogravimetric Analysis (TGA)
The mass loss curve of the solid carbons in air were obtained using a thermogravimetric analyzer (Discovery Series TGA Q5500, TA Instruments, New Castle, DE, USA). After equilibration at 30 °C for 15 min, the samples were ramped up to 105 °C, and isothermally held at that temperature for 10 mins to remove volatiles. The mass loss curves were then recorded while heating at 5 °C/min till 1000 °C.
2.2.4. Elemental Composition and Surface Area
The total elemental composition was determined using a LECO CHN 600 and LECO SC 144DR analyzers following ASTM D5373 and D4239, and proximate analysis using a LECO MAC 400 following ASTM 758. Internal surface area of the samples was measured by isothermal gas adsorption using an ASAP 2020 Plus Accelerated Surface Area and Porosimetry System, with N2 as an adsorptive gas at 77 K (liquid nitrogen bath). Before analysis, each sample was degassed under 90 °C with an N2 gas flow for 2 h to remove the moisture and any other adsorbed gas. The total surface area was obtained by analyzing the isotherms using the Brunauer-Emmett-Teller (BET) method, and the pore volume using the t-plot method.
2.3. Optical Emission Spectroscopy
Assuming the spectra to be of free spontaneous emission in thermal equilibrium, temperatures were determined by the Nelder–Mead minimization algorithm to fit a computed spectrum from the table of line strengths for the transition bands of the swan band emission spectrum using the software program developed by Parigger. The electronic baseline and underlying blackbody radiation were taken into account in the spectral fitting. Carbon particle temperatures were determined by fitting the baseline of the spectra in the wavelength range of 650–850 nm to Planck’s radiation law with blackbody conditions, using the same software.
3. Results
3.1. Carbon Product: Physical and Chemical Characterization
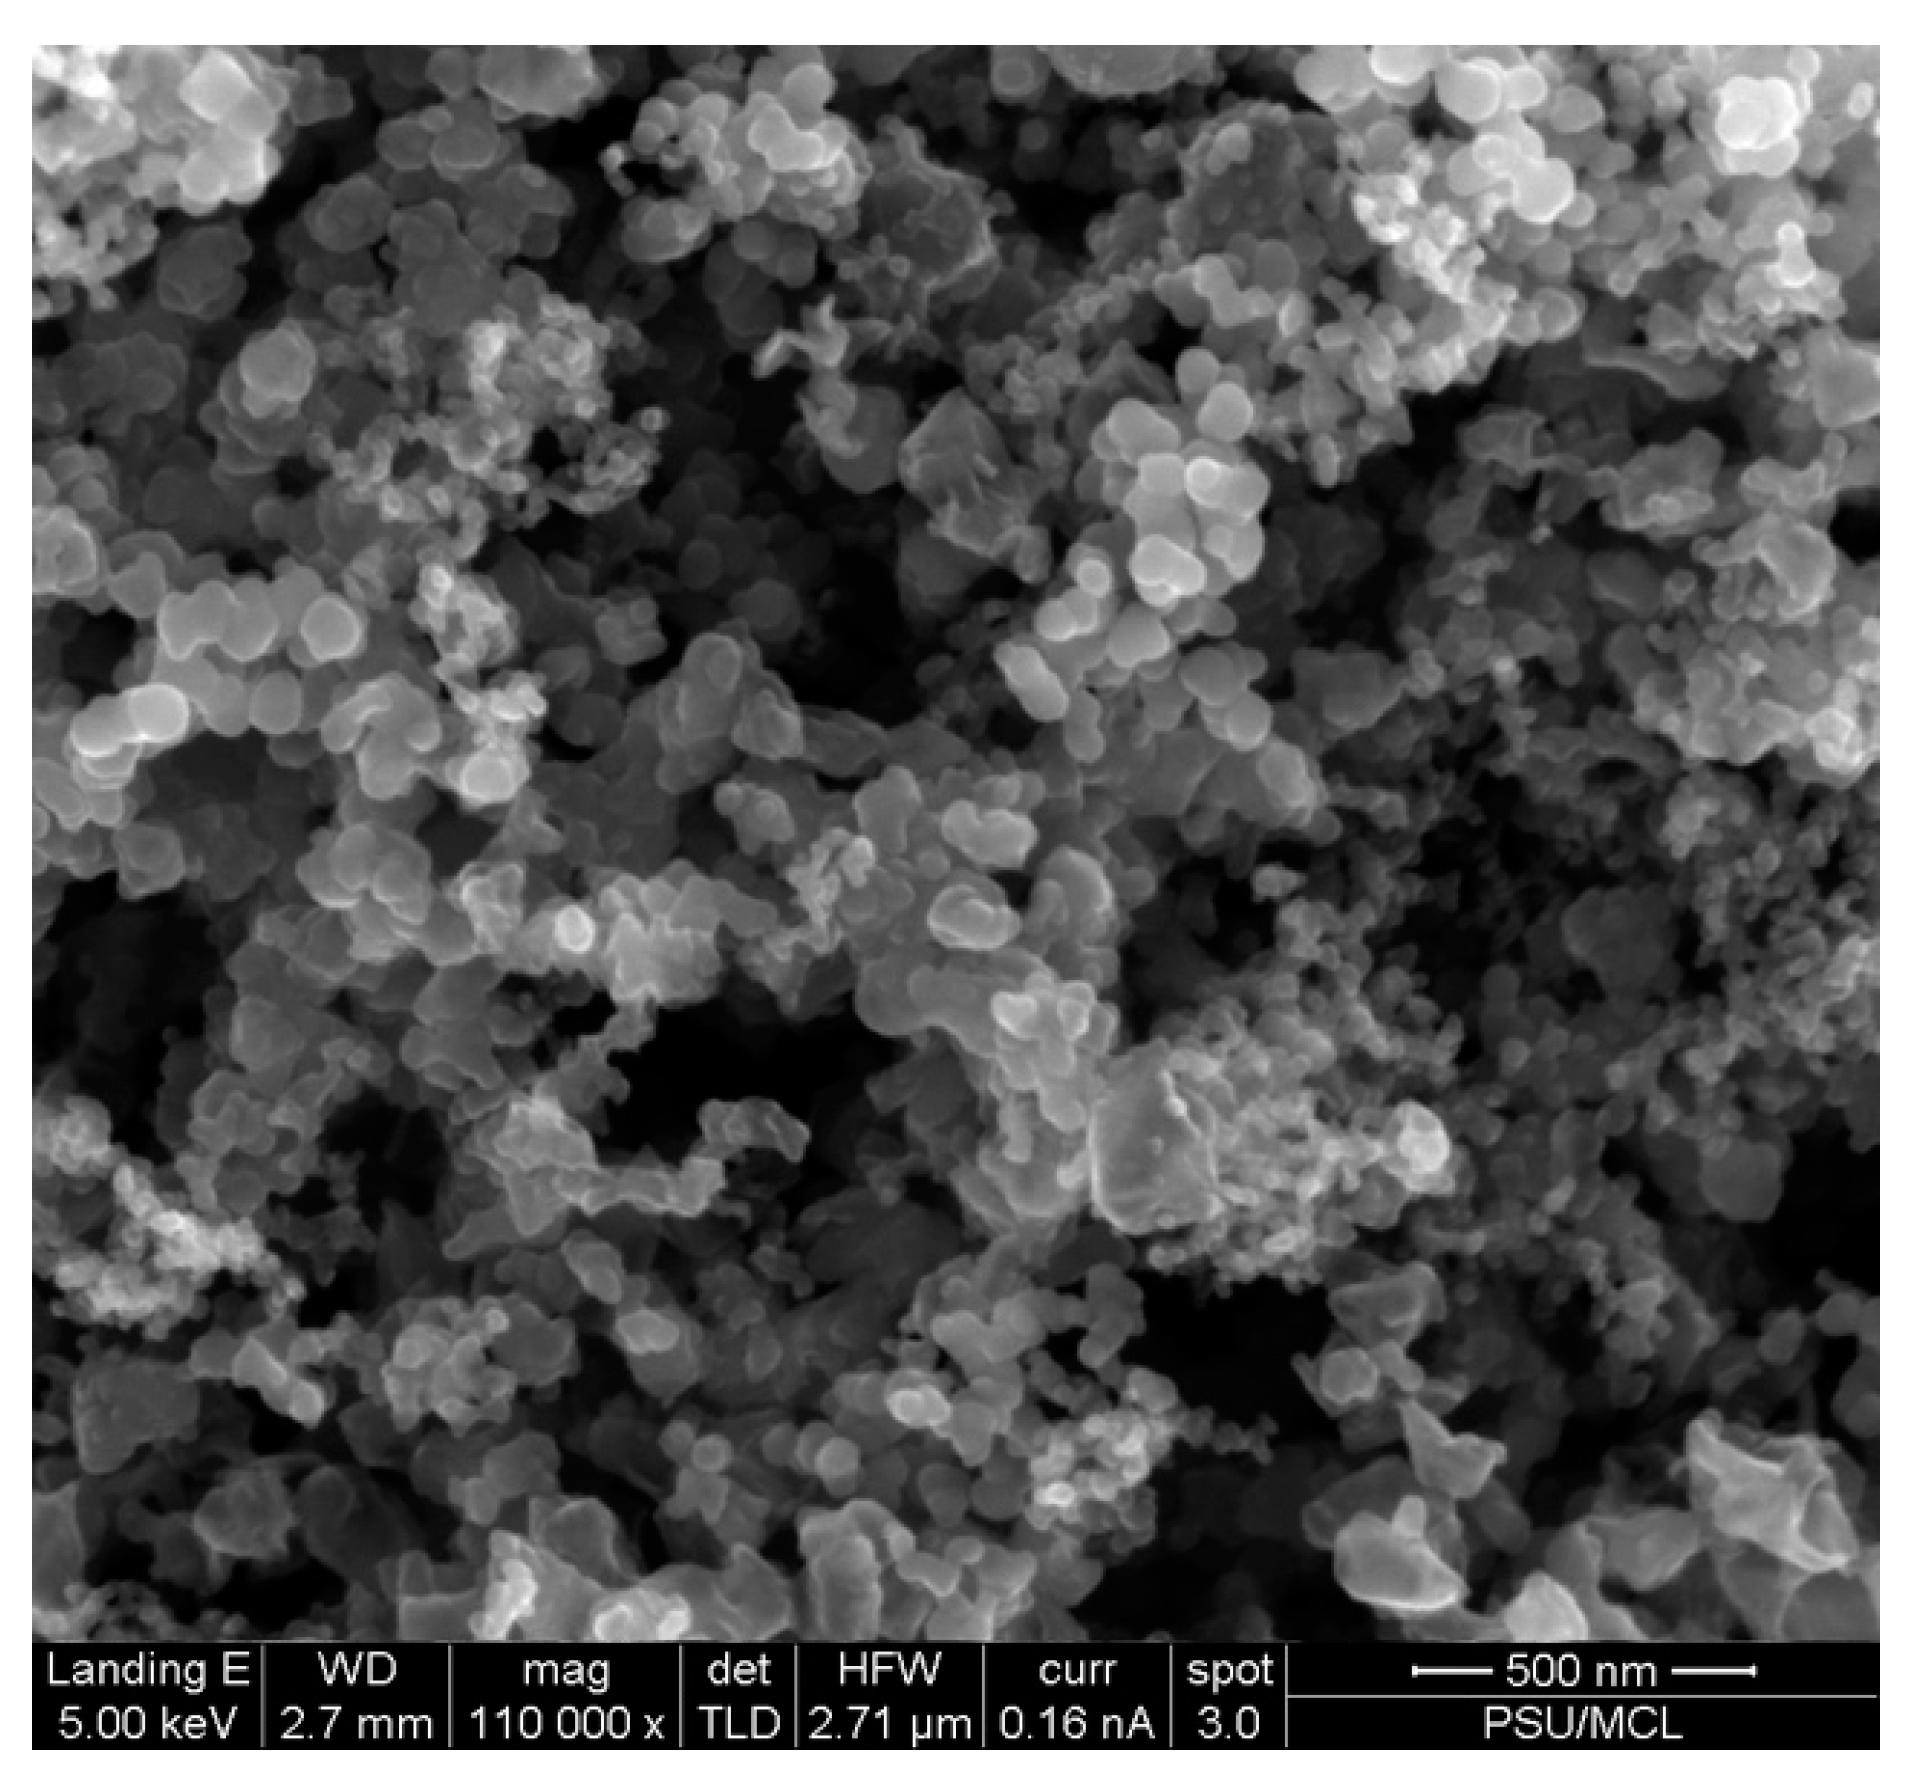
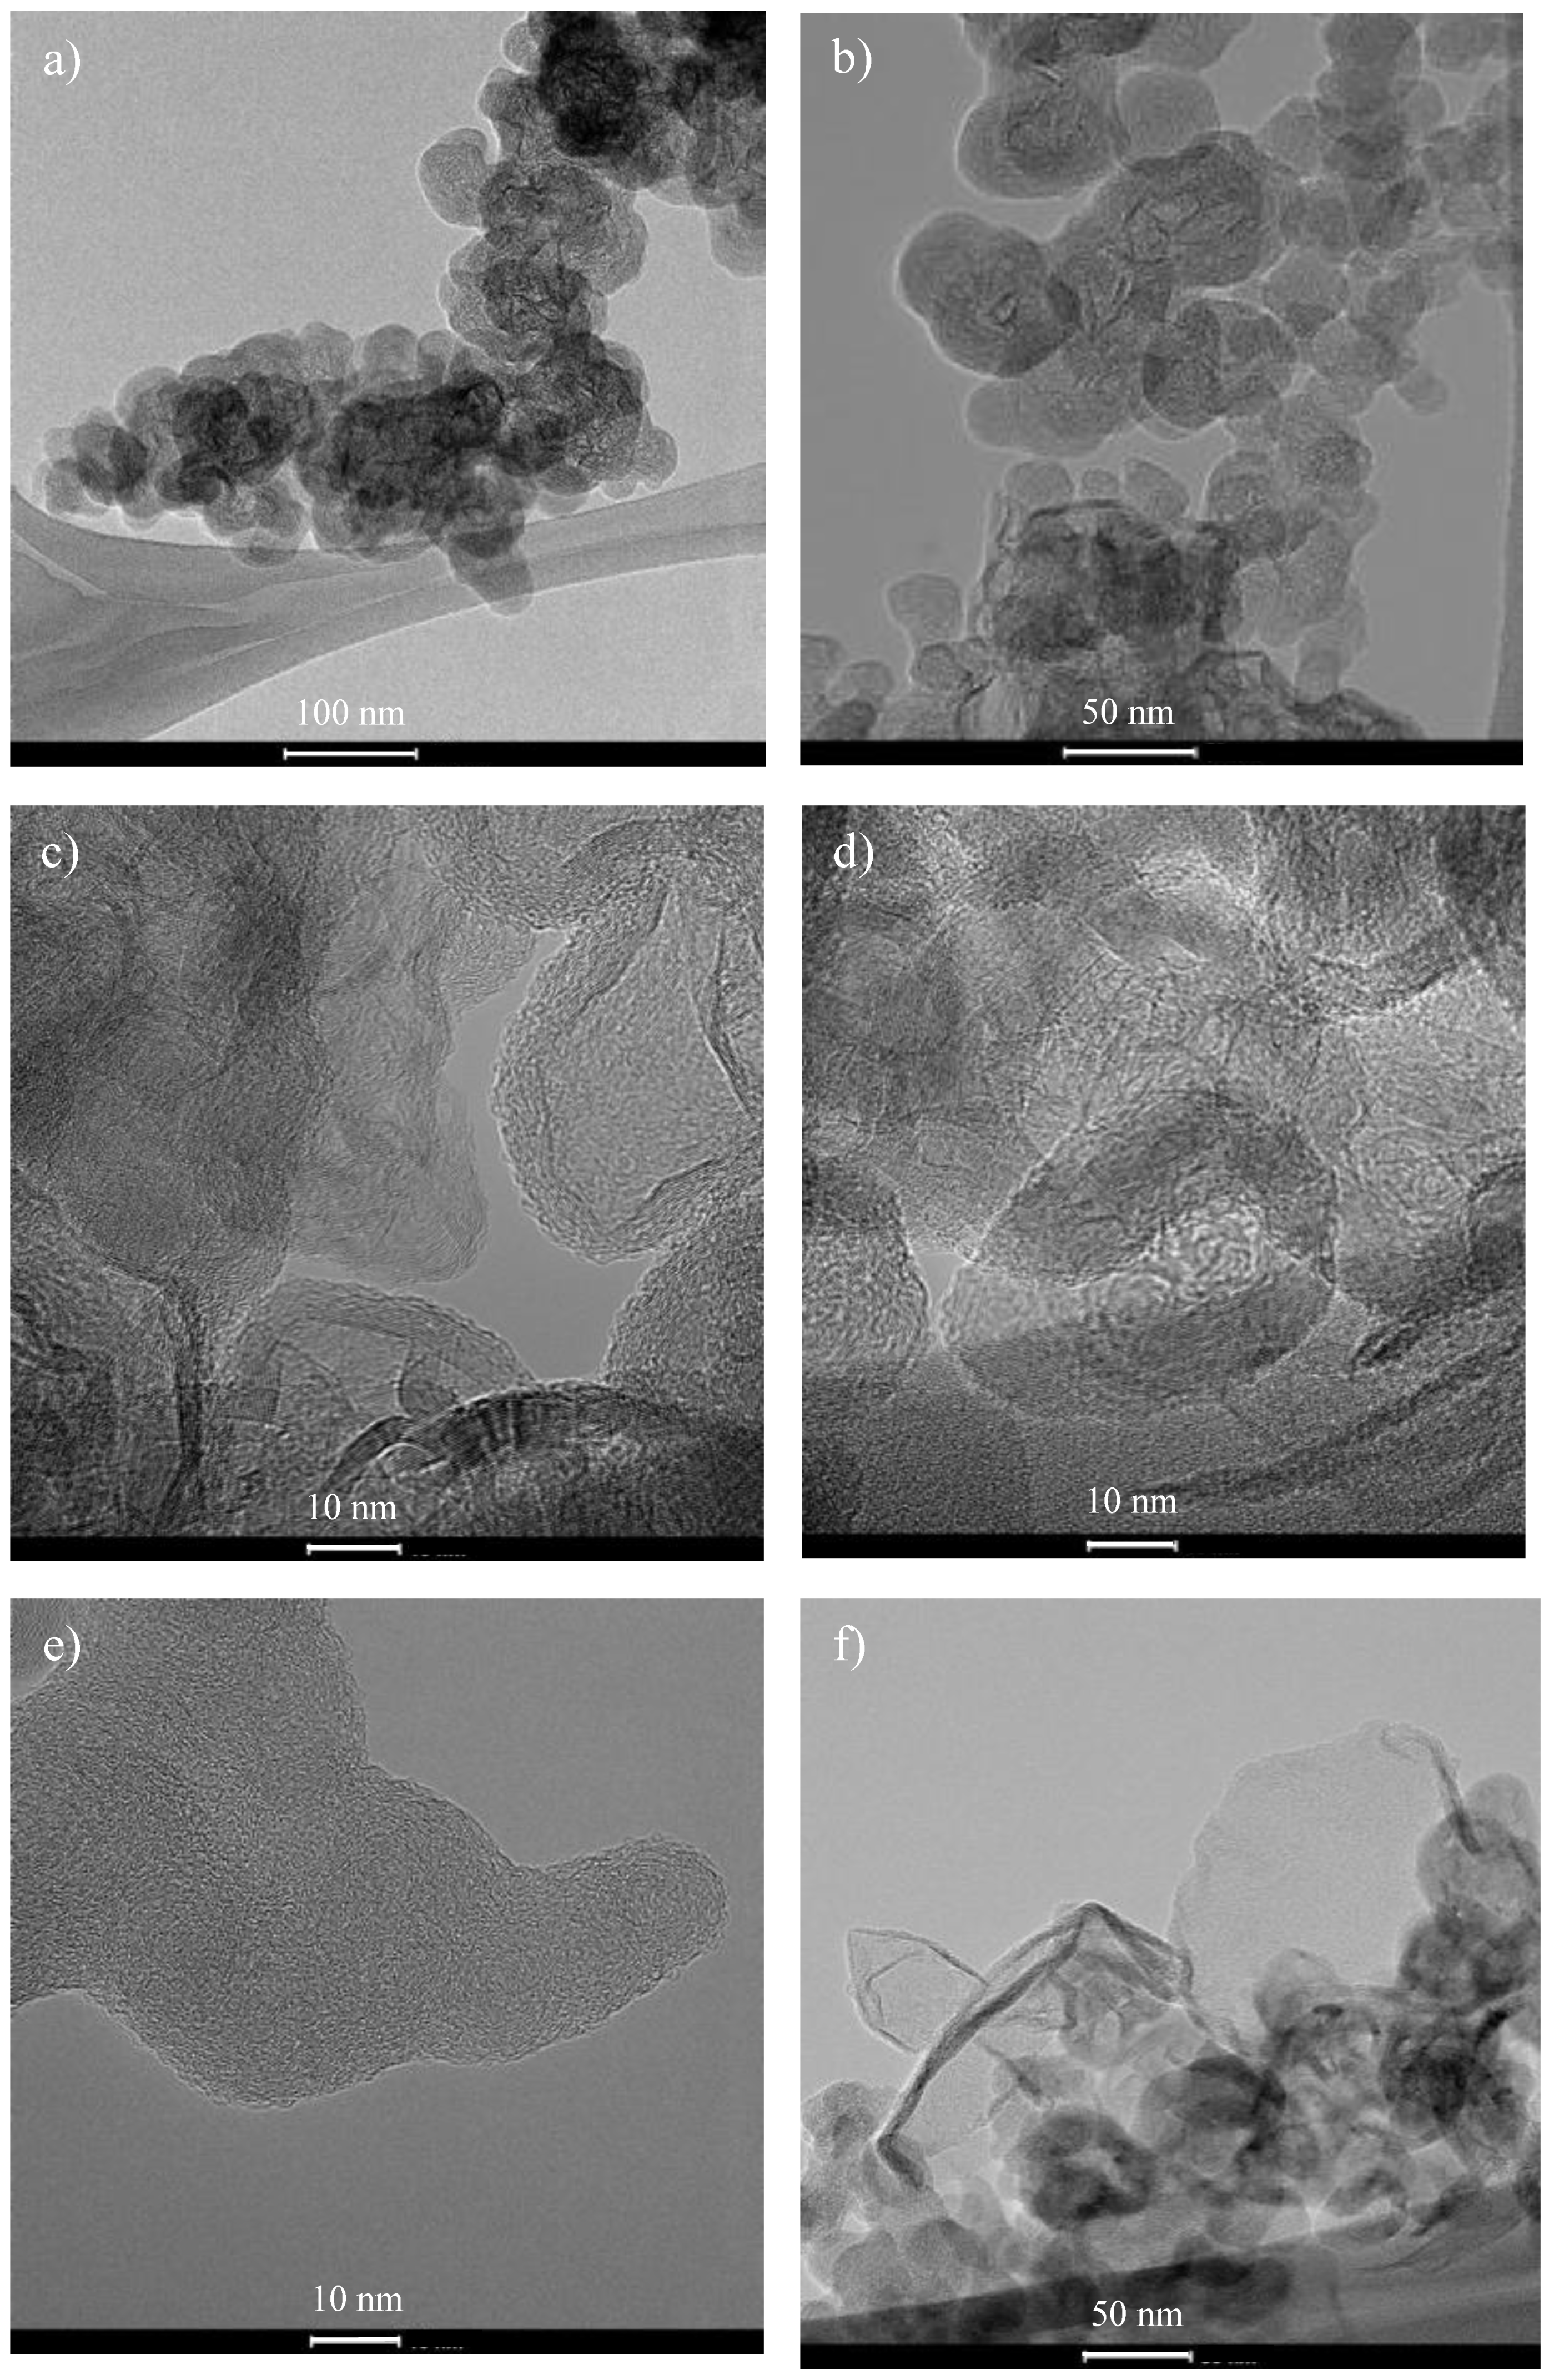
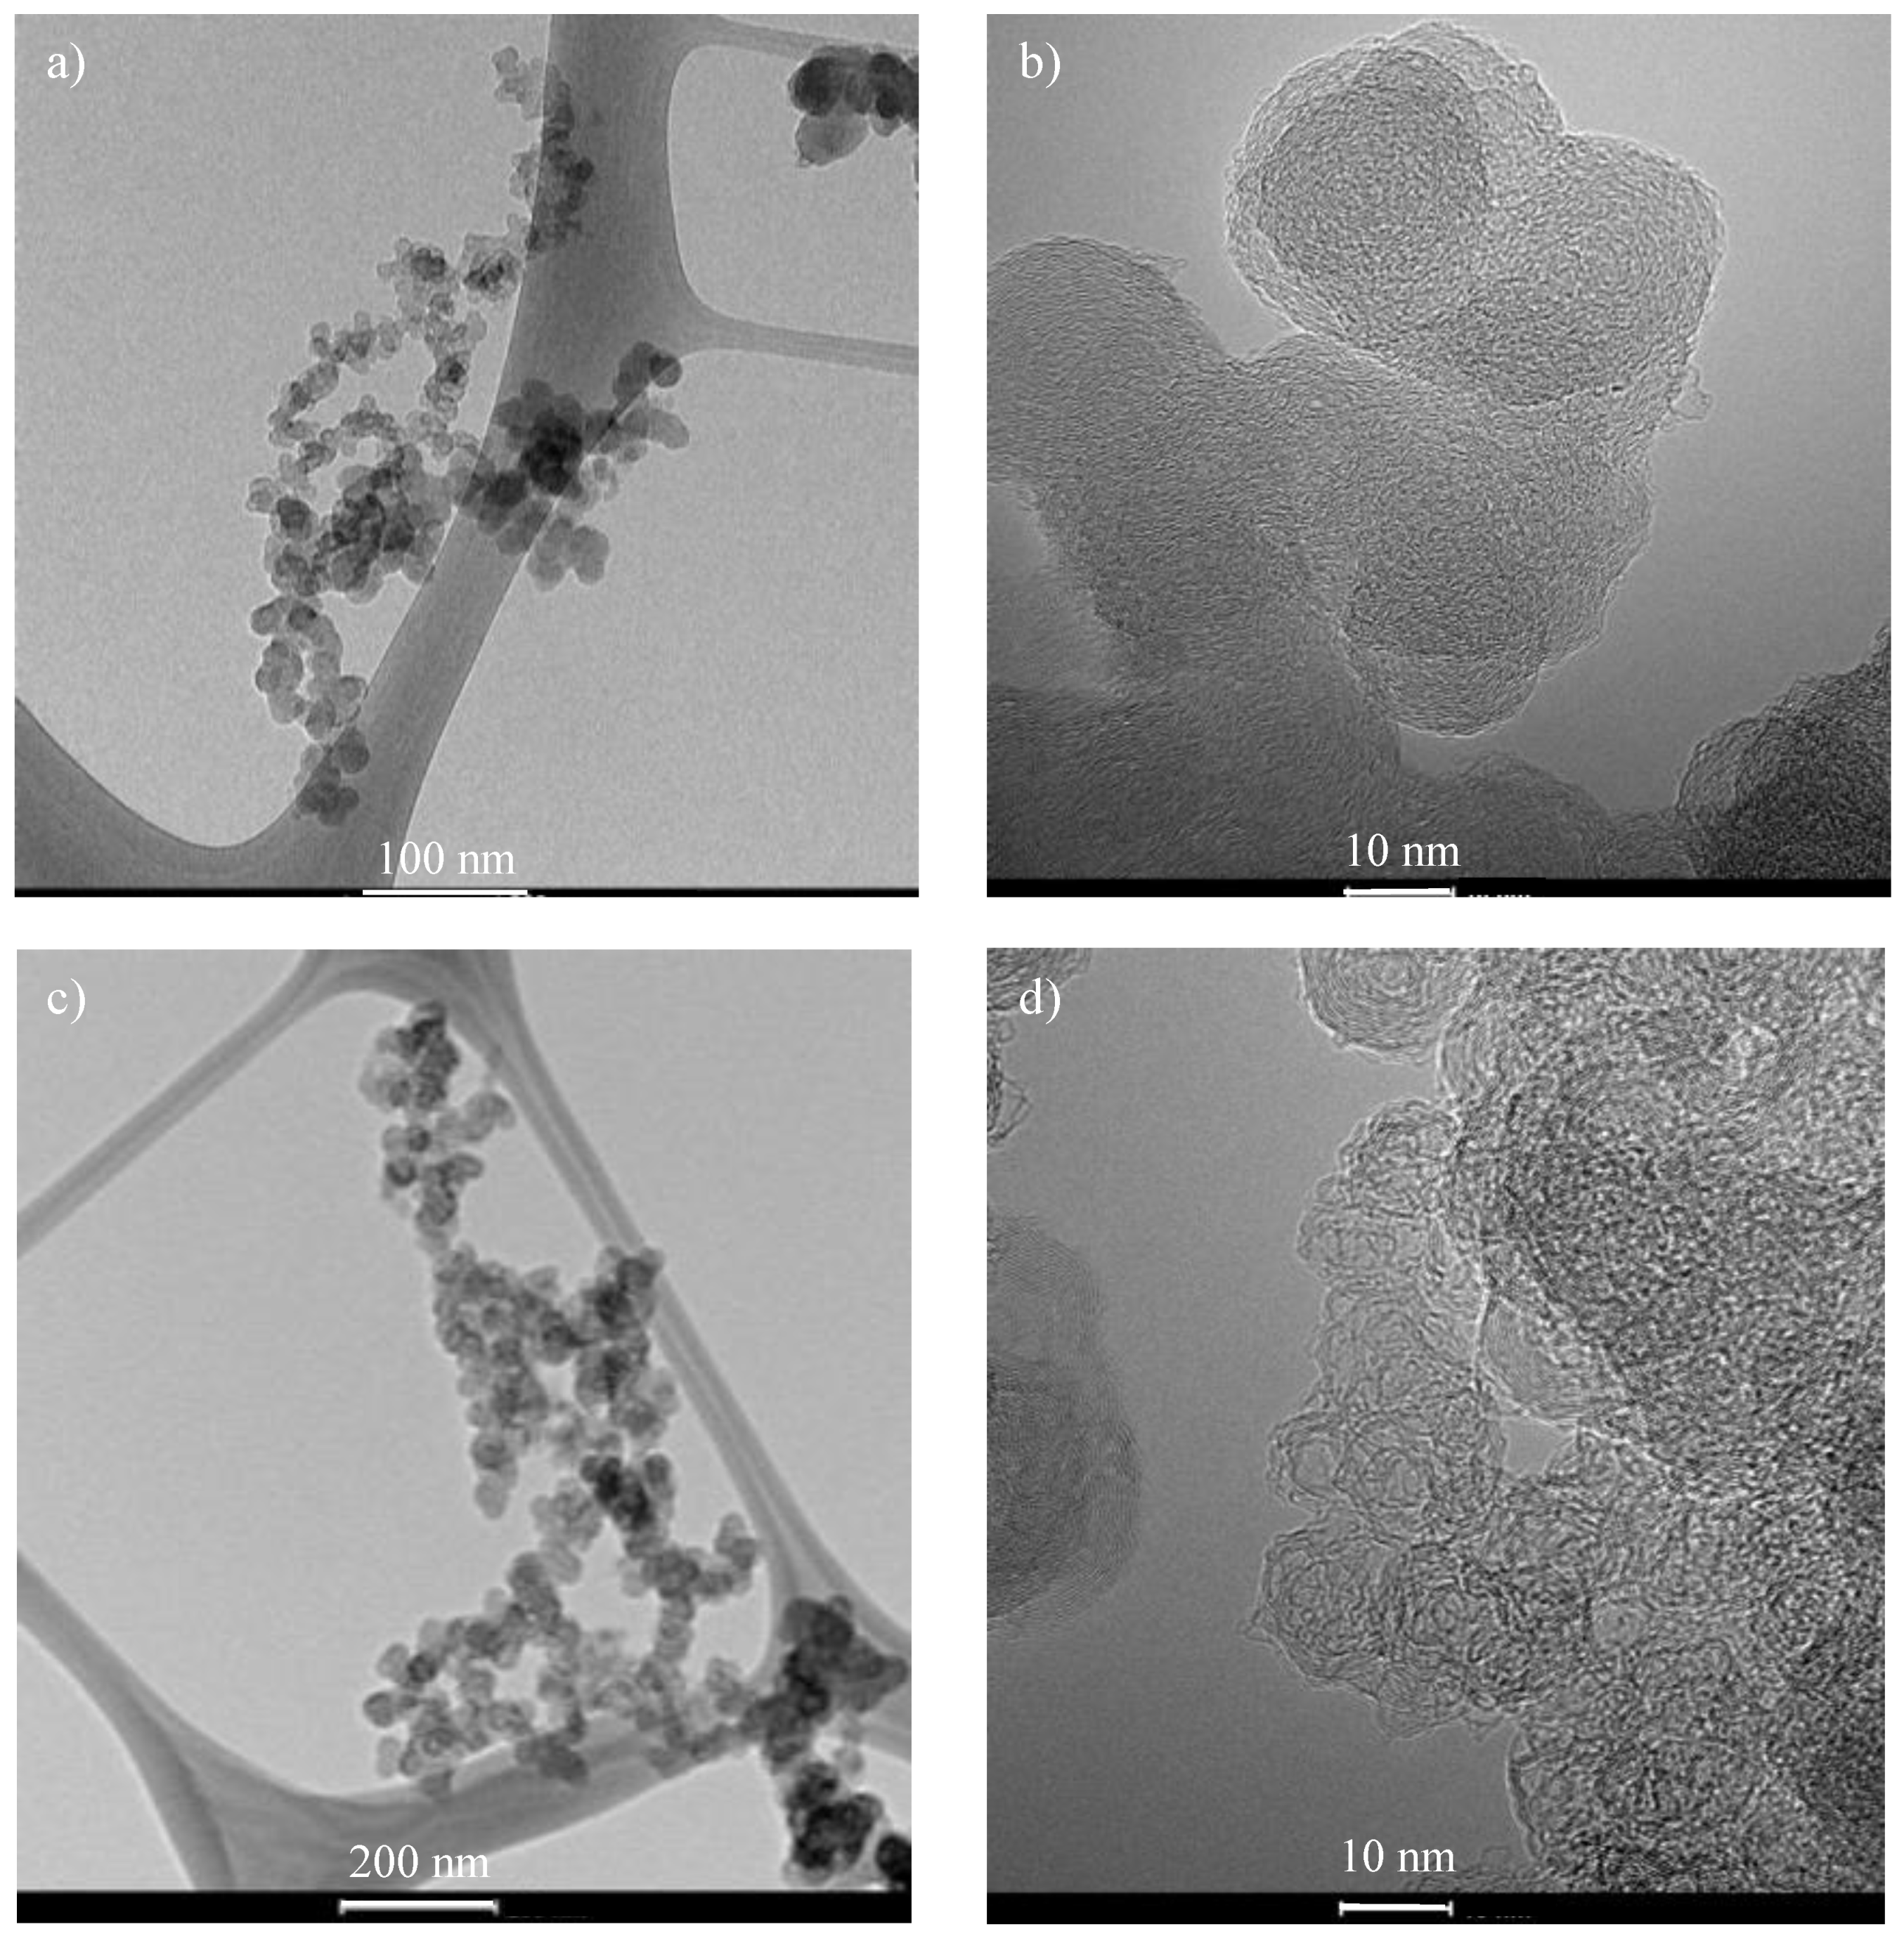
The carbon is produced as an aerosol, collected by downstream filters. Figure 2 shows SEM images of the collected material. Evident are myriad spherules, with a nominal average size of 70 ± 5 nm, based on 30 measurements. From such images, they appear connected together into clusters. TEM images reveal the cluster morphology. As seen in Figure 3, the spherules are partially fused or coalesced with the assemblies having a general fractal morphology. As seen in the HRTEM images, internal structure is evident in the particles. Bands comprised of multiple stacked lamellae contribute to the particle structure. In other particles, the bands comprise the particle perimeters forming shells. (angle tilting confirms the 3D form of these particles and the structures therein.) For comparison, panels e and f show TEM images of XC-72, a carbon black for comparisons of particle morphology and internal structure. The primary particles appear smaller, with a lesser degree of merging with a less compact aggregate morphology.
To assess the reactivity of the carbon, TGA analyses were performed, as shown in Figure 4. The blue curve is the derivative of the weight loss curve shown in black. By the shoulders on the 1st derivative curve, there are clearly 3 temperature peaks, corresponding to different forms of carbon with associated oxidative reactivity. To better resolve these peak temperatures, the 2nd derivative, not shown, gave three peak oxidation temperatures: 532, 625, and 728 °C. The TEM images give indication of a wide variance in carbon nanostructure—assessing its impact on oxidative reactivity is still being researched [27,28]. By qualitative assessment from the TEM images, these three forms could be categorized as unstructured (amorphous) particles, graphitic capsules, and rosette-type particles. The extended lamellae in these particles feature predominantly basal plane carbons—which have lower reactivity towards O2 than edge site carbons. Such lamellae forming the outer shell of capsules would account for the highest peak oxidative temperature while short lamellae associated with amorphous (unstructured) carbon would account for the lowest onset temperature. This assignment is aligned with oxidation temperatures for carbon with similar nanostructures, as reported previously [29]. The specific details of the formation of such different structures and preferential production are questions yet to be answered in future studies.
XRD analyses of the carbons are summarized in Table 1 for both the MW (produced) carbon and the XC-72 as a reference. Upon fitting the XRD spectrum, a three-peak deconvolution was found to best fit the main d002 peak based on residuals, plotted in Figure 5. By Bragg’s analysis of the (002) peak, d002 values are found. This spacing for two components of the MW carbon is comparable to that for XC-72, both being slightly larger than the nominal value for graphite, 0.334 nm, and, as such, indicative of turbostratic structure. However, the graphitic form has a lattice spacing nearly that of graphite (0.344 nm), hence the reference to it as “graphitic”. By Scherrer’s equation and the measured FWHM of the (002) peaks, the stack height, i.e., Lc crystallite dimension, can be gauged. Each of these are listed in Table 1 for each of the three peaks from the fit. For the graphitic peak of the MW carbon, Lc is nearly 4× that of the reference carbon black. Applying Scherrer’s equation to the (100) peak width, the in-plane crystallite size can be measured. For the MW carbon, it is nearly 50% larger that for the XC-72, based on a single peak fit. No comparative difference could be discerned by further resolution into additional components due, at least in part, to its low intensity. Hence, this La is a conservative measure, as the La for the graphitic component of the MW carbon be much larger. Both measures are consistent with the HRTEM images showing lamellae of extended length and stacking order (see Figure 2, panels c and d).
Remarkable is the identification of three sp2 forms with different crystalline order and correspondence to the TGA identification of the same. These three forms of sp2 carbon products are interpreted as corresponding to those identified by TGA analysis. As diffraction angle decreases, lamellae spacing along the c-axis increases. As seen in Figure 5, as lamellae spacing increases, the crystallite stacking (height) decreases (i.e., peak width broadens). Putting these trends together, smaller crystallites have larger lamellar spacing (and vice versa). Both changes in lattice dimensions facilitate oxidative reactivity by O2 [28,29]. On this basis, these three sp2 forms directly map to those observed in the TGA spectrum.
As summarized in Table 2, by applying BET analysis to gas adsorption isotherm data, the MW carbon black has roughly 1/2 the surface area as XC-72. Both materials have significant pore volume as measure of overall porosity. That the MW carbon has moderately higher porosity is surprising, given its lower surface area value, indicative of mesoporosity. Elemental analysis of both carbons for C, HN, and O yield similar values. The commercial carbon black, like most, have some residual sulfur content reflecting the feedstock [30]. In summary, the carbons produced are moderately graphitic (with reference to carbon-black like materials), having low surface area and high purity. Notably, the graphitic lamellae structure and chemical purity are key metrics for carbons in battery applications for which these carbons are suitable.
3.2. Origin(s) of Nanostructure in Carbon Products
While TEM provides direct visualization of morphology and degree of (nano)structure, identifying different forms as representative of the bulk can be somewhat subjective, unless coupled with additional characterization methods. Notably, the XRD measurement is an average over the bulk, as is the TGA. Therein, the XRD provides clear differentiation between the carbon black and the microwave product. TGA further differentiates the different carbon forms (or sp2 “phases”) present.
With the structure being established as different from that of representative carbon black, the intriguing question is why. This section addresses potential causes. To restate, the internal structure of the lamellae, otherwise referred to as nanostructure, is markedly different than that of the carbon blacks in general, based on XRD and TGA analyses. In fact, by reference to our prior work, the nanostructure of the present carbon appears similar to carbon blacks that have undergone additional heat treatment. Removal of crosslinks and realignment of lamellae are enabled at high temperatures—typically past 2000 °C. The so-called “vegetative” growth of lamellae occurs, resulting in their lengthening. Reorientation along the c-axis occurs near 2200 °C [31]. Yet the temperature, as measured by multi-wavelength pyrometry along the MW reactor, is notably lower, on average ~1400 K, (q.v. discussion section). For reference, such a temperature induces little restructuring of a flame-formed carbon or carbon black, as it is insufficient to activate kinetic barriers for carbon crystallite growth [32].
To test whether the observed nanostructure evident in the MW pyrocarbon is formed by MW annealing once formed, the XC-72 was introduced into the MW reactor as an entrained aerosol. Figure 6 shows HRTEM images of this MW processed XC-72. Clear evidence of restructuring within the particles is observed by the chaotic and displaced lamellae. Though still connected together in aggregates, the particles convey an appearance of being wrinkled or crumpled paper. By these HRTEM images, the lamellae lengths and stacking appeared significantly lower than for the MW-produced carbon. XRD analyses were performed for quantification, with results being summarized in Table 1. In addition to listing the values for nascent XC-72, Table 1 also lists the values for the MW-processed XC-72. Both the stack height, Lc dimension, and the in-plane crystallite size, La, are essentially unchanged relative to the nascent material. While the particles internally restructured—as evident from HRTEM—they did not “graphitize”. The lamellae are neither longer nor more stacked. Clearly, temperature is not an operative cause either in the formation of the MW carbon or thermal restructuring upon formation. Notably, both the carbon black and MW pyrocarbon originate from the same feedstock, methane.
To further test for the possibility of restructuring, XC-72 was heated in a fixed bed for ~20 min at 1000 °C under forming gas (95% N2, 5% H2), the hydrogen serving to shield against arcing. Low and high magnification TEM images may be found in the supplementary information. As with the XC-72 seeded into the flow with sub-second residence time in the reactor, from this batch process, aggregate morphology did not change—neither fragmentation nor fusing was observed. Individual spherules exhibited similar restructuring as found for the seeded flow. This long-duration microwave exposure firmly bounds the nanostructure transformations that may be expected by microwave processing of a carbon black already formed.
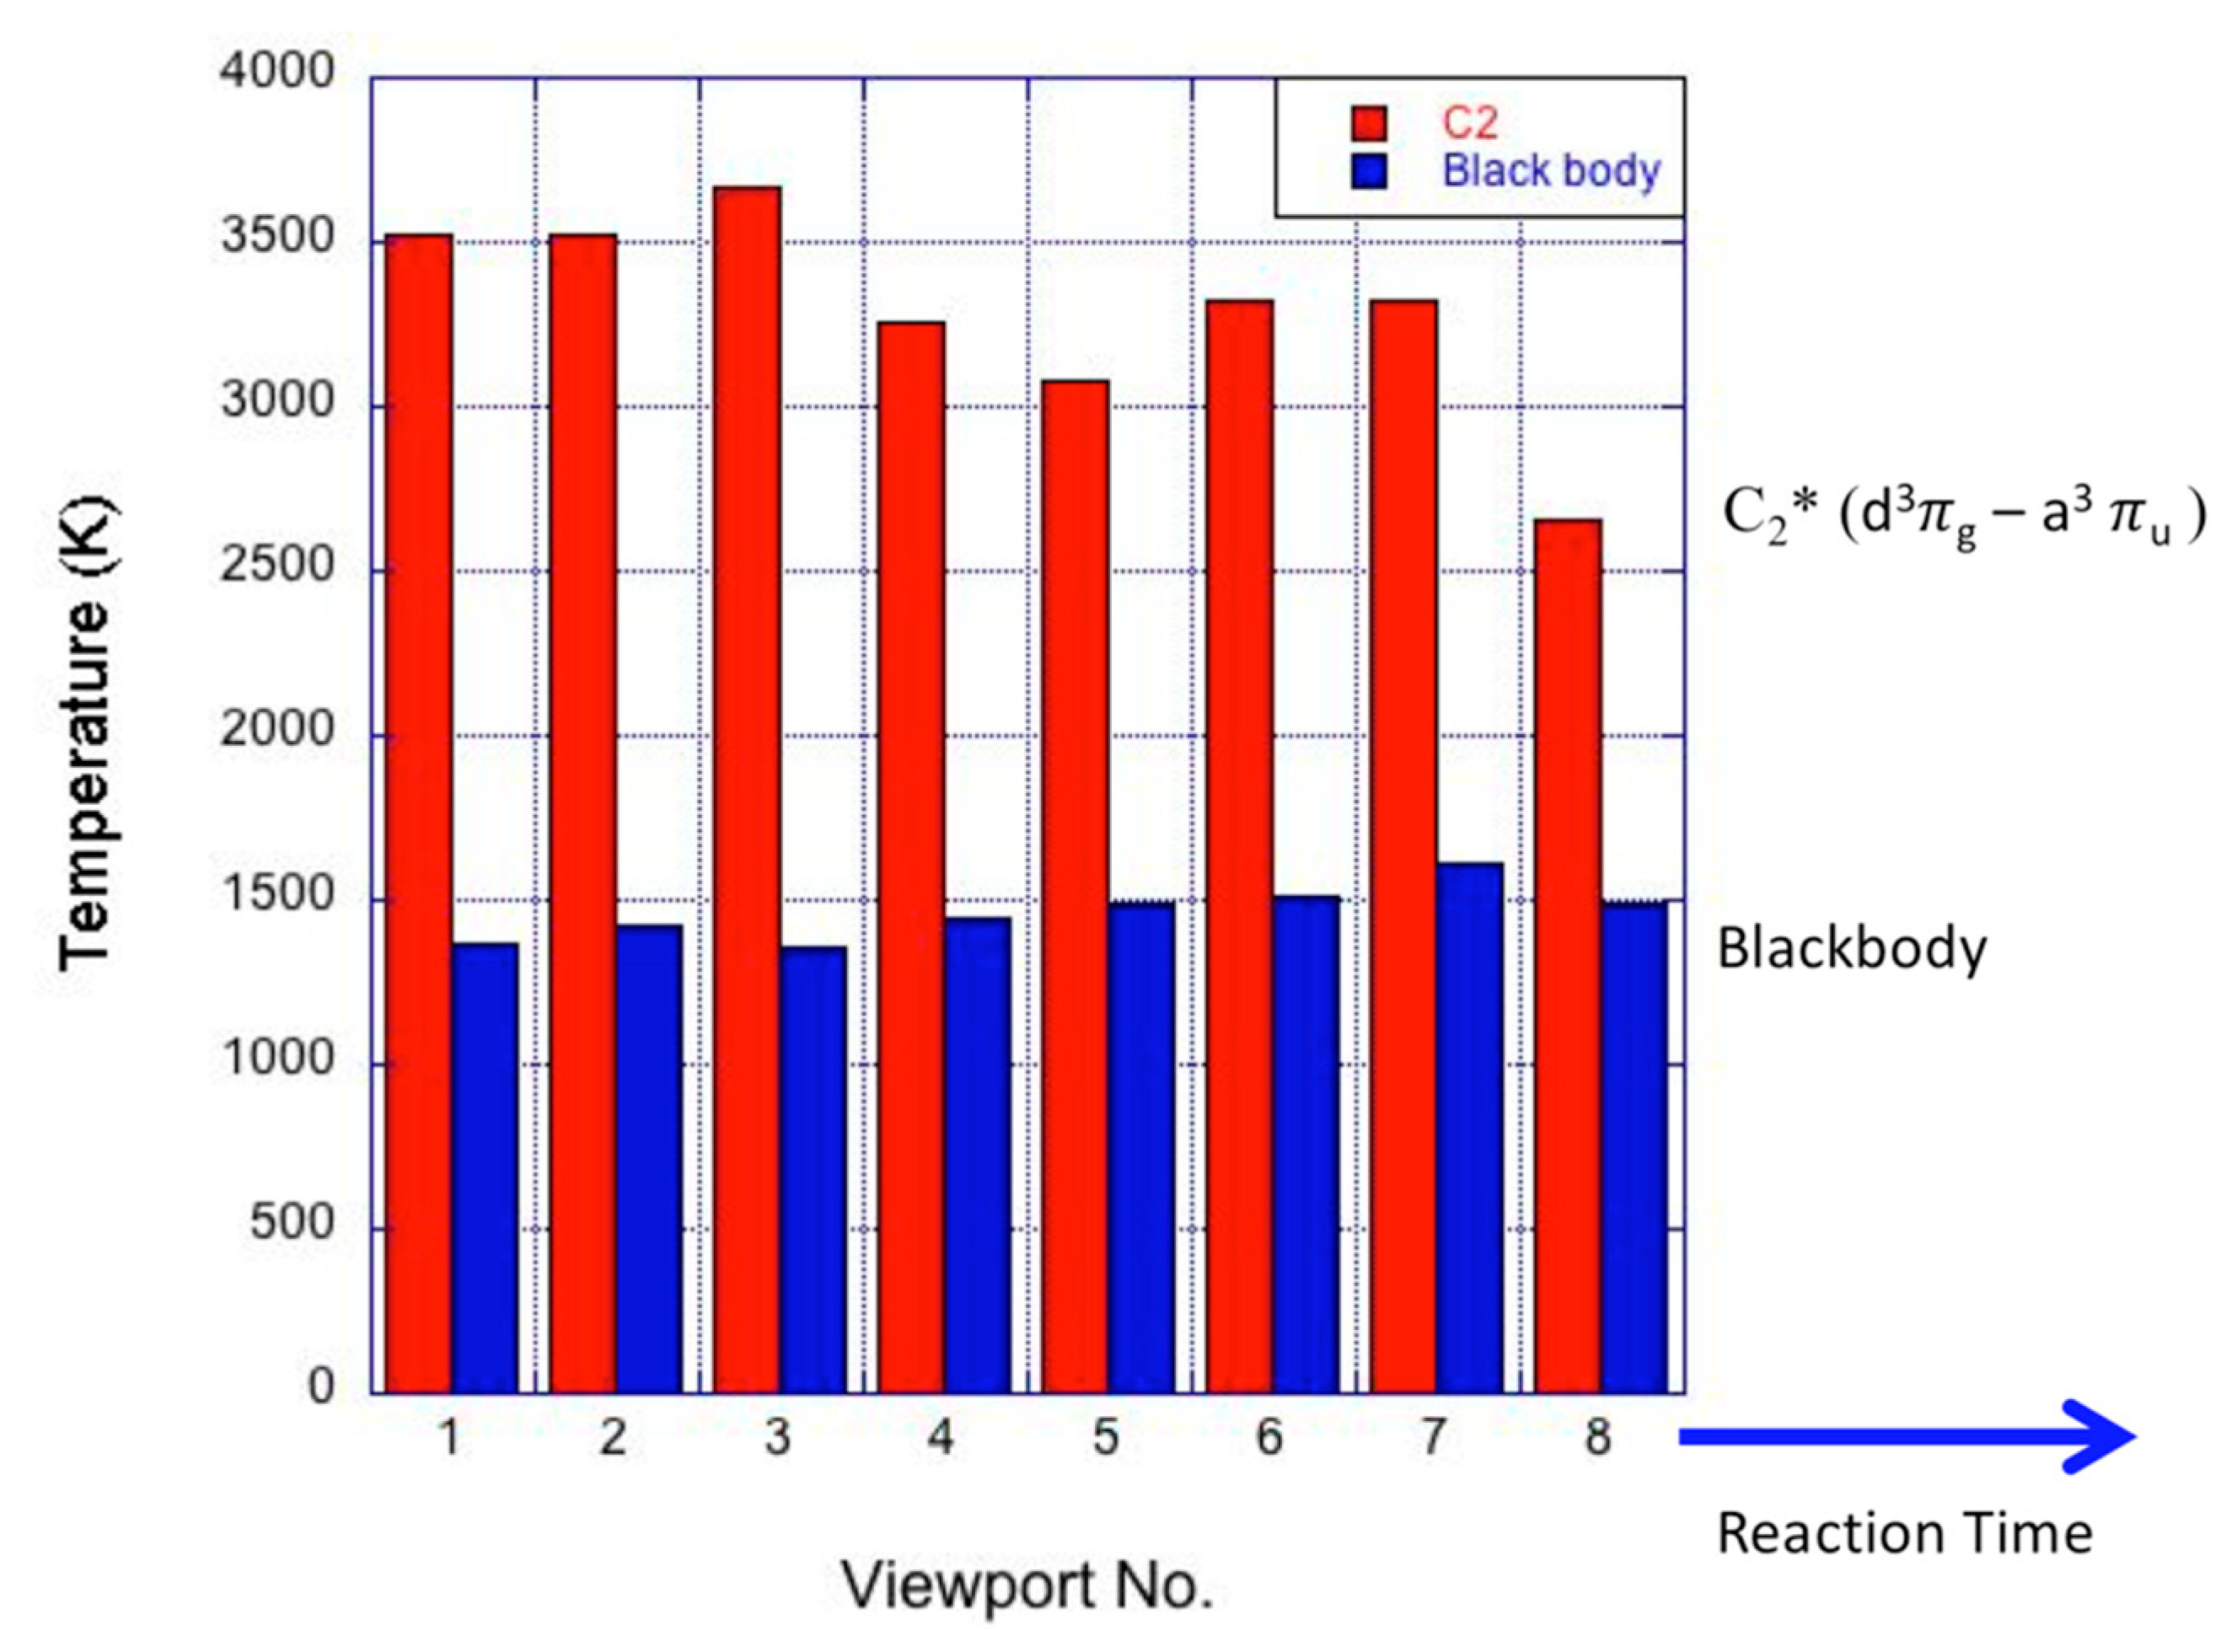
Muradov et al. proposed that the lower degree of structural order in the plasma-generated carbon accounted for its higher catalytic activity in thermal decomposition of methane (TDM)—which they ascribed to a high concentration of reactive edge atoms [33]. While the localized high energy gliding arc in their system can create so-called non-equilibrium plasma conditions, the arc still creates a high temperature zone with steep thermal gradients, across which, pyrolysis process and particle growth occur. Therein, it is not surprising that transient extremes in temperature and species concentration lead to a disordered and irregular nanostructure. In contrast, the present reactor lies entirely within a microwave cavity, containing plasma throughout its length. The result is a more uniform temperature profile (see Figure 7 for the blackbody temperature profile along the reactor), and uniform pyrolysis reactions for particle formation and growth. A carbon aerosol product with greater structural order results.
3.3. Radical Pool and Temperature
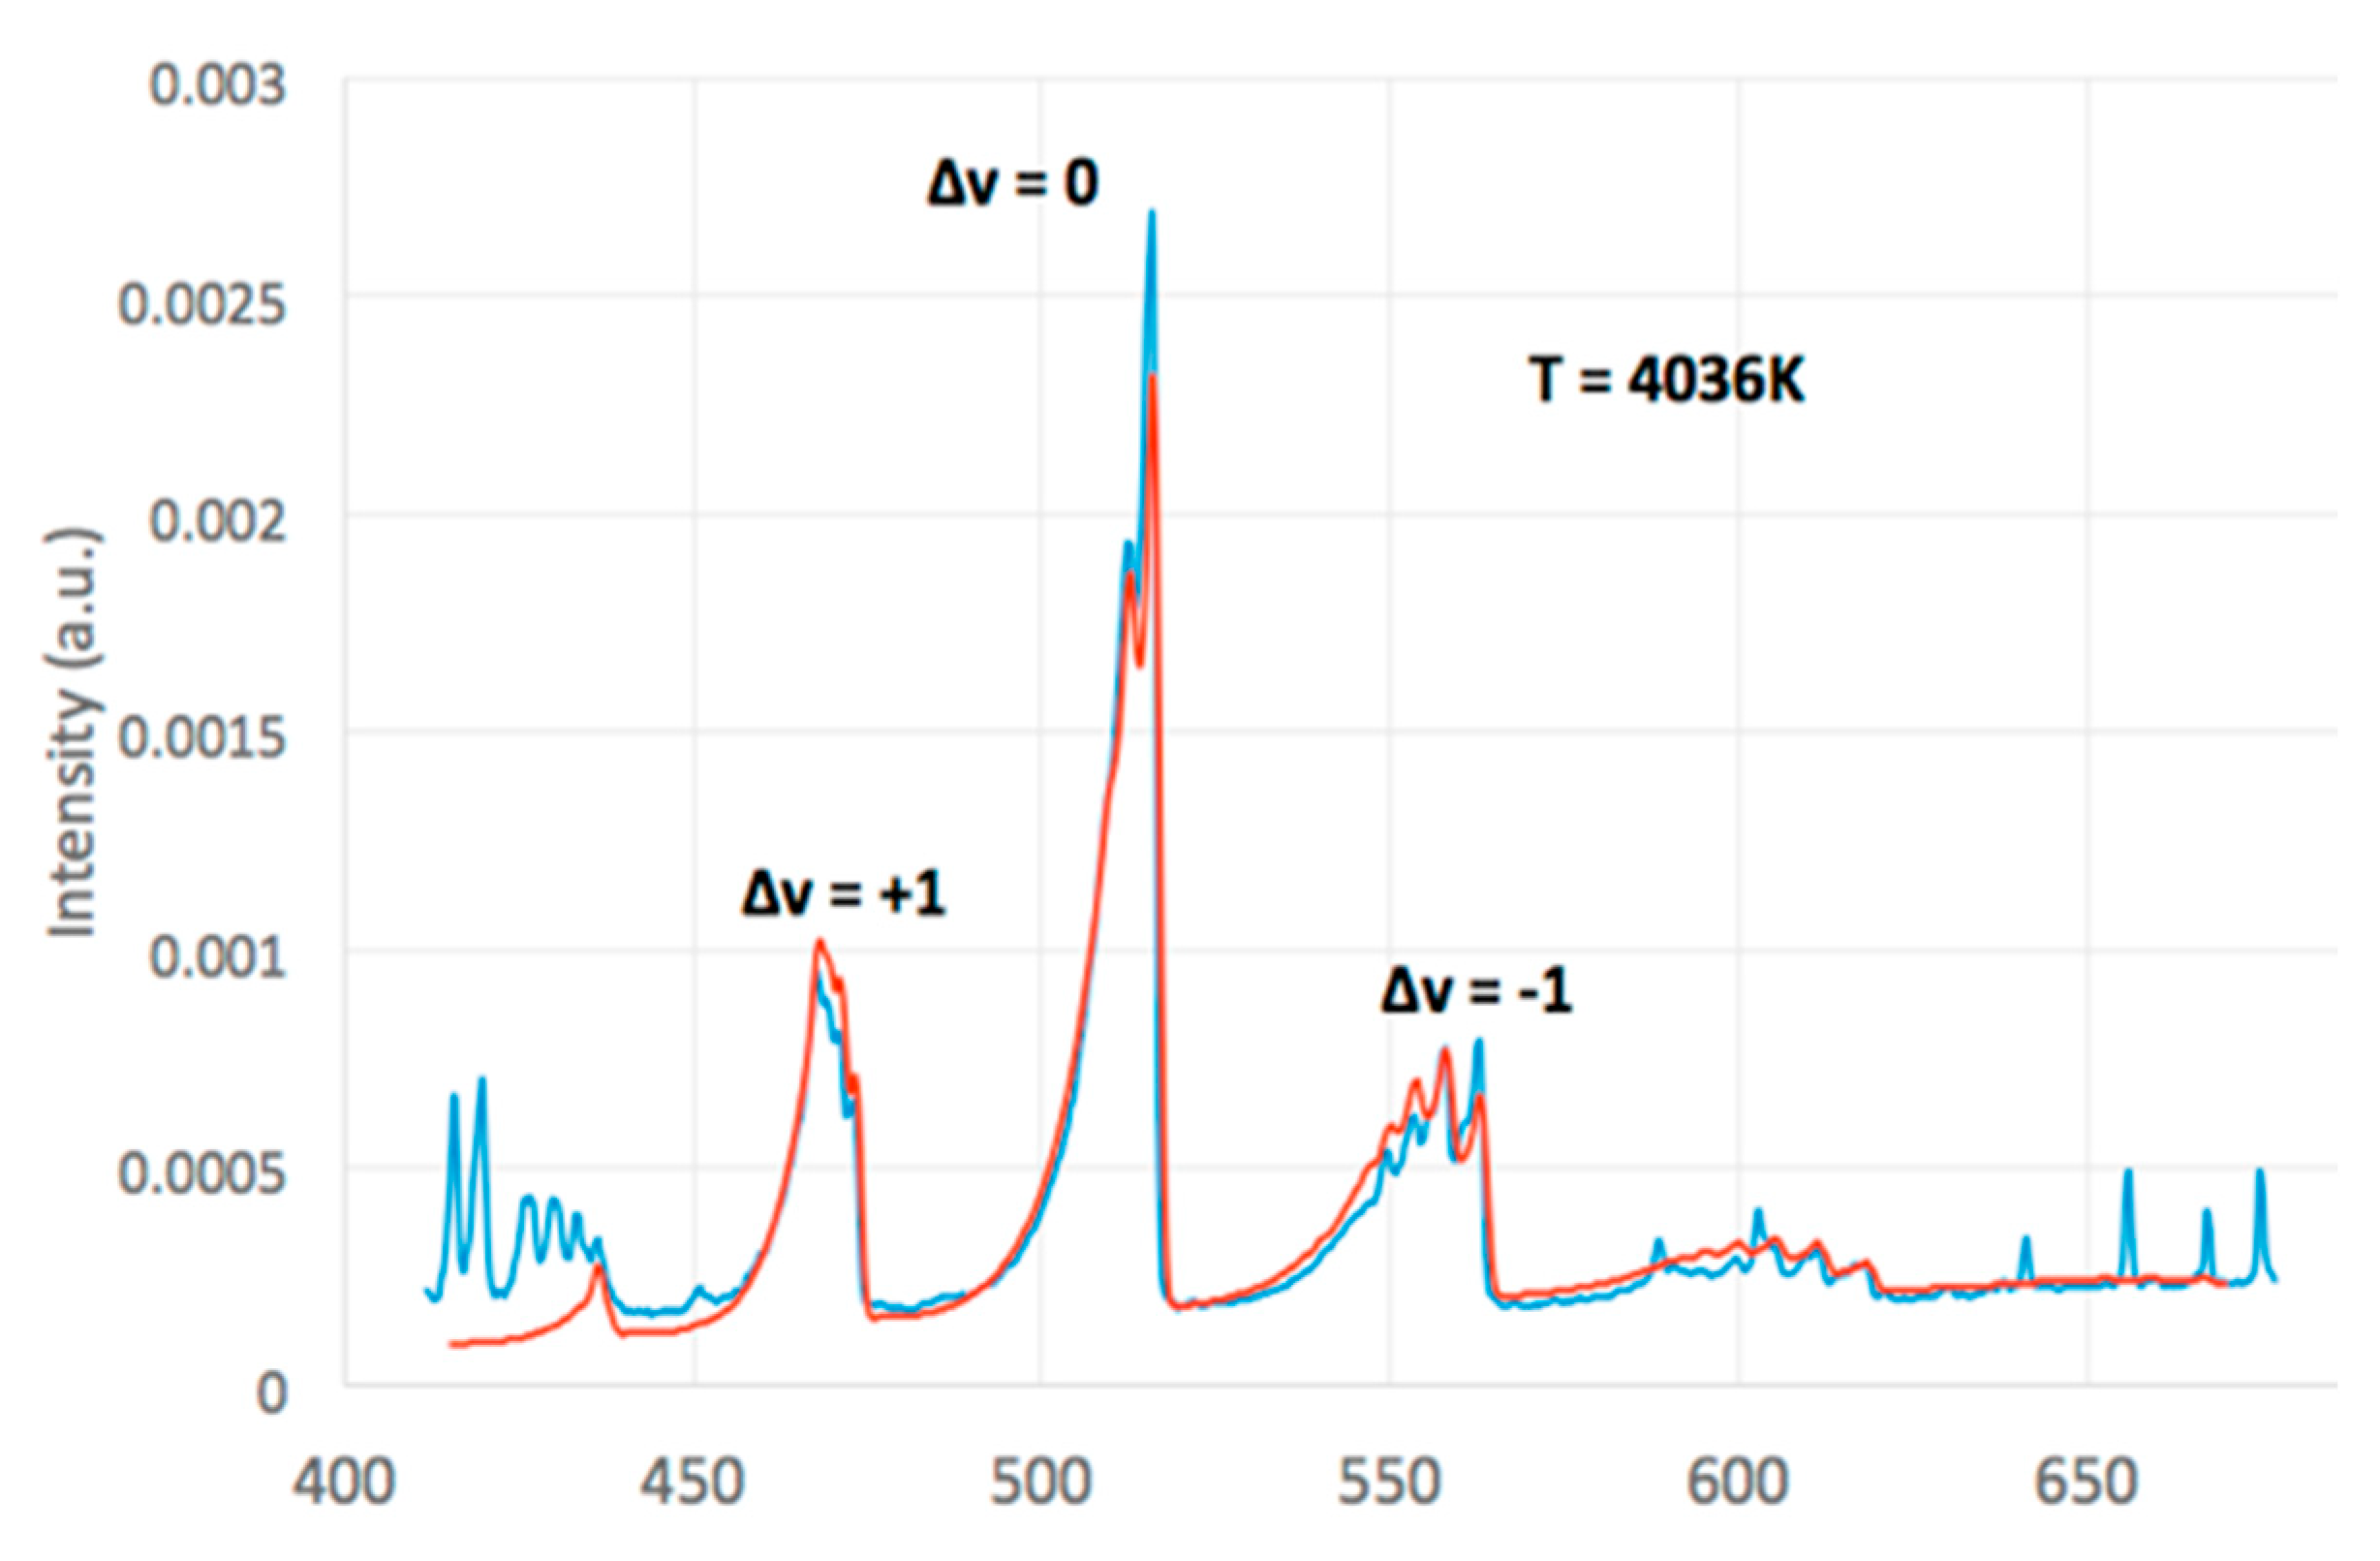
Figure 7 shows the spectrally resolved emission from in the Swan band system, (d3g − a3u) observed throughout the MW reactor. Overlaid is a fit to the vibration profile (progression band) [34]. Based on the relative intensities of these vibrational bands, the temperature of the radical is ~4000 K, substantially higher than the blackbody temperature of the MW pyrolytic carbon aerosol. In fact, along the entire reactor volume, the temperature is far above that of the solid carbon aerosol, as shown in Figure 8. In a MW-driven plasma environment, such non-equilibrium temperatures are not unusual—indeed, they are indicative of a non-thermal system wherein not all species and energy modes are thermalized [35]. It can be inferred that the electron temperature—driving molecular dissociation and the radical pool generated from such processes—is far from thermal equilibrium [36]. Moreover, the C2 radical emission is quite intense. Though only a qualitative measure is possible, the signal-to-noise ratio suggests a high concentration. A semi-quantitative comparison can be made by comparing spectral intensities per wavelength (or per spectral unit) between and blackbody emission as next outlined.
Using a NIST-traceable blackbody tungsten lamp, emitting 80.3 μW per nm-sr-cm2, at 650 nm, the photon equivalent is 2.63 × 10¹⁴ s−1. This conversion then allows the ratio of spectral intensity to blackbody radiation to be converted to number of photons emitted by radicals. Given the same solid angle for irradiance collection from the lamp as from the reactor, as defined by the fiber optic cable and input lens, this calibration lamp flux is scaled by the ratio of the emission at 516.5 nm to the observed blackbody intensity at 650 nm (where there is measurable blackbody radiance) over an equivalent wavelength interval, the ratio between the lamp and reactor blackbody irradiance at 650 nm, and the ratio of the instrument response at 516.5 and 650 nm, yielding an concentration as 1 × 10¹⁰/cm3, assuming optically thin conditions (i.e., no radiation trapping). For an electronically excited molecular radical, this is astounding and, moreover, indicates that the ground state number concentration of C2 is significantly larger. With an Einstein A value (v’ = 0 − v” = 0) of 6.36 × 10⁶ s−1 and collisional quenching (for ) at atmospheric pressure and 1000 °C, estimated as 109 s−1 at 1500 K (based on hard sphere collision rate with unitary deactivation probability), gives a fluorescent quantum yield of ~0.001, meaning that for every 1000 radicals produced, fluorescence from only 1 is observed. With this high quenching rate, the observed emission is used to estimate the C2 ground electronic state concentration. Scaling the intensity by the blackbody relative intensity and multiplying by the photon equivalent emission and inverse quantum yield estimates the C2 ground electronic state number concentration of order 1013/cm3. Although this is a few orders of magnitude estimate, at best, given the assumptions, the value is instructive as it lies within the estimated free electron density in the microwave plasma, ~1012–1015/m3. As in combustion, the favored reactions for production are expressed by reactions (1) & (2),
with CH2, CH radicals, and C-atoms being formed by successive electron impact dissociation and dehydrogenation reactions, and with collisional deactivation by reaction (3),
where M is the collisional partner, Ar background, or other methane-derived hydrocarbon. Still, this is indirect support for the high C2 ground state concentration. In fact, the C2 ground state radical concentration is likely significantly larger, as direct production via dehydrogenation of C2H2 can also contribute (but for which the C2 produced is “dark”, i.e., unobservable). This high radical concentration supports the tenet that plasma-induced perturbation to the radical pool alters the carbon formation mechanisms along the particle growth path.
4. Discussion
The significance of the radical temperature and concentration should be considered in light of the particle formation process. Acetylene addition to aromatic rings and polycyclic aromatic hydrocarbon growth, whether in the gas phase or on the particle surface, occur via a sequence of radical reactions. This well-known hydrogen abstraction acetylene addition (HACA) mechanism was formulated based on shock tube pyrolysis studies using acetylene [37]. It has subsequently found wide applicability to soot formation in flames. Though oxidative reactions and associated intermediates are now recognized as contributing to an expanded version, it is still applicable to the pyrolytic processes occurring in the MW reactor [38]. Both physical and reactive coalescence between large polycyclic aromatics has been cited as operable for particle inception [39]. Thereafter, growth occurs via the HACA mechanism—the essence being that all reactive steps associated with molecular growth and reactive addition to the particle surface are driven by reactions involving radical species, in particular, acetylene, C2H2 [40]. While other radicals have less favorable fluorescence yields, the C2 radical concentration and excited state temperature may be taken as indicative of the large perturbations to the radical pool by virtue of the plasma environment [41]. The quite different nanostructure evident in the MW-produced carbon is postulated to be due to this highly perturbed radical pool with the resulting radical reactive growth processes and additions to the forming particle then leading to a different, graphitic nanostructure. While at best an inference, the tests with a pre-formed carbon, XC-72 fed through the MW reactor clearly shows that the level of structure evident in the MW-formed carbon is not due to post-formation restructuring. Notably, related studies of carbon nanotube formation and, more recently, graphene in MW plasma systems, have also shown differences in the nanostructure in their reported HRTEM of the solid carbon product formed in these plasma environments [42]. It is illuminating that these reports cite the radicals formed by the plasma and the non-thermal reactive system created by the plasma environment.
While the radical pool is decidedly non-thermal, a possible contributing factor should be considered. As shown in Figure 7, the blackbody temperature along the entire reactor’s length is less than 1500 K. As shown in diffusion flames, soot inception occurs in fuel-rich and relatively “cold” regions (<1000 K, along the center streamline), with subsequent growth occurring along an increasing temperature gradient, only reaching higher temperatures during latter stages of growth [43]. Therein, carbon aerosol formation and initial growth occurs in a very different chemical and temperature field than in a diffusion flame or fuel-rich core of a vaporizing fuel spray [44]. With the earliest stages of “soot” formation already occurring at 1500 K, as also all subsequent growth, there is no initial “low temperature species and particle concentration buildup, nor intermediate carbonization stage after inception and initial particle growth—rather, it is concurrent. Additionally, the high particle temperature would facilitate carbon skeletal rearrangements along with dehydrogenation and aromatization reactions [45], likely contributing to the ordered lamellae. Indeed, with inception occurring at high temperatures the disordered core commonly observed in flame formed soot is absent in the MW-produced soot, as evident in the HRTEM images in Figure 2. Observed highly ordered structures are counter to the amorphous cores of flame-formed soot particles, and many carbon blacks. Such structures suggest that, from the earliest stages of particle inception, the operative pyrolysis reactions are different, or at least differently weighted compared to a purely thermally driven system. This concurrent growth-carbonization explanation is consistent with the results with the observations for MW processing of the pre-formed XC-72, wherein, with the initial structure preset by its temperature–time trajectory during manufacture, subsequent graphitization, to any significant degree, is inhibited by steric and bonding constraints between lamellae.
Though, the residual gaseous products are not the primary focus of this article. Their identity and distributions are the net result between gas phase pyrolysis reactions for their formation and their consumption into high molecular weight polycyclic aromatic hydrocarbon (PAH)s and particle growth. The prevalence of unsaturated species and C6-based aromatics is consistent with the pyrolysis reactions in the plasma and their overall description by the HACA mechanism [37]. Still, it should be noted that the plasma consists of ions, hydrocarbon radicals, and other excited state species, creating a very different chemical environment than normally exists within the soot-formation regions of flames. To date, no model for carbon aerosol (or “soot” in combustion) includes the nanostructure of the forming carbon particles throughout growth. Nanostructure differences dependent upon mass-growth species are unaccounted for, although such dependencies have been shown in combustion, produced from diesel engines [46] and jet engines [47], with chemical mechanisms for such validated in laboratory diffusion [48] and pre-mixed flames [49]. In this context, motivated by the structured carbon products, the spatial and temporal uniformity of the MW plasma reaction environment will be key to dissecting the governing factors.
An intriguing feature of the MW plasma for carbon aerosol formation is the uniformity of the plasma along the reactor length and non-equilibrium conditions throughout. MW processing of a pre-formed carbon, as illustrated here for XC-72, leads to restructuring, but not with greater order, i.e., graphitic content. In contrast, the in situ generated aerosol has high order as observed via HRTEM and shown by XRD analyses. As noted, the degree of order is surprising for the comparatively low temperature of formation for the carbon product. The plasma-assisted radical concentration and uniformity of particle growth conditions suggests intriguing possibilities for producing carbon products with graphitic content without requiring post-synthesis high temperature heat treatment. Unlike other MW synthesis studies for carbon materials, such as nanotubes, the present flow-through reactor system, as a continuous process, offers ready scale-up potential.
5. Conclusions
Carbons formed in microwave-driven, plasma-assisted pyrolytic decomposition of methane possess graphitic structure. HRTEM reveals graphitic onion-like particles, hollow capsules, and amorphous spherules, similar to carbon black. Bulk oxidative analysis by TGA reveals three forms of carbon, while XRD supports the interpretation of three forms with different crystalline structure. For each form, lamellae are significantly longer, and crystallites, overall, are larger by reference to a conductive carbon black. The graphitic structure does not arise from microwave exposure but, as proposed, plasma perturbation to the radical pool. The estimated C2 radical concentration is found far from thermodynamic equilibrium, with the temperature far in excess of the blackbody temperature measured for the carbon aerosol. Based on these representative measures, both concentration and temperature of the radical pool are postulated to perturb the chemical reactions responsible for the solid carbon formation, resulting in the different nanostructures, as qualitatively observed by TEM and supported by XRD and TGA characterizations. Carbon particle inception and growth at uniform temperature may also contribute to the observed ordered nanostructure in the product carbon(s).
Author Contributions
Conceptualization, G.S., and R.V.W.; Methodology, R.V.W. and G.S.; Validation, E.M., A.S.; Formal analysis, A.S., and R.V.W.; Investigation, E.M., A.S.; Resources, G.S., and R.V.W.; Data curation, E.M., and A.S.; Writing—original draft preparation, R.V.W.; Writing—G.S., R.V.W.; Supervision, G.S. and R.V.W.; Project administration, G.S.; Funding acquisition, G.S.
Funding
This material is based on work supported by the Department of Energy, Office of Science through subaward agreement no. 186949 with H Quest Vanguard, Inc. under the Prime Award DE-SC0015895 Phase I SBIR.
Acknowledgments
H Quest Vanguard, Inc. is a privately held technology company, based in Pittsburgh, Pennsylvania, focused on the development and commercialization of novel hydrocarbon conversion technologies. The authors thank Joseph P. Abrahamson for the HRTEM data. Arup Sengupta gratefully acknowledges a summer internship at H Quest Vanguard Inc. The XC-72 was supplied by Cabot Corp.
Conflicts of Interest
The authors declare no conflict of interest.
References
- Report of the Hydrogen Production Expert Panel: A Subcommittee of the Hydrogen & Fuel Cell Technical Advisory Committee, May 2013. Available online: https://www.hydrogen.energy.gov/pdfs/hpep_report_2013.pdf (accessed on 15 December 2017).
- Abbas, H.F.; Daud, W.W. Hydrogen production by methane decomposition: A review. Int. J. Hydrog. Energy 2010, 35, 1160–1190. [Google Scholar] [CrossRef]
- Marbán, G.; Valdés-Solís, T. Towards the hydrogen economy? Int. J. Hydrog. Energy 2007, 32, 1625–1637. [Google Scholar] [CrossRef] [Green Version]
- Spath, P.L.; Mann, M.K. Life Cycle Assessment of Hydrogen Production via Natural Gas Steam Reforming; Technical Report NREL/TP-570-27637; National Renewable Energy Laboratory: Golden, CO, USA, 2001.
- Lee, K.K.; Han, G.Y.; Yoon, K.J.; Lee, B.K. Thermocatalytic hydrogen production from the methane in a fluidized bed with activated carbon catalyst. Catal. Today 2004, 93, 81–86. [Google Scholar] [CrossRef]
- Abbas, H.F.; Daud, W.W. Hydrogen production by thermocatalytic decomposition of methane using a fixed bed activated carbon in a pilot scale unit: Apparent kinetic, deactivation and diffusional limitation studies. Int. J. Hydrog. Energy 2010, 35, 12268–12276. [Google Scholar] [CrossRef]
- Amin, A.M.; Croiset, E.; Epling, W. Review of methane catalytic cracking for hydrogen production. Int. J. Hydrog. Energy 2011, 36, 2904–2935. [Google Scholar] [CrossRef]
- Abánades, A.; Ruiz, E.; Ferruelo, E.M.; Hernández, F.; Cabanillas, A.; Martínez-Val, J.M.; Rubio, J.A.; López, C.; Gavela, R.; Barrera, G.; et al. Experimental analysis of direct thermal methane cracking. Int. J. Hydrog. Energy 2011, 36, 12877–12886. [Google Scholar] [Green Version]
- Ashik, U.P.M.; Daud, W.W.; Abbas, H.F. Production of greenhouse gas free hydrogen by thermocatalytic decomposition of methane—A review. Renew. Sustain. Energy Rev. 2015, 44, 221–256. [Google Scholar] [CrossRef]
- Suelves, I.; Pinilla, J.L.; Lázaro, M.J.; Moliner, R. Carbonaceous materials as catalysts for decomposition of methane. Chem. Eng. J. 2008, 140, 432–438. [Google Scholar] [CrossRef]
- Muradov, N.Z.; Veziroğlu, T.N. “Green” path from fossil-based to hydrogen economy: An overview of carbon-neutral technologies. Int. J. Hydrog. Energy 2008, 33, 6804–6839. [Google Scholar] [CrossRef]
- Gaudernack, B.; Lynum, S. Hydrogen from natural gas without release of CO2 to the atmosphere. Int. J. Hydrog. Energy 1998, 23, 1087–1093. [Google Scholar] [CrossRef]
- Tsai, C.H.; Chen, K.T. Production of hydrogen and nano carbon powders from direct plasmalysis of methane. Int. J. Hydrog. Energy 2009, 34, 833–838. [Google Scholar] [CrossRef]
- Jasiński, M.; Dors, M.; Mizeraczyk, J. Production of hydrogen via methane reforming using atmospheric pressure microwave plasma. J. Power Sources 2008, 181, 41–45. [Google Scholar] [CrossRef]
- Muradov, N. Thermocatalytic CO2-free production of hydrogen from hydrocarbon fuels. In Proceedings of the 2000 Hydrogen Program Review, NREL/CP-570-28890; NREL/CP-610-32405; U.S. Department of Energy (DOE): Washington, DC, USA, 2002. [Google Scholar]
- Muradov, N.; Smith, F.; Ali, T. Catalytic activity of carbons for methane decomposition reaction. Catal. Today 2005, 102, 225–233. [Google Scholar] [CrossRef]
- Fidalgo, B.; Fernández, Y.; Domínguez, A.; Pis, J.J.; Menéndez, J.A. Microwave-assisted pyrolysis of CH4/N 2 mixtures over activated carbon. J. Anal. Appl. Pyrolysis 2008, 82, 158–162. [Google Scholar] [CrossRef]
- Domínguez, A.; Fidalgo, B.; Fernández, Y.; Pis, J.J.; Menéndez, J.A. Microwave-assisted catalytic decomposition of methane over activated carbon for CO2-free hydrogen production. Int. J. Hydrog. Energy 2007, 32, 4792–4799. [Google Scholar] [CrossRef]
- Muradov, N.; Smith, F.; Bokerman, G. Methane activation by nonthermal plasma generated carbon aerosols. J. Phys. Chem. C 2009, 113, 9737–9747. [Google Scholar] [CrossRef]
- Koptsov, G.L.; Strohm, J.J.; Roberts, B.Q.; H Quest Partners, L.P.; Battelle Memorial Institute Inc. Wave Modes for the Microwave Induced Conversion of Coal. U.S. Patent 14/881,991, 13 October 2015. [Google Scholar]
- Skoptsov, G.L.; Johnson, A.A.; H Quest Partners, L.P. Method for Processing Hydrocarbon Fuels Using Microwave Energy. U.S. Patent 9,682,359, 20 June 2017. [Google Scholar]
- Strohm, J.J.; Linehan, J.C.; Roberts, B.Q.; McMakin, D.L.; Sheen, D.M.; Griffin, J.W.; Franz, J.A.; Battelle Memorial Institute. Heavy Fossil Hydrocarbon Conversion and Upgrading Using Radio-Frequency or Microwave Energy. U.S. Patent 13/401,216, 23 August 2012. [Google Scholar]
- Dato, A.; Radmilovic, V.; Lee, Z.; Phillips, J.; Frenklach, M. Substrate-free gas-phase synthesis of graphene sheets. Nano Lett. 2008, 8, 2012–2016. [Google Scholar] [CrossRef] [PubMed]
- Fridman, A. Plasma Chemistry; Cambridge University Press: Cambridge, UK, 2008. [Google Scholar]
- Keipi, T.; Tolvanen, K.E.; Tolvanen, H.; Konttinen, J. Thermo-catalytic decomposition of methane: The effect of reaction parameters on process design and the utilization possibilities of the produced carbon. Energy Convers. Manag. 2016, 126, 923–934. [Google Scholar] [CrossRef]
- Liang, B.; Lehmann, J.; Solomon, D.; Kinyangi, J.; Grossman, J.; O’neill, B.; Skjemstad, J.O.; Thies, J.; Luizao, F.J.; Petersen, J.; et al. Black carbon increases cation exchange capacity in soils. Soil Sci. Soc. Am. J. 2006, 70, 1719–1730. [Google Scholar] [CrossRef]
- Vander Wal, R.L. Soot Nanostructure: Definition, Quantification and Implications; (No. 2005-01-0964). SAE Technical Paper; SAE: Warrendale, PA, USA, 2005. [Google Scholar]
- Gaddam, C.K.; Vander Wal, R.L.; Chen, X.; Yezerets, A.; Kamasamudram, K. Reconciliation of carbon oxidation rates and activation energies based on changing nanostructure. Carbon 2016, 98, 545–556. [Google Scholar] [CrossRef]
- Vander Wal, R.L.; Tomasek, A.J. Soot oxidation: Dependence upon initial nanostructure. Combust. Flame 2003, 134, 1–9. [Google Scholar] [CrossRef]
- Pantea, D.; Darmstadt, H.; Kaliaguine, S.; Roy, C. Electrical conductivity of conductive carbon blacks: Influence of surface chemistry and topology. Appl. Surf. Sci. 2003, 217, 181–193. [Google Scholar] [CrossRef]
- Oberlin, A. Carbonization and graphitization. Carbon 1984, 22, 521–541. [Google Scholar] [CrossRef]
- Vander Wal, R.L.; Tomasek, A.J.; Street, K.W.; Hull, D.R.; Thompson, W.K. Carbon Nanostructure Examined by Lattice Fringe Analysis of High Resolution Transmission Electron Microscopy Images. Appl. Spectrosc. 2004, 58, 230–237. [Google Scholar] [CrossRef] [PubMed]
- Muradov, N.; Smith, F.; Bockerman, G.; Scammon, K. Thermocatalytic decomposition of natural gas over plasma-generated carbon aerosols for sustainable production of hydrogen and carbon. Appl. Catal. A Gen. 2009, 365, 292–300. [Google Scholar] [CrossRef]
- Parigger, C.G.; Woods, A.C.; Surmick, D.M.; Gautam, G.; Witte, M.J.; Hornkohl, J.O. Computation of diatomic molecular spectra for selected transitions of aluminum monoxide, cyanide, diatomic carbon, and titanium monoxide. Spectrochim. Acta Part B Atom. Spectrosc. 2015, 107, 132–138. [Google Scholar] [CrossRef]
- Jasiński, M.; Dors, M.; Nowakowska, H.; Mizeraczyk, J. Hydrogen production via methane reforming using various microwave plasma sources. Chem. Listy 2008, 102, 1332–1337. [Google Scholar]
- Pellerin, S.; Musiol, K.; Motret, O.; Pokrzywka, B.; Chapelle, J. Application of the (0, 0) Swan band spectrum for temperature measurements. J. Phys. D Appl. Phys. 1996, 29, 2850. [Google Scholar] [CrossRef]
- Frenklach, M. Reaction mechanism of soot formation in flames. Phys. Chem. Chem. Phys. 2002, 4, 2028–2037. [Google Scholar] [CrossRef]
- Yan, B.; Cheng, Y.; Li, T.; Cheng, Y. Detailed kinetic modeling of acetylene decomposition/soot formation during quenching of coal pyrolysis in thermal plasma. Energy 2017, 121, 10–20. [Google Scholar] [CrossRef]
- Wang, H. Formation of nascent soot and other condensed-phase materials in flames. Proc. Combust. Inst. 2011, 33, 41–67. [Google Scholar] [CrossRef]
- Appel, J.; Bockhorn, H.; Frenklach, M. Kinetic modeling of soot formation with detailed chemistry and physics: Laminar premixed flames of C2 hydrocarbons. Combust. Flame 2000, 121, 122–136. [Google Scholar] [CrossRef]
- Mousavi, S.J.; Farsani, M.H.; Darbani, S.M.R.; Mousaviazar, A.; Soltanolkotabi, M.; Majd, A.E. CN and C2 vibrational spectra analysis in molecular LIBS of organic materials. Appl. Phys. B 2016, 122, 106. [Google Scholar] [CrossRef]
- Dato, A.; Lee, Z.; Jeon, K.J.; Erni, R.; Radmilovic, V.; Richardson, T.J.; Frenklach, M. Clean and highly ordered graphene synthesized in the gas phase. Chem. Commun. 2009, 40, 6095–6097. [Google Scholar] [CrossRef] [PubMed]
- McEnally, C.S.; Köylü, Ü.Ö.; Pfefferle, L.D.; Rosner, D.E. Soot volume fraction and temperature measurements in laminar nonpremixed flames using thermocouples. Combust. Flame 1997, 109, 701–720. [Google Scholar] [CrossRef]
- Sirignano, W.A. Fuel droplet vaporization and spray combustion theory. Prog. Energy Combust. Sci. 1983, 9, 291–322. [Google Scholar] [CrossRef]
- Kholghy, M.R.; Veshkini, A.; Thomson, M.J. The core–shell internal nanostructure of soot–A criterion to model soot maturity. Carbon 2016, 100, 508–536. [Google Scholar] [CrossRef]
- Vander Wal, R.L.; Strzelec, A.; Toops, T.J.; Stuart Daw, C.; Genzale, C.L. Forensics of soot: C5-related nanostructure as a diagnostic of in-cylinder chemistry. Fuel 2013, 113, 522–526. [Google Scholar] [CrossRef]
- Huang, C.H.; Vander Wal, R.L. Effect of soot structure evolution from commercial jet engine burning petroleum-based JP-8 and synthetic HRJ and FT fuels. Energy Fuels 2013, 27, 4946–4958. [Google Scholar] [CrossRef]
- Huang, C.H.; Vander Wal, R.L. Partial premixing effects upon soot nanostructure. Combust. Flame 2016, 168, 403–408. [Google Scholar] [CrossRef] [Green Version]
- Huang, C.H. Soot Nanostructure Evolution from Gas Turbine Engine, Premixed and Diffusion Flame: Equivalence Ratio, Flame Temperature, and Fuel Dependencies. Ph.D. Thesis, Pennsylvania State University, State College, PA, USA, 2016. [Google Scholar]
Figure 1.
Schematic of Wave Liquefaction reactor and solid carbon collection.

Figure 2.
SEM image of the microwave-produced carbon showing the particle and aggregate morphology.

Figure 3.
HRTEM images of carbon forms produced in the microwave-driven, plasma-mediated methane decomposition: aggregated graphitic particles (a); aggregated mixed structures (b); higher resolution of individual graphitic particle types, (c,d); higher resolution of an individual amorphous particle (e); and nanographene sheets (f).

Figure 4.
Thermogravimetric scan of the MW produced carbon (red curve) in air and its derivative profile (blue curve)—indicating three different carbon oxidation temperature peaks.
Figure 4.
Thermogravimetric scan of the MW produced carbon (red curve) in air and its derivative profile (blue curve)—indicating three different carbon oxidation temperature peaks.

Figure 5.
XRD spectrum for the MW generated carbon with a 3-peak deconvolution of the d002 peak. Goodness of fit is shown by the residual above.
Figure 5.
XRD spectrum for the MW generated carbon with a 3-peak deconvolution of the d002 peak. Goodness of fit is shown by the residual above.

Figure 6.
HRTEM images of the carbon black XC-72. Nascent form: illustrative aggregate (a); higher magnification image showing amorphous nanostructure of individual particles (b); Microwave heated: illustrative aggregate, unaltered in general morphology (c); and higher magnification image showing restructured lamellae within individual particles (d).

Figure 7.
Swan band emission from C2 (blue) and simulated spectral fit (red), each with vibrational bands as labelled. Overall, T = 4036 K.
Figure 7.
Swan band emission from C2 (blue) and simulated spectral fit (red), each with vibrational bands as labelled. Overall, T = 4036 K.

Figure 8.
Temperature profiles along the reactor, based on blackbody fit to spectral radiance and by fit to the C2 Swan band emission (d3g − a3 u) system, across the vibrational bands, as shown in Figure 7.
Figure 8.
Temperature profiles along the reactor, based on blackbody fit to spectral radiance and by fit to the C2 Swan band emission (d3g − a3 u) system, across the vibrational bands, as shown in Figure 7.


Table 1.
XRD analysis of carbon black.
| Run | Lc (nm) | Stack Number | La (nm) |
|---|---|---|---|
| XC-72 (virgin) | 1.49 ± 0.05 | ~5 | 4.00 ± 0.52 |
| MW (Ar) XC-72 (7 pts) | 1.56 ± 0.06 | ~5 | 3.93 ± 0.42 |
| CH4/MW Carbon (5 pts) | 2.95 ± 0.5 | ~8 | 5.70 ± 0.58 |
| 2.49 ± 0.5 | ~7 | ||
| 6.58 ± 0.5 | ~19 |
Table 2.
Physical and compositional properties of carbon blacks.
| Material (CB) | Surface Area (m2/g) [Pore Volume (cm3/g)] | Elemental Composition (C, H) % |
|---|---|---|
| XC-72 (virgin) | 254 [0.174] | C: ~98 ± 0.2% H: ~1.5% S: ~0.5% |
| CH4/MW Carbon | 136 [0.241] | C: ~98 ± 0.2% H: 1 ± 0.1% |
© 2018 by the authors. Licensee MDPI, Basel, Switzerland. This article is an open access article distributed under the terms and conditions of the Creative Commons Attribution (CC BY) license (http://creativecommons.org/licenses/by/4.0/).
Share and Cite
MDPI and ACS Style
Vander Wal, R.; Sengupta, A.; Musselman, E.; Skoptsov, G. Microwave-Driven Plasma-Mediated Methane Cracking: Product Carbon Characterization. C 2018, 4, 61. https://0-doi-org.brum.beds.ac.uk/10.3390/c4040061
AMA Style
Vander Wal R, Sengupta A, Musselman E, Skoptsov G. Microwave-Driven Plasma-Mediated Methane Cracking: Product Carbon Characterization. C. 2018; 4(4):61. https://0-doi-org.brum.beds.ac.uk/10.3390/c4040061
Chicago/Turabian StyleVander Wal, Randy, Arupananda Sengupta, Evan Musselman, and George Skoptsov. 2018. "Microwave-Driven Plasma-Mediated Methane Cracking: Product Carbon Characterization" C 4, no. 4: 61. https://0-doi-org.brum.beds.ac.uk/10.3390/c4040061
Note that from the first issue of 2016, this journal uses article numbers instead of page numbers. See further details here.