Review

A Review on the Synthesis and Characterization of Biomass-Derived Carbons for Adsorption of Emerging Contaminants from Water

by
Jorge Bedia
*,
Manuel Peñas-Garzón
,
Almudena Gómez-Avilés
,
Juan J. Rodriguez
and
Carolina Belver
Departamento de Ingeniería Química, Facultad de Ciencias, Universidad Autónoma de Madrid, Campus Cantoblanco, E-28049 Madrid, Spain
*
Author to whom correspondence should be addressed.
Submission received: 17 September 2018 / Revised: 31 October 2018 / Accepted: 14 November 2018 / Published: 19 November 2018
(This article belongs to the Special Issue Carbons from Biomasic Waste and Their Applications)

Abstract

:
This review analyzes the preparation and characterization of biomass-derived carbons and their application as adsorbents of emerging contaminants from water. The study begins by identifying the different types of emerging contaminants more often found in water streams, including a brief reference to the available technologies for their removal. It also describes the biomass sources that could be used for the synthesis of biochars and activated carbons (AC). The characterization of the adsorbents and the different approaches that can be followed to learn about the adsorption processes are also detailed. Finally, the work reviews literature studies focused on the adsorption of emerging contaminants on biochars and activated carbons synthesized from biomass precursors.

Graphical Abstract

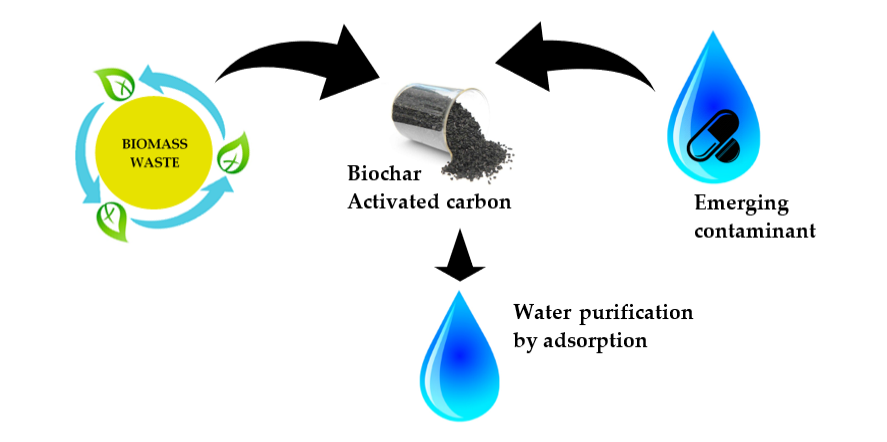
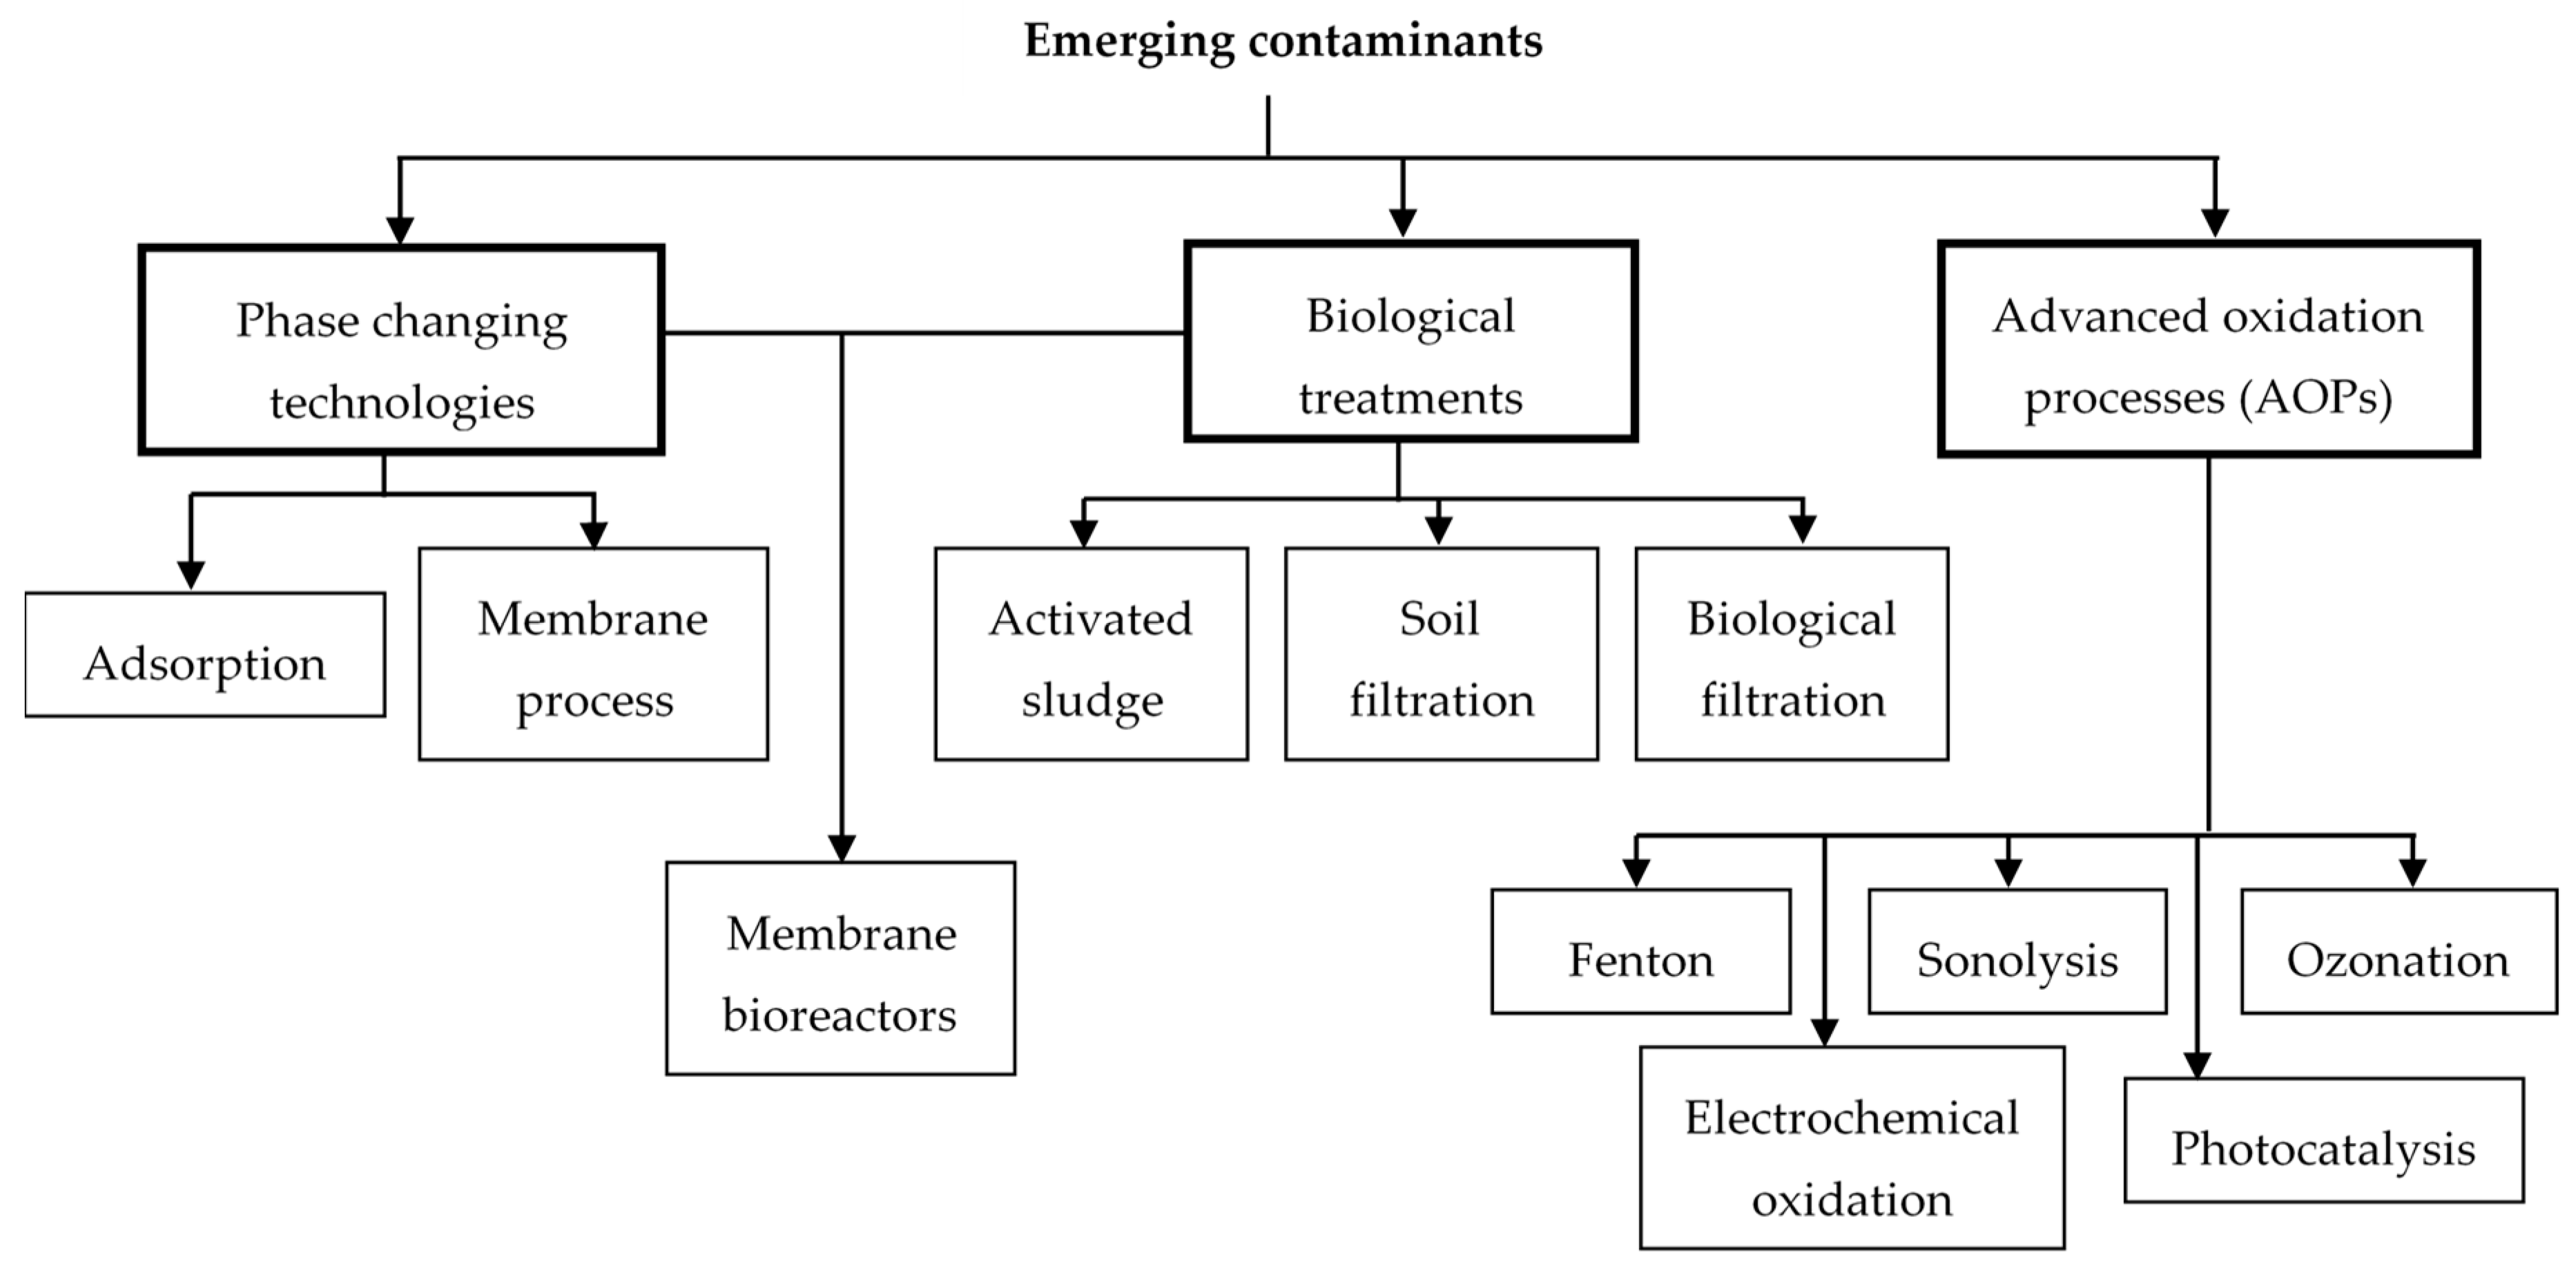
1. Emerging Contaminants

Emerging contaminants (ECs) are those compounds found in wastewater in low concentrations as a consequence of the new consumption habits of our society and the development of more accurate analytical techniques. The discharge limitations of these compounds, due to their very recent appearance in the environment, are not completely or not at all regulated, which can result in real hazards to human health and the environment [1,2]. The list of compounds considered as emerging contaminants includes many different substances, such as pharmaceutical and personal care products (PPCPs), drugs of abuse, food additives, plasticizers and pesticides, among others [3]. Table 1 summarizes the categories, families and most representative examples of ECs usually found in wastewater. Some of the pesticides included in this Table, such as atrazine and diuron, are defined as priority pollutants. Their low concentration, typically in the range from ng·L−1 up to µg·L−1, makes their detection and elimination in conventional water treatment plants very difficult since these are not designed for treating concentrations that are so low [4]. Only the development and greater availability of new and more accurate analytical techniques, such as liquid chromatography coupled with mass spectrometry (LC-MS), has allowed the detection of this new type of pollutants. This fact, together with the foreseeable future development of increasingly restrictive regulations regarding the allowable concentrations of these compounds in effluents, has significantly increased studies aimed at the removal of ECs from wastewater.
The technologies for the removal of ECs from wastewaters can be broadly classified in three subcategories, namely biological treatments, advanced oxidation processes (AOPs) and phase-changing operations [5]. Among biological treatments, activated sludge systems, in both aerobic and anaerobic conditions, are the most commonly studied due to their higher efficiency [6]. Other biological process used for the degradation of ECs are soil [7] and biological filtration [8]. The efficiency of the biological processes increases when combined with phase-changing operations in membrane bioreactors [9], or even electrochemical membrane bioreactors (EMBR) [10,11]. The main problem of using biological processes for the removal of ECs is their significant toxicity towards microorganisms [12]. Advanced oxidation processes (AOPs) use the high reactivity of HO radicals in oxidation reactions, which are able to achieve the mineralization of the pollutants [13]. These processes include Fenton, sonolysis, ozonation, electrochemical oxidation and photocatalysis. Finally, phase changing-technologies are those processes where the contaminants are transferred from one phase (liquid in the case of water treatment) to another (e.g., solid). The main examples include adsorption and membrane processes. Figure 1 summarizes the available technologies for the removal of ECs from wastewater. In this review we focus on adsorption processes. Adsorption has numerous advantages, such as ease of implementation, the use and handling of chemical products is unnecessary, and its cost is relatively low [14,15]. In the literature, a diversity of adsorbents has been used, including clays [16], zeolites [17] or metal organic frameworks [18], but certainly, above all, carbon-based materials have been the most extensively studied [19,20]. The preparation of carbonaceous adsorbents from biomass waste has also important added advantages, such as an effective management of the waste and lower synthesis cost.

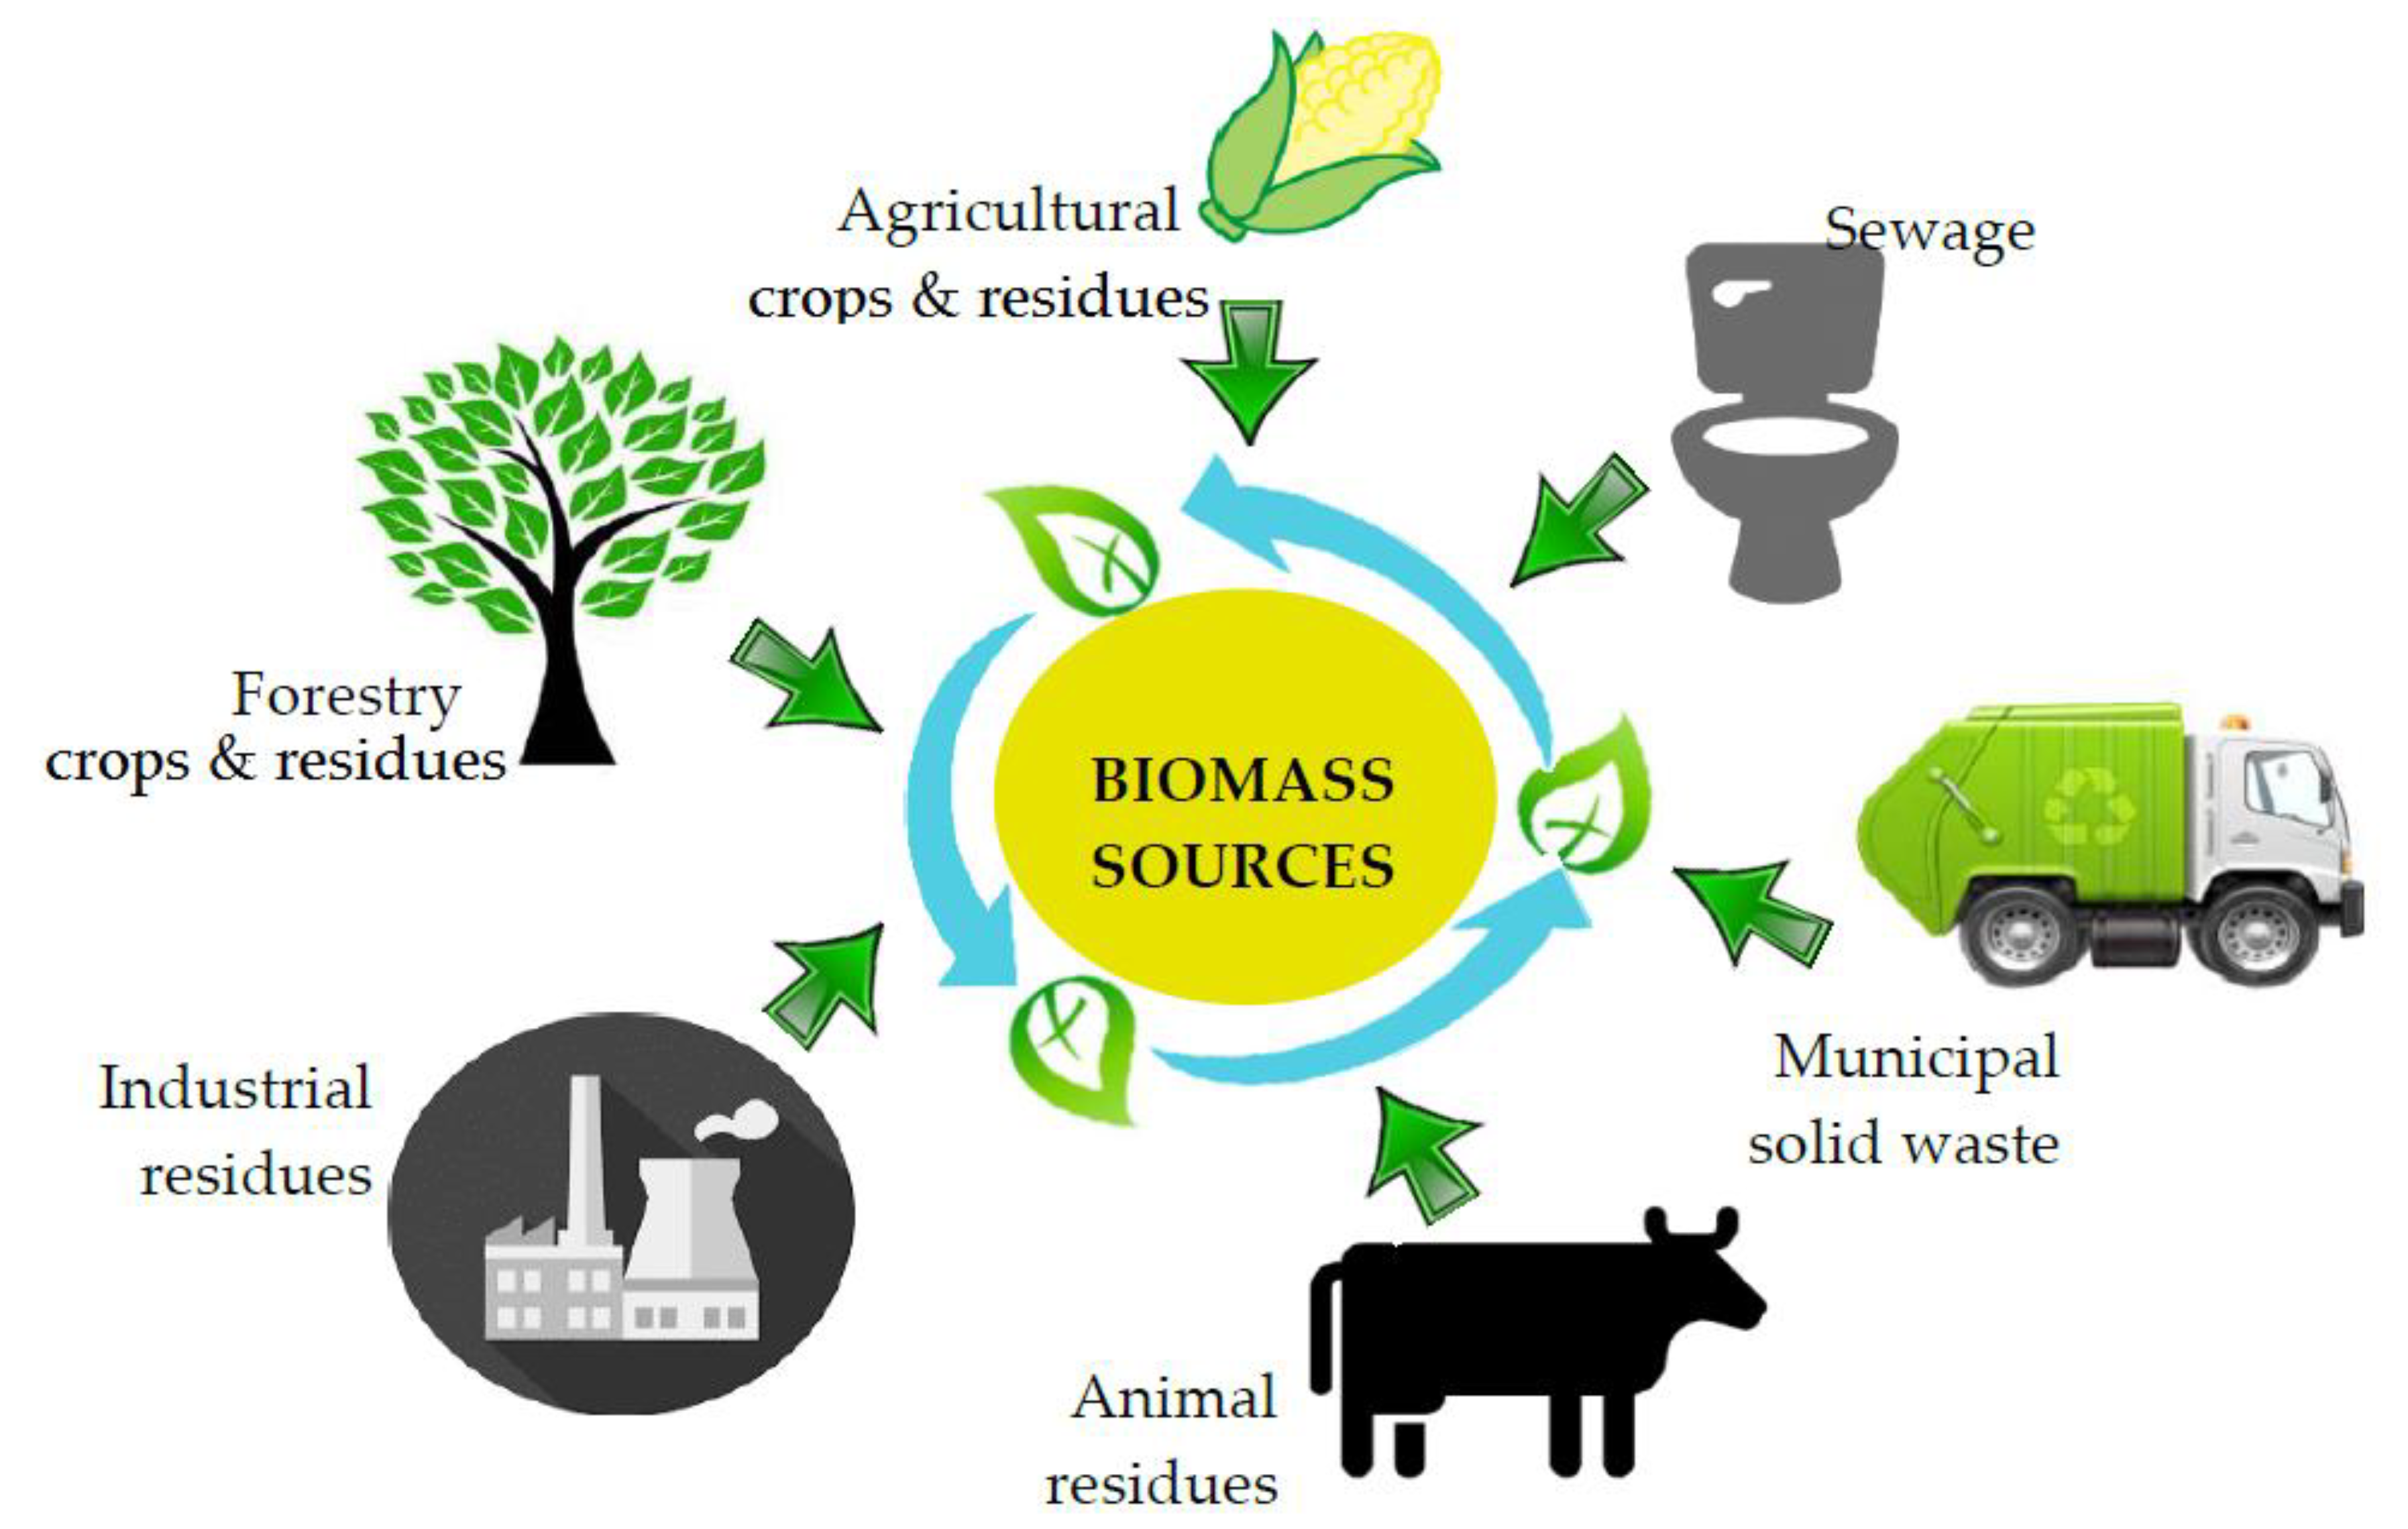
2. Biomass Feedstocks

Biomass uses sunlight and nutrients to grow and generate key components, such as carbohydrates, lipids and proteins, which can be converted to biofuels and different products in the frame of a biorefinery concept [23,24,25]. Biomass covers all forms of organic material, including plants both living and in waste form, and animal waste products. It can be divided in two different categories: (i) waste materials or (ii) dedicated energy crops [26]. Biomass waste materials include agricultural and forest residues, municipal solid waste (MSW), food processing waste and animal manure, among others. The value that can be obtained from these wastes cannot be ignored as an important bioenergy source. If effectively harnessed, biomass wastes can be used as raw material for the synthesis of high-value solid products and/or chemicals, as well as for reducing the energy consumption from non-renewable fossil fuel sources. Furthermore, the use of solid waste materials would also save landfill space and increase the value of the biomass resources [27]. The different types of biomass feedstocks are summarized in Figure 2 and briefly described below.

2.1. Dedicated Energy Crops

Dedicated energy crops can be grown in more or less arid lands, which are not fertile enough for traditional crops but can be used to obtain biomass [28,29]. There exist two main types of dedicated energy crops: herbaceous and woody. The former are grasses annually harvested including bamboo, wheatgrass, and sorghum, among many others. The latter are constituted by fast-growing hardwood trees, such as poplar, willow, maple, walnut and so on.

2.2. Forest Residues

These feedstocks can be categorized in forest residues obtained after logging timber or complete trees grown specifically for biomass collection [30,31]. Forest residues can be also obtained from the excess biomass in high-extension forests. This action reduces the risk of fire and pests, and enhances the forest vitality, productivity and resilience.

2.3. Agricultural Crop Residues

The use of agricultural biomass residues to produce biofuels, energy and value-added materials can achieve interesting environmental and socio-economic benefits. Agricultural crop residues, which include wheat, barley, rye, oat, maize, rice, rapeseed and sunflower, are abundant, diverse, and widely distributed [32,33]. The benefits of the sale of these residues can produce complementary incomes supporting a local economy.

2.4. Algae

Algae as feedstocks include the different biomass that grows in aquatic environments, covering microalgae, seaweed and even cyanobacteria. Algae can grow in different types of waters including fresh, saline, brackish water and even in wastewater from different sources, such as agricultural water, treated industrial wastewater, aquaculture wastewater, water from oil and gas drilling operations, and so on. Due to this, they can be considered a very promising biomass feedstock with very interesting growth potential in the near future [34,35].

2.5. Municipal Solid Wastes (MSW)

Municipal solid wastes (MSW) are the materials discarded in urban areas, including predominantly household wastes. MSW is a heterogeneous biomass feedstock mainly composed of food wastes, paper, wood trimmings and some textiles. A significant proportion of MSW is derived from fossil resources, such as rubber, plastics, and some fabrics [36]. The use of MSW as raw materials for bioenergy can reduce the huge volume of residential and commercial waste addressed to landfills.

2.6. Wet Waste

Wet waste biomass includes food wastes, sewage sludge from municipal wastewater treatment plants, manure slurries, different organic wastes from industrial processes and the biogas obtained by the decomposition of organic matter in the absence of oxygen of any of the above feedstock resources. The transformation of this waste into energy or value-added products can generate additional incomes for rural areas, besides reducing waste-disposal problems [37,38].

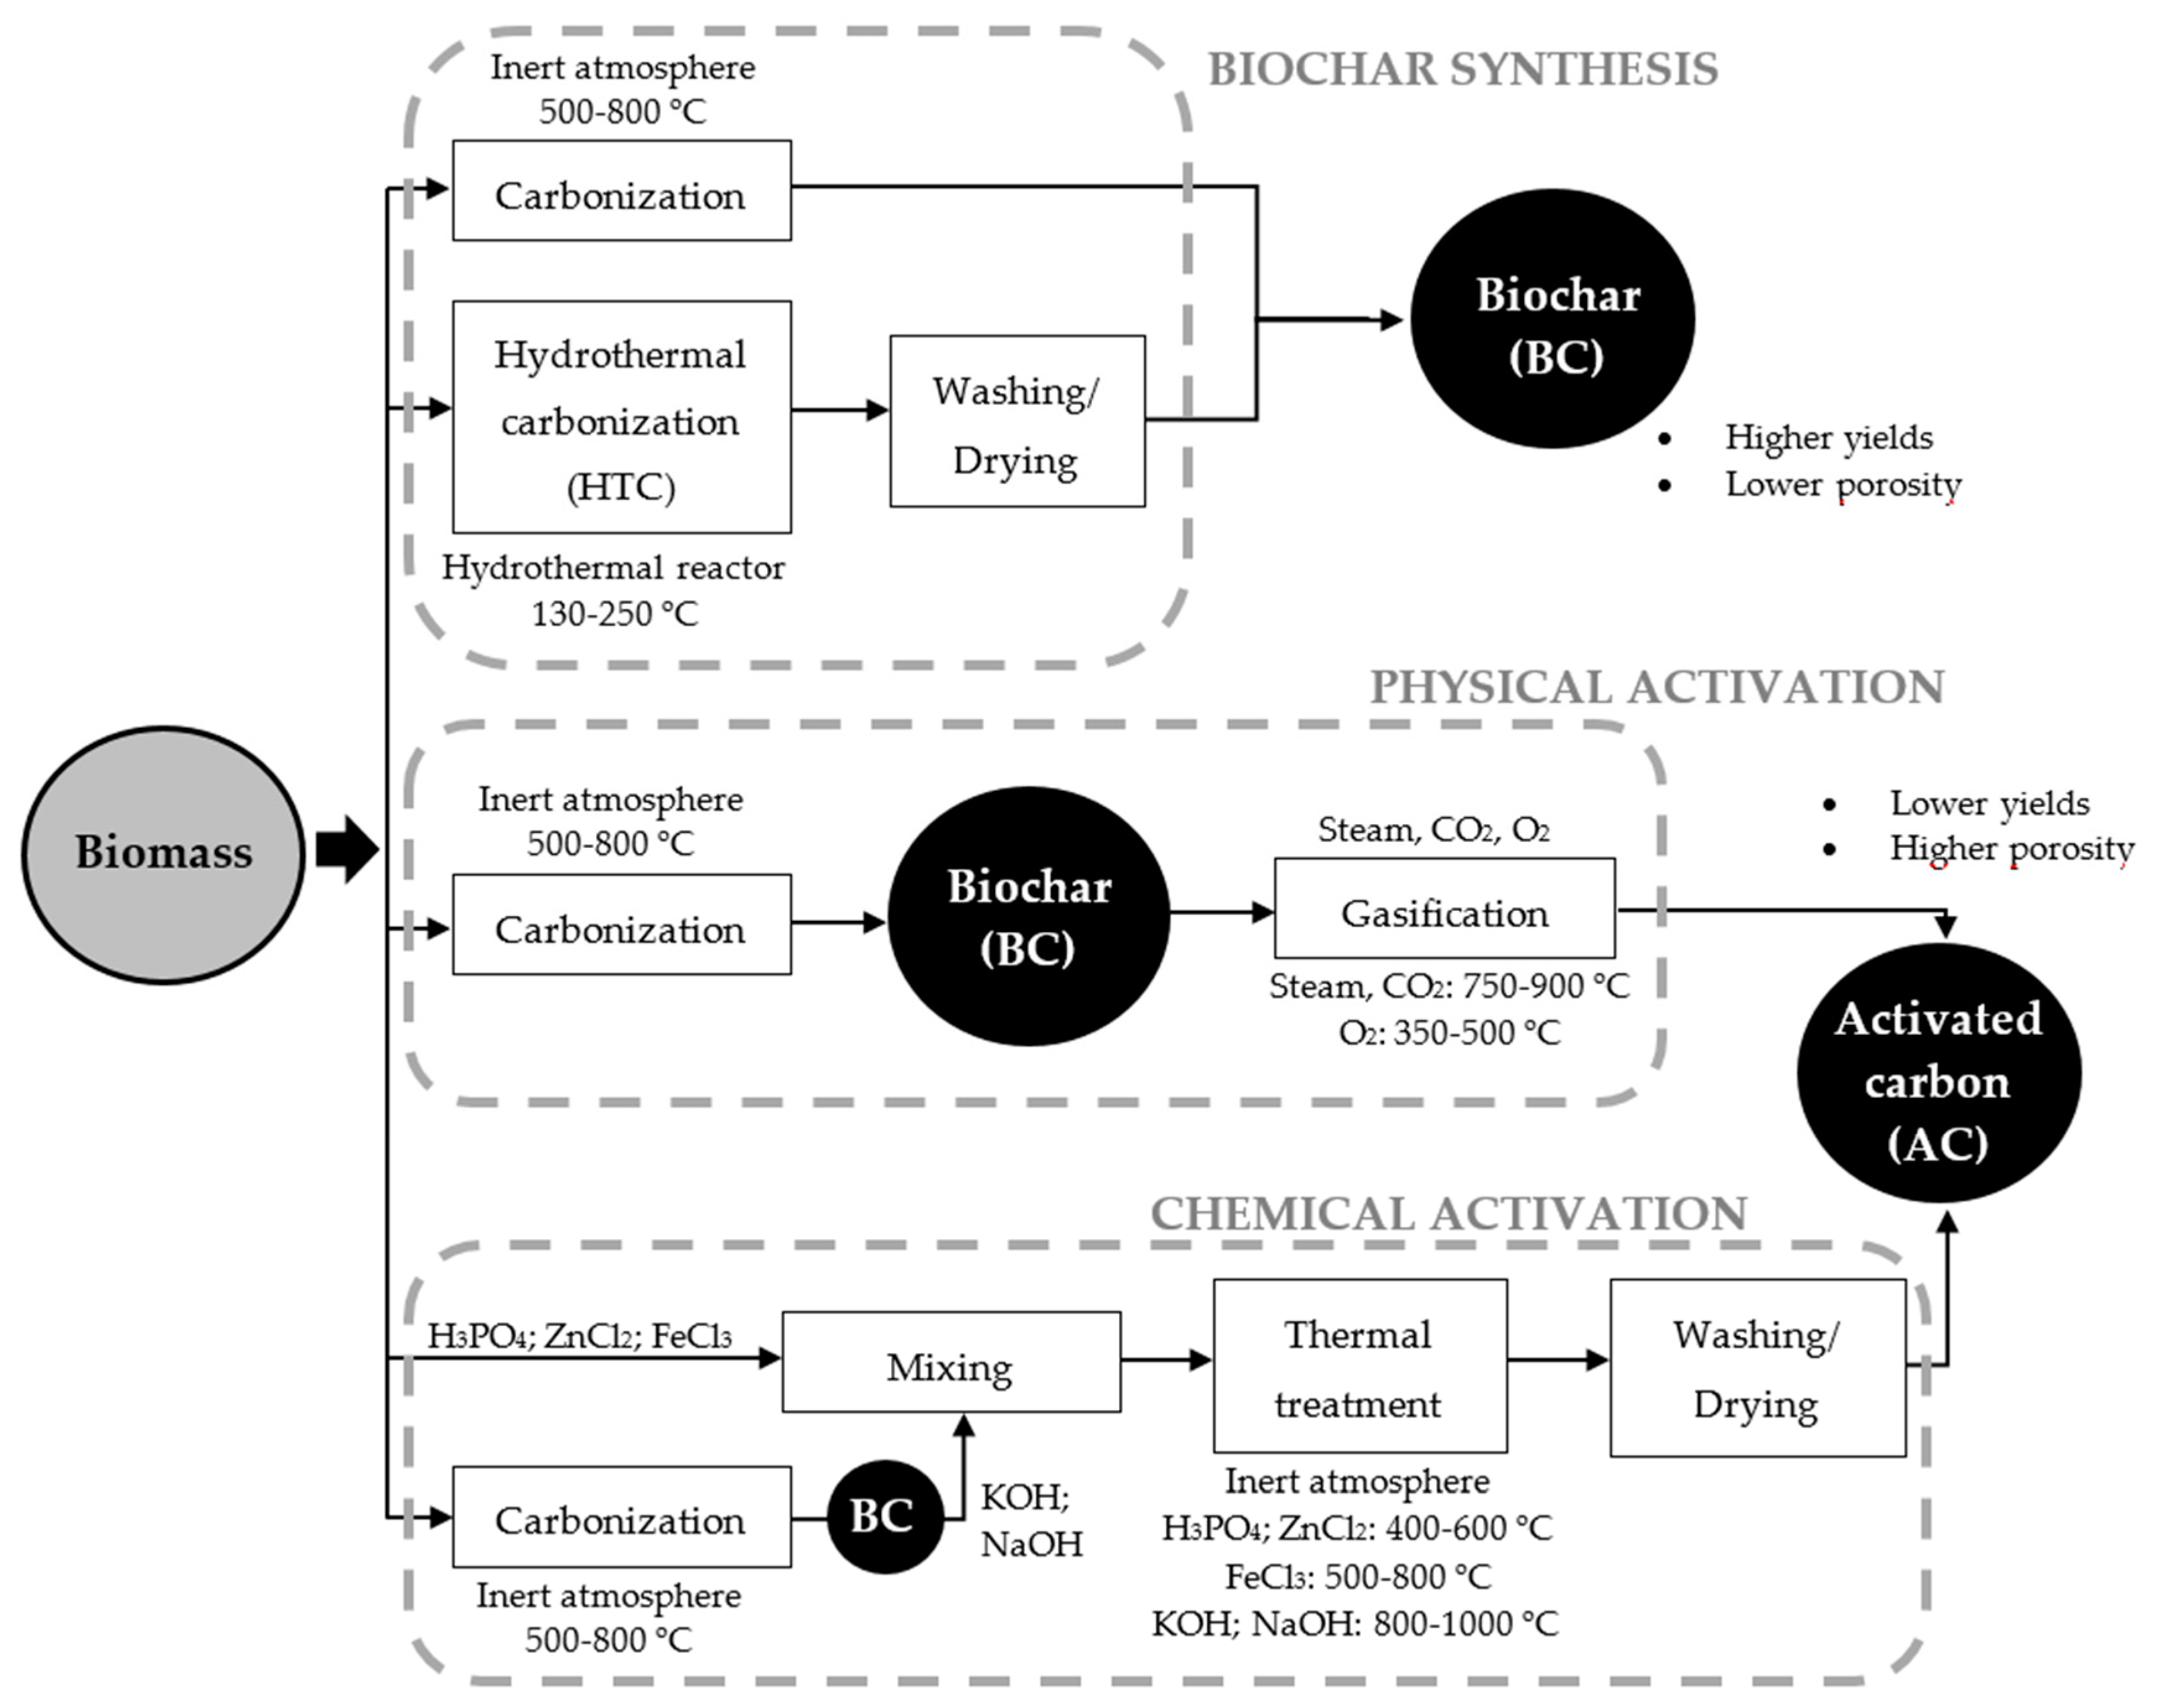
3. Synthesis of Biomass-Derived Carbons
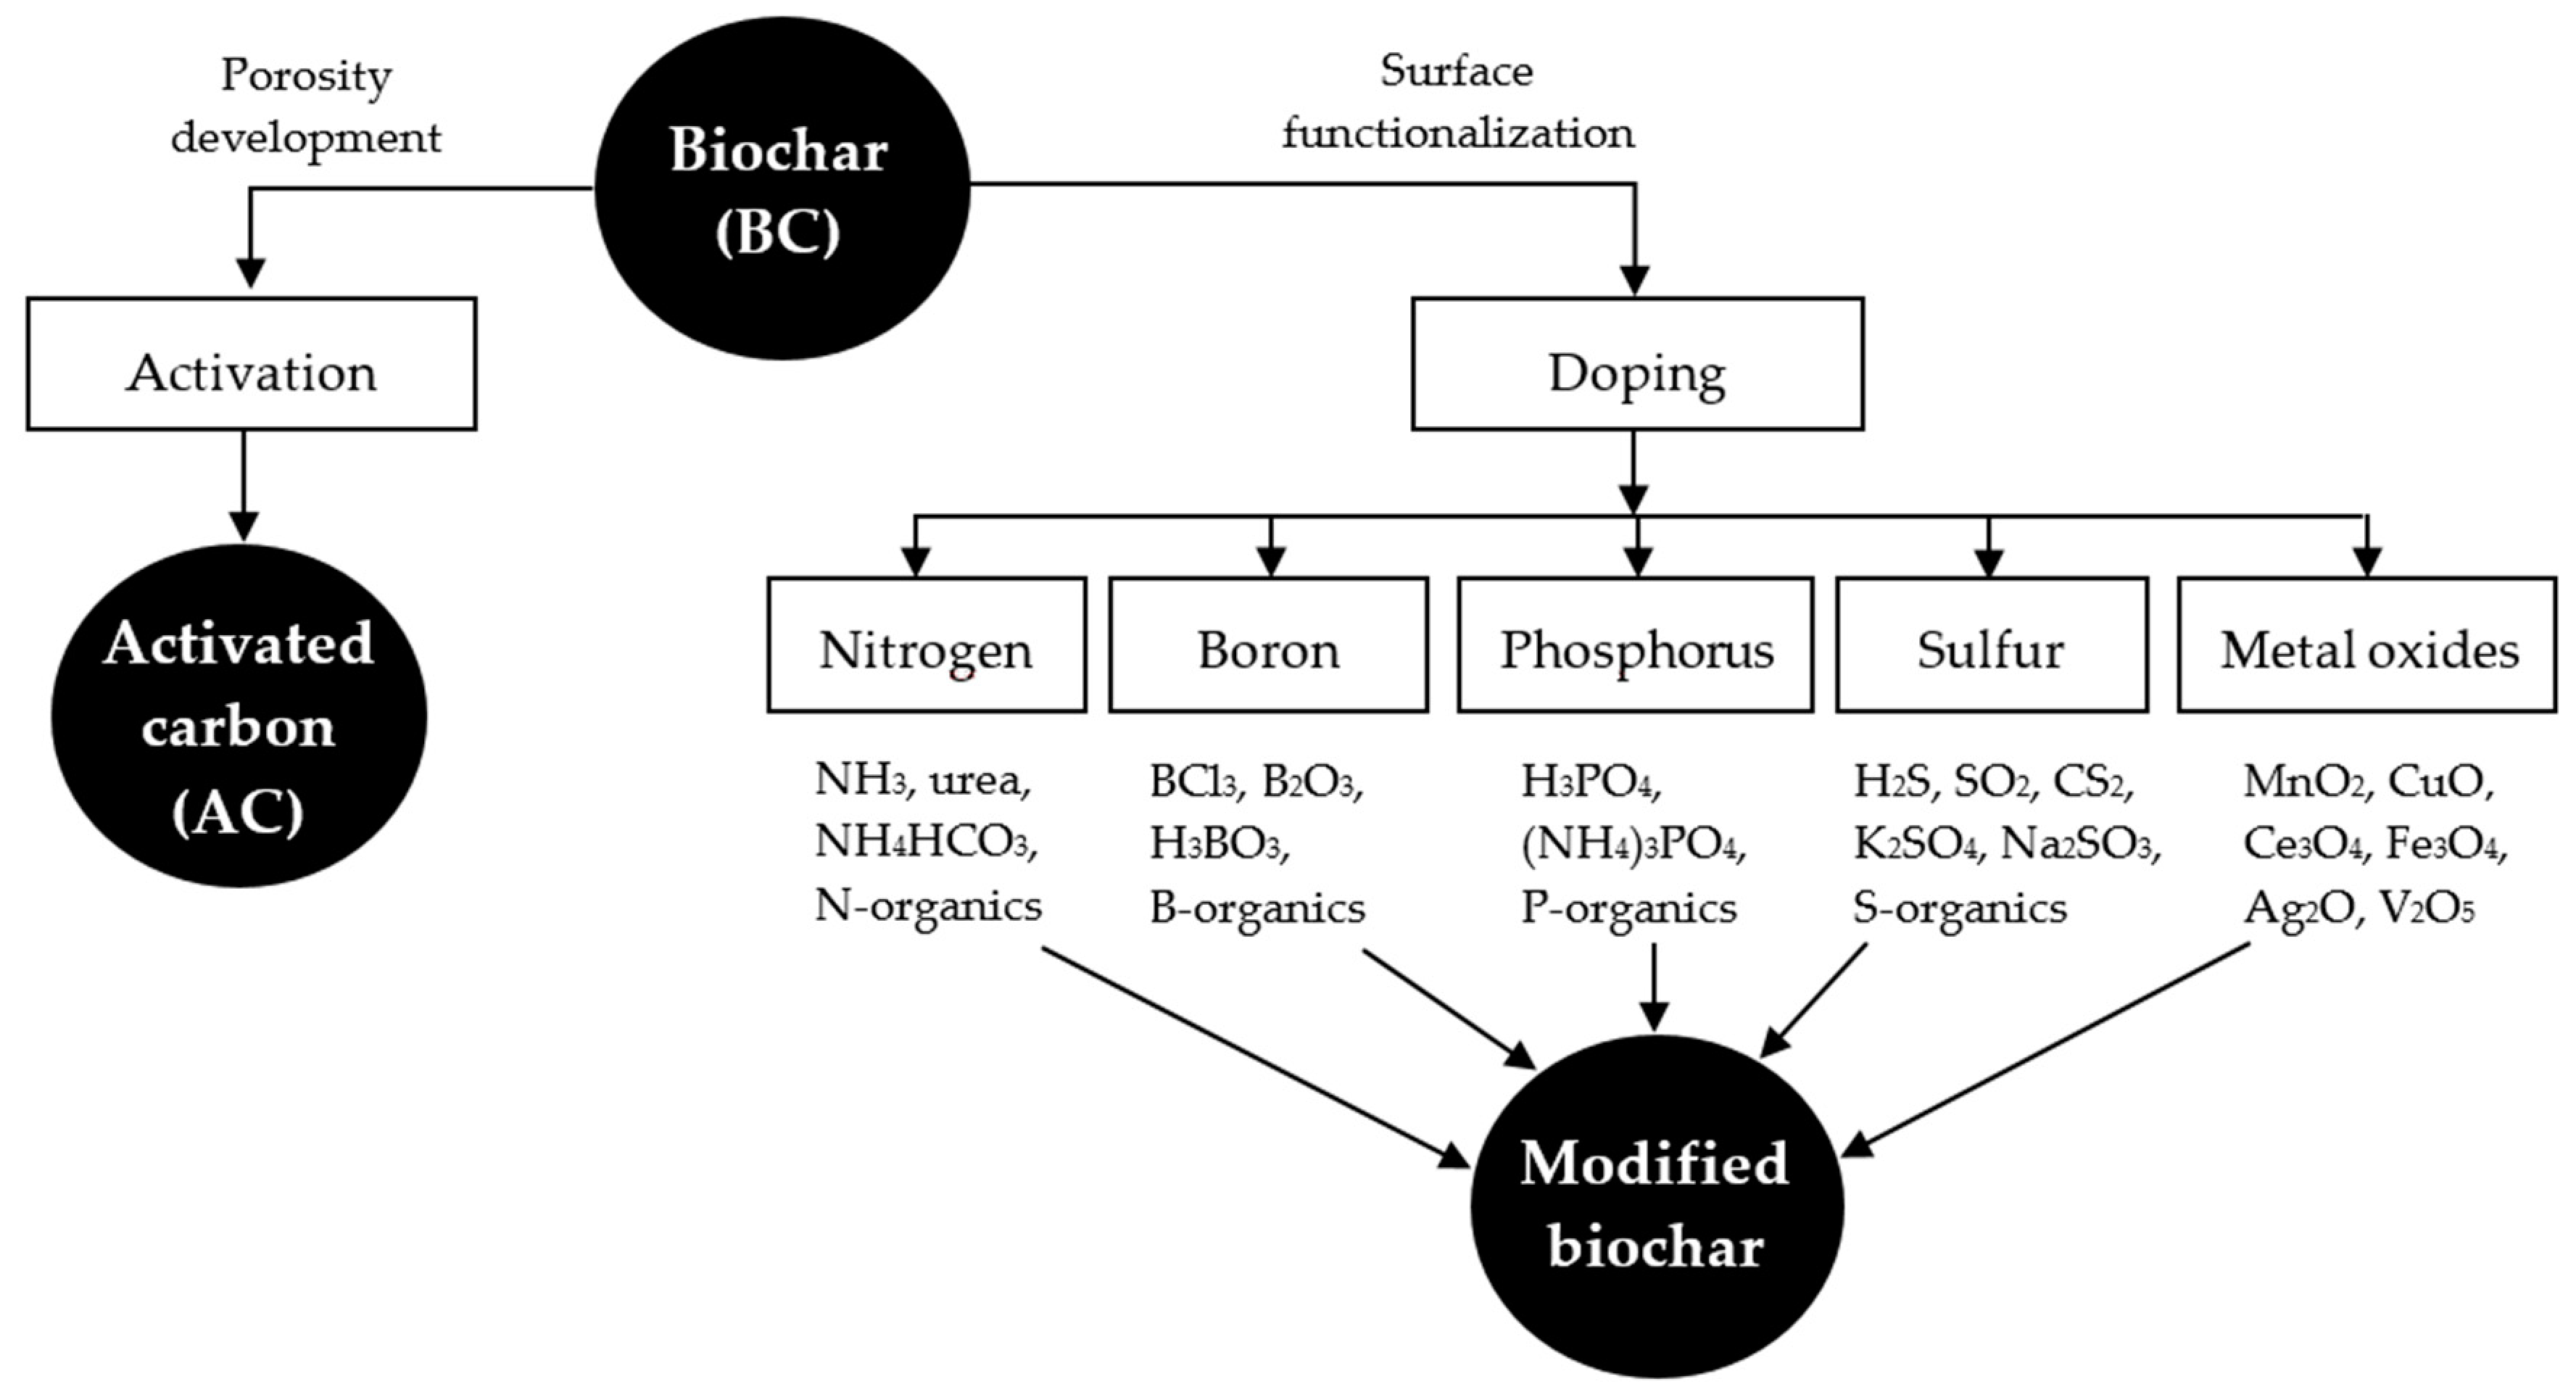
In general terms, carbon-based adsorbents can be synthesized from any precursor with a high proportion of carbon in its composition. Therefore, biomass materials are ideal precursors for carbon-based adsorbents, i.e., biochars or activated carbons (AC). The difference between biochar and biomass-derived activated carbon is somewhat diffuse. In this study, we consider biochar those materials obtained from biomass upon thermal treatment but without further activation, while activated carbons are obtained after an activation step. The literature contains many studies about the synthesis of carbon adsorbents from biomass agricultural waste, such as olive stones [39,40,41], rice husk [42,43], coconut husks [44,45,46,47] or bamboo [48,49]. Furthermore, many studies have also focused on the synthesis of carbon materials from biomass industrial wastes including lignin, (a by-product of the papermaking industry) [50,51,52,53,54], Tara gum (generated in the food industry) [55], wood waste or sawdust (from the furniture industry) [56,57], and so on.
Figure 3 schematizes the synthesis routes to biochars and activated carbons from biomass. Biochar is usually prepared upon carbonization, while activated carbons can be obtained in two well-known ways, namely physical and chemical activation, giving rise to a more developed porosity. In recent years, alternative procedures with the aim of energy and/or chemical savings have been proposed. Thus, non-conventional methods, such as microwave heating [58,59,60,61] and hydrothermal carbonization [62,63,64], are being analyzed for both biochars and activated carbons. It is worth mentioning that the porosity, surface chemistry and yields of the synthesized carbon-based adsorbents are highly dependent on the starting biomass composition and the operating conditions used in the synthesis.

3.1. Biochars

Biochar was firstly used for soil amendment, due to its advantages of carbon sequestration, soil fertility improvement, pollution remediation, and agricultural by-product/waste recycling [65]. Nowadays, biochar applications include catalysis, energy storage and environmental remediation [66], highlighting the use of biochar as adsorbent [67].
As mentioned, the synthesis of biochars is usually performed by a single carbonization step. The biomass is heated in inert atmosphere, to avoid its combustion, up to temperatures in the range of 500 to 800 °C, and maintained at the desired temperature for a specific time. Finally, the biochar is cooled to room temperature also under an inert atmosphere. The most important parameter affecting the porous texture of biochars is carbonization temperature. Chen et al. [68] reported an interesting analysis into the effect of carbonization temperature on the surface area of biochars obtained from different biomass resources (Figure 4). At low carbonization temperature (<400 °C), no significant porous development is achieved probably as a consequence of the incomplete removal of volatile matter [69]. However, a further increase of the carbonization temperature beyond 400 up to 900 °C results in a significant increase of the surface area depending on the biomass precursor and the carbonization conditions. This rise is due to the release of most of the volatile matter resulting in the creation of new porosity [70,71]. Carbonization temperatures higher than 900 °C produce a decrease of surface area, due to pore widening and coalescence, structural reordering and also to the blocking of part of the porous structure by the melting and fusion of the ashes from the biomass feedstock [72]. Other explanations of this surface area reduction include the collapse of the microporosity [73] and/or the reordering of the carbon structure into graphite microcrystalline domains [74].
The evolution of the functional groups upon carbonization of biomass can also have a significant effect on the adsorption capacity. Usually, the atomic H/C and O/C ratios of raw biomass are in the ranges of 1.4–1.8 and 0.55–0.75, respectively, confirming the high aliphatic content and low aromaticity of biomass [75]. Carbonization results in a decrease on those ratios, more significant at higher temperatures [72,76]. At carbonization temperatures lower than 500 °C, this reduction is due to the release of water, carbon dioxide and monoxide and other volatile products produced by dehydration, decarboxylation and decarbonylation of biomass. At carbonization temperature higher than 500 °C, dehydrogenation and demethanation give rise to a reduction of the H/C ratio more pronounced than the O/C one [72].
In recent years, increasing attention is being paid to the synthesis of biochar by hydrothermal carbonization [62,63]. This method, usually performed in an aqueous medium in a closed vessel at temperatures in the range of 130 to 250 °C for about 2–24 h, offers significant advantages. The relatively low operating temperature and the absence of a drying step reduce considerably the energy consumption, and therefore, the operation cost. As in a conventional carbonization/pyrolysis process, hydrothermal carbonization of biomass yields liquid (bio-oil), gaseous (low molecular weight hydrocarbons) and solid products (biochars), being the relative proportions and characteristics of these products dependent on the operation conditions and on the biomass feedstock [77]. During the hydrothermal carbonization, dehydration and decarboxylation reactions take place in an exothermic process [63].
To effectively enhance the adsorption capacity of organic pollutants by biochar adsorbents in water cleaning, these should present a well-developed porosity and hydrophobic surface. In the adsorption of inorganic or polar organic contaminants, the presence of oxygen-surface groups is needed to increase electrostatic attraction [78]. Biochars usually show moderated to low surface area and a limited amount of surface functional groups, which limit their practical applications. With the aim of improving the biochar’s adsorption capacities different modifications have been proposed (Figure 5). Among them, further activation allows increasing the development of porosity, leading to activated carbons, which will be analyzed in more detail in the following section. The surface chemistry of the biochars can be modified by doping them with heteroatoms, including N, P, S and metal oxides with different reagents.

3.2. Activated Carbons

Activated carbons are amorphous carbonaceous materials with a highly developed porosity (total surface areas up to 3000 m2·g−1) that have a complex structure composed primarily of carbon atoms organized in disordered layered domains. There are two well-stablished procedures to synthesize activated carbon from biomass precursors, commonly known as physical and chemical activation (Figure 3). In recent decades, the use of hydrothermal carbonization [79] and microwave heating [58] has been introduced as modifications of the traditional processes. Furthermore, the combination of chemical and physical activation is also considered to enhance the textural characteristics and generate more hierarchical porosity.

3.2.1. Physical Activation

In physical activation, the biomass precursor is initially carbonized under an inert atmosphere, and the resulting biochar is submitted to a partial and controlled gasification with steam, carbon dioxide, air/oxygen or a mixture of them [80,81,82,83,84]. During the first step, carbonization, the starting material is transformed into fixed carbon with a low development of porous texture. The carbon yield is related to the biomass composition since carbonization removes mostly the heteroatoms (non-carbon elements), which are volatilized at low temperature. In the second step, gasification selectively removes reactive carbon atoms, generating the porosity and the final activated carbon structure. In case of CO2 or H2O activation, these reagents usually broaden the carbon porosity resulting in activated carbons with a wider porosity (meso- and macropores) especially at high burn-off values. The burn-off quantifies the mass removed during the gasification step, and is given by:
Burn   off   ( % ) = m o m f m o · 100 ,
where mo is the initial mass (mass of biochar) and mf is the mass remaining after the gasification step, namely that of the final activated carbon. Sometimes the burn-off is expressed in terms of C. Low burn-off values result in high carbon yields but low porosity, while high burn-offs produce activated carbons with more developed porous texture (although at very high burn-off values pore coalescence takes place giving rise to lower surface area) but with low carbon yields. Gasification temperature is probably the parameter with the greatest effect on the properties of the final activated carbon. At low temperatures, the gasification reaction is chemically controlled, and narrow porosity is obtained. In contrast, when using high gasification temperatures, gasification proceeds under diffusion control and wider pores are formed.
The main gasification reactions involving H2O, CO2 and O2 as oxidizing reagents are shown below. In the case of oxygen, the gasification reaction is strongly exothermic, requiring a strict control of the reaction [85].
C + H 2 O CO + H 2 Δ H 25   ° C = + 117   kJ · mol 1 ,
C + CO 2 2 CO Δ H 25   ° C = + 159   kJ · mol 1 ,
C + O 2 CO 2 Δ H 25   ° C = 386   kJ · mol 1 ,
2 C + O 2 2 CO Δ H 25   ° C = 256   kJ · mol 1 .
With the aim of reducing the cost of the process, the combination of carbonization and activation in a single step has also been reported [86].

3.2.2. Chemical Activation

Chemical activation usually begins by the physical mixing step of the activating agent with the biomass precursor [80,81,82,87,88]. Chemical agents include a wide variety of salts, acids or bases, such as H3PO4 [89,90,91], H2SO4 [92,93], ZnCl2 [94,95,96], FeCl3 [55,97,98,99,100,101], NaOH [102,103,104,105] and KOH [102,106,107,108] among others. In this step, the most relevant variable is the mass ratio between the chemical activating agent and the precursor. The activating chemical acts as dehydrating agent and inhibits the formation of tars, volatiles and other undesired products that can be formed during the carbonization stage. Due to this, it is stated that chemical activation results in higher carbon yields than the physical one. In activation with strong bases (KOH and NaOH), it can be necessary as an initial carbonization step to avoid direct oxidation of the biomass by the activating agent in the mixing step. The biochar resulting from the carbonization step has a significantly higher fixed carbon content and can be subsequently impregnated with the activating agent. The precursor–activating agent mixture is submitted to a thermal treatment at temperatures ranging from 400 to 1000 °C depending on the chemical agent (see Figure 3) under inert atmosphere. In the last step, the carbonized solid is washed to remove from the pores the remaining reaction products and possible rests of the activating agent and release the porous texture of the final activated carbon. The main variables affecting the final porous structure of the activated carbon are the activating agent itself, the mass ratio between the chemical activating agent and precursor and the activation temperature. Usually, strong bases (KOH and NaOH) yield highly microporous carbons with high surface areas, in some cases even higher than 3000 m2·g−1 [109]. With other activating agents, the porosity can be tailored by the proper selection of the mass ratio and activating temperature. In general, increasing the activation temperature allows higher porous development, although there is usually a maximum temperature for that effect. Low mass ratios commonly result in mainly microporous carbons, while high activating ratios produced a widening of the porosity, promoting the formation of meso and macropores.

4. Characterization Techniques

To understand the structure-adsorption relationships it is necessary to perform a complete characterization of the adsorbent. Two main characteristics affect the adsorption process, namely the porous texture and the amount of surface groups. Therefore, the characterization of these properties is crucial for understanding the adsorption process and thus the efficient design of new adsorbents with improved properties. A brief description of the techniques more usually employed for the characterization of carbon adsorbents is given below.

4.1. Textural Characterization

The porous texture of carbon-based adsorbents can be characterized by physisorption techniques. Physisorption or physical adsorption occurs when a gas comes into contact with the solid surface of an adsorbent. The process is control by long-range Van der Walls dispersion forces and the short-range intermolecular repulsion [110]. The textural characteristics of the carbon adsorbents, including surface area and pore size distribution, are the main information obtained from physisorption [111]. According to the International Union of Pure and Applied Chemistry (IUPAC) pores can be classified in micropores (<2 nm width), mesopores (2–50 nm) and macropores (>50 nm). The micropores can be further subdivided into ultramicropores (<0.7 nm) and supermicropores (0.7–2 nm). During gas adsorption tests, the amount adsorbed, a, expressed per unit of mass of adsorbent, depends on the adsorbate pressure, p, the adsorption temperature, T, and the adsorbent properties and gas-solid interactions [112]. The amount adsorbed can be expressed as: a = f(P,T); and at a constant temperature: a = f(P/Po) being Po the saturation pressure of the adsorbate at the testing temperature. The resulting equation corresponds to the adsorption isotherm. IUPAC establishes six different types of adsorption isotherms (Figure 6) [113,114]. The solid sample must be previously heated under vacuum or purging gas to desorb any species from the surface. Outgassing under vacuum is especially relevant for the characterization of the porous texture of materials with very narrow micropores, where adsorption begins at very low relative pressures and, therefore, they require outgassing at very low pressure.

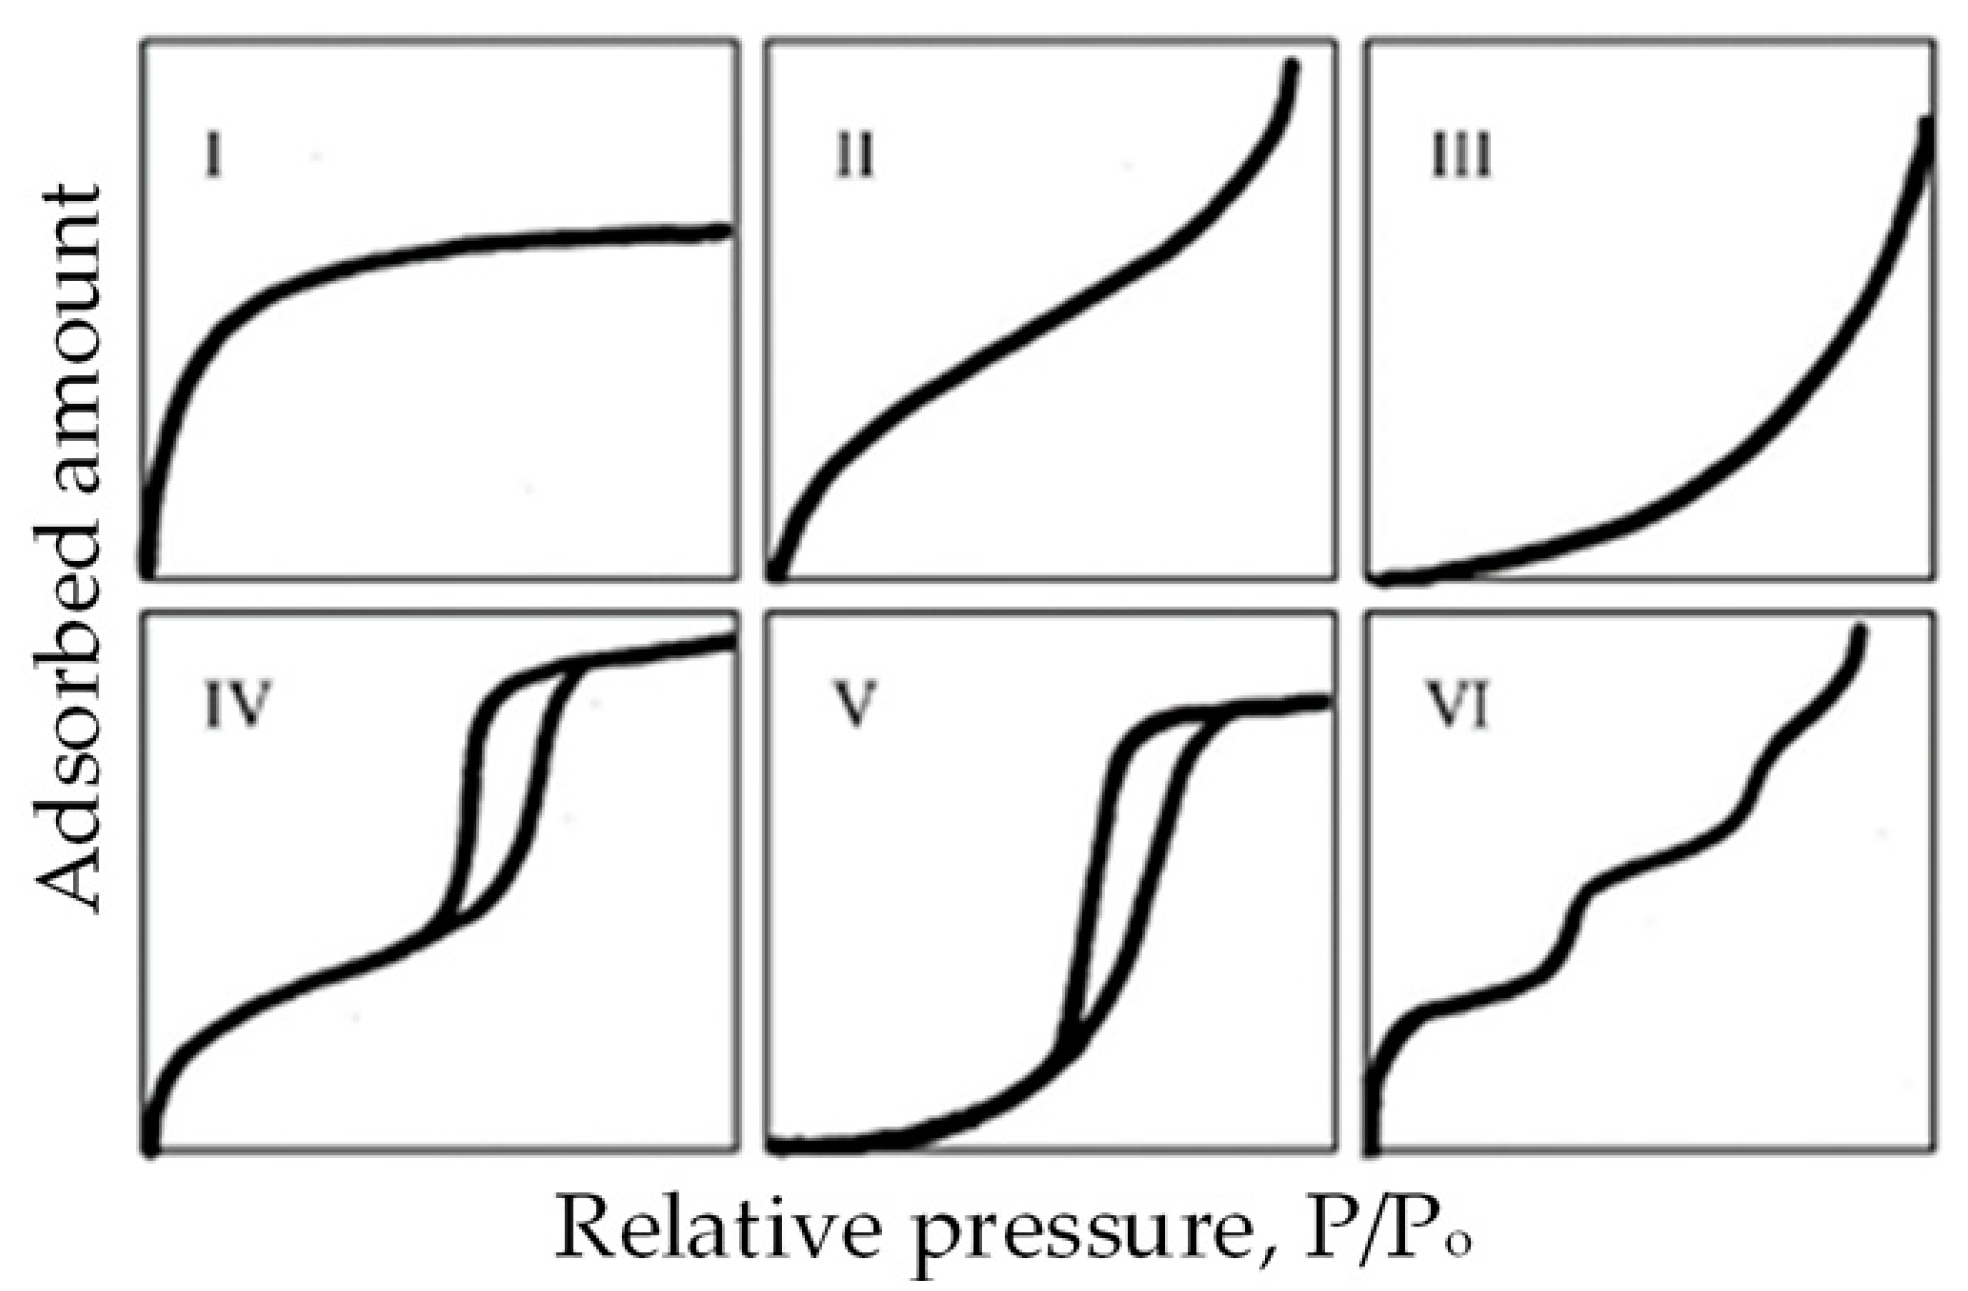
4.1.1. N2 Adsorption–Desorption at −196 °C

The most commonly used technique for the characterization of the porous texture of adsorbents is N2 adsorption-desorption at −196 °C. The nitrogen adsorption mechanism begins with micropore filling at low relative pressures (p/po < 0.4). After that, mesopores are filled by capillary condensation with the consequent multilayer formation. In the mesoporous range (p/po > 0.4), the desorption branch of the isotherm is not always superimposed to the adsorption one. This hysteresis phenomenon can be due to differences between rate of capillary emptying and filling, or to the interconnection of the mesopores blocked by filled micropores. Finally, at relative pressures close to 1, the filling of macropores is supposed to proceed also by multilayer formation. Different textural parameters can be determined from the N2 adsorption–desorption isotherms, such as specific surface area, micropore and mesopore volumes. Pores size distribution can also be obtained from this isotherm.
The specific surface area is a main parameter for characterizing the porous texture of a solid. This area is calculated in the range of relative pressures from 0.01 to 0.3 approximately. The main procedure used for the calculation of the specific surface area is the Brunauer-Emmett-Teller (BET) method [115]. The BET specific surface area supposes that the N2 molecules are adsorbed on a continuous monolayer covering the entire adsorbent surface and is obtained from the cross-sectional area of a nitrogen molecule (0.162 nm2). Although BET is widely used for the determination of the total surface area in the case of microporous adsorbents, as many activated carbons, some limitations should be taken into account [116]. In this sense, Kaneko and Ishii reported a different methodology for the estimation of the surface area of highly microporous solids [117].
The micropore volume and mesopore surface area (also known as external surface area) are obtained from a reference non-porous sample similar in nature to the porous material tested. Two types of comparative plots are usually used, namely, the t-plot [118] and the αs plot [119]. Both methods differ only in the reference solid used for the adsorption isotherm presentation. The thickness of the surface film on the reference solid t is used to construct the t-plot. Total pore volume is usually calculated from the amount of N2 adsorbed at relative pressures close to 1 (e.g., p/po = 0.99) transformed to liquid phase. Finally, the pore size distribution can be calculated from different approaches, such as the Barrett-Joyner-Halenda (BJH) [120], Horvath Kawazoe one [121] or density functional theory (DFT), among the most commonly used.

4.1.2. CO2 Adsorption at 0 °C

In the case of nitrogen adsorption at −196 °C, complete characterization of the narrow microporosity is very difficult since extremely low pressures are needed, with diffusion rates very slow, thus requiring very long equilibration times. Due to this, microporous materials must be characterized using also other adsorbates such as carbon dioxide. Despite the kinetic diameters of N2 (0.36 nm) and CO2 (0.33 nm) being very similar, their adsorption is quite different mainly because the very different adsorption temperatures used. At 0 °C CO2 is approximately 32 °C below its critical temperature. Considering that its saturation pressure is very high (26,200 torr), the relative pressure necessary for micropore filling is reached at moderate absolute pressures (1–760 torr) [122]. Therefore, CO2 molecules can access the inner ultramicropores although the sizes of N2 and CO2 molecules are very similar. Furthermore, the equipment needed to carry out a micropore analysis with CO2 is much simpler than those for argon or nitrogen adsorption. Since extremely low pressures are not required, a turbomolecular pump and low-pressure transducers are not necessary. Because of these features, CO2 adsorption is considered a very useful tool for the characterization of narrow microporosity.

4.2. Surface Chemistry

The characterization of the surface chemistry is crucial for the complete understanding of the adsorbent–adsorbate interactions. The adsorption studies are usually focused on the analysis of oxygen surface groups and the electrical charge density of the adsorbent surface. Some of the techniques more often used are described below.

4.2.1. Fourier Transform Infrared (FTIR) Spectroscopy

Infrared (IR) spectroscopy is based on of the quantification of the infrared radiation absorbed (or transmitted) by a material as a function of wavelength or frequency of the radiation. Since the absorption bands correspond to vibrations of a specific functional group of the molecule, band association allows the identification of the functional groups in the surface material [123]. Fourier transform infrared (FTIR) spectrometers convert the infrared spectrum using Fourier transformation of the signal obtained with interferometer equipped with a moving mirror. Numerical Fourier analysis allows a relationship between intensity and frequency to be obtained, namely the FTIR spectrum [124]. FTIR measurements are usually performed with diluted carbon sample in KBr pellets in the wavelength range of 400 to 4000 cm−1. Table 2 summarizes the assignment of FTIR absorption bands of biomass-derived carbons.

4.2.2. X-ray Photoelectron Spectroscopy (XPS)

X-ray photoelectron spectroscopy (XPS) is performed by exciting the surface of a sample with mono-energetic Al Kα X-rays, which provoke the emission of photoelectrons from the sample surface. The energy of these emitted photoelectrons results in a peak whose characteristic energy allows not only the identification of the corresponding element, but also the chemical state and amount of this element on the outermost layer (depth of approximately 5 nanometers) of the sample. Furthermore, the curve fitting of the XPS spectra allows quantification of the surface atomic ratios. The deconvolution of the elemental spectra permits the analysis of the chemical bonding states and the concentrations of the surface functional groups of the sample. Using this procedure, the C1s XPS spectrum can be deconvoluted into five different contributions as summarized in Table 3 [127,128]. It is well known that heteroatoms, such as nitrogen and oxygen, can play a crucial role in the adsorption phenomena on carbon surfaces. Thus, it is important to analyze the type and amount of oxygen surface groups in order to determine the crucial surface properties, such as hydrophobicity and surface polarity of the carbons. The O1s spectrum can also be fitted to three components (Table 3) [126,127]. In the case of of nitrogen functionalities, the N1s spectra can also be deconvoluted and fitted considering pyridinic, pyrrolic and graphitic nitrogen atoms and nitrogen oxides [127,129]. According to the area-simulating curve, the percentage of each component can be calculated.

4.2.3. Temperature Programmed Desorption (TPD)

Temperature programmed desorption (TPD) coupled to mass spectroscopy (TPD-MS) can be used to determine the nature of surface functional groups on carbons. Using this technique, gases produced from the decomposition of these groups are detected. The only gases evolved are carbon monoxide, carbon dioxide or water vapor and it is possible to recognize the presence of a functional group on the carbon surface considering its specific temperature of decomposition. Thus, surface oxygen-containing groups on carbon-based materials decompose upon heating in an inert atmosphere yielding CO and CO2 at different temperatures. TPD peaks can be assigned to different oxygen functional groups according to the literature. Figure 7 shows the different surface oxygen groups on carbons and their approximate decomposition temperature in TPD tests. Water can also be formed at high temperatures due to dehydration reactions of close carboxylic groups and phenol groups to anhydrides, lactones and ethers [130,131]. These groups then decompose upon heating into a mixture of CO and CO2 at temperatures above 600 °C.

4.2.4. Boehm Titration

The Boehm titration [132] is a simple technique developed for the quantification of acidic or basic functional groups on the surface of carbons. The method consists of a titration or selective neutralization of surface acidic groups of different strengths using bases that have conjugate acids covering a wide range of acid dissociation constants (Ka). In this method, the carbon material is contacted with a base that neutralizes the more acidic oxygen groups on its surface and the remaining amount of the base is measured by acid–base titration. Therefore, Boehm titration can be defined as a reverse titration of the oxygen groups on the surface of the carbon [133]. For quantifying the acid groups, basic aqueous solutions—sodium hydroxide (NaOH), sodium carbonate (Na2CO3) or sodium bicarbonate (NaHCO3)—are used. The consumed amount of NaHCO3 (pKa = 6.37) is associated only with strong carboxylic acidity, whereas Na2CO3 (pKa = 10.25) reacts with lactonic and carboxylic oxygen surface groups, and NaOH (pKa = 15.74) with phenolic, carboxylic and lactonic groups. For the characterization of weaker acidic groups, sodium ethoxide (NaOC2H5) is the basic compound used with absolute ethanol as a solvent [80]. However, sodium ethoxide is not often used because of the need to perform the experiment in non-aqueous media and under oxygen-free conditions. If the chosen concentrations of the solutions decrease, the carbon dioxide effect can clearly appear on the titration curves. The relatively low concentration of the reactant 0.01 mol·L−1 used allows small amounts of functional surface groups to be determined with a good precision. Nevertheless, it also reveals clearly the carbon dioxide effect due to the presence of atmospheric CO2, which dissolves in the solutions.

4.2.5. Point of Zero Charge

The point of zero charge (pHpzc) can be defined as the pH at which the surface of an adsorbent is neutral, i.e., it contains the same amount of positively charged surface functions than negatively ones. In consequence, below that pH, the surface is positively charged; and above it, is negatively charged. So, in general, it is always easier to adsorb a cation on a negatively charged surface, and an anion on a positively charged surface. However, other interactions may be stronger than purely electrostatic forces, making the effect of surface charge less important. Additionally, a cation is often complexed with ligands, some of them being possibly negatively charged. Therefore, in such a case, the cation is in fact a negative complex, which may adsorb very well on a positively charged surface. The determination using the pH drift method is very simple; 50 cm3 of 0.01 M NaCl solution is placed in a closed Erlenmeyer flask. Before starting the agitation, it is important to bubble N2 through the solution to remove dissolved CO2 and further stabilize the pH value. The pH is adjusted to a value between 2 and 12 by adding HCl 0.1 M or NaOH 0.1 M solutions. Then, 0.15 g of each AC sample is added to each flask. After 48 h under stirring at room temperature the final pH is measured. The point of zero charge is the point where the curve pHfinal vs. pHinital crosses the line pHinitial = pHfinal [134,135].

5. Experimental Procedures for Adsorption Tests

Adsorption can be defined as an enrichment of chemical compounds from a fluid on the surface of a solid material. In the case of water treatment or purification, this process can remove efficiently a wide variety of solutes. Solid surfaces are energetically heterogeneous, i.e., they contain sites with different energies that are able to interact with solutes. The modification of some properties of the liquid phase, such as temperature, pH or concentration of adsorbate, can result in the desorption of the adsorbed species from the surface into the liquid phase [136].
The amount adsorbed, q, is usually defined as the number of moles or mass adsorbed per unit of adsorbent mass. In practical applications, adsorption can be studied in three different approaches: the adsorption equilibrium, the adsorption kinetics, and the adsorption dynamics. The adsorption equilibrium analyzes the effect of adsorbate concentration and adsorption temperature on the adsorbed amount. Usually, the adsorption equilibrium is considered at a fixed temperature and expressed in the form of the adsorption isotherm:
q = f(C); T = constant,
where C represents the adsorbate concentration in the liquid phase.
The adsorption kinetic studies the evolution of the adsorbed amount upon contact time also at a constant temperature,
q = f(t); T = constant,
where t is time. Slow mass transfer processes from the liquid to the solid phase generally control the adsorption rate.
Finally, in practical applications, adsorption is performed in a fixed bed where the amount adsorbed varies not only with time but also with bed length. The dependence on time (t) and space (z) is referred as column dynamics or adsorption dynamics:
q = f(t,z), T = constant.
The adsorption equilibrium constitutes the foundations of all adsorption approaches, being its study necessary for the proper understanding of both adsorption models, kinetic and dynamic. To forecast adsorption dynamics, adsorption equilibrium and kinetics must be known [136].

5.1. Adsorption Equilibrium

Obtaining equilibrium data is crucial to understand adsorption process and thus to choose the most favorable adsorbent, and to design batch and fixed bed adsorption systems. The adsorption equilibrium is strongly affected by the adsorbate-adsorbent couple, but also by the pH and temperature of the liquid phase, and the existence of competitive adsorption.
Adsorption equilibrium curves are obtained experimentally at constant temperature and they are fitted to an equation representing the equilibrium isotherm. To obtain equilibrium data, and the subsequent isotherm equation, the bottle-point method is the more often used. In this procedure, different equilibrium points are obtained in different test bottes in parallel. Each bottle is filled with a specific volume of adsorbate solution, V, with an initial concentration, Co. Afterwards, a mass of adsorbent, m, is added to each bottle and the sample is maintained under shaking or stirring until equilibrium is achieved. One of the problems of this method is to assure enough contact time to reach the adsorption equilibrium, which can vary between a few hours and several days. It is worth mentioning the strong influence of the adsorbent particle size in equilibration time, with longer times needed for larger particle sizes due to diffusional effects. That time can be estimated from the kinetic tests described in the following chapter. Once equilibrium is achieved, the concentration of the adsorbate in the liquid phase, Ce, has to be quantified. Then, the specific adsorbed amount, qe, is determined from a simple material balance:
q e = ( C o C e ) V m .
There is no a unique isotherm equation describing properly all the experimental equilibrium curves. In contrast, many isotherm equations have been obtained from theoretical or empirical models. However, the objective should be finding an isotherm model as simply as possible to be used for adsorber design. Probably, the most used adsorption model isotherms for liquid-phase adsorption are those proposed by Langmuir [137] and Freundlich [138]. The Langmuir isotherm has the form:
q = q m bC 1 + bC ,
where qm and b are the isotherm parameters. The first one corresponds to the saturation capacity and has the same unit than the adsorbent loading (usually, mg·g−1 or mmol·g−1), while the units of b are the reciprocal of the concentration. The Langmuir model supposes that adsorption proceeds through a monolayer coverage of the adsorbent surface with energetic homogeneity of the adsorption sites. Obviously, this assumption is not fulfilled for all the pairs of the adsorbent-adsorbate, and thus this equation does not fit well the experimental results in many cases. The Langmuir equation can be linearized to avoid more complicated non-linear regression. Different linearizations are possible:
C q = 1 q m b + 1 q m C ,
1 q = 1 q m + 1 q m b 1 C ,
q = q m 1 b   q C ,
q C = q m b qb .
As an alternative, the Freundlich isotherm can be used:
q = KC n ,
being K and n the characteristic parameters of this isotherm. K is known as the adsorption coefficient and it is related to the strength of adsorption. Higher values of K are associated to higher adsorption. The exponent n is related to the shape of the isotherm and reflects the energetic heterogeneity of the adsorbent surface. Values of n lower than 1 yield concave isotherms, n equal to 1 corresponds to linear isotherm and for n higher than 1 the isotherm is convex (Figure 8). Many of the studies in the literature reported n values lower than 1, with high adsorbed amounts at low concentrations. These isotherms are considered favorable, while isotherms with n > 1 are defined as unfavorable. The unit of K (=q/Cn) depends on the units used for q and C and includes the exponent n. The conversion of these K units from one study to another for comparison purposes is not straightforward due to the included exponent n. Tables for K units conversions can be found elsewhere [136]. The Freundlich isotherm can be linearized as follows:
ln q = ln K + nln C ,
Adsorption equilibrium results can be also fitted by the Dubinin-Radushkevich (DR) equation, which was developed from the theory of volume filling of micropores (TVFM) [139]. The mathematical expression of this isotherm is:
q = V p V m exp [ ( RT   ln C sat C E c ) 2 ] ,
where R is the universal gas constant, T is the adsorption temperature, Csat is the saturation concentration of the adsorbate and Vm is the molar volume of the adsorbate. The isotherm parameters are Vp, the specific pore volume, and EC, the characteristic adsorption energy. In this model, q is the molar loading expressed in adsorbate moles per gram of adsorbent Vp, and Vm units are cm3·g−1 and cm3·mol−1, respectively. The term RTln(Csat/C) is known as adsorption potential, ε.
ε = RT ln C sat C .
The linearization of the Dubinin-Radushkevich (DR) equation gives:
ln q = ln V p V m 1 E C 2 ( RT ln C sat C ) 2 .
Two parameter isotherms, such as those previously mentioned, cannot properly describe adsorption results over a broad concentration range. In those cases, different isotherm parameters should be specified for narrower concentration ranges or three-parameter isotherms should be used. Table 4 summarizes the characteristic equations of isotherms with three parameters. Isotherm models with more than three parameters are hardly used.

5.2. Adsorption Kinetics

Any adsorption process, especially those performed on porous adsorbents requires a time to achieve equilibrium, due to the existence of mass transfer resistances. The evolution of the amount adsorbed with time gives the adsorption kinetics. Diffusion through the external surface of the particle and inner porosity controls, in general, the rate of adsorption in porous solids. Determination of the mass transfer parameters as well as a proper equilibrium model are necessary for the design of adsorbers, both slurry or fixed bed systems.
Adsorption proceeds by four successive steps: (i) diffusion of the adsorbate from the liquid phase to the hydrodynamic boundary layer surrounding the adsorbent particle; (ii) diffusion through this layer to the external surface of the adsorbent (film diffusion or external diffusion); (iii) diffusion through the inner porosity of the adsorbent particles (intraparticle diffusion or internal diffusion); and (iv) energetic interaction between the adsorbate and the adsorption sites. Usually the first and the fourth steps are supposed to occur very fast. Therefore, the slower step between film and intraparticle diffusion determines the adsorption rate. To clarify what step controls the adsorption rate, it should be considered that film diffusion depends on the hydrodynamic conditions. Therefore, if an increase of the stirring velocity (slurry adsorbers) or the flow (fixed-bed adsorbers) increases the adsorption rate, the kinetics of the process is controlled by film diffusion. In contrast, the adsorbent particle size affects both the film diffusion and the intraparticle diffusion as a consequence of changes of surface area and diffusion paths, respectively. The intraparticle or internal diffusion mechanisms happen by effective pore volume diffusion, surface diffusion, or a combination of both mechanisms. The effective pore diffusion defines the movement of the adsorbate molecules through the inner porosity of the adsorbent particles and it is denoted by DP, the effective pore diffusion coefficient. On the other hand, the surface diffusion is related to the transport of the adsorbate on the surface of the adsorbent particles, from higher to lower energy sites. This mechanism is represented by the surface diffusion coefficient, denoted as DS [144].
Adsorption kinetic curves, C = f(t), are obtained by following the change of the concentration of the adsorbate with time in a specific solution volume (V) with a known mass of adsorbent (m). The fitting of the kinetic curve to the different adsorption kinetic models allows the mass transfer coefficients to be determined. The mass transfer coefficients of film diffusion determined experimentally depend on the hydrodynamic conditions and, therefore, they cannot be used in other experimental conditions. Due to this, most kinetic tests focus exclusively on internal diffusion, which is not affected by the hydrodynamic conditions. Consequently, the operating conditions for kinetic tests are chosen to obtain very fast film diffusion to avoid considering this step in the kinetic model. To do this, a minimum stirring or flow velocity, for slurry or fixed bed adsorbers, respectively, must be used. This minimum velocity can be estimated obtaining different kinetic curves with increasing stirring or flow velocities up to invariable kinetic curves.
Probably the most complete diffusional model is the pore volume and surface diffusion model (PVSDM). This model assumes constant temperature; spherical adsorbent particles and negligible transport by convection inside the pores. The intraparticle diffusion can happen by pore volume diffusion and/or surface diffusion mechanisms. The values of effective pore volume diffusion coefficient (Dp) and effective surface diffusion coefficient (Ds) are considered constant and the adsorption rate on an active site instantaneous [144,145]. This model is described by the following equations:
V dC t dt = mSk F ( C t C s ( t ) | r = R ) ,
t = 0 ;   C t = C 0 ,
ε p C r t + ρ q t = 1 r 2 r [ r 2 ( D p C r r + ρ p D s q r ) ] ,
t = 0 ;   0 r R ;   C r = 0 ,
C r r | r = 0 = 0 ,
D p C r r | r = R + ρ p D s q r | r = R = k F ( C t C s ( t ) | r = R ) ,
where V is the solution volume, m is the adsorbent mass, S is the external surface area per unit mass of adsorbent, kF is the external mass transfer coefficient, R the radius of the adsorbent particles, εp the void fraction of the adsorbent, ρp the apparent density of the adsorbent, C0 the initial adsorbate concentration in the bulk solution, Cr the adsorbate concentration, varying with the position and time, and q the mass of adsorbate per unit mass of adsorbent, varying with the position and time, respectively. The PVSDM model can be simplified by considering that the sole intraparticle diffusion mechanism may be either pore volume diffusion (PVDM) (DS = 0) or homogeneous surface diffusion (HSDM) (DP = 0). The solution of this model assumes a local equilibrium between the adsorbate concentration of the pore solution, Cr, and on the pore surface, q, represented by the adsorption isotherm [144].
Although diffusion models are appropriate to describe adsorption kinetics for porous adsorbents, the complexity of the solution of the equations that describe this model has resulted in an increasing number of more simple models based on chemical reaction kinetics. These adsorption reaction models describe adsorption as a single phenomenon, unlike diffusive models. The most commonly used are the pseudo-first-order and pseudo second-order models, and the Elovich equation [146].
The pseudo-first order model is described by the equation:
dq t dt = k 1 ( q e q t ) ,
where qe and qt (both in mg·g−1) are the adsorbent uptakes at equilibrium and time t, respectively, and k1 (min−1) is the pseudo-first-order rate constant. The solution of this equation with the initial condition t = 0; q = 0 and t = t; q = qt gives:
ln ( q e q e q t ) = k 1 · t   or   q t = q e · [ 1 exp ( k 1 · t ) ] ,
Different studies on the adsorption of pollutants from liquid phase claim this model as the most appropriate for adsorption kinetics.
The pseudo-second order model [147] can be expressed by:
dq t dt = k 1 ( q e q t ) 2 ,
where k2 is the pseudo-second order rate constant (g·mg−1·min−1). The integration of the above equation with the initial condition of qt = 0 at t = 0 and qt = qt at t = t, yields:
1 ( q e q t ) = 1 q e + k 2 · t ,
or alternatively:
q t = t ( 1 h 0 ) + ( t q e ) ;   h 0 = k 2 · q e 2 ,
where h0 (mg·g−1·min−1) is the initial adsorption rate. This model has been also successfully applied to the adsorption of different compounds from aqueous solution.
Finally, the Elovich model [148] was described by:
d q t dt = α e β q ,
where α (mg·min−1·g−1) is a constant associated to chemisorption rate and β (g·mg−1) is a constant related to the extent of surface coverage. Assuming that αβt >> 1, and with the initial condition of q = 0 at t = 0 and q = q at t = t, the solution is given by:
q t = β ln ( α β ) + β ln ( t ) .
β can be directly obtained from the slope of the plot of qt versus ln(t) and α can be calculated from the intercept of the same plot once β is known.

5.3. Adsorption Dynamics

Many real adsorption operations proceed in fixed bed adsorbers [149,150]. In this type of systems, the inlet stream passes through a column packed with the adsorbent particles where the pollutants are adsorbed until exhaustion of the adsorbent capacity. Breakthrough curves are the representation of the outlet concentration as a function of the adsorption time up to equal inlet and outlet concentrations. Figure 9 shows the typical breakthrough curve. The concentration increases due to the limited adsorption capacity of the bed. The zone represented in grey color is the mass transfer zone, defined as the part of the adsorbent bed where adsorption is taking place and, therefore, the concentration varies in the direction of the flow. Breakthrough occurs when the leading forward part of this zone reaches the exit of the column. The breakthrough concentration, Cb, is defined as the maximum concentration allowed at the outlet stream and it depends on the requirements to fulfill.
In the mathematical modeling of fixed-bed adsorption, some assumptions must be adopted: (i) the system behaves as isothermal, without temperature variations through the bed produced by the adsorption process itself; (ii) only one adsorbate is considered in the liquid stream; (iii) the concentration of the solute in the liquid is small, so that adsorption does not produce any change in the liquid flow rate; (iv) there is no radial velocity and, (v) therefore, the adsorbate concentrations in both phases in the radial direction are constant [144]. With this, the mass balance in the column can be expressed by:
C t + ν C z + 1 ε ε ρ p q t = D L 2 C z 2 ,
where ν is the flow liquid velocity (cm·s−1), ρp the adsorbent particle density (g·cm−3), DL the axial dispersion coefficient (cm2·s−1), and z the spatial coordinate for the column length (cm). The adsorption rate, ∂q/∂t, can be described by one of the kinetic models defined in the previous section. This equation can be numerically solved using the following initial and boundary conditions:
t = 0 ;   C = 0 ;   q = 0 ,
t > 0 ;   z = 0 ;   q = 0 ,
t ;   C i t = 0 ;   q t = 0 .
Different numerical methods have been explored to solve the mass balance for fixed bed adsorbers. However, the use of this rigorous model requires knowledge of many interdependent kinetic parameters before the solution [152]. Due to this, empirical models with high accuracy but fewer parameters have been proposed in the literature [153]. Some of them are briefly described in the following lines.
The Bohart-Adams model [154] was obtained applying the surface reaction theory that considers the equilibrium non-instantaneous, and adsorption rate proportional to both the adsorption capacity and the concentration of solute in the liquid. This model is very suitable for adsorption processes with high-affinity equilibrium behavior (or irreversible isotherm) [144,155]. The linearized expression of the Bohart–Adams equation is:
ln ( C 0 C 1 ) = k BA N 0 z u k BA C 0 t ,
where kBA is the Bohart-Adams rate constant (cm3·mg−1·min−1), N0 is the adsorption capacity per unit volume of sorbent bed (mg·cm−3), z the bed length (cm), and u the superficial velocity (cm·min−1). Plotting ln[(C0/C) − 1)] versus t gives a straight line whose slope is −kBAC0 and the intercept is equal to kBAN0z/u.
The Thomas model [156] assumes Langmuir adsorption isotherms, the pseudo second-order kinetic model, and no axial dispersion. Under these conditions, the linearized solution of the mass balance equation can be expressed as:
ln ( C 0 C 1 ) = k T q 0 m Q k T C 0 t ,
where kT is the Thomas rate constant (cm3·mg−1·min−1), q0 the saturation adsorption capacity (mg·g−1), m the adsorbent mass in the column (g) and Q the operating flow rate (cm3·min−1).
The Yoon-Nelson model [157] was proposed to predict the breakthrough curves of gas-phase adsorbates on activated charcoal. The linearized equation of the Yoon-Nelson model is expressed by:
ln ( C C 0 C ) = k YN ( t τ ) ,
where kYN is the rate constant (min−1), and τ the time required for 50% adsorbate breakthrough. Both parameters can be obtained from the plot of a ln[C/(C0 − C)] versus t. This model does not require any information about the adsorbent particles and/or bed characteristics.
Finally, the Wolborska model [158] was proposed to predict the breakthrough plots at low concentration of the adsorbate. The linearized expression is given by:
ln ( C C 0 ) = β a C 0 N 0 t β a z u ,
where C0 is the inlet concentration of adsorbate (mg·L−1), βa a kinetic coefficient for external mass transfer (min−1), N0 the maximum amount adsorbed per unit volume of adsorbent (mg·L−1), z the bed length (cm), and u the superficial velocity (cm·min−1). Fitting ln(C/C0) versus t, βa can be obtained from the intercept, and N0 from the slope once βa is determined. In some studies, it is observed that this model fits properly only the initial part of the breakthrough curve [159]. More empirical models for the fitting of the breakthrough adsorption curves can be found elsewhere [151].

6. Adsorption of Emerging Contaminants on Biomass-Derived Carbons

6.1. Adsorption on Biochars

This section summarizes the results on the adsorption of emerging contaminants by raw or modified biochar. The literature contains numerous references about activated biochars that are intentionally omitted in this section, since an activated biochar can be considered an as activated carbon and, therefore, will be included in the following section. The main parameter that controls the final properties of the synthesized biochars is the pyrolysis/carbonization temperature, although the effect of other parameters, such as residence time, heat transfer rate or biomass feedstock, cannot be discarded [78]. These variables affect directly the characteristics (surface area, pore size, amount of surface oxygen groups or ion-exchange capacity) and adsorptive properties of the resulting biochars [78]. Table 5 summarizes the synthesis conditions and characteristics of some of the biochars used for the adsorption of emerging pollutants in the literature.
Antibiotics are frequently detected in water streams due to their widespread use. Among them, various sulfonamides, based on SO2NH2 group, are regularly used because of their antibacterial activity. Sulfamethoxazole (SMX) has been chosen as target pollutant in many reported works. It was adsorbed at different pH on magnetic biochar derived from pine sawdust [160]. The amount adsorbed decreases at increasing pH, especially at the highest pH analyzed (8.5). It was observed that despite the SMX and biochar being oppositely charged, on the basis of pH and pHpzc values, the amount adsorbed increased with increasing ionic strength, suggesting that electrostatic interaction was repulsive or not involved. The authors concluded that the adsorption mechanism is controlled by π–π electron donor-acceptor and hydrophobic interactions. The adsorption of sulfamethoxazole on a biochar from pelletized pine-forestry waste and the subsequent thermal regeneration in fixed-bed was also analyzed [180]. It was observed a more than 3-fold increase of the adsorption capacity of sulfamethoxazole after thermal regeneration of the adsorbent bed. The authors concluded that this enhancement can be due to the increase of the surface area of the biochar after thermal treatment in air, although they did not rule out the effect of other factors such as changes in surface chemistry. Zheng et al. [161] analyzed the adsorption of SMX at different pH on Arundo donax-derived biochars carbonized at different temperatures in the range of 300 to 600 °C. The authors concluded that neutral SMX molecules (SMX0) were dominant for sorption at pH 1.0–6.0, while above pH 7.0, although the biochar surface was negatively-charged, anionic SMX species are adsorbed and their sorption increased with pH and is regulated via charge-assisted H-bonds. The SMX0 sorption at pH 5.0 was non-linear and was controlled for all biochars via hydrophobic interaction, π–π electron donor-acceptor interaction and pore-filling. Regarding the temperature used to prepare the biochars, it was described that the removal of inorganic fraction in low-temperature biochars (e.g., 300 °C) reduced SMX sorption, while enhanced the sorption by high-temperature ones (e.g., 600 °C) due to the presence of temperature-dependent inorganic fractions in the biochars. Xie et al. [162] analyzed the adsorption of sulfamethoxazole and sulfapyridine on three pine-wood biochars. For both sulfonamides, the adsorbent surface area-normalized adsorption was stronger at higher pyrolysis temperature, probably due to the enhanced π–π electron donor-acceptor interaction with the carbon surface by the higher degree of graphitization. Despite the relatively large difference in the content of surface O-functionalities between the biochars, their surface area-normalized adsorption was very similar, suggesting a role of low significance of those functionalities. The simultaneous removal of cadmium (Cd) and SMX on rice straw biochar was investigated by Han et al. [181]. The equilibrium was well described by the Langmuir isotherm. The maximum adsorption capacity of SMX increased notably in the presence of Cd (from 1.83 up to 9.18 mg·g−1) probably as a consequence of the formation of surface complexes between Cd or SMX with carboxyl or hydroxyl groups. Ahmed et al. [163] reported both the single and competitive sorption of several sulfonamides, namely, sulfamethazine, sulfamethoxazole and sulfathiazole on functionalized biochar. The experimental equilibrium data fitted well the Langmuir and Freundlich models for single solutes, and the Langmuir one for competitive solutes. The adsorption capacities were in the order sulfathiazole > sulfamethoxazole > sulfamethazine, with about three times lower adsorption values in competitive than in single adsorption. The kinetic data were best described by the pseudo second-order (PSO) model for single solutes and by PSO and intra-particle diffusion models for competitive solutes. The adsorption mechanism was governed by pore filling through diffusion. The adsorption of neutral species seems to proceed by strong H-bonds followed by π–π electron donor–acceptor interactions, and Lewis acid-base interactions. In contrast, the adsorption of positive sulfonamides species is mainly due to π-π electron-donor-acceptor interactions. Finally, the sorption of negative species was controlled by proton exchange, although with a significant role of π–π electron acceptor–acceptor interactions. Li et al. [182] investigated the sorption of SMX on biochars derived from rice straw (RS) and alligator flag (AF). The adsorption was well described by the Langmuir isotherm with saturation capacities of 3.65 mg·g−1 with rice straw derived adsorbent. The presence of Cu2+ and/or Cd2+ ions at relatively low concentrations (20 mg·L−1) significantly enhanced the adsorption capacity.
Other important antibiotic present in urban wastewater is tetracycline, a broad-spectrum antibiotic usually used in treatments of various infections. Rice-husk derived biochar was used for the adsorption of this antibiotic [164]. The biochar was modified by simple acid and alkali treatments. It was concluded that the alkali treatment increased the adsorption capacity of tetracycline, probably as consequence of the higher development of surface area, although π–π interactions and O-functional groups played also a significant role in the adsorption process. Jing et al. [165] analyzed the enhanced adsorption of tetracycline on methanol-modified biochar from rice husk. The modified biochar showed not only a higher adsorption capacity (both in batch and continuous adsorption tests), but also a faster kinetics, probably because of the increase in the amount of surface oxygen groups, ester and hydroxyl, in the modified biochar, which suggests that more π–π electron donor interactions can occur. Kinetic data fitted a pseudo-second order model rather than the diffusion one. Recently, Chen et al. [166] reported tetracycline adsorption capacities up to 167.5 mg·g−1 using H3PO4-modified biochars from pig manure and rice straw. The pKa of tetracycline molecule and pHPZC of biochar were supposed to be the main causes of the changes in the adsorption capacities at different pH. The adsorption mechanism seems to proceed through H-bonding and π-π electron donor-acceptor interactions, which can explain the increase of the adsorption with pH raising from 5.0 to 9.0. Even higher tetracycline adsorption capacities were reported when using alkali–acid modified biochar with magnetic properties obtained from sewage sludge [167]. According to density functional theory model calculations, the adsorption mechanism was controlled by strong π–π stacking interaction and pore-filling. Increasing the carbonization temperature led to higher porosity development and the loss of a significant amount of oxygen surface groups (as shown by FTIR analyses). The increase of surface area resulted in higher adsorbed amounts of tetracycline, suggesting a more significant contribution of surface area than oxygen functionalities, in contrast with other published results. Wang et al. [183] reported the sorption of tetracycline from aqueous solution on biochars synthesized by pyrolysis of rice straw at 300, 500 and 700 °C. Both, Freundlich and Langmuir isotherms described properly the experimental adsorption data, with an increase in the adsorption capacity at increasing pyrolysis temperature (maximum capacity of 14.16 mg·g−1 at 25 °C). The relatively high surface area (28 m2·g−1) of the biochar pyrolyzed at the highest temperature and the π–π electron donor-acceptor interactions contributed to this relatively high adsorption capacity. A thermodynamic analysis indicated that the tetracycline adsorption process was spontaneous and endothermic.
Female hormones, such as 17β-estradiol, used in various medical treatments, have been also detected in residual urban waters. The effect of the pyrolysis temperature on the adsorption of 17β-estradiol on rice straw-derived biochar was analyzed elsewhere [168]. The adsorption mechanism was governed by electrostatic attractions and π–π interactions. The chars synthesized at higher carbonization temperatures showed higher adsorption capacities. The maximum adsorption capacity obtained by fitting the experimental data to the Langmuir isotherm was almost 65 mg·g−1. This work concluded that the adsorption of 17β-estradiol is a physicochemical process and the mechanism of adsorption included π–π interactions, electrostatic repulsion, film diffusion–controlled and multilayer adsorption. Dong et al. [169] analyzed the adsorption of 17β-estradiol using highly adsorptive magnetic biochar nanoparticles obtained from bagasse. The adsorption kinetics was described by a pseudo second-order model, while the equilibrium data fitted well to the Langmuir equation with a calculated saturation capacity of 50.2 mg·g−1. FTIR analyses suggested that adsorption proceeds through simultaneous hydrophobic and π–π electron donor-acceptor interactions, while the controlling mechanism can change from hydrophobic to π–π interactions at increasing pyrolysis temperature.
Essandoh et al. [170] analyzed the adsorption of salicylic acid and ibuprofen from aqueous solutions on pine wood biochar. The adsorption of both compounds increased at low pH values. The adsorption capacities decreased with increasing pH and then exhibited a second increase related to the pKa of the carboxylic acid functionalities of ibuprofen and salicylic acid. Finally, a decrease of adsorption was observed at the highest pH tested. Conjugate acid/base equilibria of the adsorbates and the phenolic hydroxyl and carboxylic acid biochar sites versus pH dominated the mechanism. Adsorption kinetics followed a pseudo second-order model for both adsorbates. The saturation adsorption capacities obtained from the Langmuir model were 22.70 and 10.74 mg·g−1 for salicylic acid and ibuprofen, respectively, despite the low porosity of that pinewood biochar (1.35 m2·g−1). Salem and Yakoot [171] reported ibuprofen adsorption capacities of approximately 170 mg·g−1 and adsorption kinetics following a pseudo second-order model with rice straw-based biochars obtained at different temperatures. The work identifies lactonic, phenolic and carboxylic oxygen groups on the surface of the biochar, which decompose by increasing carbonization temperature. The authors also concluded that ibuprofen adsorption takes place by π–π interactions. Lonappan et al. [172] reported the adsorption of diclofenac, a nonsteroidal anti-inflammatory drug, on biochars derived from pine wood and pig manure. It was stated that diclofenac adsorption on pine chars was strongly affected by pH. However, the adsorption on pig manure-derived biochar was not so affected by the pH variations. The isoelectric point (pHIEP) of the pig manure biochar was 2.15, while the pKa of diclofenac is 4.15. The maximum adsorption capacity was obtained at pH 2, decreasing with increasing pH. This reduction can be due to changes in the surface charge and repulsion forces between the negative surface sites of biochar that repels the diclofenac anion. However, the decrease in adsorption capacity is not very significant even at high pH values. This suggests that phenomena like electrostatic interactions are not the main responsible of adsorption but electrostatic interactions, H-bonding, hydrophobic effects, and π–π electron donor acceptor interactions. Oxygen-containing functional groups such as carboxylic acids allow adsorption through H-bonding irrespective of pH [184]. Furthermore, polar functional groups, such as hydroxyl and amine groups, exhibited an electron-withdrawing effect at basic pH [185] and these groups can interact with aromatic rings (π electron acceptors).
Tong et al. [173] reported the adsorption of triclosan, an antimicrobial used in personal care and disinfection products, on acid-treated biochar obtained at different temperatures in the range of 300 to 800 °C. The maximum triclosan uptake, 0.87 mg·g−1, was obtained with 800 °C biochar. The adsorption capacities at pH between 5 and 9 were quite similar. The adsorption was ascribed to the relatively high surface area (141 m2·g−1 for the sample pyrolyzed at 600 °C), hydrophobicity, and potential interaction between biochar and triclosan functional groups including hydrogen bonding and π-stacking. More recently, the same research group analyzed triclosan adsorption on bench-scale column experiments to stablish the influence of flow rate and competition due to the presence of other organic micropollutants and inorganic nutrients on the adsorption [186].
Pesticide removal from wastewaters by adsorption on biochars has also been analyzed in the literature. Mandal et al. [174] studied the adsorption of atrazine and imidacloprid on different chars obtained from eucalyptus bark, corn cob, bamboo chips, rice husk and rice straw. The adsorption kinetics was well described by the Elovich model. The adsorption capacity of the rice-straw derived biochar was enhanced after treatment with phosphoric acid. The work concluded that the adsorption of atrazine on the synthesized biochars was controlled by physical properties (mainly mesopore volume) while imidacloprid adsorption was controlled by chemical ones (polarity and functional groups). Less carbonized biochars (high H/C ratio) showed higher adsorption capacities. Atrazine adsorption on biochars obtained from dairy manure by heat treatment in air at different temperatures (≤500 °C) was also studied [187]. This study concludes that the removal efficiency increases with the temperature of heat treatment, although at the highest temperature the char showed an extremely high ash content, due to the combustion of most of the organic fraction of the biochar. Zhao et al. [175] analyzed the effect of NH4H2PO4 treatment of corn stalk biochars on atrazine adsorption. They concluded that this treatment increases very significantly the adsorption capacity, from 7.8 up to 53.9 mg·g−1 at 25 °C. The isotherms were best fitted by the Redlich-Peterson model. The authors indicated that physisorption in micropores was the main mechanism, although with the contribution of π–π electron donor-acceptor interactions. Atrazine sorption on deashed pig manure biochars suggested that the adsorption mechanism can be explained by the hydrophobicity of the adsorbent, although pore-filling and π–π electron donor–acceptor interactions were also involved [176]. Adsorption increased very significantly upon removal of ashes, probably by the unblocking of adsorption active sites. Xiao and Pignatello [188] indicated that the micro- and mesoporosity of biochars, which increase along the synthesis temperature, strongly affect the adsorption of triazine herbicides, although steric effects and π–π electron donor-acceptor interactions also have to be considered. Cationic aromatic amines can adsorb on the biochar surface by π–π electron donor-acceptor interactions between the cation of the molecule and the electron-rich polyaromatic surface of the biochar. Liu et al. [177] found that the atrazine adsorption capacities increased at increasing pore volume of the biochars. The low activation energy of the adsorption process suggested a predominantly physical mechanism. The adsorption of several pesticides, namely, bentazone, chlorpyrifos, diuron, glyphosate and 2-methyl-4-chlorophenoxyacetic acid (MCPA) on wood-derived biochars was analyzed by Cederlund et al. [189]. The adsorption capacity varied greatly depending on the pesticide, following the order diuron > chlorpyrifos > MCPA > bentazone > glyphosate. Heat treatment at 450 °C increased the porosity and the wettability of the biochar, resulting in increased adsorption of MCPA and bentazone. It is noteworthy that a further coating of the biochar with magnetite reduced the specific surface area but increased the adsorption of glyphosate.
The adsorption of plasticizer compounds has also been analyzed in the literature. Different biochars from pyrolysis of grass and wood biomass at different temperatures (200–700 °C) were used in the adsorption of phthalic acid esters (PAEs) with different hydrophobicity [190]. The study concluded that lower temperature treatments yield more efficient adsorbents towards hydrophobic adsorbates such as PAEs. Increasing the carbonization temperature yields biochars with higher aromaticity and, as consequence, a higher ability to generate π–π electron donor–acceptor interactions. Aromatic sheets in biochars prepared at high temperatures (600–700 °C), which lost all or most of their O and N functionalities, can be assumed to be predominantly electron donors, while, biochars synthesized at low or intermediate carbonization temperatures can be considered as electron acceptors or bifunctional. Jin et al. [178] analyzed the adsorption and co-adsorption of phenanthrene (PHE) and dibutyl phthalate (DBP) on biochars from grass (soybean, rice, and cotton) straw, wood dust and swine manure. They observed enhanced adsorption with surface polarity and ash content, probably due to the increase of polar groups on the inorganic material. The presence of PHE resulted in DBP enhanced adsorption, suggesting that DBP and PHE had different adsorption sites. The synthesized biochars showed a high aromaticity (≥86.8%), and, consequently π–π bonding was suggested as the main adsorption mechanism. The π–π interactions between DBP and the surfaces of the biochars were less favorable than those with PHE, because of the difference in the molecular structure of both adsorbates. Organic contaminants with a planar molecular structure showed stronger sorption on soot materials than non-planar ones [191]. Considering that PHE is a planar compound, and DBP is not, π–π interactions were more likely between PHE and biochar than between DBP and biochar. Ghaffar et al. [179] analyzed the effect of biochar aging on the adsorption capacity of di-alkyl phthalates. Biochars were synthesized from peanut-shell and their aging was induced by chemical oxidation with HNO3/H2SO4. Despite the aging process reducing surface area and porosity, an increased adsorption was observed, probably due to the existence of strong binding sites between the oxidized surface of the adsorbent and the phthalates molecules. The adsorption proceeded through hydrophylic and π–π electron donor-acceptor interactions. Recently, Jing et al. [192] studied the adsorption of two typical PAEs, dimethyl phthalate and diethyl phthalate, on biochars obtained from peanut hull and wheat straw at different pyrolysis temperatures (450, 550, and 650 °C). Increasing temperatures resulted in biochars with higher surface area, higher aromaticity and lower amount of surface functional groups. Adsorption kinetics were well defined by quasi second-order kinetic model. Regarding to the adsorption capacity, the biochars from wheat straw yielded higher values than those of peanut hull biochars, probably due to the differences in the oxygen-functional groups.
Summarizing, adsorption of emerging contaminants on biochars is affected by different factors including biochar properties, operation conditions and the nature of the pollutant. Regarding the biochar properties, these are mainly related to the nature of the feedstock and the preparation conditions, being probably the carbonization temperature, the most relevant parameter affecting the adsorption characteristics. Low carbonization temperatures (<300–400 °C) result in low porosity biochars, but with a significant number of functionalities, which favor the adsorption of hydrophobic adsorbates. Medium carbonization temperatures (400–700 °C) yield biochars with the highest porous development and a higher aromaticity, the latter promoting electron donor interaction. As consequence of this moderate carbonization temperature, the biochar surface still retains a significant proportion of oxygen and nitrogen surface groups, which could act as electron acceptors. Therefore, biochars synthesized at low or intermediate temperature must be considered electron acceptors or bifunctional, respectively, with regard to electron donor-acceptor interactions. Finally, biochars prepared at high temperatures (>700 °C), which lose most of their O and N functionalities and can be assumed to be predominantly electron donors.
Regarding the effects of the adsorption conditions, probably the main variable to be considered is the pH of the solution. This parameter has shown to affect considerably the equilibrium adsorption capacities depending on the dissociation constant, pKa, of the organic pollutant, and the pH of the adsorbent surface. The existence of protonated and deprotonated species depends on the pH of the solution relative to the pKa of the organic pollutant. When pH < pKa, organic acids are the dominant non-dissociated species, whereas organic bases are the main dissociated species (cations formed by protonation). In the case of pH > pKa, the predominant dissociated species are organic acids (as anions) and the principal non-dissociated species are organic bases. To foresee their trend to adsorb on the biochar surface, the relation between the solution and the adsorbent pH must be analyzed. If the pH of the solution is lower than the pH of the surface, the surface is positively charged, with the corresponding electrostatic attraction to negatively charged species and repulsion to positively charged ones. In contrast, if the pH of the solution is higher than that of the carbon surface, this will be negatively charged, thus attracting positively charged species and repelling the negative ones.

6.2. Adsorption on Activated Carbons

Since the removal of emerging contaminants is receiving special attention in the purification of waters, there are many works in bibliography devoted to this research topic. Table 6 summarizes the target emerging contaminant, some of the characteristic parameters of the activated carbon used as adsorbent (including the biomass precursor and the activating agent), the temperature and pH used in the adsorption study and the adsorption capacities (mainly from the Langmuir’s monolayer adsorption capacity, but also directly from experimental results) obtained from some of the studies in the literature.
Tetracycline was adsorbed on a NaOH-activated carbon synthesized from macadamia nut shell using an activating ratio of 3:1 and an activation temperature equal to 700 °C [104]. Tetracycline shows three different pKa values: pKa1 = 3.3, pKa2 = 7.7 and pKa3 = 9.7. In aqueous solution, some groups of the molecule undergo protonation or deprotonation giving rise to four species: TCH3+, TCH2±, TCH and TC2−. At pH values lower than pKa1, TCH3+ prevails; at pH values between pKa1 and pKa2 TCH2± is predominant (zwitterion molecule); TCH in the main species at pH values between pKa2 and pKa3, and TC2− at pH higher than pKa3. According to Boehm titration, the surface of the activated carbons presents predominantly basic groups, being in agreement with the pHpzc value of 8.74. At pH values lower than pHPZC the surface of the activated carbon is positively charged. Taking into account that the maximum adsorption capacity was obtained at pH = 3, where TCH3+ is the main species and the activated carbon surface is positively charged, the adsorption mechanism should proceed through π–π dispersion interactions. At higher pH values, the still significant tetracycline adsorption can be due to the buffering effect of the activated carbon, which in contact with solution resulted in pH values close to neutrality. In these conditions, other adsorption mechanism such as hydrogen bonding can contribute to tetracycline adsorption, since the zwitterion molecule is predominant. The porous texture corresponded mainly to micropores (78.2%) with a surface area of 1524 m2·g−1. The isotherm providing the best fit to the experimental data was the Temkin one, while the best-fitting kinetic model was Elovich. The maximum monolayer capacity was 455.33 mg g−1. Authors also concluded that the adsorption process was limited by intraparticle and film diffusion. Huang et al. [193] analyzed the adsorption of tetracycline and ciprofloxacin on an activated carbon obtained from lignin by H3PO4 chemical activation. The synthesized activated carbon showed a surface area of 933 m2·g−1 and both acid and basic surface functional groups. The adsorption kinetics for both adsorbates followed pseudo second-order model, while adsorption equilibrium data fitted well to the Langmuir isotherm with saturation capacities of 475.48 and 418.60 mg·g−1 for tetracycline and ciprofloxacin, respectively. Marzbali et al. [194] studied the batch adsorption of tetracycline using a mesoporous activated carbon prepared from apricot shell by H3PO4 activation. A thermodynamic analysis revealed that adsorption was endothermic and spontaneous. Adsorption equilibrium data fitted well to the Freundlich model, whereas adsorption kinetics followed a pseudo second-order model. The highest adsorption capacity on this activated carbon was 308.3 mg·g−1. The authors concluded that adsorption was controlled by both intraparticle diffusion and film diffusion. The analysis of the pH effect resulted in similar conclusions to those aforementioned in the study by Martins et al. [104], although the H3PO4-derived carbon showed a highly acid surface (pHpzc = 2.13) compared to the NaOH-derived one that had a basic surface (pHpzc = 8.7). In the case of the H3PO4–carbon, its surface was negatively charged in all the pH range analyzed. Due to this, at low pH values adsorption proceeds through electrostatic attraction interactions that increase at increasing pH. At medium pH, adsorption occurs via π–π electron donor-acceptor interactions. Finally, a reduction of the adsorption capacity was observed at high pH values as consequence of the appearance of electrostatic repulsion interactions. All these results showed the successful application of the synthesized activated carbon for effective removal of tetracycline (TC). The effect of ferric nitrate as dopant for adsorption of tetracycline from aqueous solution was analyzed by Li et al. [195]. Ferric nitrate was used for altering the properties of an activated carbon obtained by H3PO4 chemical activation of Iris tectorum. The effect of the nitrate salt improved the porous texture and the amount of surface acid groups, resulting in a significantly higher adsorption of tetracycline. A strong reduction of the adsorption capacity with increased pH was observed, due to the reduction of the attractive electrostatic interaction with the deprotonation of the tetracycline molecule. The tetracycline maximum adsorption capacity was 769.2 mg·g−1. Sayğılı and Güzel [196] synthesized an activated carbon by ZnCl2-activation of tomato industrial processing waste tested for tetracycline adsorption. The experimental data followed a pseudo second-order kinetic model and fitted to the Langmuir isotherm showing a saturation capacity of 500.0 mg·g−1. The thermodynamic study showed that adsorption was endothermic and spontaneous under the testing conditions. In a similar study [197], the same authors even obtained a higher adsorption capacity of tetracycline, 625 mg·g−1, using an activated carbon prepared by ZnCl2 chemical activation from grape industrial processing pulps. ZnCl2 was also chosen as activating agent for the preparation of an activated carbon from oak charcoals tested for to tetracycline adsorption [198]. In this study, the effect of inorganic cations (Li+, K+, Mg2+, Ca2+, Ni2+, and Fe3+) and anions (HCO3, NO3 and SO42−) was analyzed, resulting in all cases in a decreased adsorption. Conversely, in this study, the solution pH showed very little effect on the adsorption. A reduction of adsorption capacity was only at pH values higher than 9. At intermediate pH values adsorption occurred via non-electrostatic π–π dispersion or hydrophobic interactions, while at high pH, repulsive electrostatic interactions are responsible for the observed adsorption reduction. The highest amount adsorbed was 282.1 mg·g−1. Similar conclusions on the effect of pH on tetracycline adsorption were obtained by Jang et al. [105], who evaluated a NaOH-activated carbon from Pinus taeda. The study concluded that hydrogen bonding and π–π interaction were the most plausible adsorption mechanisms at low-medium pH values, being intraparticle diffusion a major limitation. Fan et al. [199] analyzed the equilibrium and kinetics of adsorption of three tetracycline antibiotics, namely, tetracycline (TC), oxytetracycline (OTC), and chlortetracycline (CTC), on hazelnut shell-derived activated carbons (HSAC) obtained by H3PO4-activation. The maximum adsorption capacities were 321.5, 313.5 and 302.9 mg·g−1 for OTC, CTC and TC, respectively. The data fitted well with the pseudo second-order kinetic and Langmuir models. The intraparticle diffusion model indicated that the adsorption of TCs on the HSAC was controlled by both intraparticle diffusion and external mass transfer. The values of 1/n of the Freundlich isotherm (0.2919 for TC, 0.3028 for OTC and 0.2917 for CTC) suggested a high affinity between the carbon adsorbent and the three antibiotics. At the testing temperature and pressure, the thermodynamic constants revealed that the adsorption of TCs onto the HSAC was spontaneous and endothermic. Oliveira et al. [200] prepared activated carbons by chemical activation with K2CO3 and H3PO4 of raw and bleached cellulose pulps. The carbons were used as adsorbents in batch for the removal of the antiepileptic carbamazepine and the antibiotic sulfamethoxazole from ultra-pure water and from waste water treatment plant (WWTP) effluents. In the case of real WWTP effluents, although the synthesized activated carbons adsorbed significant amounts of both carbamazepine and sulfamethoxazole contaminants, a lower adsorption capacity was obtained for the latter. The highest adsorption capacities from WWTP effluents were achieved by carbons produced from bleached pulp and activated with H3PO4 (92.0 and 13.0 mg·g−1 for carbamazepine and sulfamethoxazole, respectively). Since, the pHpzc of the H3PO4-derived carbons was quite low (between 2.3 and 2.8) and the pH of the WWTP effluent was 7.3, the carbon surface was deprotonated and negatively charged, attracting cations and repelling anions. Taking into account the pH of the solution, sulfamethoxazole was negatively charged in the experiments (pKa1 =1.8 and pKa2 = 5.7), which induced repulsion forces between the molecules of sulfamethoxazole and the carbon surface, hindering the adsorption process. In the case of carbamazepine, this compound showed a neutral charge at the pH analyzed (pKa = 13.9). Therefore, repulsive interactions did not occur, which could justify the higher adsorption capacity of carbamazepine than for sulfamethoxazole.
The adsorption of five endocrine disruptors, namely estrone (E1), 17β-estradiol (E2), estriol (E3), 17α-ethynylestradiol (EE2) and bisphenol A (BPA), on an activated carbon from Eucalyptus globulus wood activated with H3PO4 was analyzed by Ahmed et al. [220]. The authors concluded that π–π electron donor–acceptor interactions were responsible of adsorption. The adsorption capacity decreased following the order E1 > E2 > EE2 > E3 > BPA. Moura et al. [201] analyzed the adsorption of bisphenol A, ethinylestradiol, and amoxicillin on an activated carbon obtained by chemical activation with ZnCl2 of Macauba palm waste. The N2 adsorption-desorption isotherms at −196 °C revealed a porous texture consisting of micropores and narrow mesopores with a total surface area of 907 m2·g−1. The highest adsorption capacities were 33.8, 30.8 and 26.3 mg·g−1 for bisphenol A, ethinylestradiol and amoxicillin, respectively. The authors also analyzed the effect of pH and the possible adsorption mechanisms. In the case of bisphenol A, considering that the adsorption was not altered by positive or negative surface charges and that the molecule has two aromatic rings with conjugated π bonds, the authors suggested that π-π interactions were most likely. Similar results were observed in ethinylestradiol adsorption. In contrast, amoxicillin showed increased adsorption at pH 3, where a positive surface charge is present, suggesting an electrostatic interaction mechanism. These differences are related to the different dissociation of the three molecules, pKa1 = 9.59 and pKa2 = 10.2 for bisphenol A, pKa = 10.24 for ethinylestradiol, and pKa1 = 2.4, pKa2 = 7.4 and pKa3 = 9.6 for amoxicillin.
Baccar et al. [203] analyzed the adsorption of different pharmaceuticals, namely, ibuprofen, ketoprofen, naproxen and diclofenac on activated carbon synthesized by H3PO4-chemical activation of olive-waste cakes. Single and mixed drug solutions were considered. The adsorption capacities of the four contaminants were quite different and related to their pKa and their octanol/water coefficients, Kow. The adsorption kinetics followed the pseudo-second-order in all cases. Increasing pH gradually reduced the adsorption capacities of the four compounds. In contrast, temperature showed negligible effect on the adsorption process. Chakraborty et al. [204] studied ibuprofen uptake on raw and steam-activated biochar of Aegle marmelos shell. Adsorption followed Langmuir and Freundlich isotherms respectively, and a pseudo second-order kinetic model. Ibuprofen (pKa = 4.7) adsorption was favorable in acid medium and decreased at increasing pH. The thermodynamic study suggested an exothermic, spontaneous and feasible process. Mestre et al. [205] synthesized activated carbons from cork waste by two different procedures, chemical activation with K2CO3, and a two-stage procedure consisting of a chemical activation with K2CO3 followed by steam activation. The carbons were used for the adsorption of ibuprofen from water. The steam-activation step yields an activated carbon with a larger volume of supermicropores and less acid groups, resulting in significantly higher adsorption of ibuprofen. Again, as in many studies, kinetic and equilibrium adsorption results were in agreement with the pseudo second-order and Langmuir models, respectively. Between 25 and 40 °C, no significant influence of the temperature on ibuprofen adsorption was observed, reaching a maximum adsorbed amount of 416.7 mg·g−1. However, the amount adsorbed decreased strongly at increasing pH. At values higher than 5, ibuprofen adsorption was less favorable due to the electrostatic repulsion between the adsorptive anion and the surface of the activated carbon that gradually became more negatively charged. The same research group [221] used activated carbon adsorbents obtained from chemical and physical activation of a bioresource (cork) and municipal waste (plastic) also for ibuprofen removal. The work demonstrated that the ibuprofen adsorption was favored when using activated carbons with basic surface properties and formed by mesopores and micropores, whose presence is crucial to ensure accessibility and accommodation of the ibuprofen molecule. Mondal et al. [222] explored ibuprofen adsorption on steam-activated mung bean husk biochar. The equilibrium adsorption data followed the Langmuir isotherm (saturation capacity 62.5 mg·g−1), whereas the kinetics fitted well a pseudo second-order model.
Garcia-Mateos et al. [206] reported one of the very few studies on adsorption of emerging contaminants on biomass-derived carbons in fixed-bed adsorbers. In this study, paracetamol was adsorbed on an activated carbon synthesized by H3PO4-activation of olive stone waste. Equilibrium results fitted well to Langmuir isotherm with saturation adsorption capacities of close to 100 mg·g−1, depending on the adsorption temperature. Breakthrough adsorption curves were predicted from batch kinetic experiments after estimation of homogeneous and heterogeneous diffusion coefficients, reflecting the dependence of diffusion with the surface coverage of paracetamol. Wong et al. [207] synthesized activated carbons from spent tea leaves by chemical activation with ZnCl2, H3PO4, NaOH and K2CO3 tested for the adsorption of paracetamol. The activated carbon prepared with H3PO4 showed the highest adsorption capacity (59.2 mg·g−1), probably as consequence of the proper activation conditions used with this activating agent (activating ratio 1:1 and activation temperature 600 °C). The adsorption equilibrium data followed the Langmuir isotherm, whereas adsorption kinetics obeyed the pseudo second-order model. The authors also analyzed the effect of pH on paracetamol adsorption. At pH values higher than 2 (pHpzc), the activated carbon surface was negatively charged. Since paracetamol is a weak acid (pKa = 9.38), it remains predominantly neutral in solution below pH values of 9.38. At higher pH values, dissociation increases resulting in negatively charged species and in the electrostatic repulsion between these anionic species of paracetamol and the carbon surface. Despite this, the adsorption was quite significant at high pH values, indicating that pore filling played a key role in the adsorption mechanism. Bedia et al. [55] synthesized activated carbons from Tara gum by the less studied FeCl3 activation, using activation temperatures in the range of 400 to 1000 °C and different mass activating ratios. The highest surface area reached 1680 m2·g−1 with a predominance of micropores (≈75%). The carbons were tested for the aqueous-phase adsorption of antipyrine. The kinetic curves and adsorption isotherms fitted well to hyperbolic and Langmuir equations, respectively. At 20 °C, the saturation adsorption capacity was 275 mg·g−1. In this study, the adsorption capacity of the different synthesized activated carbons seems to be basically determined by the surface area of the carbons, although some deviations were observed, probably provoked by the different amount of surface functionalities, essentially oxygen-bearing groups.
In a recent study, Chen et al. [208] reported the adsorption of carbamazepine from water on activated carbons synthesized by chemical activation with KOH of pomelo peels. Kinetic results fitted to the pseudo second-order model and controlled by the intra-particle diffusion. The equilibrium was well described by the Langmuir isotherm. The saturation capacity was 286.5 mg·g−1. The study concludes that both the porous texture and the amount of surface functional groups affect the adsorption. The process was spontaneous and exothermic and mainly of physisorption type. In the pH range analyzed, carbamazepine molecules remain mainly in neutral form, leading to a low electrostatic attraction with the adsorbent surface. Therefore, the adsorption was ascribed mainly to hydrophobic, π–π interactions and hydrogen bonding. To et al. [202] studied the adsorption of antiepileptic carbamazepine and two β-blockers, atenolol and acebutolol, on an activated carbon synthesized from palm kernel shell by physical activation with carbon dioxide at 900 °C. The kinetic tests suggested that the adsorption proceeds predominantly by chemisorption mechanism (in contrast with the observed by Chen et al. [208]), following the Ritchie second-order kinetic model. The equilibrium results were fitted by the Sips equation with maximum adsorption capacities of 183.4, 225.4 and 170.1 mg·g−1 for atenolol, acebutolol and carbamazepine, respectively. The authors analyzed also the pH effect, concluding that in the case of atenolol and acebutolol the adsorption was mainly due to non-electrostatic interactions involving hydrogen bonding. In the case of carbamazepine, this molecule is in neutral form in the range of pH analyzed (pKa1 = 2.3 and pKa2 = 13.9), and then electrostatic interactions did not occur, and the adsorption process may involve hydrophobic and π–π bonding interactions. Torrellas et al. [209] studied the batch and dynamic adsorption of caffeine, diclofenac and carbamazepine on activated carbons obtained from peach stones by chemical activation with H3PO4. The carbons were submitted to different thermal treatments in presence and absence of oxygen to understand the effect of surface groups on the adsorption process. It was observed that the oxidation of the carbon surface decreased very significantly the adsorption capacity due to the enhancement of the hydrophilicity. The maximum carbamazepine adsorption capacity (355 mg·g−1) was higher than those of caffeine and diclofenac, probably because of the more hydrophobic character of carbamazepine, and its significantly lower water solubility.
Eragrostis plana Nees leaves were used as precursor for synthesizing an activated carbon by using microwave-assisted pyrolysis and chemical activation with ZnCl2 [210]. The activated carbon was tested for the adsorption of caffeine and 2-nitrophenol from water. The activation yielded a predominantly mesoporous carbon with a surface area of 1250 m2·g−1. FTIR analysis suggested the existence of carboxylic, carbonyl and hydroxyl functional groups on the carbon surface, whereas Boehm tritation revealed a high amount of acid moieties. In the case of caffeine, the adsorption was not affected (variations < 0.2%) by the pH of the solutions in the range tested (2.0–10.5), which indicates that adsorption was not due to electrostatic interactions. The highest adsorption capacities of caffeine and 2-nitrophenol at 25 °C were 235.5 and 255.8 mg g−1, respectively. Recently, Beltrame et al. [211] analyzed the preparation of activated carbon fibers by H3PO4-activation of pineapple plant leaves for the adsorption of caffeine. The activated fiber showed a surface area of 1031 m2·g−1 with a high amount of acid surface groups from the H3PO4 activation process [223,224]. The highest caffeine adsorption capacities were obtained at pH values up to 7, decreasing significantly at pH values of 8 and 9. The distribution diagram of species showed that the neutral form of caffeine (pKa = 8.30) is predominant until pH 5.5, and at higher pH values the anionic form of the molecule appears. Since, the pHpzc of the activated carbon was 2.8, its surface had a predominance of negative charges in a wide range of pH values. The protonated surface of the carbon, besides the neutral form of the caffeine molecule at pH of 2, justifies the slight decrease of adsorption. At pH values between 2 and 7, there is a predominance of neutral molecules and negative surface of the carbon, conditions that led to the highest adsorption capacity values, probably due to π–π interactions and hydrogen bonds between caffeine heterocyclic rings and carbon aromatic rings. Finally, the increase of solution pH resulted in decreased adsorption, which can be attributed to the increase of anionic caffeine species in solution. The adsorption was of physisorption nature, exothermic and spontaneous. Sarıcı-Özdemir and Önal [225] analyzed the adsorption of caffeine in activated carbons prepared from polymer waste from the textile industry by KOH chemical activation at different mass-activating ratios. The highest porous development was obtained at the highest activating ratio (5:1), resulting an activated carbon with a high surface area (1889 m2·g−1), although at extremely low activation yield (3.9%). The work reported a maximum caffeine adsorption capacity on this carbon of 351.0 mg·g−1.
The adsorption of pesticides has also received attention in the literature. Lupul et al. [212] reported the adsorption of atrazine, a weakly basic pesticide (pKb = 12.3), on hemp stem-based activated carbons with different surface modifications. The activated carbons were synthesized by chemical activation with KOH and their surface chemistry was subsequently modified by thermal annealing, nitric acid oxidation and amination. By these procedures, the authors achieved different carbon adsorbents with very similar porous texture but different surface chemistry. It was concluded that the oxygen and nitrogen functionalities decreased the amount of atrazine adsorbed. The hydrophobicity of the carbon surface enhanced the adsorption that seems to proceed through π–π dispersive interactions between the atrazine ring and the graphene layers of carbon, although the increase of the hydrophobicity could be considered also a key factor in the atrazine adsorption mechanism. In contrast, electrostatic interactions and hydrogen bonding were discarded. Equilibrium results were well fitted by Langmuir and Freundlich–Langmuir isotherms, whereas kinetic data followed intraparticle diffusion control model with a noticeable influence of film diffusion. Chang et al. [226] also analyzed the adsorption of atrazine on activated carbons obtained by KOH-activation of sugarcane bagasse. The authors analyzed the effect of pH and temperature and concluded that pH showed very little influence on in the adsorption capacity, while increasing the adsorption temperature slightly decreased the adsorption capacity. Chaparadza and Hossenlopp [213] analyzed the kinetics and thermodynamics of atrazine adsorption on an activated carbon synthesized by H3PO4 activation using banana peel. In contrast with the results reported by Chang et al. [226], in this study there was an optimum pH for atrazine adsorption between 7.0 and 8.2 and the amount of atrazine adsorbed increased with the adsorption temperature in the range analyzed (25–60 °C). Equilibrium results followed Langmuir and Redlich-Peterson models, while kinetics seemed to be controlled by both external mass transfer and intraparticle diffusion. The enthalpy of atrazine adsorption was estimated 67.8 kJ·mol−1 with a Gibbs free energy of −5.7 kJ·mol−1. Nourouzi et al. [214] analyzed the adsorption of glyphosate on activated carbon from waste newspaper. The activated carbon was obtained by a modified KOH-activation process, resulting in a relatively low porosity carbon with a total surface area of 535 m2·g−1 and a highly basic surface (pHpzc = 12.0). The amount adsorbed decreased very significantly with the pH, with a maximum adsorption capacity of glyphosate of 48.4 mg·g−1. At pH values lower than the pHpzc (pH < 12), the activated carbon surface was positively charged and exhibited anion exchange capacity. Since, glyphosate is acid (pKa1 = 2.0, pKa2 = 2.6, pKa3 = 5.6 and pKa4 = 10.6) it exists as cations. Therefore, when the pH of solution decreases the adsorption of glyphosate increases due to the positive surface charge of the adsorbent. When increasing the solution pH, the density of positive charge sites is reduced, and the adsorption of glyphosate is reduced due to the repulsive forces between adsorbent and adsorbate. Adsorption of the herbicide bentazon [108] and the insecticide carbofuran [215] was studied with activated carbon obtained from palm oil fronds by means of a physico-chemical activation method, which consisted of a simultaneous activation with KOH and CO2 gasification. The maximum surface area was 1237 m2·g−1. The adsorption of carbofuran fitted well to the Langmuir isotherm. The regeneration of the spent activated carbon was also analyzed with good results. Al Bahri et al. [216] synthesized activated carbons from grape seeds by chemical activation with phosphoric acid and tested them for to the adsorption of diuron from water. This study analyzed the effect of activation temperature and activating ratio on the porous texture of the resulting activated carbons. The best results, in terms of surface area and mesopore volume development, were obtained using an activating ratio of 3:1 and a carbonization temperature of 500 °C. Among the different kinetic models analyzed, the pseudo second-order described better the experimental results.
The removal of plasticizers has been also studied with activated carbons from different biomass sources. Bouhamidi et al. [217] analyzed the adsorption of diethyl and dibutyl phthalates on an activated carbon obtained from Albizzia julibrissin pods by H3PO4 chemical activation. Equilibrium results were best fitted by the Langmuir equation with saturation capacities of 977 and 438 mg·g−1 for dibutyl and diethyl phthalate, respectively, both at 20 °C. Kinetic data followed well a pseudo second-order model, whereas adsorption seemed to proceed by a liquid–film diffusion mechanism. The adsorption of the two phthalates followed the same trend, although with higher adsorption capacities for the butyl than for the ethyl phthalate. Furthermore, the adsorption capacities showed very little variation in the pH range analyzed (2–10) for both molecules. This behavior can be related to the non-ionic character of diethyl and dibutyl phthalates, which do not change their chemical speciation. It may also be related to the negative surface charge of adsorbent (pHpzc = 2.9) which does not change within the pH range tested. Wang and Chen [218] reported the adsorption of dibutyl phthalate from aqueous solution using ZnCl2-activated ginkgo leaves. Equilibrium data were well described by Freundlich isotherm, whereas kinetic data fitted well to the pseudo second-order model. The monolayer adsorption capacity predicted by the Langmuir isotherm was 129.9 mg·g−1. The adsorption was thermodynamically spontaneous. Fang and Huang [219] studied the adsorption of di-N-butyl phthalate on a commercial nutshell-derived activated carbon with a maximum adsorption capacity of 104.7 mg·g−1 at 45 °C and pH between 5 and 7. Adsorption isotherms correlate well with the Freundlich model, specially at low initial concentrations of di-N-butyl phthalate. Kinetic data at different adsorption conditions followed a pseudo-first-order model. The adsorption rate was controlled by both film and pore diffusion. The authors observed an increase of the adsorption capacity with adsorption temperature. A thermodynamic study revealed that the adsorption process was endothermic and spontaneous.
Jung et al. [227] analyzed the adsorption of several endocrine disrupting compounds (bisphenolA, atrazine and 17 β-ethinylestradiol) and pharmaceuticals (sulfamethoxazole, carbamazepine, diclofenac and ibuprofen) on activated biochars (more properly, activated carbons). The adsorbents were synthesized by chemical activation with NaOH of loblolly pine chips under oxygen-containing and oxygen-free atmospheres. The carbon synthesized under oxidizing conditions was composed mostly of aromatic moieties, with lower H/C and O/C ratios than the prepared in the absence of oxygen, which showed many polar functional groups. The higher development of porosity of the carbon obtained in oxygen-free environment resulted in higher adsorption capacity for all the species tested.
In conclusion, it is difficult to stablish general relationships on the adsorption of emerging contaminants by biomass-activated carbons due to the diversity of characteristics of those adsorbents, the chemical properties of the pollutant molecules and the adsorption conditions. However, it is generally accepted that adsorption proceeds through different mechanisms that sometimes can occur simultaneously, including: (i) Dispersive interaction between the π electrons of the graphene layers of the activated carbon and those of the aromatic ring of the adsorbate; (ii) donor–acceptor interactions involving oxygen surface groups (e.g., carbonyl), acting as donors, and the aromatic ring of the organic pollutant, acting as acceptor; and (iii) adsorbent–adsorbate electrostatic interactions and hydrogen bonds [228,229,230,231]. Although, as mentioned, it is difficult to establish a general adsorption mechanism, some general statements can be assumed: (a) the adsorption mechanism is complex involving electrostatic and adsorbent–adsorbate dispersion interactions; (b) the process is determined by many different factors including the adsorbate solubility, the hydrophobicity of both adsorbent and adsorbate and the strength of the π–π interactions; (c) the strength of π–π interactions depends on the adsorbate characteristics and the activated carbon aromatic ring functionalities, the latter can be modified by different types of treatments; and (d) the pH of the solution plays a crucial role on the adsorption mechanism, since it affects the surface charge of the adsorbent and the degree of ionization and speciation of the adsorbate [232].
It can be interesting to compare the adsorption behavior of biomass-derived activated carbons with commercial ones. Actually, there are no differences between both types of carbons, because the adsorption behavior depends on the same characteristics. However, the advantages of using biomass waste as raw material for the synthesis of carbon-based adsorbents should be mentioned, namely: (i) the revalorization of a waste; (ii) a lower cost of the final carbon since the precursor is widely available at low or non-cost; (iii) the carbons are obtained from renewable resources; and (iv) the carbon combustion does not increase the CO2 accumulation in the atmosphere due to its biomass origin.
The comparison between the adsorption of emerging contaminants on biochars (Table 4) and on biomass-derived activated carbons (Table 5) indicates that there are no significant differences between the mechanism and interactions involved in the adsorption process. However, some different aspects between both type of adsorbents can be highlighted. It seems that the higher pore development of activated carbons relative to biochars results, in general, in higher adsorption capacities of the former. However, it is also true that the processes to prepare biochars are usually simpler and cheaper than those for activated carbons, especially in the case of chemical activation.

7. Conclusions and Outlook

The presence of emerging contaminants in water will very likely be a problem of growing importance in the years to come. Therefore, the search for new technologies or the development of existing ones is crucial to assure a safe and continuous water supply. In addition, due to resources and energy shortages, the processes and technologies must be economically and environmentally sustainable. In this context, the current review highlights the enormous potential of biomass waste to be used as precursors for the synthesis of biochars or activated carbons for the adsorption of emerging contaminants. In addition to most common well-known biomass wastes, some other potential resources are gaining growing interest. Among them, lignin, a main component of lignocellulosic biomass from cellulose pulp manufacture, commonly used as fuel in pulp mills, deserves particular attention. The development of a biorefinery will increase dramatically its availability in the near future and its potential applications are being widely investigated [233]. These include the synthesis of carbon materials [234], with activated carbons and their applications as adsorbents being of main interest.
The benefits of the approach described in this review include the use and valorization of the biomass resources and the efficient purification of contaminated water, all framed within an environmentally friendly process at a relatively low cost. Certainly, some of the activation processes need chemicals, such as ZnCl2, H3PO4 and hydroxides, which imply some environmental risks and then these must be safely managed. Furthermore, in some cases relatively low final yields can affect the economy of the process. In spite of the fact that the starting material is waste, the yield affects the cost since it determines the amount to be transported to the manufacturing plant to be produced per unit product, which is related to operational costs. To go further in this field, researchers have to find ways of implementing these adsorbents at industrial scale, taking into account the availability of biomass residues and the yields of the global whole manufacturing process.

Author Contributions

J.B., M.P.-G., A.G.-A., J.J.R. and C.B. wrote and revised the manuscript.

Funding

This research was funded by Spanish MINECO project CTQ2016–78576-R.

Acknowledgments

The authors acknowledge the financial support from Spanish MINECO (project CTQ2016–78576-R). M. Peñas-Garzón is indebted to Spanish MECD for the FPU16/00576 predoctoral contract.

Conflicts of Interest

The authors declare no conflict of interest.

References

  1. Taheran, M.; Naghdi, M.; Brar, S.K.; Verma, M.; Surampalli, R.Y. Emerging contaminants: Here today, there tomorrow! Environ. Nanotechno. Monit. Manag. 2018, 10, 122–126. [Google Scholar] [CrossRef]
  2. Zhao, L.; Deng, J.; Sun, P.; Liu, J.; Ji, Y.; Nakada, N.; Qiao, Z.; Tanaka, H.; Yang, Y. Nanomaterials for treating emerging contaminants in water by adsorption and photocatalysis: Systematic review and bibliometric analysis. Sci. Total Environ. 2018, 627, 1253–1263. [Google Scholar] [CrossRef]
  3. La Farré, M.; Pérez, S.; Kantiani, L. Fate and toxicity of emerging pollutants, their metabolites and transformation products in the aquatic environment. TrAC Trends Anal. Chem. 2008, 27, 991–1007. [Google Scholar] [CrossRef]
  4. Luo, Y.; Guo, W.; Ngo, H.H.; Nghiem, L.D.; Hai, F.I.; Zhang, J.; Liang, S.; Wang, X.C. A review on the occurrence of micropollutants in the aquatic environment and their fate and removal during wastewater treatment. Sci. Total Environ. 2014, 473–474, 619–641. [Google Scholar] [CrossRef] [PubMed]
  5. Rodriguez-Narvaez, O.M.; Peralta-Hernandez, J.M.; Goonetilleke, A.; Bandala, E.R. Treatment technologies for emerging contaminants in water: A review. Chem. Eng. J. 2017, 323, 361–380. [Google Scholar] [CrossRef]
  6. Sipma, J.; Osuna, B.; Collado, N.; Monclús, H.; Ferrero, G.; Comas, J.; Rodriguez-Roda, I. Comparison of removal of pharmaceuticals in MBR and activated sludge systems. Desalination 2010, 250, 653–659. [Google Scholar] [CrossRef]
  7. Carr, D.L.; Morse, A.N.; Zak, J.C.; Anderson, T.A. Biological degradation of common pharmaceuticals and personal care products in soils with high water content. Water Air Soil Pollut. 2011, 217, 127–134. [Google Scholar] [CrossRef]
  8. Matamoros, V.; Sala, L.; Salvadó, V. Evaluation of a biologically-based filtration water reclamation plant for removing emerging contaminants: A pilot plant study. Bioresour. Technol. 2012, 104, 243–249. [Google Scholar] [CrossRef] [PubMed]
  9. Sui, Q.; Huang, J.; Deng, S.; Chen, W.; Yu, G. Seasonal variation in the occurrence and removal of pharmaceuticals and personal care products in different biological wastewater treatment processes. Environ. Sci. Technol. 2011, 45, 3341–3348. [Google Scholar] [CrossRef] [PubMed]
  10. Wang, Y.-K.; Sheng, G.-P.; Shi, B.-J.; Li, W.-W.; Yu, H.-Q. A Novel electrochemical membrane bioreactor as a potential net energy producer for sustainable wastewater treatment. Sci. Rep. 2013, 3, 1864. [Google Scholar] [CrossRef] [PubMed]
  11. Ma, J.; Wang, Z.; Mao, B.; Zhan, J.; Wu, Z. Electrochemical membrane bioreactors for sustainable wastewater treatment: Principles and challenges. Curr. Environ. Eng. 2015, 2, 38–49. [Google Scholar] [CrossRef]
  12. Żur, J.; Piński, A.; Marchlewicz, A.; Hupert-Kocurek, K.; Wojcieszyńska, D.; Guzik, U. Organic micropollutants paracetamol and ibuprofen—Toxicity, biodegradation, and genetic background of their utilization by bacteria. Environ. Sci. Pollut. Res. 2018, 25, 21498–21524. [Google Scholar] [CrossRef] [PubMed]
  13. Andreozzi, R.; Caprio, V.; Insola, A.; Marotta, R. Advanced oxidation processes (AOP) for water purification and recovery. Catal. Today 1999, 53, 51–59. [Google Scholar] [CrossRef]
  14. Ali, I.; Gupta, V.K. Advances in water treatment by adsorption technology. Nat. Protoc. 2007, 1, 2661–2667. [Google Scholar] [CrossRef] [PubMed]
  15. Singh, N.B.; Nagpal, G.; Agrawal, S. Rachna Water purification by using Adsorbents: A Review. Environ. Technol. Innov. 2018, 11, 187–240. [Google Scholar] [CrossRef]
  16. Uddin, M.K. A review on the adsorption of heavy metals by clay minerals, with special focus on the past decade. Chem. Eng. J. 2017, 308, 438–462. [Google Scholar] [CrossRef]
  17. Wang, S.; Peng, Y. Natural zeolites as effective adsorbents in water and wastewater treatment. Chem. Eng. J. 2010, 156, 11–24. [Google Scholar] [CrossRef]
  18. Khan, N.A.; Hasan, Z.; Jhung, S.H. Adsorptive removal of hazardous materials using metal-organic frameworks (MOFs): A review. J. Hazard. Mater. 2013, 244–245, 444–456. [Google Scholar] [CrossRef] [PubMed]
  19. Jeirani, Z.; Niu, C.H.; Soltan, J. Adsorption of emerging pollutants on activated carbon. Rev. Chem. Eng. 2017, 33, 491–522. [Google Scholar] [CrossRef]
  20. Gwenzi, W.; Chaukura, N.; Noubactep, C.; Mukome, F.N.D. Biochar-based water treatment systems as a potential low-cost and sustainable technology for clean water provision. J. Environ. Manag. 2017, 197, 732–749. [Google Scholar] [CrossRef] [PubMed]
  21. Freyria, F.; Geobaldo, F.; Bonelli, B.; Freyria, F.S.; Geobaldo, F.; Bonelli, B. Nanomaterials for the Abatement of Pharmaceuticals and Personal Care Products from Wastewater. Appl. Sci. 2018, 8, 170. [Google Scholar] [CrossRef]
  22. Krauskopf, L.G. Plasticizer structure/performance relationships. J. Vinyl Addit. Technol. 1993, 15, 140–147. [Google Scholar] [CrossRef]
  23. Rabaçal, M.; Ferreira, A.F.; Silva, C.A.M.; Costa, M. Biorefineries; Rabaçal, M., Ferreira, A.F., Silva, C.A.M., Costa, M., Eds.; Lecture Notes in Energy; Springer: Cham, Switzerland, 2017; Volume 57. [Google Scholar]
  24. Bhaskar, T.; Pandey, A.; Mohan, S.V.; Lee, D.J.; Khanal, S.K. Waste Biorefinery: Potential and Perspectives; Elsevier: Amsterdam, The Netherlands, 2018. [Google Scholar]
  25. Shahbazali, E. Biorefinery: From biomass to chemicals and fuels. Green Process. Synth. 2013, 2, 87–88. [Google Scholar] [CrossRef]
  26. Demirbaş, A. Biomass resource facilities and biomass conversion processing for fuels and chemicals. Energy Convers. Manag. 2001, 42, 1357–1378. [Google Scholar] [CrossRef]
  27. De Wit, M.; Faaij, A. European biomass resource potential and costs. Biomass Bioenergy 2010, 34, 188–202. [Google Scholar] [CrossRef]
  28. Blanco-Canqui, H. Growing Dedicated Energy Crops on Marginal Lands and Ecosystem Services. Soil Sci. Soc. Am. J. 2016, 80, 845–858. [Google Scholar] [CrossRef]
  29. Glithero, N.J.; Wilson, P.; Ramsden, S.J. Optimal combinable and dedicated energy crop scenarios for marginal land. Appl. Energy 2015, 147, 82–91. [Google Scholar] [CrossRef] [Green Version]
  30. Dessbesell, L.; Xu, C.; Pulkki, R.; Leitch, M.; Mahmood, N. Forest biomass supply chain optimization for a biorefinery aiming to produce high-value bio-based materials and chemicals from lignin and forestry residues: A review of literature. Can. J. For. Res. 2017, 47, 277–288. [Google Scholar] [CrossRef]
  31. Gregg, J.S.; Smith, S.J. Global and regional potential for bioenergy from agricultural and forestry residue biomass. Mitig. Adapt. Strateg. Glob. Chang. 2010, 15, 241–262. [Google Scholar] [CrossRef]
  32. Scarlat, N.; Martinov, M.; Dallemand, J.-F. Assessment of the availability of agricultural crop residues in the European Union: Potential and limitations for bioenergy use. Waste Manag. 2010, 30, 1889–1897. [Google Scholar] [CrossRef] [PubMed]
  33. Monforti, F.; Bódis, K.; Scarlat, N.; Dallemand, J.-F. The possible contribution of agricultural crop residues to renewable energy targets in Europe: A spatially explicit study. Renew. Sustain. Energy Rev. 2013, 19, 666–677. [Google Scholar] [CrossRef]
  34. Ward, A.J.; Lewis, D.M.; Green, F.B. Anaerobic digestion of algae biomass: A review. Algal Res. 2014, 5, 204–214. [Google Scholar] [CrossRef]
  35. Bhatnagar, A.; Chinnasamy, S.; Singh, M.; Das, K.C. Renewable biomass production by mixotrophic algae in the presence of various carbon sources and wastewaters. Appl. Energy 2011, 88, 3425–3431. [Google Scholar] [CrossRef]
  36. Cheng, H.; Hu, Y. Municipal solid waste (MSW) as a renewable source of energy: Current and future practices in China. Bioresour. Technol. 2010, 101, 3816–3824. [Google Scholar] [CrossRef] [PubMed]
  37. Albert, J.; Jess, A.; Kern, C.; Pöhlmann, F.; Glowienka, K.; Wasserscheid, P. Formic Acid-Based Fischer–Tropsch Synthesis for Green Fuel Production from Wet Waste Biomass and Renewable Excess Energy. ACS Sustain. Chem. Eng. 2016, 4, 5078–5086. [Google Scholar] [CrossRef]
  38. Albert, J.; Wasserscheid, P. Expanding the scope of biogenic substrates for the selective production of formic acid from water-insoluble and wet waste biomass. Green Chem. 2015, 17, 5164–5171. [Google Scholar] [CrossRef] [Green Version]
  39. Karakaş, C.; Özçimen, D.; İnan, B. Potential use of olive stone biochar as a hydroponic growing medium. J. Anal. Appl. Pyrolysis 2017, 125, 17–23. [Google Scholar] [CrossRef]
  40. Kula, I.; Uğurlu, M.; Karaoğlu, H.; Çelik, A. Adsorption of Cd(II) ions from aqueous solutions using activated carbon prepared from olive stone by ZnCl2 activation. Bioresour. Technol. 2008, 99, 492–501. [Google Scholar] [CrossRef] [PubMed]
  41. Ubago-Pérez, R.; Carrasco-Marín, F.; Fairén-Jiménez, D.; Moreno-Castilla, C. Granular and monolithic activated carbons from KOH-activation of olive stones. Microporous Mesoporous Mater. 2006, 92, 64–70. [Google Scholar] [CrossRef]
  42. Chen, Y.; Zhu, Y.; Wang, Z.; Li, Y.; Wang, L.; Ding, L.; Gao, X.; Ma, Y.; Guo, Y. Application studies of activated carbon derived from rice husks produced by chemical-thermal process—A review. Adv. Colloid Interface Sci. 2011, 163, 39–52. [Google Scholar] [CrossRef] [PubMed]
  43. Lin, L.; Zhai, S.-R.; Xiao, Z.-Y.; Song, Y.; An, Q.-D.; Song, X.-W. Dye adsorption of mesoporous activated carbons produced from NaOH-pretreated rice husks. Bioresour. Technol. 2013, 136, 437–443. [Google Scholar] [CrossRef] [PubMed]
  44. Tsai, W.-T.; Jiang, T.-J. Mesoporous activated carbon produced from coconut shell using a single-step physical activation process. Biomass Convers. Biorefinery 2018, 8, 711–718. [Google Scholar] [CrossRef]
  45. Wu, W.; Li, J.; Lan, T.; Müller, K.; Niazi, N.K.; Chen, X.; Xu, S.; Zheng, L.; Chu, Y.; Li, J.; et al. Unraveling sorption of lead in aqueous solutions by chemically modified biochar derived from coconut fiber: A microscopic and spectroscopic investigation. Sci. Total Environ. 2017, 576, 766–774. [Google Scholar] [CrossRef] [PubMed]
  46. Jain, A.; Balasubramanian, R.; Srinivasan, M.P. Production of high surface area mesoporous activated carbons from waste biomass using hydrogen peroxide-mediated hydrothermal treatment for adsorption applications. Chem. Eng. J. 2015, 273, 622–629. [Google Scholar] [CrossRef]
  47. Tan, I.A.W.; Ahmad, A.L.; Hameed, B.H. Adsorption of basic dye on high-surface-area activated carbon prepared from coconut husk: Equilibrium, kinetic and thermodynamic studies. J. Hazard. Mater. 2008, 154, 337–346. [Google Scholar] [CrossRef] [PubMed]
  48. Yang, E.; Yao, C.; Liu, Y.; Zhang, C.; Jia, L.; Li, D.; Fu, Z.; Sun, D.; Robert Kirk, S.; Yin, D. Bamboo-derived porous biochar for efficient adsorption removal of dibenzothiophene from model fuel. Fuel 2018, 211, 121–129. [Google Scholar] [CrossRef]
  49. Hameed, B.H.; Din, A.T.M.; Ahmad, A.L. Adsorption of methylene blue onto bamboo-based activated carbon: Kinetics and equilibrium studies. J. Hazard. Mater. 2007, 141, 819–825. [Google Scholar] [CrossRef] [PubMed]
  50. Bedia, J.; Rodríguez-Mirasol, J.; Cordero, T. Water vapour adsorption on lignin-based activated carbons. J. Chem. Technol. Biotechnol. 2007, 82, 548–557. [Google Scholar] [CrossRef]
  51. Cordero, T.; Rodríguez-Mirasol, J.; Bedia, J.; Rodríguez, J.J. Preparation of carbon materials from lignin. Opt. Pura y Apl. 2007, 40, 161–168. [Google Scholar]
  52. Rodríguez-Mirasol, J.; Bedia, J.; Cordero, T.; Rodríguez, J. Influence of water vapor on the adsorption of VOCs on lignin-based activated carbons. Sep. Sci. Technol. 2005, 40, 3113–3135. [Google Scholar] [CrossRef]
  53. Gonzalez-Serrano, E.; Cordero, T.; Rodriguez-Mirasol, J.; Cotoruelo, L.; Rodriguez, J.J. Removal of water pollutants with activated carbons prepared from H3PO4 activation of lignin from kraft black liquors. Water Res. 2004, 38, 3043–3050. [Google Scholar] [CrossRef] [PubMed]
  54. Yamashita, A.; Yoshida, T.; Hidaka, A.; Oshima, T.; Baba, Y. Preparation of activated carbons with high specific surface areas using lignin and crab shells, and their use in methane adsorption. Carbon 2015, 93, 1080. [Google Scholar] [CrossRef]
  55. Bedia, J.; Belver, C.; Ponce, S.; Rodriguez, J.J.; Rodriguez, J.J. Adsorption of antipyrine by activated carbons from FeCl3-activation of Tara gum. Chem. Eng. J. 2018, 333, 58–65. [Google Scholar] [CrossRef]
  56. Kazmierczak-Razna, J.; Nowicki, P.; Pietrzak, R. Coniferous Wood Sawdust-based Activated Carbons as Adsorbents Obtained with the Use of Microwave Radiation. J. Wood Chem. Technol. 2018, 38, 286–299. [Google Scholar] [CrossRef]
  57. Mohan, D.; Pittman, C.U.; Bricka, M.; Smith, F.; Yancey, B.; Mohammad, J.; Steele, P.H.; Alexandre-Franco, M.F.; Gómez-Serrano, V.; Gong, H. Sorption of arsenic, cadmium, and lead by chars produced from fast pyrolysis of wood and bark during bio-oil production. J. Colloid Interface Sci. 2007, 310, 57–73. [Google Scholar] [CrossRef] [PubMed]
  58. Ao, W.; Fu, J.; Mao, X.; Kang, Q.; Ran, C.; Liu, Y.; Zhang, H.; Gao, Z.; Li, J.; Liu, G.; et al. Microwave assisted preparation of activated carbon from biomass: A review. Renew. Sustain. Energy Rev. 2018, 92, 958–979. [Google Scholar] [CrossRef]
  59. Yang, K.; Peng, J.; Srinivasakannan, C.; Zhang, L.; Xia, H.; Duan, X. Preparation of high surface area activated carbon from coconut shells using microwave heating. Bioresour. Technol. 2010, 101, 6163–6169. [Google Scholar] [CrossRef] [PubMed]
  60. Yuen, F.K.; Hameed, B.H. Recent developments in the preparation and regeneration of activated carbons by microwaves. Adv. Colloid Interface Sci. 2009, 149, 19–27. [Google Scholar] [CrossRef] [PubMed]
  61. Ahmed, M.J. Application of agricultural based activated carbons by microwave and conventional activations for basic dye adsorption: Review. J. Environ. Chem. Eng. 2016, 4, 89–99. [Google Scholar] [CrossRef]
  62. Hu, B.; Wang, K.; Wu, L.; Yu, S.-H.; Antonietti, M.; Titirici, M.-M. Engineering Carbon Materials from the Hydrothermal Carbonization Process of Biomass. Adv. Mater. 2010, 22, 813–828. [Google Scholar] [CrossRef] [PubMed]
  63. Sevilla, M.; Fuertes, A.B. The production of carbon materials by hydrothermal carbonization of cellulose. Carbon 2009, 47, 2281–2289. [Google Scholar] [CrossRef] [Green Version]
  64. Lucian, M.; Volpe, M.; Gao, L.; Piro, G.; Goldfarb, J.L.; Fiori, L. Impact of hydrothermal carbonization conditions on the formation of hydrochars and secondary chars from the organic fraction of municipal solid waste. Fuel 2018, 233, 257–268. [Google Scholar] [CrossRef]
  65. Nguyen, T.T.N.; Xu, C.-Y.; Tahmasbian, I.; Che, R.; Xu, Z.; Zhou, X.; Wallace, H.M.; Bai, S.H. Effects of biochar on soil available inorganic nitrogen: A review and meta-analysis. Geoderma 2017, 288, 79–96. [Google Scholar] [CrossRef]
  66. Liu, W.-J.; Jiang, H.; Yu, H.-Q. Development of Biochar-Based Functional Materials: Toward a Sustainable Platform Carbon Material. Chem. Rev. 2015, 115, 12251–12285. [Google Scholar] [CrossRef] [PubMed]
  67. Tan, X.; Liu, Y.; Zeng, G.; Wang, X.; Hu, X.; Gu, Y.; Yang, Z. Application of biochar for the removal of pollutants from aqueous solutions. Chemosphere 2015, 125, 70–85. [Google Scholar] [CrossRef] [PubMed]
  68. Chen, Y.; Zhang, X.; Chen, W.; Yang, H.; Chen, H. The structure evolution of biochar from biomass pyrolysis and its correlation with gas pollutant adsorption performance. Bioresour. Technol. 2017, 246, 101–109. [Google Scholar] [CrossRef] [PubMed]
  69. Jimenez-Cordero, D.; Heras, F.; Alonso-Morales, N.; Gilarranz, M.A.; Rodriguez, J.J. Porous structure and morphology of granular chars from flash and conventional pyrolysis of grape seeds. Biomass Bioenergy 2013, 54, 123–132. [Google Scholar] [CrossRef]
  70. Wafiq, A.; Reichel, D.; Hanafy, M. Pressure influence on pyrolysis product properties of raw and torrefied Miscanthus: Role of particle structure. Fuel 2016, 179, 156–167. [Google Scholar] [CrossRef]
  71. Cetin, E.; Moghtaderi, B. Effect of pyrolysis pressure and heating rate on radiata pine char structure and apparent gasification reactivity. Fuel 2005, 84, 1328–1334. [Google Scholar] [CrossRef]
  72. Fu, P.; Hu, S.; Xiang, J.; Sun, L.; Li, P.; Zhang, J.; Zheng, C. Pyrolysis of Maize Stalk on the Characterization of Chars Formed under Different Devolatilization Conditions. Energy Fuels 2009, 23, 4605–4611. [Google Scholar] [CrossRef]
  73. Burhenne, L.; Damiani, M.; Aicher, T. Effect of feedstock water content and pyrolysis temperature on the structure and reactivity of spruce wood char produced in fixed bed pyrolysis. Fuel 2013, 107, 836–847. [Google Scholar] [CrossRef]
  74. Chen, Y.; Yang, H.; Wang, X.; Zhang, S.; Chen, H. Biomass-based pyrolytic polygeneration system on cotton stalk pyrolysis: Influence of temperature. Bioresour. Technol. 2012, 107, 411–418. [Google Scholar] [CrossRef] [PubMed]
  75. Kim, K.H.; Kim, J.-Y.; Cho, T.-S.; Choi, J.W. Influence of pyrolysis temperature on physicochemical properties of biochar obtained from the fast pyrolysis of pitch pine (Pinus rigida). Bioresour. Technol. 2012, 118, 158–162. [Google Scholar] [CrossRef] [PubMed]
  76. Xin, S.; Yang, H.; Chen, Y.; Yang, M.; Chen, L.; Wang, X.; Chen, H. Chemical structure evolution of char during the pyrolysis of cellulose. J. Anal. Appl. Pyrolysis 2015, 116, 263–271. [Google Scholar] [CrossRef]
  77. Liu, Z.; Quek, A.; Kent Hoekman, S.; Balasubramanian, R. Production of solid biochar fuel from waste biomass by hydrothermal carbonization. Fuel 2013, 103, 943–949. [Google Scholar] [CrossRef]
  78. Ahmad, M.; Rajapaksha, A.U.; Lim, J.E.; Zhang, M.; Bolan, N.; Mohan, D.; Vithanage, M.; Lee, S.S.; Ok, Y.S. Biochar as a sorbent for contaminant management in soil and water: A review. Chemosphere 2014, 99, 19–33. [Google Scholar] [CrossRef] [PubMed]
  79. Jain, A.; Balasubramanian, R.; Srinivasan, M.P. Hydrothermal conversion of biomass waste to activated carbon with high porosity: A review. Chem. Eng. J. 2016, 283, 789–805. [Google Scholar] [CrossRef]
  80. Marsh, H.; Rodríguez-Reinoso, F. Activated Carbon; Elsevier: Amsterdam, The Netherlands, 2006. [Google Scholar]
  81. Rodríguez-Reinoso, F.; Molina-Sabio, M. Activated carbons from lignocellulosic materials by chemical and/or physical activation: An overview. Carbon 1992, 30, 1111–1118. [Google Scholar] [CrossRef]
  82. Moreno-Castilla, C.; Carrasco-Marı́n, F.; López-Ramón, M.V.; Alvarez-Merino, M.A. Chemical and physical activation of olive-mill waste water to produce activated carbons. Carbon 2001, 39, 1415–1420. [Google Scholar] [CrossRef]
  83. Yang, T.; Lua, A.C. Characteristics of activated carbons prepared from pistachio-nut shells by physical activation. J. Colloid Interface Sci. 2003, 267, 408–417. [Google Scholar] [CrossRef]
  84. Bouchelta, C.; Medjram, M.S.; Bertrand, O.; Bellat, J.-P. Preparation and characterization of activated carbon from date stones by physical activation with steam. J. Anal. Appl. Pyrolysis 2008, 82, 70–77. [Google Scholar] [CrossRef]
  85. Bansal, R.C.; Donnet, J.-B.; Stoeckli, F. Active Carbon; M. Dekker: New York, NY, USA, 1988. [Google Scholar]
  86. Gergova, K.; Galushko, A.; Petrov, N.; Minkova, V. Investigation of the porous structure of activated carbons prepared by pyrolysis of agricultural by-products in a stream of water vapor. Carbon 1992, 30, 721–727. [Google Scholar] [CrossRef]
  87. Ahmadpour, A.; Do, D.D. The preparation of activated carbon from macadamia nutshell by chemical activation. Carbon 1997, 35, 1723–1732. [Google Scholar] [CrossRef]
  88. Hayashi, J.; Kazehaya, A.; Muroyama, K.; Watkinson, A.P. Preparation of activated carbon from lignin by chemical activation. Carbon 2000, 38, 1873–1878. [Google Scholar] [CrossRef]
  89. Rosas, J.M.; Bedia, J.; Rodríguez-Mirasol, J.; Cordero, T. HEMP-derived activated carbon fibers by chemical activation with phosphoric acid. Fuel 2009, 88, 19–26. [Google Scholar] [CrossRef]
  90. Rosas, J.M.; Bedia, J.; Rodríguez-Mirasol, J.; Cordero, T. Preparation of Hemp-Derived Activated Carbon Monoliths. Adsorption of Water Vapor. Ind. Eng. Chem. Res. 2008, 47, 1288–1296. [Google Scholar] [CrossRef]
  91. Girgis, B.S.; El-Hendawy, A.-N.A. Porosity development in activated carbons obtained from date pits under chemical activation with phosphoric acid. Microporous Mesoporous Mater. 2002, 52, 105–117. [Google Scholar] [CrossRef]
  92. Martin, M.J.; Artola, A.; Balaguer, M.D.; Rigola, M. Activated carbons developed from surplus sewage sludge for the removal of dyes from dilute aqueous solutions. Chem. Eng. J. 2003, 94, 231–239. [Google Scholar] [CrossRef]
  93. Hasar, H. Adsorption of nickel(II) from aqueous solution onto activated carbon prepared from almond husk. J. Hazard. Mater. 2003, 97, 49–57. [Google Scholar] [CrossRef]
  94. Tsai, W.; Chang, C.; Lin, M.; Chien, S.; Sun, H.; Hsieh, M. Adsorption of acid dye onto activated carbons prepared from agricultural waste bagasse by ZnCl2 activation. Chemosphere 2001, 45, 51–58. [Google Scholar] [CrossRef]
  95. Deng, H.; Yang, L.; Tao, G.; Dai, J. Preparation and characterization of activated carbon from cotton stalk by microwave assisted chemical activation—Application in methylene blue adsorption from aqueous solution. J. Hazard. Mater. 2009, 166, 1514–1521. [Google Scholar] [CrossRef] [PubMed]
  96. Gonzalez-Serrano, E.; Cordero, T.; Rodríguez-Mirasol, J.; Rodríguez, J.J. Development of Porosity upon Chemical Activation of Kraft Lignin with ZnCl2. Ind. Eng. Chem. Res. 1997, 36, 4832–4838. [Google Scholar] [CrossRef]
  97. Bedia, J.; Monsalvo, V.M.; Rodriguez, J.J.; Mohedano, A.F. Iron catalysts by chemical activation of sewage sludge with FeCl3 for CWPO. Chem. Eng. J. 2017, 318, 224–230. [Google Scholar] [CrossRef]
  98. Mohedano, A.F.; Monsalvo, V.M.; Bedia, J.; Lopez, J.; Rodriguez, J.J. Highly stable iron catalysts from sewage sludge for CWPO. J. Environ. Chem. Eng. 2014, 2, 2359–2364. [Google Scholar] [CrossRef]
  99. Zazo, J.A.; Bedia, J.; Fierro, C.M.; Pliego, G.; Casas, J.A.; Rodriguez, J.J. Highly stable Fe on activated carbon catalysts for CWPO upon FeCl3 activation of lignin from black liquors. Catal. Today 2012, 187, 115–121. [Google Scholar] [CrossRef]
  100. Rufford, T.E.; Hulicova-Jurcakova, D.; Zhu, Z.; Lu, G.Q. A comparative study of chemical treatment by FeCl3, MgCl2, and ZnCl2 on microstructure, surface chemistry, and double-layercapacitance of carbons from waste biomass. J. Mater. Res. 2010, 25, 1451–1459. [Google Scholar] [CrossRef]
  101. Fu, K.; Yue, Q.; Gao, B.; Sun, Y.; Wang, Y.; Li, Q.; Zhao, P.; Chen, S. Physicochemical and adsorptive properties of activated carbons from Arundo donax Linn utilizing different iron salts as activating agents. J. Taiwan Inst. Chem. Eng. 2014, 45, 3007–3015. [Google Scholar] [CrossRef]
  102. Lillo-Ródenas, M.; Cazorla-Amorós, D.; Linares-Solano, A. Understanding chemical reactions between carbons and NaOH and KOH. Carbon 2003, 41, 267–275. [Google Scholar] [CrossRef]
  103. Lillo-Ródenas, M.A.; Lozano-Castelló, D.; Cazorla-Amorós, D.; Linares-Solano, A. Preparation of activated carbons from Spanish anthracite—II. Activation by NaOH. Carbon 2001, 39, 751–759. [Google Scholar] [CrossRef]
  104. Martins, A.C.; Pezoti, O.; Cazetta, A.L.; Bedin, K.C.; Yamazaki, D.A.S.; Bandoch, G.F.G.; Asefa, T.; Visentainer, J.V.; Almeida, V.C. Removal of tetracycline by NaOH-activated carbon produced from macadamia nut shells: Kinetic and equilibrium studies. Chem. Eng. J. 2015, 260, 291–299. [Google Scholar] [CrossRef]
  105. Jang, H.M.; Yoo, S.; Choi, Y.-K.; Park, S.; Kan, E. Adsorption isotherm, kinetic modeling and mechanism of tetracycline on Pinus taeda-derived activated biochar. Bioresour. Technol. 2018, 259, 24–31. [Google Scholar] [CrossRef] [PubMed]
  106. Lozano-Castelló, D.; Lillo-Ródenas, M.A.; Cazorla-Amorós, D.; Linares-Solano, A. Preparation of activated carbons from Spanish anthracite—I. Activation by KOH. Carbon 2001, 39, 741–749. [Google Scholar] [CrossRef]
  107. Ahmed, M.J.; Theydan, S.K. Microporous activated carbon from Siris seed pods by microwave-induced KOH activation for metronidazole adsorption. J. Anal. Appl. Pyrolysis 2013, 99, 101–109. [Google Scholar] [CrossRef]
  108. Salman, J.M.; Hameed, B.H. Effect of preparation conditions of oil palm fronds activated carbon on adsorption of Bentazon from aqueous solutions. J. Hazard. Mater. 2010, 175, 133–137. [Google Scholar] [CrossRef] [PubMed]
  109. Fernandez-Ruiz, C.; Bedia, J.; Bonal, P.; Rodriguez, J.J.; Gómez-Sainero, L.M. Chloroform conversion into ethane and propane by catalytic hydrodechlorination with Pd supported on activated carbons from lignin. Catal. Sci. Technol. 2018, 8, 3926–3935. [Google Scholar] [CrossRef]
  110. Tascón, J.M.D. Novel Carbon Adsorbents, 1st ed.; Elsevier: Amsterdam, The Netherlands, 2012. [Google Scholar]
  111. Rodríguez-Reinoso, F.; Molina-Sabio, M. Textural and chemical characterization of microporous carbons. Adv. Colloid Interface Sci. 1998, 76–77, 271–294. [Google Scholar] [CrossRef]
  112. Patrick, J.W. Porosity in Carbons: Characterization and Applications; Edward Arnold: London, UK, 1995. [Google Scholar]
  113. Sing, K.S.W. Reporting physisorption data for gas/solid systems with special reference to the determination of surface area and porosity (Recommendations 1984). Pure Appl. Chem. 1985, 57, 603–619. [Google Scholar] [CrossRef] [Green Version]
  114. Thommes, M.; Kaneko, K.; Neimark, A.V.; Olivier, J.P.; Rodriguez-Reinoso, F.; Rouquerol, J.; Sing, K.S.W. Physisorption of gases, with special reference to the evaluation of surface area and pore size distribution (IUPAC Technical Report). Pure Appl. Chem. 2015, 87, 1051–1069. [Google Scholar] [CrossRef] [Green Version]
  115. Brunauer, S.; Emmett, P.H.; Teller, E. Adsorption of Gases in Multimolecular Layers. J. Am. Chem. Soc. 1938, 60, 309–319. [Google Scholar] [CrossRef]
  116. Rouquerol, J.; Llewellyn, P.; Rouquerol, F. Is the bet equation applicable to microporous adsorbents? In Stud. Surf. Sci. Catal. 2007, 160, 49–56. [Google Scholar]
  117. Kaneko, K.; Ishii, C. Superhigh surface area determination of microporous solids. Colloids Surf. 1992, 67, 203–212. [Google Scholar] [CrossRef]
  118. Lippens, B.C.; de Boer, J.H. Studies on pore systems in catalysts: V. The t method. J. Catal. 1965, 4, 319–323. [Google Scholar] [CrossRef]
  119. Gregg, S.J.; Sing, K.S.W. Adsorption, Surface Area, and Porosity, 2nd ed.; Academic Press: London, UK; New York, NY, USA, 1982. [Google Scholar]
  120. Barrett, E.P.; Joyner, L.G.; Halenda, P.P. The Determination of Pore Volume and Area Distributions in Porous Substances. I. Computations from Nitrogen Isotherms. J. Am. Chem. Soc. 1951, 73, 373–380. [Google Scholar] [CrossRef]
  121. Horváth, G.; Kawazoe, K. Method for the calculation of effective pore size distribution in molecular sieve carbon. J. Chem. Eng. Jpn. 1983, 16, 470–475. [Google Scholar] [CrossRef]
  122. Lozano-Castelló, D.; Cazorla-Amorós, D.; Linares-Solano, A. Usefulness of CO2 adsorption at 273 K for the characterization of porous carbons. In Carbon; Pergamon: Oxford, UK, 2004; Volume 42, pp. 1231–1236. [Google Scholar]
  123. Gaffney, J.S.; Marley, N.A.; Jones, D.E. Fourier Transform Infrared (FTIR) Spectroscopy. In Characterization of Materials; John Wiley & Sons, Inc.: Hoboken, NJ, USA, 2012. [Google Scholar]
  124. Barrios, V.A.E.; Méndez, J.R.R.; Aguilar, N.V.P.; Espinosa, G.A.; Rodríguez, J.L.D. Materials. In Infrared Spectroscopy—Materials Science, Engineering and Technology; InTech: Vienna, Austria, 2012. [Google Scholar]
  125. Fanning, P.E.; Vannice, M.A. A DRIFTS study of the formation of surface groups on carbon by oxidation. Carbon 1993, 31, 721–730. [Google Scholar] [CrossRef]
  126. Figueiredo, J.L.; Pereira, M.F.R.; Freitas, M.M.A.; Órfão, J.J.M. Modification of the surface chemistry of activated carbons. Carbon 1999, 37, 1379–1389. [Google Scholar] [CrossRef]
  127. Biniak, S.; Szymański, G.; Siedlewski, J.; Świątkowski, A. The characterization of activated carbons with oxygen and nitrogen surface groups. Carbon 1997, 35, 1799–1810. [Google Scholar] [CrossRef]
  128. Moreno-Castilla, C.; López-Ramón, M.V.; Carrasco-Marín, F. Changes in surface chemistry of activated carbons by wet oxidation. Carbon 2000, 38, 1995–2001. [Google Scholar] [CrossRef]
  129. Yang, P.; Zhang, J.; Liu, D.; Liu, M.; Zhang, H.; Zhao, P.; Zhang, C. Facile synthesis of porous nitrogen-doped carbon for aerobic oxidation of amines to imines. Microporous Mesoporous Mater. 2018, 266, 198–203. [Google Scholar] [CrossRef]
  130. Szymański, G.S.; Karpiński, Z.; Biniak, S.; Świa̧tkowski, A. The effect of the gradual thermal decomposition of surface oxygen species on the chemical and catalytic properties of oxidized activated carbon. Carbon 2002, 40, 2627–2639. [Google Scholar] [CrossRef]
  131. Haydar, S.; Moreno-Castilla, C.; Ferro-Garcı́a, M.A.; Carrasco-Marı́n, F.; Rivera-Utrilla, J.; Perrard, A.; Joly, J.P. Regularities in the temperature-programmed desorption spectra of CO2 and CO from activated carbons. Carbon 2000, 38, 1297–1308. [Google Scholar] [CrossRef]
  132. Boehm, H.P. Some aspects of the surface chemistry of carbon blacks and other carbons. Carbon 1994, 32, 759–769. [Google Scholar] [CrossRef]
  133. Schönherr, J.; Buchheim, J.; Scholz, P.; Adelhelm, P.; Schönherr, J.; Buchheim, J.R.; Scholz, P.; Adelhelm, P. Boehm Titration Revisited (Part I): Practical Aspects for Achieving a High Precision in Quantifying Oxygen-Containing Surface Groups on Carbon Materials. Carbon 2018, 4, 21. [Google Scholar] [CrossRef]
  134. Rivera-Utrilla, J.; Bautista-Toledo, I.; Ferro-García, M.A.; Moreno-Castilla, C. Activated carbon surface modifications by adsorption of bacteria and their effect on aqueous lead adsorption. J. Chem. Technol. Biotechnol. 2001, 76, 1209–1215. [Google Scholar] [CrossRef] [Green Version]
  135. Faria, P.C.; Órfão, J.J.; Pereira, M.F. Adsorption of anionic and cationic dyes on activated carbons with different surface chemistries. Water Res. 2004, 38, 2043–2052. [Google Scholar] [CrossRef] [PubMed]
  136. Worch, E. Adsorption Technology in Water Treatment; De Gruyter: Berlin, Germany; Boston, MA, USA, 2012. [Google Scholar]
  137. Langmuir, I. The adsorption of gases on plane surfaces of glass, mica and platinum. J. Am. Chem. Soc. 1918, 40, 1361–1403. [Google Scholar] [CrossRef]
  138. Freundlich, H. Über die Adsorption in Lösungen. Z. Phys. Chem. 1907, 57U, 385–470. [Google Scholar] [CrossRef]
  139. Dubinin, M.M.; Radushkevich, L.V. The Equation of the Characteristic Curve of Activated Charcoal. Proc. Acad. Sci. Phys. Chem. Sect. 1947, 55, 331–333. [Google Scholar]
  140. Sips, R. On the Structure of a Catalyst Surface. J. Chem. Phys. 1948, 16, 490–495. [Google Scholar] [CrossRef]
  141. Redlich, O.; Peterson, D.L. A Useful Adsorption Isotherm. J. Phys. Chem. 1959, 63, 1024–1024. [Google Scholar] [CrossRef]
  142. Toth, J. State Equations of the Solid-gas Interface Layers. Acta Chim. Acad. Sci. Hung. 1971, 69, 311–328. [Google Scholar]
  143. Dubinin, M.M.; Astakhov, V.A. Development of Ideas of Volume Filling of Micropores during Adsorption of Gases and Vapours by Microporous Adsorbents 2. General Fundamentals of Theory of Gas and Vapour Adsorption on Zeolites. Izv. Akad. Nauk. SSSR-Ser. Khim. 1971, 11. [Google Scholar]
  144. Adsorption Processes for Water Treatment and Purification; Bonilla-Petriciolet, A.; Mendoza-Castillo, D.I.; Reynel-Ávila, H.E. (Eds.) Springer: Cham, Switzerland, 2017. [Google Scholar]
  145. Leyva-Ramos, R.; Geankoplis, C.J. Model simulation and analysis of surface diffusion of liquids in porous solids. Chem. Eng. Sci. 1985, 40, 799–807. [Google Scholar] [CrossRef]
  146. Largitte, L.; Pasquier, R. A review of the kinetics adsorption models and their application to the adsorption of lead by an activated carbon. Chem. Eng. Res. Des. 2016, 109, 495–504. [Google Scholar] [CrossRef]
  147. Ho, Y.; McKay, G. Pseudo-second order model for sorption processes. Process Biochem. 1999, 34, 451–465. [Google Scholar] [CrossRef]
  148. Low, M.J.D. Kinetics of Chemisorption of Gases on Solids. Chem. Rev. 1960, 60, 267–312. [Google Scholar] [CrossRef]
  149. Eckenfelder, W.W.; William, W. Industrial Water Pollution Control; McGraw-Hill: New York, NY, USA, 2000. [Google Scholar]
  150. Noll, K.E.; Gounaris, V.; Hou, W. Adsorption Technology for Air and Water Pollution Control; Lewis Publishers: Boca Raton, FL, USA, 1992. [Google Scholar]
  151. Tan, K.L.; Hameed, B.H. Insight into the adsorption kinetics models for the removal of contaminants from aqueous solutions. J. Taiwan Inst. Chem. Eng. 2017, 74, 25–48. [Google Scholar] [CrossRef]
  152. Najafi Nobar, S.; Farooq, S. Experimental and modeling study of adsorption and diffusion of gases in Cu-BTC. Chem. Eng. Sci. 2012, 84, 801–813. [Google Scholar] [CrossRef]
  153. Chu, K. Improved fixed bed models for metal biosorption. Chem. Eng. J. 2004, 97, 233–239. [Google Scholar] [CrossRef]
  154. Bohart, G.S.; Adams, E.Q. Some aspects of the behavior of charcoal with respect to chlorine. J. Am. Chem. Soc. 1920, 42, 523–544. [Google Scholar] [CrossRef]
  155. Cooney, D.O. Adsorption Design for Wastewater Treatment; Lewis Publishers: Boca Raton, FL, USA, 1999. [Google Scholar]
  156. Thomas, H.C. Heterogeneous Ion Exchange in a Flowing System. J. Am. Chem. Soc. 1944, 66, 1664–1666. [Google Scholar] [CrossRef]
  157. Yoon, Y.H.; Nelson, J.H. Application of Gas Adsorption Kinetics I. A Theoretical Model for Respirator Cartridge Service Life. Am. Ind. Hyg. Assoc. J. 1984, 45, 509–516. [Google Scholar] [CrossRef] [PubMed]
  158. Wolborska, A. Adsorption on activated carbon of p-nitrophenol from aqueous solution. Water Res. 1989, 23, 85–91. [Google Scholar] [CrossRef]
  159. Hamdaoui, O. Removal of copper(II) from aqueous phase by Purolite C100-MB cation exchange resin in fixed bed columns: Modeling. J. Hazard. Mater. 2009, 161, 737–746. [Google Scholar] [CrossRef] [PubMed]
  160. Reguyal, F.; Sarmah, A.K. Adsorption of sulfamethoxazole by magnetic biochar: Effects of pH, ionic strength, natural organic matter and 17α-ethinylestradiol. Sci. Total Environ. 2018, 628–629, 722–730. [Google Scholar] [CrossRef] [PubMed]
  161. Zheng, H.; Wang, Z.; Zhao, J.; Herbert, S.; Xing, B. Sorption of antibiotic sulfamethoxazole varies with biochars produced at different temperatures. Environ. Pollut. 2013, 181, 60–67. [Google Scholar] [CrossRef] [PubMed]
  162. Xie, M.; Chen, W.; Xu, Z.; Zheng, S.; Zhu, D. Adsorption of sulfonamides to demineralized pine wood biochars prepared under different thermochemical conditions. Environ. Pollut. 2014, 186, 187–194. [Google Scholar] [CrossRef] [PubMed]
  163. Ahmed, M.B.; Zhou, J.L.; Ngo, H.H.; Guo, W.; Johir, M.A.H.; Sornalingam, K. Single and competitive sorption properties and mechanism of functionalized biochar for removing sulfonamide antibiotics from water. Chem. Eng. J. 2017, 311, 348–358. [Google Scholar] [CrossRef]
  164. Liu, P.; Liu, W.-J.; Jiang, H.; Chen, J.-J.; Li, W.-W.; Yu, H.-Q. Modification of bio-char derived from fast pyrolysis of biomass and its application in removal of tetracycline from aqueous solution. Bioresour. Technol. 2012, 121, 235–240. [Google Scholar] [CrossRef] [PubMed]
  165. Jing, X.-R.; Wang, Y.-Y.; Liu, W.-J.; Wang, Y.-K.; Jiang, H. Enhanced adsorption performance of tetracycline in aqueous solutions by methanol-modified biochar. Chem. Eng. J. 2014, 248, 168–174. [Google Scholar] [CrossRef]
  166. Chen, T.; Luo, L.; Deng, S.; Shi, G.; Zhang, S.; Zhang, Y.; Deng, O.; Wang, L.; Zhang, J.; Wei, L. Sorption of tetracycline on H3PO4 modified biochar derived from rice straw and swine manure. Bioresour. Technol. 2018, 267, 431–437. [Google Scholar] [CrossRef] [PubMed]
  167. Tang, L.; Yu, J.; Pang, Y.; Zeng, G.; Deng, Y.; Wang, J.; Ren, X.; Ye, S.; Peng, B.; Feng, H. Sustainable efficient adsorbent: Alkali-acid modified magnetic biochar derived from sewage sludge for aqueous organic contaminant removal. Chem. Eng. J. 2018, 336, 160–169. [Google Scholar] [CrossRef]
  168. Wang, X.; Liu, N.; Liu, Y.; Jiang, L.; Zeng, G.; Tan, X.; Liu, S.; Yin, Z.; Tian, S.; Li, J.; et al. Adsorption Removal of 17β-Estradiol from Water by Rice Straw-Derived Biochar with Special Attention to Pyrolysis Temperature and Background Chemistry. Int. J. Environ. Res. Public Health 2017, 14, 1213. [Google Scholar] [CrossRef] [PubMed]
  169. Dong, X.; He, L.; Hu, H.; Liu, N.; Gao, S.; Piao, Y. Removal of 17β-estradiol by using highly adsorptive magnetic biochar nanoparticles from aqueous solution. Chem. Eng. J. 2018, 352, 371–379. [Google Scholar] [CrossRef]
  170. Essandoh, M.; Kunwar, B.; Pittman, C.U.; Mohan, D.; Mlsna, T. Sorptive removal of salicylic acid and ibuprofen from aqueous solutions using pine wood fast pyrolysis biochar. Chem. Eng. J. 2015, 265, 219–227. [Google Scholar] [CrossRef]
  171. Salem, N.A.; Yakoot, S.M. Non-steroidal Anti-inflammatory Drug, Ibuprofen Adsorption Using Rice Straw Based Biochar. Int. J. Pharmacol. 2016, 12, 729–736. [Google Scholar] [CrossRef]
  172. Lonappan, L.; Rouissi, T.; Kaur Brar, S.; Verma, M.; Surampalli, R.Y. An insight into the adsorption of diclofenac on different biochars: Mechanisms, surface chemistry, and thermodynamics. Bioresour. Technol. 2018, 249, 386–394. [Google Scholar] [CrossRef] [PubMed]
  173. Tong, Y.; Mayer, B.K.; McNamara, P.J. Triclosan adsorption using wastewater biosolids-derived biochar. Environ. Sci. Water Res. Technol. 2016, 2, 761–768. [Google Scholar] [CrossRef]
  174. Mandal, A.; Singh, N.; Purakayastha, T.J. Characterization of pesticide sorption behaviour of slow pyrolysis biochars as low cost adsorbent for atrazine and imidacloprid removal. Sci. Total Environ. 2017, 577, 376–385. [Google Scholar] [CrossRef] [PubMed]
  175. Zhao, X.; Ouyang, W.; Hao, F.; Lin, C.; Wang, F.; Han, S.; Geng, X. Properties comparison of biochars from corn straw with different pretreatment and sorption behaviour of atrazine. Bioresour. Technol. 2013, 147, 338–344. [Google Scholar] [CrossRef] [PubMed]
  176. Zhang, P.; Sun, H.; Yu, L.; Sun, T. Adsorption and catalytic hydrolysis of carbaryl and atrazine on pig manure-derived biochars: Impact of structural properties of biochars. J. Hazard. Mater. 2013, 244–245, 217–224. [Google Scholar] [CrossRef] [PubMed]
  177. Liu, N.; Charrua, A.B.; Weng, C.-H.; Yuan, X.; Ding, F. Characterization of biochars derived from agriculture wastes and their adsorptive removal of atrazine from aqueous solution: A comparative study. Bioresour. Technol. 2015, 198, 55–62. [Google Scholar] [CrossRef] [PubMed]
  178. Jin, J.; Sun, K.; Wu, F.; Gao, B.; Wang, Z.; Kang, M.; Bai, Y.; Zhao, Y.; Liu, X.; Xing, B. Single-solute and bi-solute sorption of phenanthrene and dibutyl phthalate by plant- and manure-derived biochars. Sci. Total Environ. 2014, 473–474, 308–316. [Google Scholar] [CrossRef] [PubMed]
  179. Ghaffar, A.; Ghosh, S.; Li, F.; Dong, X.; Zhang, D.; Wu, M.; Li, H.; Pan, B. Effect of biochar aging on surface characteristics and adsorption behavior of dialkyl phthalates. Environ. Pollut. 2015, 206, 502–509. [Google Scholar] [CrossRef] [PubMed]
  180. Greiner, B.G.; Shimabuku, K.K.; Summers, R.S. Influence of biochar thermal regeneration on sulfamethoxazole and dissolved organic matter adsorption. Environ. Sci. Water Res. Technol. 2018, 4, 169–174. [Google Scholar] [CrossRef]
  181. Han, X.; Liang, C.; Li, T.; Wang, K.; Huang, H.; Yang, X. Simultaneous removal of cadmium and sulfamethoxazole from aqueous solution by rice straw biochar. J. Zhejiang Univ. Sci. B 2013, 14, 640–649. [Google Scholar] [CrossRef] [PubMed] [Green Version]
  182. Li, T.; Han, X.; Liang, C.; Shohag, M.J.I.; Yang, X. Sorption of sulphamethoxazole by the biochars derived from rice straw and alligator flag. Environ. Technol. 2015, 36, 245–253. [Google Scholar] [CrossRef] [PubMed]
  183. Wang, H.; Chu, Y.; Fang, C.; Huang, F.; Song, Y.; Xue, X. Sorption of tetracycline on biochar derived from rice straw under different temperatures. PLoS ONE 2017, 12, e0182776. [Google Scholar] [CrossRef] [PubMed]
  184. Fang, Q.; Chen, B.; Lin, Y.; Guan, Y. Aromatic and Hydrophobic Surfaces of Wood-derived Biochar Enhance Perchlorate Adsorption via Hydrogen Bonding to Oxygen-containing Organic Groups. Environ. Sci. Technol. 2014, 48, 279–288. [Google Scholar] [CrossRef] [PubMed]
  185. Ji, L.; Liu, F.; Xu, Z.; Zheng, S.; Zhu, D. Adsorption of Pharmaceutical Antibiotics on Template-Synthesized Ordered Micro- and Mesoporous Carbons. Environ. Sci. Technol. 2010, 44, 3116–3122. [Google Scholar] [CrossRef] [PubMed]
  186. Kimbell, L.K.; Tong, Y.; Mayer, B.K.; McNamara, P.J. Biosolids-Derived Biochar for Triclosan Removal from Wastewater. Environ. Eng. Sci. 2018, 35, 513–524. [Google Scholar] [CrossRef]
  187. Cao, X.; Harris, W. Properties of dairy-manure-derived biochar pertinent to its potential use in remediation. Bioresour. Technol. 2010, 101, 5222–5228. [Google Scholar] [CrossRef] [PubMed]
  188. Xiao, F.; Pignatello, J.J. π+-π Interactions between (hetero)aromatic amine cations and the graphitic surfaces of pyrogenic carbonaceous materials. Environ. Sci. Technol. 2015, 49, 906–914. [Google Scholar] [CrossRef] [PubMed]
  189. Cederlund, H.; Börjesson, E.; Lundberg, D.; Stenström, J. Adsorption of Pesticides with Different Chemical Properties to a Wood Biochar Treated with Heat and Iron. Water Air Soil Pollut. 2016, 227, 203. [Google Scholar] [CrossRef]
  190. Sun, K.; Jin, J.; Keiluweit, M.; Kleber, M.; Wang, Z.; Pan, Z.; Xing, B. Polar and aliphatic domains regulate sorption of phthalic acid esters (PAEs) to biochars. Bioresour. Technol. 2012, 118, 120–127. [Google Scholar] [CrossRef] [PubMed]
  191. Jonker, M.T.O.; Koelmans, A.A. Sorption of polycyclic aromatic hydrocarbons and polychlorinated biphenyls to soot and soot-like materials in the aqueous environment: Mechanistic considerations. Environ. Sci. Technol. 2002, 36, 3725–3734. [Google Scholar] [CrossRef] [PubMed]
  192. Jing, F.; Pan, M.; Chen, J. Kinetic and isothermal adsorption-desorption of PAEs on biochars: Effect of biomass feedstock, pyrolysis temperature, and mechanism implication of desorption hysteresis. Environ. Sci. Pollut. Res. 2018, 25, 11493–11504. [Google Scholar] [CrossRef] [PubMed]
  193. Huang, L.; Wang, M.; Shi, C.; Huang, J.; Zhang, B. Adsorption of tetracycline and ciprofloxacin on activated carbon prepared from lignin with H3PO4 activation. Desalin. Water Treat. 2014, 52, 2678–2687. [Google Scholar] [CrossRef]
  194. Marzbali, M.H.; Esmaieli, M.; Abolghasemi, H.; Marzbali, M.H. Tetracycline adsorption by H3PO4-activated carbon produced from apricot nut shells: A batch study. Process Saf. Environ. Prot. 2016, 102, 700–709. [Google Scholar] [CrossRef]
  195. Li, G.; Zhang, D.; Wang, M.; Huang, J.; Huang, L. Preparation of activated carbons from Iris tectorum employing ferric nitrate as dopant for removal of tetracycline from aqueous solutions. Ecotoxicol. Environ. Saf. 2013, 98, 273–282. [Google Scholar] [CrossRef] [PubMed]
  196. Sayğılı, H.; Güzel, F. Effective removal of tetracycline from aqueous solution using activated carbon prepared from tomato (Lycopersicon esculentum Mill.) industrial processing waste. Ecotoxicol. Environ. Saf. 2016, 131, 22–29. [Google Scholar] [CrossRef] [PubMed]
  197. Güzel, F.; Sayğılı, H. Adsorptive efficacy analysis of novel carbonaceous sorbent derived from grape industrial processing wastes towards tetracycline in aqueous solution. J. Taiwan Inst. Chem. Eng. 2016, 60, 236–240. [Google Scholar] [CrossRef]
  198. Takdastan, A.; Mahvi, A.H.; Lima, E.C.; Shirmardi, M.; Babaei, A.A.; Goudarzi, G.; Neisi, A.; Heidari Farsani, M.; Vosoughi, M. Preparation, characterization, and application of activated carbon from low-cost material for the adsorption of tetracycline antibiotic from aqueous solutions. Water Sci. Technol. 2016, 74, 2349–2363. [Google Scholar] [CrossRef] [PubMed]
  199. Fan, H.-T.; Shi, L.-Q.; Shen, H.; Chen, X.; Xie, K.-P. Equilibrium, isotherm, kinetic and thermodynamic studies for removal of tetracycline antibiotics by adsorption onto hazelnut shell derived activated carbons from aqueous media. RSC Adv. 2016, 6, 109983–109991. [Google Scholar] [CrossRef]
  200. Oliveira, G.; Calisto, V.; Santos, S.M.; Otero, M.; Esteves, V.I. Paper pulp-based adsorbents for the removal of pharmaceuticals from wastewater: A novel approach towards diversification. Sci. Total Environ. 2018, 631–632, 1018–1028. [Google Scholar] [CrossRef] [PubMed]
  201. Moura, F.C.C.; Rios, R.D.F.; Galvão, B.R.L. Emerging contaminants removal by granular activated carbon obtained from residual Macauba biomass. Environ. Sci. Pollut. Res. 2018, 25, 26482–26492. [Google Scholar] [CrossRef] [PubMed]
  202. To, M.-H.; Hadi, P.; Hui, C.-W.; Lin, C.S.K.; McKay, G. Mechanistic study of atenolol, acebutolol and carbamazepine adsorption on waste biomass derived activated carbon. J. Mol. Liq. 2017, 241, 386–398. [Google Scholar] [CrossRef]
  203. Baccar, R.; Sarrà, M.; Bouzid, J.; Feki, M.; Blánquez, P. Removal of pharmaceutical compounds by activated carbon prepared from agricultural by-product. Chem. Eng. J. 2012, 211–212, 310–317. [Google Scholar] [CrossRef]
  204. Chakraborty, P.; Banerjee, S.; Kumar, S.; Sadhukhan, S.; Halder, G. Elucidation of ibuprofen uptake capability of raw and steam activated biochar of Aegle marmelos shell: Isotherm, kinetics, thermodynamics and cost estimation. Process Saf. Environ. Prot. 2018, 118, 10–23. [Google Scholar] [CrossRef]
  205. Mestre, A.S.; Pires, J.; Nogueira, J.M.F.; Carvalho, A.P. Activated carbons for the adsorption of ibuprofen. Carbon 2007, 45, 1979–1988. [Google Scholar] [CrossRef]
  206. García-Mateos, F.J.; Ruiz-Rosas, R.; Marqués, M.D.; Cotoruelo, L.M.; Rodríguez-Mirasol, J.; Cordero, T. Removal of paracetamol on biomass-derived activated carbon: Modeling the fixed bed breakthrough curves using batch adsorption experiments. Chem. Eng. J. 2015, 279, 18–30. [Google Scholar] [CrossRef] [Green Version]
  207. Wong, S.; Lim, Y.; Ngadi, N.; Mat, R.; Hassan, O.; Inuwa, I.M.; Mohamed, N.B.; Low, J.H. Removal of acetaminophen by activated carbon synthesized from spent tea leaves: Equilibrium, kinetics and thermodynamics studies. Powder Technol. 2018, 338, 878–886. [Google Scholar] [CrossRef]
  208. Chen, D.; Xie, S.; Chen, C.; Quan, H.; Hua, L.; Luo, X.; Guo, L. Activated biochar derived from pomelo peel as a high-capacity sorbent for removal of carbamazepine from aqueous solution. RSC Adv. 2017, 7, 54969–54979. [Google Scholar] [CrossRef] [Green Version]
  209. Torrellas, S.Á.; García Lovera, R.; Escalona, N.; Sepúlveda, C.; Sotelo, J.L.; García, J. Chemical-activated carbons from peach stones for the adsorption of emerging contaminants in aqueous solutions. Chem. Eng. J. 2015, 279, 788–798. [Google Scholar] [CrossRef]
  210. Cunha, M.R.; Lima, E.C.; Cimirro, N.F.G.M.; Thue, P.S.; Dias, S.L.P.; Gelesky, M.A.; Dotto, G.L.; dos Reis, G.S.; Pavan, F.A. Conversion of Eragrostis plana Nees leaves to activated carbon by microwave-assisted pyrolysis for the removal of organic emerging contaminants from aqueous solutions. Environ. Sci. Pollut. Res. 2018, 25, 23315–23327. [Google Scholar] [CrossRef] [PubMed]
  211. Beltrame, K.K.; Cazetta, A.L.; de Souza, P.S.C.; Spessato, L.; Silva, T.L.; Almeida, V.C. Adsorption of caffeine on mesoporous activated carbon fibers prepared from pineapple plant leaves. Ecotoxicol. Environ. Saf. 2018, 147, 64–71. [Google Scholar] [CrossRef] [PubMed]
  212. Lupul, I.; Yperman, J.; Carleer, R.; Gryglewicz, G. Adsorption of atrazine on hemp stem-based activated carbons with different surface chemistry. Adsorption 2015, 21, 489–498. [Google Scholar] [CrossRef] [Green Version]
  213. Chaparadza, A.; Hossenlopp, J.M. Adsorption kinetics, isotherms and thermodynamics of atrazine removal using a banana peel based sorbent. Water Sci. Technol. 2012, 65, 940–947. [Google Scholar] [CrossRef] [PubMed]
  214. Mohsen Nourouzi, M.; Chuah, T.G.; Choong, T.S.Y. Adsorption of glyphosate onto activated carbon derived from waste newspaper. Desalin. Water Treat. 2010, 24, 321–326. [Google Scholar] [CrossRef]
  215. Salman, J.M. Batch Study for Insecticide Carbofuran Adsorption onto Palm-Oil-Fronds-Activated Carbon. J. Chem. 2013, 2013, 1–5. [Google Scholar] [CrossRef]
  216. Al Bahri, M.; Calvo, L.; Gilarranz, M.A.; Rodriguez, J.J. Activated carbon from grape seeds upon chemical activation with phosphoric acid: Application to the adsorption of diuron from water. Chem. Eng. J. 2012, 203, 348–356. [Google Scholar] [CrossRef] [Green Version]
  217. Bouhamidi, Y.; Kaouah, F.; Nouri, L.; Boumaza, S.; Trari, M.; Bendjama, Z. Kinetic, thermodynamic, and isosteric heat of dibutyl and diethyl phthalate removal onto activated carbon from Albizzia julibrissin pods. Part. Sci. Technol. 2018, 36, 235–243. [Google Scholar] [CrossRef]
  218. Wang, Z.; Chen, L. Adsorption characteristics of dibutyl phthalate from aqueous solution using ginkgo leaves-activated carbon by chemical activation with zinc chloride. Desalin. Water Treat. 2015, 54, 1969–1980. [Google Scholar] [CrossRef]
  219. Fang, Z.Q.; Huang, H.J. Adsorption of Di-N-butyl Phthalate onto Nutshell-Based Activated Carbon. Equilibrium, Kinetics and Thermodynamics. Adsorpt. Sci. Technol. 2009, 27, 685–700. [Google Scholar] [CrossRef]
  220. Ahmed, M.B.; Zhou, J.L.; Ngo, H.H.; Johir, M.A.H.; Sornalingam, K. Sorptive removal of phenolic endocrine disruptors by functionalized biochar: Competitive interaction mechanism, removal efficacy and application in wastewater. Chem. Eng. J. 2018, 335, 801–811. [Google Scholar] [CrossRef]
  221. Mestre, A.S.; Pires, J.; Nogueira, J.M.F.; Parra, J.B.; Carvalho, A.P.; Ania, C.O. Waste-derived activated carbons for removal of ibuprofen from solution: Role of surface chemistry and pore structure. Bioresour. Technol. 2009, 100, 1720–1726. [Google Scholar] [CrossRef] [PubMed] [Green Version]
  222. Mondal, S.; Bobde, K.; Aikat, K.; Halder, G. Biosorptive uptake of ibuprofen by steam activated biochar derived from mung bean husk: Equilibrium, kinetics, thermodynamics, modeling and eco-toxicological studies. J. Environ. Manag. 2016, 182, 581–594. [Google Scholar] [CrossRef] [PubMed]
  223. Bedia, J.; Ruiz-Rosas, R.; Rodríguez-Mirasol, J.; Cordero, T. Kinetic study of the decomposition of 2-butanol on carbon-based acid catalyst. AIChE J. 2010, 56, 1557–1568. [Google Scholar] [CrossRef]
  224. Bedia, J.; Ruiz-Rosas, R.; Rodríguez-Mirasol, J.; Cordero, T. A kinetic study of 2-propanol dehydration on carbon acid catalysts. J. Catal. 2010, 271, 33–42. [Google Scholar] [CrossRef]
  225. Sarıcı-Özdemir, Ç.; Önal, Y. Synthesis of new activated carbons produced from polymer waste. Fuller. Nanotub. Carbon Nanostruct. 2018, 26, 451–457. [Google Scholar] [CrossRef]
  226. Chang, K.L.; Shih, Y.H.; Tseng, C.H.; Chen, S.T.; Chen, C.C. Adsorption Studies on the Removal of an Herbicide (Atrazine) Using Activated Carbons Prepared from Agricultural Waste Sugarcane Bagasse. Appl. Mech. Mater. 2012, 251, 378–382. [Google Scholar] [CrossRef]
  227. Jung, C.; Park, J.; Lim, K.H.; Park, S.; Heo, J.; Her, N.; Oh, J.; Yun, S.; Yoon, Y. Adsorption of selected endocrine disrupting compounds and pharmaceuticals on activated biochars. J. Hazard. Mater. 2013, 263, 702–710. [Google Scholar] [CrossRef] [PubMed]
  228. Rivera-Utrilla, J.; Sánchez-Polo, M.; Ferro-García, M.Á.; Prados-Joya, G.; Ocampo-Pérez, R. Pharmaceuticals as emerging contaminants and their removal from water. A review. Chemosphere 2013, 93, 1268–1287. [Google Scholar] [CrossRef] [PubMed]
  229. Bautista-Toledo, I.; Ferro-García, M.A.; Rivera-Utrilla, J.; Moreno-Castilla, C.; Fernández, F.J.V. Bisphenol A Removal from Water by Activated Carbon. Effects of Carbon Characteristics and Solution Chemistry. Environ. Sci. Technol. 2005, 39, 6246–6250. [Google Scholar] [CrossRef] [PubMed]
  230. Stoeckli, F.; Hugi-Cleary, D. On the mechanisms of phenol adsorption by carbons. Russ. Chem. Bull. 2001, 50, 2060–2063. [Google Scholar] [CrossRef]
  231. Radovic, L.R.; Silva, I.F.; Ume, J.I.; Menéndez, J.A.; Leon, C.A.L.Y.; Scaroni, A.W. An experimental and theoretical study of the adsorption of aromatics possessing electron-withdrawing and electron-donating functional groups by chemically modified activated carbons. Carbon 1997, 35, 1339–1348. [Google Scholar] [CrossRef]
  232. Radovic, L.R. Chemistry and Physics of Carbon: A Series of Advances; Marcel Dekker, Inc.: New York, NY, USA, 2001; Volume 27. [Google Scholar]
  233. Fang, Z.; Smith, R.L. Production of Biofuels and Chemicals from Lignin; Springer: Singapore, 2016. [Google Scholar]
  234. Rodríguez, J.J.; Cordero, T.; Rodríguez-Mirasol, J. Carbon Materials from Lignin and Their Applications. In Production of Biofuels and Chemicals from Lignin; Springer: Singapore, 2016; pp. 217–262. [Google Scholar]
Figure 1. Available technologies for the removal of ECs from wastewater.
Carbon 04 00063 g001
Figure 2. Different types of biomass feedstocks.
Carbon 04 00063 g002
Figure 3. Synthesis routes to biochars and activated carbons from biomass.
Carbon 04 00063 g003
Figure 4. Evolution of the surface area of biochars obtained from different biomass resources with the carbonization temperature (adapted from [68], with permission from Elsevier, 2017).
Carbon 04 00063 g004
Figure 5. Biochar’s modification to improve the adsorption capacity (adapted from [68], with permission from Elsevier, 2017).
Carbon 04 00063 g005
Figure 6. The International Union of Pure and Applied Chemistry (IUPAC) classification of adsorption isotherms [114].
Carbon 04 00063 g006
Figure 7. Surface oxygen groups on carbons and their approximate decomposition temperature by temperature programmed desorption (TPD) test.
Carbon 04 00063 g007
Figure 8. Forms of the Freundlich isotherm depending on the n value: (a) n < 1, (b) n = 1, and (c) n > 1.
Carbon 04 00063 g008
Figure 9. Typical breakthrough curve (Cb = breakthrough concentration; Co = feed concentration; tb = breakthrough time; ts = saturation time.) (Reprinted from [151] with permission from Elsevier, 2017).
Carbon 04 00063 g009
Table 1. Emerging contaminants (ECs) usually found in wastewater (adapted from [21]).
Main CategoriesFamilyMost Representative Examples
Drugs and pharmaceuticalsantibiotics/antibacterialstetracycline, sulfamethoxazole, amoxicillin, ofloxacin
steroids17β-estradiol, testosterone
β-blockerpropranolol, salbutamol, atenolol
nonsteroidal anti-inflammatory drugs (NSAID)ibuprofen, naproxen, ketoprofen, diclofenac
antiepileptic/anticonvulsantsgabapentin, carbamazepine
antidepressant/hypnoticdiazepam, venlafaxine, amitriptyline, dosulepin, meprobanate
analgesicmorphine, antipyrine, paracetamol
hypertensionvalsartan
lipid regulationbezafibrate, simvastatin, clofibric acid
erectile dysfunctionsildenafil
Stimulant and generally illegal drugshallucinogen3,4-methylenedioxymethamphetamine (MDMA),
3,4-methylenedioxy-N-ethylamphetamine (MDEA),
3,4-methylenedioxyamphetamine (MDA)
stimulantamphetamine, cocaine, benzylpiperazine
human indicatorcaffeine, nicotine
Personal care productspreservativemethylparaben, propylparaben
sunscreen agent1-benzophenone, homosalate
disinfectants/antisepticchloramines, chlorine, chlorine dioxide,
chlorhexidine digluconate, triclosan
fragrancesmusk xylol, tonalide
Pesticides/herbicidesorganohalogenated compoundsdichlorodiphenyltrichloroethane (DDT), lindane,
vinclozolin, clopyralid
nitrogen containingsimazine, phenylurea, atrazine, glyphosate, diuron
Plasticizers [22]general purposephthalates
low volatilitytrimetallites
flame-resistantepoxides
Table 2. Assignment of Fourier transform infrared (FTIR) spectroscopy absorption bands of biomass-derived carbons [125,126].
σ (cm−1)AssignmentDesignation
3700υ (OH)Free OH groups
3400υ (OH)Stretching in hydroxyl groups
2926υ (C–H)Stretching in alkyl groups
2870υ (C–H)Stretching in alkyl groups
1745υ (C=O)Stretching in aldehydes, ketones groups and esters
1642υ (C=O)Stretching in cyclic amide
1640υ (C=C)
υ (C=O)
Stretching in olefins carbonyl groups of carbon material highly conjugated in graphite layer
1552υ (C=O)Assigned to carbonyl groups conjugated in aromatic
1540υ (C=C)Assigned to skeletal stretch in condensed aromatic system
1520υ (C=C)Aromatic skeletal stretching bands
1462υ (C–H)Stretching in aromatic ring
1460υ (C=O)Stretching in cyclic amide
1444υ (C=C), δ (CH)Stretching in aromatic skeletal and ester
1150–1200υ (C–O–C), υ (C–C), Stretching vibration in pyranose ring skeletal or stretching in aromatic ring
1137υ (C–O)stretching in phenolic ring, carboxylic moiety
1069υ (C–O–C)Asymmetrical stretch vibrations
870, 690γ (C–H)Aromatic C–H out-of-plane bending vibrations
610υ (O–H)Stretching in OH groups
450υ (C–C)Stretching in C–C vibrations
Table 3. Assignment of C1s, O1s and N1s XPS peaks of biomass-derived carbons [126,127,128,129].
Elemental SpectrumBinding Energy (eV)Assignation
C1s284.1–284.4C–C; C–H; graphite type
284.8–285.2C–OH; amorphous carbon, hydroxyl groups, phenolic, alcohol or ether aromatic carbon
285.5–286.1C–O–C; carbonyl groups
286.3–287.6O–C=O; carboxyl and ester groups
289.5–290.0π–π* transitions in the aromatic carbon
O1s530.0–531.6C=O
532.7–533.3C–OH or C–O–C
534.8–535.7chemisorbed oxygen
N1s398.0–398.3N-6 or pyridine-like structures
400.0–400.3N-5, i.e., pyrrolic
401.1–401.6graphitic nitrogen
402.3–404.0N-oxides
Table 4. Characteristic equations of three-parameter isotherms.
ModelEquation
Langmuir–Freundlich isotherm/Sips isotherm q = q m ( bc ) n 1 + ( bc ) n [140]
Redlich–Peterson isotherm q = q m bc 1 + ( bc ) n [141]
Tóth isotherm q = q m bc [ 1 + ( bc ) n ] 1 / n [142]
Dubinin-Astakhov (DA) equation q = V p V m exp [ ( RT ln C sat C E c ) m ] [143]
Table 5. Summary of representative works in the literature on adsorption of emerging contaminants from water with biochars.
ContaminantBiomass PrecursorSynthesis ConditionsBiochar CharacteristicsAdsorption ParametersMain Interactions Controlling AdsorptionRef.
Antibiotics
SulfamethoxazolePine sawdustTreatment in FeCl2, KOH and KNO3 solutions 90 °CSBET = 126 m2·g−1
O = 14.2%
pHpzc = 9.46
Co = 0.5–9.0 mg·L−1
W = 20 mg·L−1
T = 25 °C
pH = 4.5–8.5
qmax = 19.1 mg·g−1
π–π electron donor acceptor (EDA)
Hydrophobic
[160]
SulfamethoxazoleGiant reed (Arundo donax L.)Carbonization 300–600 °CSBET ≤ 88 m2·g−1
O = 9.0–21.0%
Co = 0–80 mg·L−1
Room temperature
pH = 1.0–12.0
qmax = 3.5 mg·g−1
π–π EDA
Hydrophobic
Pore filling
[161]
Sulfamethoxazole and sulfapyridinePine woodCarbonization 400–500 °CSBET = 101–434 m2·g−1
O = 6.6–16.1%
pH = 1.7–11.0
Room temperature
qmax SMX = 22.8 mg·g−1
qmax SP= 22.4 mg·g−1
π–π EDA[162]
Sulfamethoxazole, sulfathiazole and sulfamethazineBambooCarbonization at 380 °C and H3PO4 treatmentSBET < 1 m2·g−1
O = 18.9–39.5%
W = 100 mg·L−1
T = 21–30 °C
pH = 1.0–10.0
qmax SMX = 88.1 mg·g−1
qmax STZ = 237 mg·g−1
qmax SMZ = 65.7 mg·g−1
Neutral species:
H-bonds
π–π EDA
Lewis acid-base
Positive species:
π–π EDA
Negative species:
Proton exchange
π–π EDA
[163]
TetracyclineRice huskCarbonization at 500 °C and H2SO4 or KOH treatmentsSBET = 34–118 m2·g−1
O = 15.4–24.4%
Co = 50–1000 mg·L−1
W = 5 g·L−1
T = 30 °C
Natural pH
qmax = 58.8 mg·g−1
Surface areaπ–π EDA
O-groups
[164]
TetracyclineRice huskMethanol treatment of the biocharSBET = 66 m2·g−1
O = 23.4%
Co = 100 mg·L−1
W = 1 g·L−1
T = 30 °C
Natural pH
qmax = 95 mg·g−1
π–π EDA
O-groups
[165]
TetracyclineRice straw and Swine manureCarbonization at 700 °C and treatment with H3PO4SBET = 227–372 m2·g−1
O = 4.7–7.2%
pHpzc = 9.46
Co = 30–200 mg·L−1
W = 166–33 mg·L−1
T = 25 °C
pH = 5.0–9.0
qmax = 167.5 mg·g−1
H-bonding
π–π EDA
[166]
TetracyclineMunicipal sewage sludgeCarbonization at 400–800 °C and nitric or glacial acetic acid treatmentSBET = 24–202 m2·g−1Co = 50–800 mg·L−1
W = 1 g·L−1
T = 25–45 °C
pH = 3.0–11.0
qmax = 287 mg·g−1
π–π stacking
pore filling
[167]
Sterorids
17β-estradiolRice strawCarbonization at 400–600 °CSBET = 5.1–7.7 m2·g−1W = 200 mg·L−1
T = 28 °C
pH = 3.0–12.0
qmax = 64.9 mg·g−1
π–π interaction, electrostatic repulsion, film diffusion and multilayer adsorption[168]
17β-estradiolBagasseCarbonization at 400–800 °CSBET =167–339 m2·g−1
O = 10.1–19.2%
Co = 0.6–3.0 mg·L−1
W = 200 mg·L−1
T = 25 °C
pH = 3.0–9.0
qmax = 50.2 mg·g−1
H-bonds
π–π interaction
[169]
Anti-inflammatory
IbuprofenPine woodCarbonization at 425 °CSBET ~1 m2·g−1
O = 19.0%
pHpzc = 2.0
Co = 25–100 mg·L−1
T = 5–25 °C
pH = 2.0–10.0
qmax = 22.7 mg·g−1
O-groups[170]
IbuprofenRice strawCarbonization at 400–600 °CSBET = 71.3–63.0 m2·g−1
O = 30–49%
pHs = 9.1–9.3
Co = 10–100 mg·L−1
W = 50 mg·L−1
Room temperature
qmax = 170 mg·g−1
π–π interaction
Electrostatic attraction
[171]
DiclofenacPig manureCarbonization at 400 °CSBET = 43.5 m2·g−1
pHIEP = 2.15
Co = 0.1–10 mg·L−1
W = 2 g·L−1
T = 25 °C
pH = 6.5
qmax = 12.5 mg·g−1
electrostatic interactions, H-bonding, hydrophobic effects, π–π EDA[172]
Antimicrobial
TriclosanActivated sludge biosolidCarbonization at 300–800 °C and HCl acid treatmentSBET = 21–141 m2·g−1
O = 4.2–16%
pHs = 2.9–3.5
Co = 0.2–0.3 mg·L−1
W = 0.2–1.0 g·L−1
T = 25 °C
pH = 3.0–11.0
qmax = 0.87 mg·g−1
Hydrophobicity, hydrogen bonding and π-stacking[173]
Pesticides
Atrazine and imidaclopridFive agricultural wastesCarbonization at 600 °C
and treatment with H3PO4
SBET = 159–246 m2·g−1
O = 8.3–12.2%
pHs = 6.9–10.1
Co = 1.0–10.0 µg·L−1
W = 1.0 g·L−1
T = 27 °C
qmax atraz= 5.2 mg·g−1
qmax imid= 4.5 mg·g−1
Atrazine:
H/C ratio
Mesopore
Imidacloprid:
H/C ratio
Polarity
[174]
AtrazineCorn strawCarbonization at 200 and 450 °C in presence and absence of NH4H2PO4SBET = 45–356 m2·g−1
O = 20.6–22.1%
Co = 0.5–50.0 mg·L−1
W = 125–500 mg·L−1
T = 10–30 °C
pH = 2.0–9.0
qmax = 84.5 mg·g−1
Microporosity
π–π EDA
[175]
AtrazinePig manureCarbonization at 350 or 700 °C and ash removal SBET = 23.8–218.1 m2·g−1
O = 4.8–20.3%
pHs = 6.2–9.5
Co = 2.0–40.0 mg·L−1
W = 1.25 g·L−1
T = 20–24 °C
pH = 6.5
Hydrophobicity
Pore filling
π–π EDA
[176]
AtrazineSeveral biomass wastesCarbonization at 450 °CSBET = 41.2–62.2 m2·g−1
O = 11.6–17.6%
pHpzc = 8.3–9.2
Co = 5.0–35.0 mg·L−1
W = 10 g·L−1
T = 10–40 °C
pH = 4.5–11.0
qmax ~ 1.5 mg·g−1
Pore filling[177]
Plasticizers
Dibutyl phthalate (DBP)Different plants and manureCarbonization at 200 and 450 °C and ash removalSCO2 = 162–402 m2·g−1
O = 10.2–16.7%
Co = 0.1–10.0 mg·L−1
T = 23 °C
π–π EDA[178]
Dimethyl phthalate (DMP) Diethyl phthalate (DEP)
Dibutyl phthalate (DBP)
Peanut shellsCarbonization at 300 or 700 °C and HNO3/H2SO4 acid treatmentSBET = 7.0–381.0 m2·g−1
O = 8.7–42.5%
Co = 1.0–100.0 mg·L−1
Room temperature
pH = 7
qmax DMP = 110.5 mg·g−1
qmax DEP = 506.7 mg·g−1
qmax DBP = 216.1 mg·g−1
Hydrophylic
π–π EDA
[179]
SBET: total surface area by Brunauer-Emmett-Teller (BET) method; O: oxygen content; pHpzc: point of zero charge; pHIEP: isoelectric point; pHs: pH of the adsorbent surface; Co: initial pollutant concentration; W: adsorbent dose; T: adsorption temperature; pH: adsorption pH; qmax: maximum contaminant adsorption.
Table 6. Summary of representative works in the literature on adsorption of emerging contaminants from water with biomass-derived activated carbons.
ContaminantActivating Agent and Synthesis ConditionsBiomass PrecursorActivated Carbon CharacteristicsAdsorption ParametersMain Interactions Controlling AdsorptionRef.
Antibiotics
TetracyclineNaOH
r = 3:1
700 °C
Macadamia nut shellsSBET = 1524 m2·g−1
pHpzc = 8.74
Acid groups = 0.63 mmol·g−1
Basic groups = 1.0 mmol·g−1
Co = 250–800 mg·L−1
T = 25 °C
pH = 3.0–10.0
qmax = 455.3 mg·g−1
At low pH, π–π dispersion.
At medium-high pH, hydrogen bonding.
[104]
Tetracycline and ciprofloxacinH3PO4
r = 2:1
450 °C
LigninSBET = 933 m2·g−1 pHpzc = 2.60
Acid groups = 3.9 mmol·g−1
Basic groups = 0.18 mmol·g−1
Co = 180–600 mg·L−1
W = 1.0 g·L−1
T = 20–40 °CpH = 5.5
qmax TC = 475.5 mg·g−1
qmax CP = 418.6 mg·g−1
H bonding[193]
TetracyclineH3PO4
450 °C
Apricot stonesSBET = 308 m2·g−1
pHpzc = 2.13
Co = 100–200 mg·L−1
T = 30–55 °C
pH = 1.5–8.5
qmax = 308.3 mg·g−1
Low pH, electrostatic attraction. Medium pH, π–π EDA. High pH, electrostatic repulsion [194]
TetracyclineH3PO4–Fe(NO3)3
450 °C
Iris tectorumSBET = 1371 m2·g−1
Acid groups = 3.8 mmol·g−1
Co = 350–800 mg·L−1
W = 600 mg·L−1
T = 22 °C
pH = 2.0–11.0
qmax = 769.2 mg·g−1
Electrostatic attraction[195]
TetracyclineZnCl2
r = 6:1
600 °C
Tomato industrial wasteSBET = 1093 m2·g−1
pHpzc = 6.17
Acid groups = 1.17 meq·g−1
Basic groups = 1.04 meq·g−1
Co = 200–400 mg·L−1
W = 200–1000 mg·L−1
T = 15–35 °C
pH = 5.7
qmax = 500.0 mg·g−1
--[196]
TetracyclineZnCl2
r = 6:1
600 °C
Grape industrial processing pulpsSBET = 1455 m2·g−1
pHpzc = 5.86
Acid groups = 1.24 meq·g−1
Basic groups = 0.88 meq·g−1
Co = 200–400 mg·L−1
W = 200–1000 mg·L−1
T = 15–35 °C
pH = 5.7
qmax = 625.0 mg·g−1
--[197]
TetracyclineZnCl2
r = 0.5:1
700 °C
Oak charcoalsSBET = 224 m2·g−1Co = 25–100 mg·L−1
W = 0.25–3.5 g·L−1
T = 20 °C
pH = 3.0–11.0
qmax = 282.1 mg·g−1
Low-medium pH, π–π dispersion and hydrophobic
High pH electrostatic repulsion
[198]
TetracyclineNaOH800 °CPinus taedaSBET = 960 m2·g−1
pHpzc = 6.83
Co = 20–100 mg·L−1
W = 100 mg·L−1
T = 20 °C
pH = 3.0–9.0
qmax = 274.8 mg·g−1
Low-medium pH, π–π dispersion and hydrophobic
High pH electrostatic repulsion
[105]
Tetracycline, oxytetracycline and chlortetracyclineH3PO4
r ~ 1:1
900 °C
Hazelnut shellSBET = 1425 m2·g−1
pHpzc = 4.2
Co = 0.1–1.0 g·L−1
W = 4 g·L−1
T = 20–50 °C
pH = 2.0–10.0
qmax TC = 302.9 mg·g−1
qmax OTC= 321.5 mg·g−1 qmax ClT = 313.5 mg·g−1
Low pH, repulsive forces (+/+)
Medium pH, hydrogen bonding, EDA,
and π–π dispersion
High pH, repulsive forces (-/-)
[199]
SulfamethoxazoleH3PO4
K2CO3
r = 1:1
800 °C
Bleached pulpSBET = 814–965 m2·g−1
pHpzc = 2.3–4.9
Co = 0.035–0.30 g·L−1
T = 25 °C
pH = 7.3
qmax = 13.0 mg·g−1
Repulsive forces[200]
AmoxicillinZnCl2
r = 2:1
900 °C
Macauba palm wasteSBET = 907 m2·g−1
pHIEP = 5.9
Co = 10–1000 mg·L−1
W = 10 g·L−1
T = 25 °C
pH = 3.0–9.0
qmax = 38.0 mg·g−1
At low pH electrostatic attraction[201]
Steroids
EthinylestradiolZnCl2
r = 2:1900 °C
Macauba palm wasteSBET = 907 m2·g−1
pHIEP = 5.9
Co = 10–1000 mg·L−1
W = 10 g·L−1
T = 25 °C
pH = 3.0–9.0
qmax = 38.0 mg·g−1
π–π interaction[201]
β-blockers
Atenolol, acebutololCO2
700 °C
Palm kernel shellSBET = 711 m2·g−1
pHpzc = 11.5
Co = 100–250 mg·L−1
W = 1 g·L−1
T = 25 °C
pH = 3.0–10.0
qmax ATE= 183.4 mg·g−1
qmax ACE= 225.4 mg·g−1
Hydrogen bonding[202]
Anti-inflammatory
Ibuprofen, naproxen, ketoprofen, diclofenacH3PO4Olive-waste cakesSBET = 793 m2·g−1T = 20–40 °C
pH = 2.0–8.6
qmax IBU = 12.6 mg·g−1
qmax NAP= 39.5 mg·g−1
qmax KET= 24.7 mg·g−1
qmax DIC= 56.2 mg·g−1
Low-medium pH hydrogen bonding and/or
Van der Waals interaction.
High pH, electrostatic repulsion
[203]
IbuprofenSteam
800 °C
Aegle marmelos shellSBET = 308 m2·g−1
pHpzc = 7.2
Co = 0.033–3.33 g·L−1
W = 1.0–45.0 mg·L−1
T = 15–45 °C
pH = 2.0–6.0
qmax = 12.6 mg·g−1
Electrostatic interactions[204]
IbuprofenK2CO3
r = 1:1, 700 °C and steam
750 °C
Cork wasteSBET = 1060 m2·g−1T = 20–40 °C
pH = 2.0–11–0
qmax = 416.7 mg·g−1
Electrostatic interactions[205]
Analgesic
ParacetamolH3PO4
r = 3:1 500 °C
Olive stonesSBET = 990 m2·g−1Co =0.3–10.0 mg·L−1
T = 25 °C
Natural pH
qmax = 98.4 mg·g−1
--[206]
ParacetamolH3PO4
r = 1:1 600 °C
Spent tea leavesSBET = 1208 m2·g−1
pHpzc = 2.02
Co = 10–100 mg·L−1
W = 0.1–1.0 g·L−1
T = 25–60 °C
pH = 3.0–11.0
qmax = 59.2 mg·g−1
High pH, electrostatic repulsion[207]
AntipyrineFeCl3
r = 2:1 800 °C
Tara gumSBET = 1680 m2·g−1Co = 10–100 mg·L−1
W = 200–400 mg·L−1
T = 20–60 °C
Natural pH
qmax = 275.0 mg·g−1
Pore filling
O-functionalities
[55]
Antiepileptic
CarbamazepineH3PO4
K2CO3
r = 1:1
800 °C
Bleached pulpSBET = 814–965 m2·g−1
pHpzc = 2.3–4.9
Co = 0.035–0.30 g·L−1
T = 25 °C
pH = 7.3
qmax = 92.0 mg·g−1
--[200]
CarbamazepineCO2
700 °C
Palm kernel shellSBET = 711 m2·g−1
pHpzc = 11.5
Co = 100–250 mg·L−1
W = 1 g·L−1
T = 25 °C
pH = 3.0–10.0
qmax = 170.1 mg·g−1
Hydrophobic and π–π intreactions[202]
CarbamazepineKOH
r= 1:1
700 °C
Pomelo peelsSBET = 904 m2·g−1
pHpzc = 4.46
Co = 10–100 mg·L−1
T = 25 °C
pH = 2.0–12.0
qmax = 286.5 mg·g−1
hydrophobic, π–π interactions and hydrogen bonding[208]
CarbamazepineH3PO4
435 °C
Peach stonesSBET = 1216 m2·g−1
pHpzc = 3.1
Co = 100 mg·L−1
T = 30 °C
pH naturalqmax = 335.0 mg·g−1
π–π interactions[209]
Stimulant
CaffeineZnCl2 (MW) *
r = 1:1,
5.3 min, 1300 W
Eragrostis plana Nees leavesSBET = 1250 m2·g−1
pHpzc = 3.65
Acid groups = 1.04 mmol·g−1
Basic groups = 0.12 mmol·g−1
Co = 0.1–2.0 g·L−1
W = 0.5–10.0 g·L−1
T = 25 °C
pH = 7.0
qmax = 235.5 mg·g−1
π–π interactions[210]
CaffeineH3PO4
500 °C
Pineapple leavesSBET = 1031 m2·g−1
pHpzc = 2.80
Acid groups = 0.74 mmol·g−1
Basic groups = 0.59 mmol·g−1
Co = 100–500 mg·L−1
W = 1.0 g·L−1
T = 25–55 °C
pH = 2.0–9.0
qmax = 155.5 mg·g−1
π–π interactions and hydrogen bonds[211]
Pesticide
AtrazineKOH
r = 3:1
600 °C
Different treatments
Hemp stemSBET = 2067–2213 m2·g−1
pHpzc = 3.9–9.2
O = 6.0–21.0%
Co = 30 mg·L−1
W = 50–1000 mg·L−1
T = 25 °C
pH = 5.0–9.0
qmax = 466.0 mg·g−1
π–π and hydrophobic interactions[212]
AtrazineH3PO4
350 °C
Banana peelpHpzc = 8.2Co = 1–150 mg·L−1
W = 15 g·L−1
T = 25–60 °C
pH = 2.0–9.0
qmax = 14.4 mg·g−1
--[213]
GlyphosateKOH
r = 0.25:1
650 °C
Waste newspaperSBET = 535 m2·g−1
pHpzc = 12.0
Co = 5–100 mg·L−1
W = 1 g·L−1
T = 28 °C
pH = 2.0–9.0
qmax = 48.4 mg·g−1
Electrostatic interactions[214]
CarbofuranKOH + CO2
r = 2.75:1
850 °C
Palm oil frondsSBET = 1237 m2·g−1Co = 25–250 mg·L−1
W = 1.5 g·L−1
T = 30 °C
pH = 2.0–12.0
qmax = 164.0 mg·g−1
Electrostatic attraction[215]
DiuronH3PO4Grape seedsSBET = 1139 m2·g−1Co ~ 5–33 mg·L−1
T = 15–45 °C
Natural pH
qmax = 129.1 mg·g−1
--[216]
Plasticizers
Dibutyl phthalate Diethyl phthalateH3PO4
r = 8:1
600 °C
Albizzia julibrissin podsIN ** =1139 mg·g−1
pHpzc = 2.9
Co = 150–400 mg·L−1
T = 10–40 °C
pH = 2.0–10.0
qmax DBP = 1305 mg·g−1
qmax DEP = 457 mg·g−1
--[217]
Dibutyl phthalateZnCl2Ginkgo leavesSBET = 697 m2·g−1Co = 5–15 mg·L−1
W = 0.1–1.0 g·L−1
T = 25–35 °C
pH = 1.0–13.0
qmax = 129.9 mg·g−1
--[218]
Dibutyl phthalate--NutshellSBET = 1224 m2·g−1Co = 3.0–6.0 mg·L−1
W = 40–140 mg·L−1
T = 25–55 °C
pH = 3.0–9.0
qmax = 104.7 mg·g−1
--[219]
* MW = Microwave heating; ** IN = Iodine number.

