Mechanism of Catalytic CNTs Growth in 400–650 °C Range: Explaining Volcano Shape Arrhenius Plot and Catalytic Synergism Using both Pt (or Pd) and Ni, Co or Fe

Requimte Research Centre, Chemistry Dep., Universidade Nova de Lisboa, 1099-085 Lisboa, Portugal
C 2019, 5(3), 42; https://0-doi-org.brum.beds.ac.uk/10.3390/c5030042
Submission received: 13 June 2019
/
Revised: 23 July 2019
/
Accepted: 26 July 2019
/
Published: 29 July 2019
Abstract
:The Arrhenius plot of catalytic carbon formation from olefins on Ni, Co, and Fe has a volcano shape in the range 400–550 °C with reaction orders 0 (at lower T: Below ~500 °C) and one (at higher T: Above ~500 °C) at each side of the maximum rate. The reaction follows a catalytic route with surface decomposition of the gas (olefin) on the catalyst nanoparticle, followed by the bulk diffusion of carbon atoms and carbon nanotube growth on the opposite side. At the higher temperature region (500–550 °C), the initial surface reaction step controls the rate and the reaction order is one, both in olefins and hydrogen (H). This confirms that H is essential for the surface reaction to occur. This is very valuable information to get faster CNT growth rate at relatively low temperatures. The apparent activation energy observed must correspond with the surface reaction Ea corrected for the temperature dependence of the two molecules involved (olefin and H). Adding a noble metal (Pt, Pd) to the carbon formation catalyst is frequently found to increase the reaction rate further. This effect has been described as an H spillover since 1964. However, there is evidence that the bulk diffusion of H atoms prevails and does not “spillover” the surface diffusion. Diffusion of H atoms through the solids involved is easy, and the H atoms remain single (“independent”) until emerging on a surface.
1. Introduction
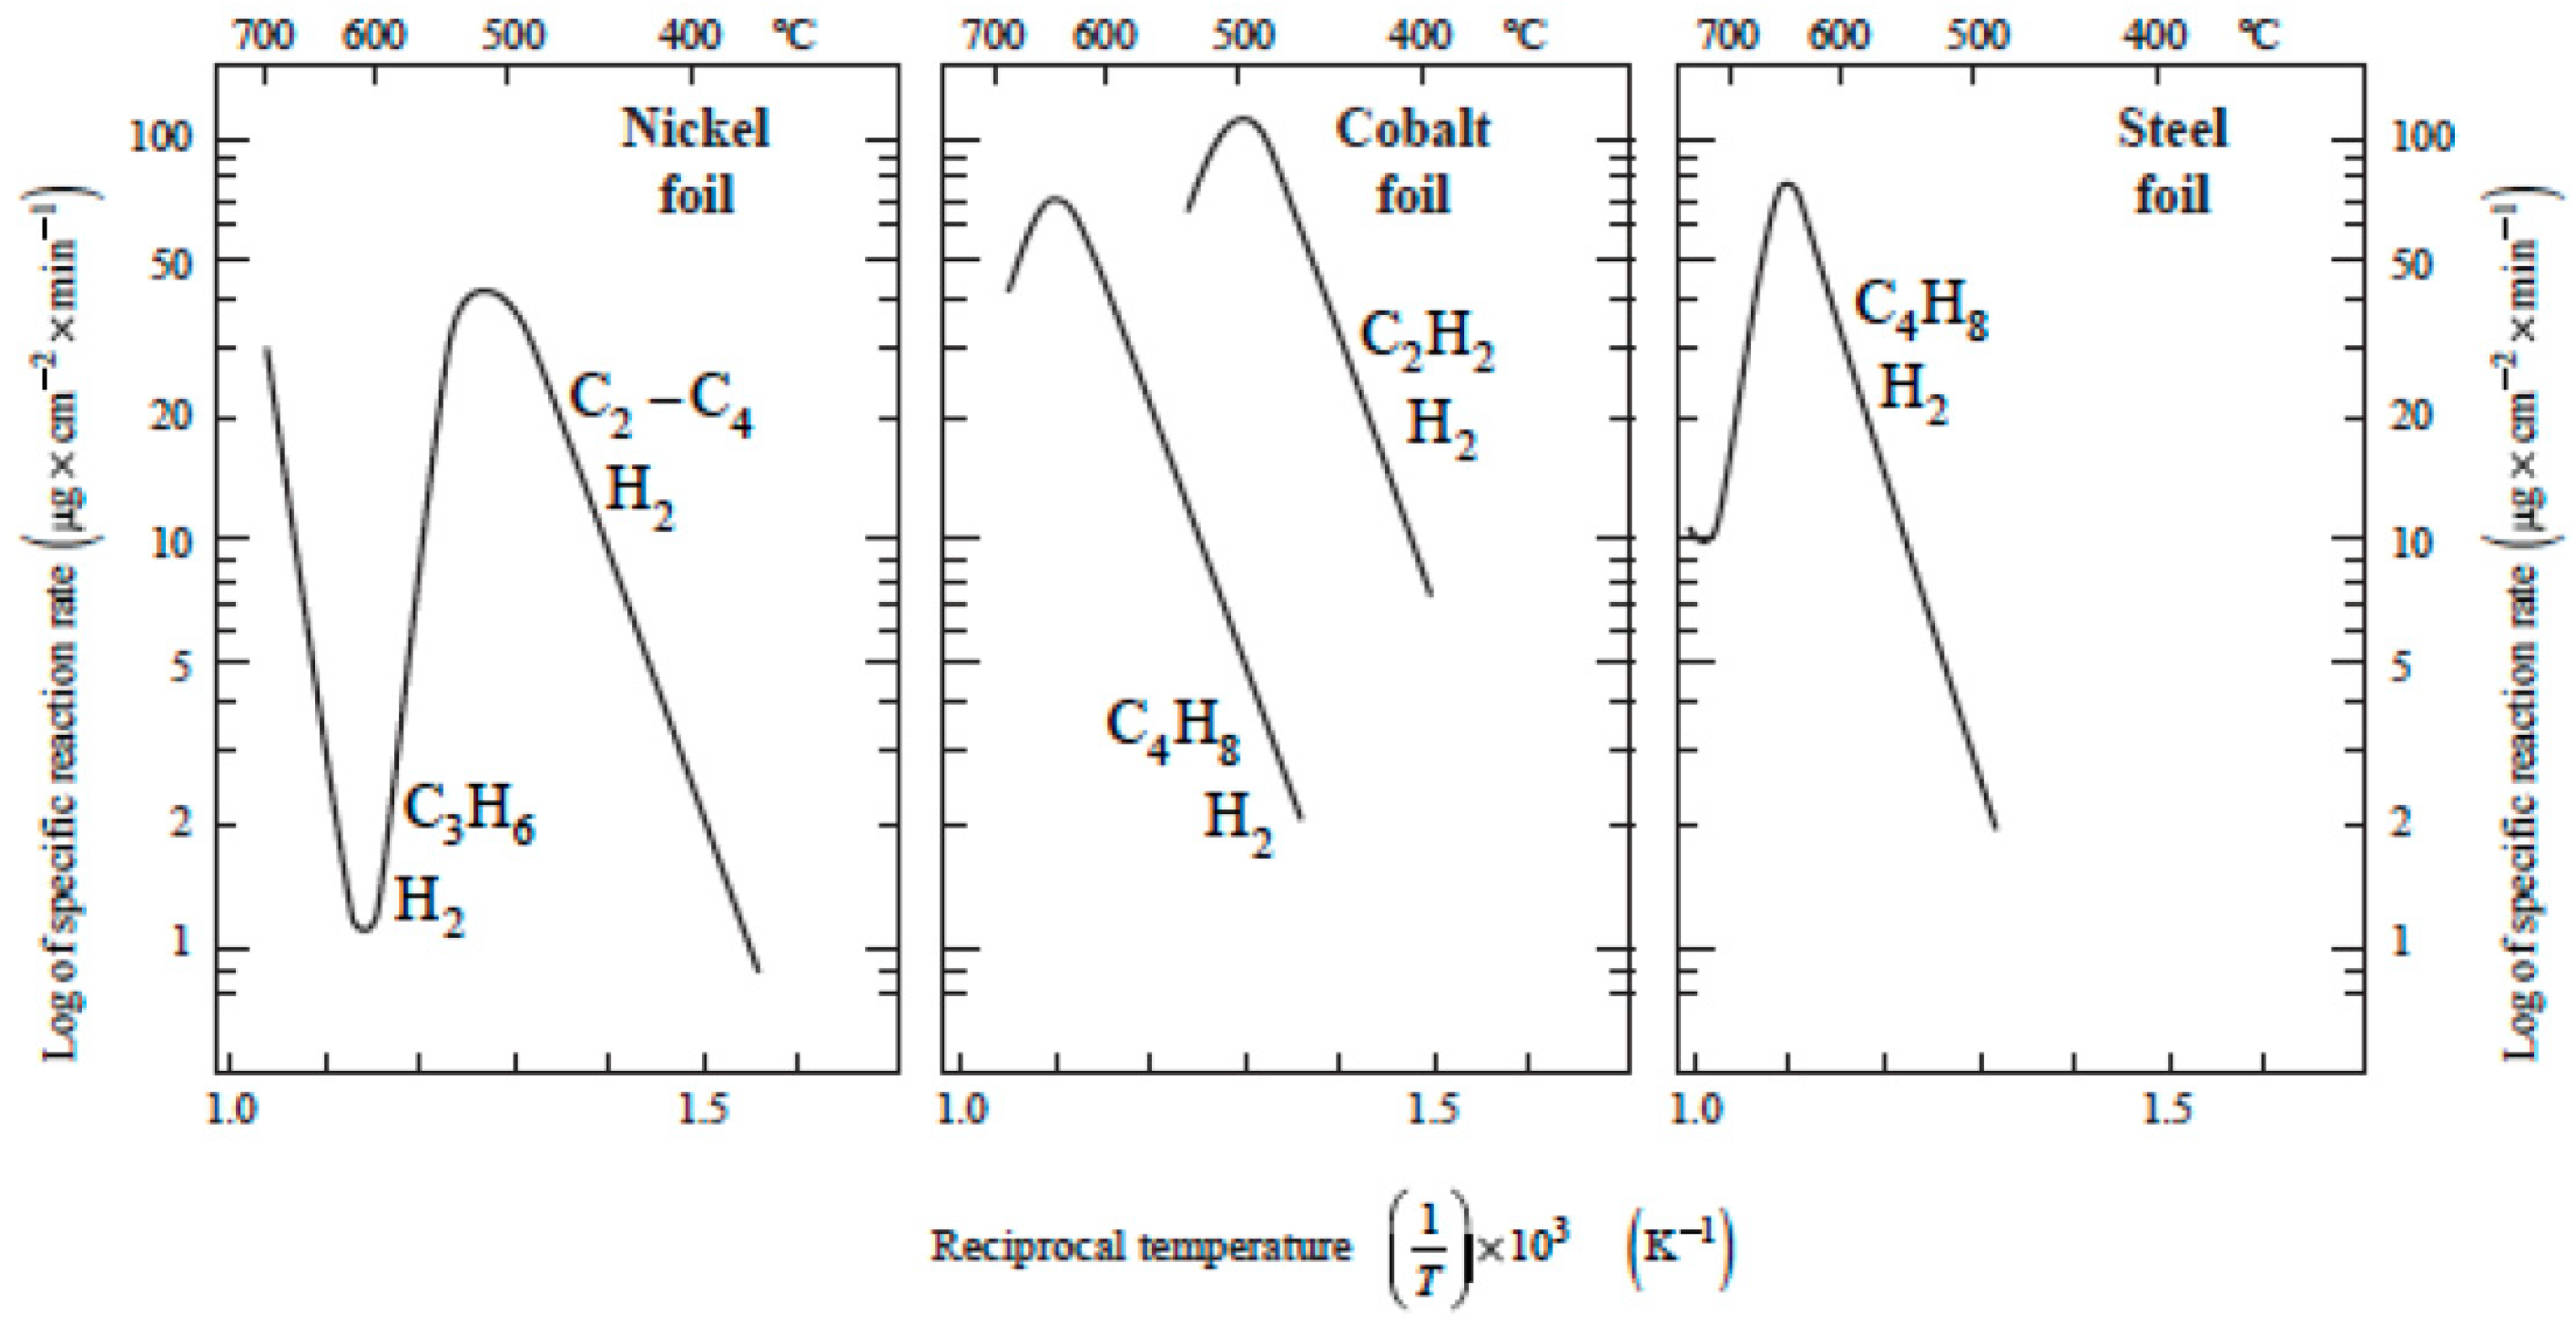
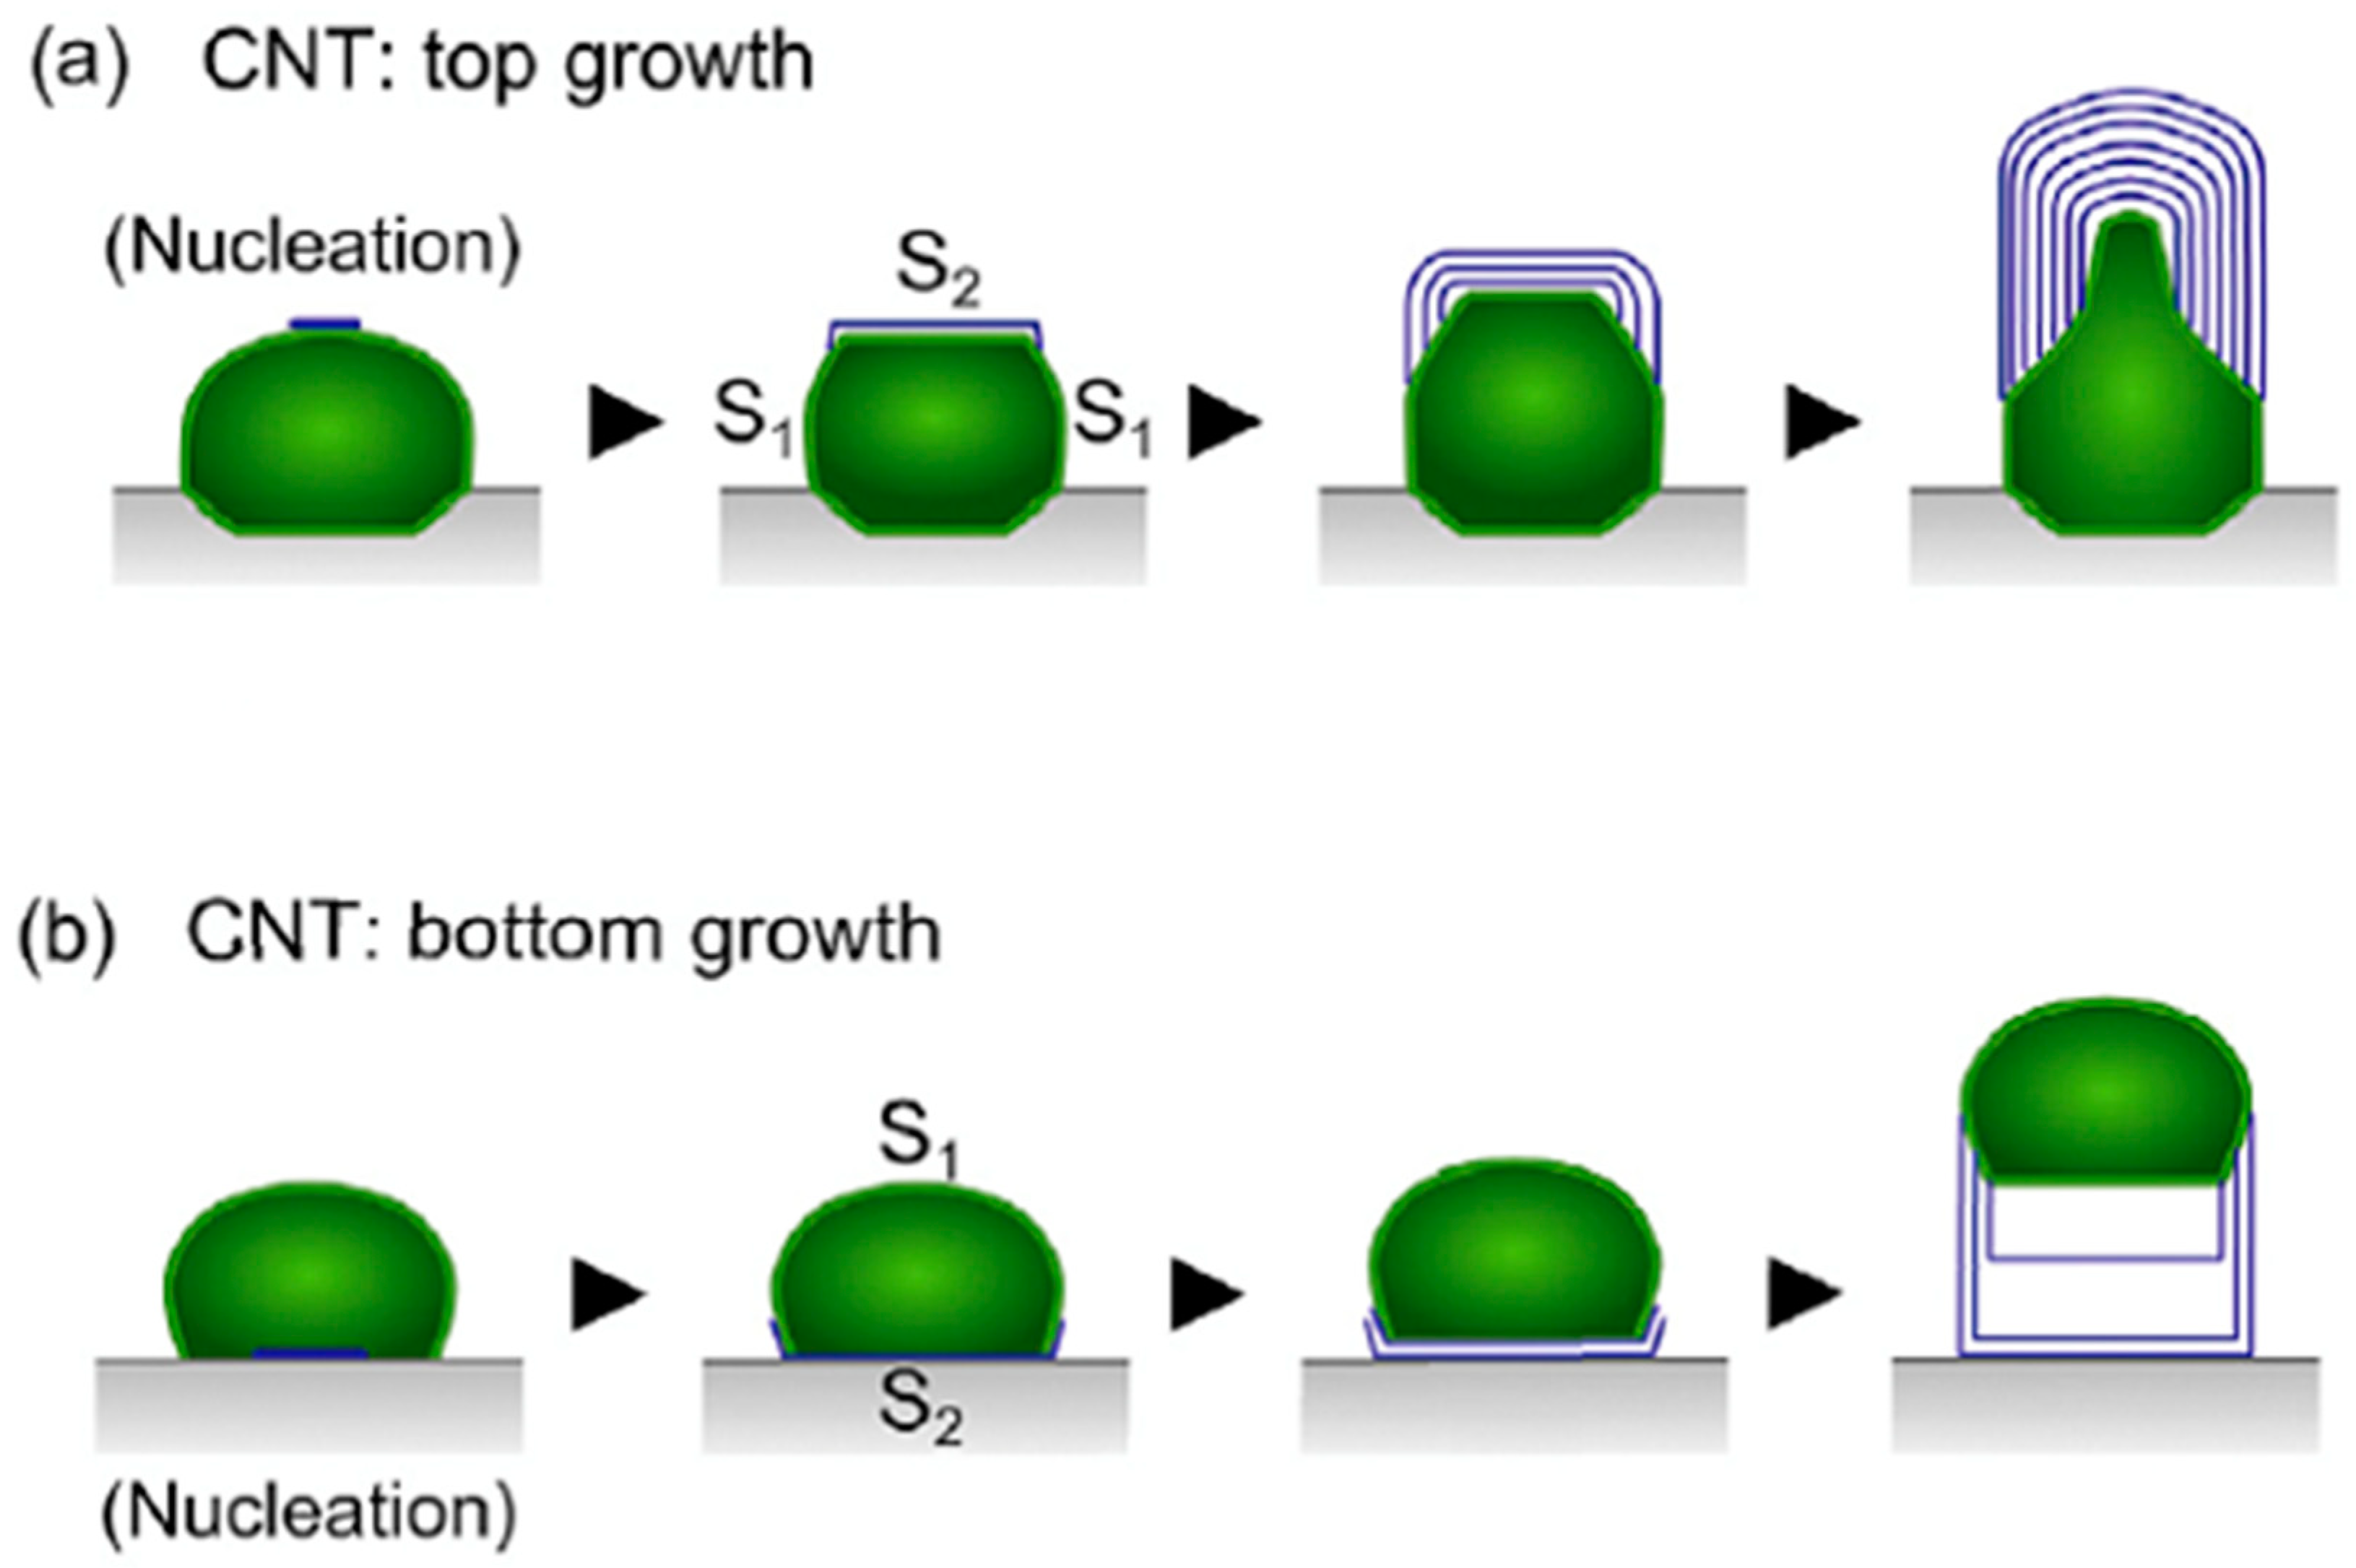
Catalytic carbon formation can occur via three alternative mechanistic routes, as summarized in Table 1 [1,2]. The low temperature route (catalytic) commonly exhibits a volcano shaped Arrhenius plot in the range of temperatures 400–550 °C (Figure 1). This was first reported in Nature Physical Sciences in 1971 [3]. However, a detailed explanation of this behavior was not published. The singularity of this behavior seems to be due to the following: A Langmuir-Hinshelwood surface reaction took place on the surface, followed by the bulk diffusion of carbon atoms. The two steps were very different in nature. The kinetics observed was quite different when either of the steps were the rate-controlling step. This behavior is still not well understood [4]. It was detected and studied with acetylene and olefins on Ni, Co, and Fe (Figure 2) [3,5,6]. At present, metal nanoparticles are the basis for effective nucleation and growth. Nucleation may start at the bottom or top of the nanoparticle, as schematized in Figure 3.
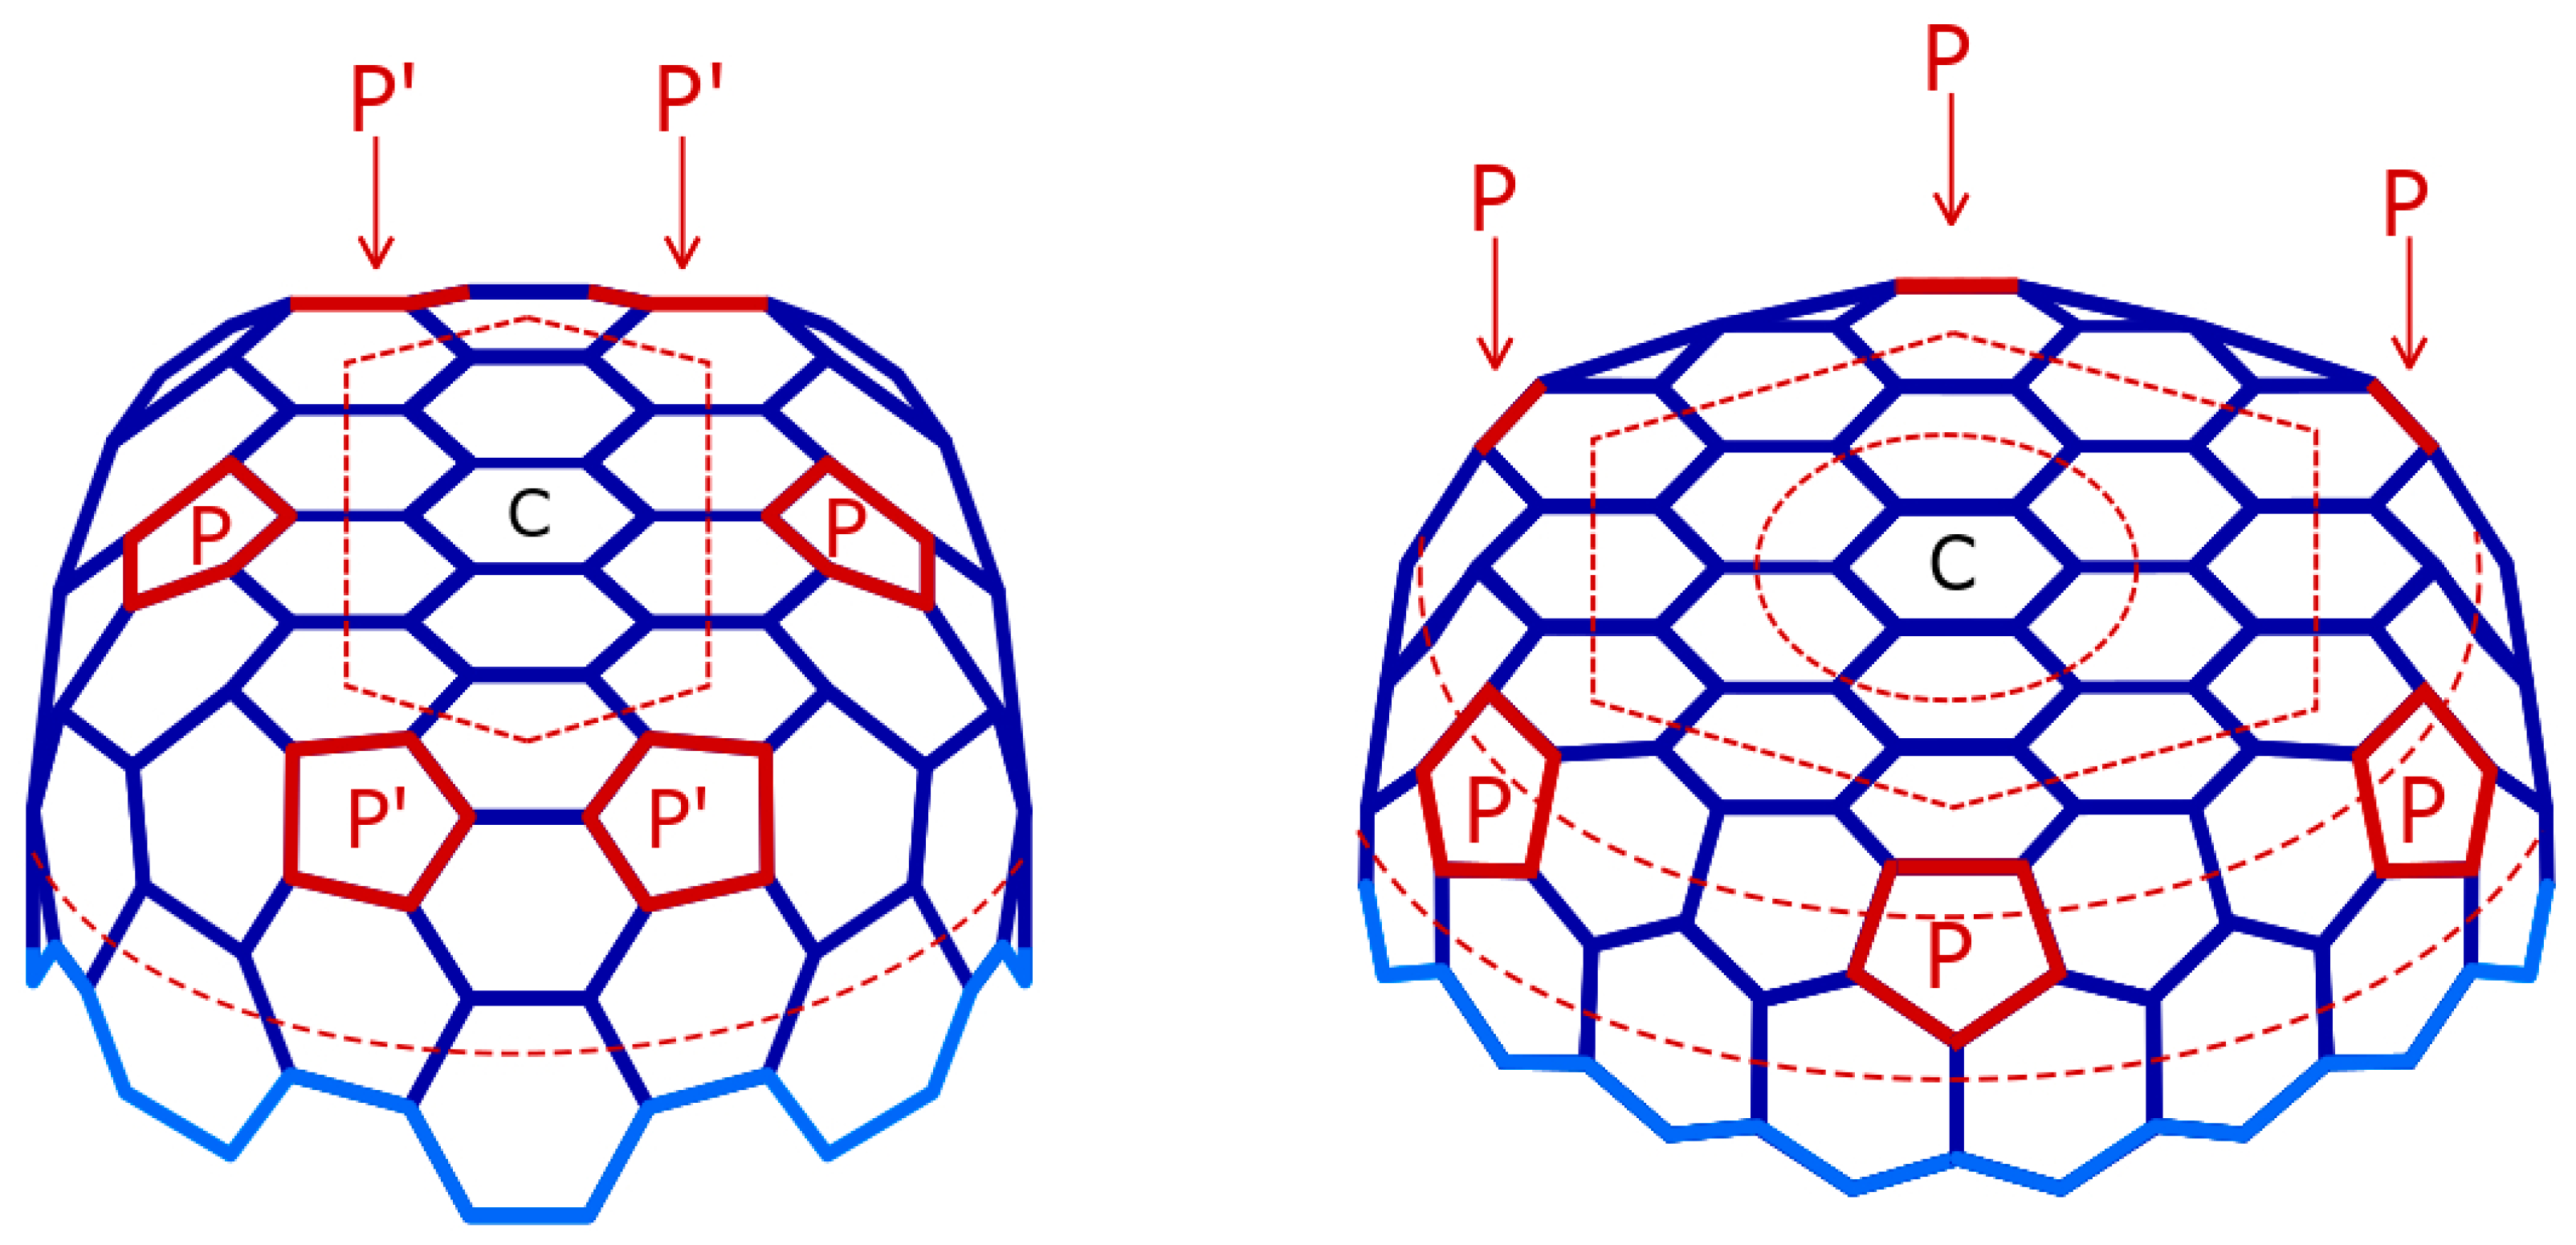
When nucleation takes place, the C concentration inside the particles decreases immediately at the carbon growth side. At the gas side, under steady-state rate conditions, the solid phase is in equilibrium with the reactant gas. When the gas-side phase is carbide, a low thickness is maintained, as explained by the dual catalyst concept [2]. The constant C flux during steady-state growth imposes a thickness inversely proportional to its diffusivity in the two solid-state phases, carbide and metal [1]. CNT’s nucleation and growth geometry and chirality are probably related to the prevailing particle shape and crystal faces. Two examples are octopus carbon growth [2] and alternative chirality, depending on the nanoparticle shape observed by Koziol et al. [8]. A possible explanation of that effect is shown in Figure 4.
2. Explaining Negative Temperature Dependencies in Carbon Growth from Steady-State Kinetic Studies: Linearity of the Weight vs. Time Register Observed
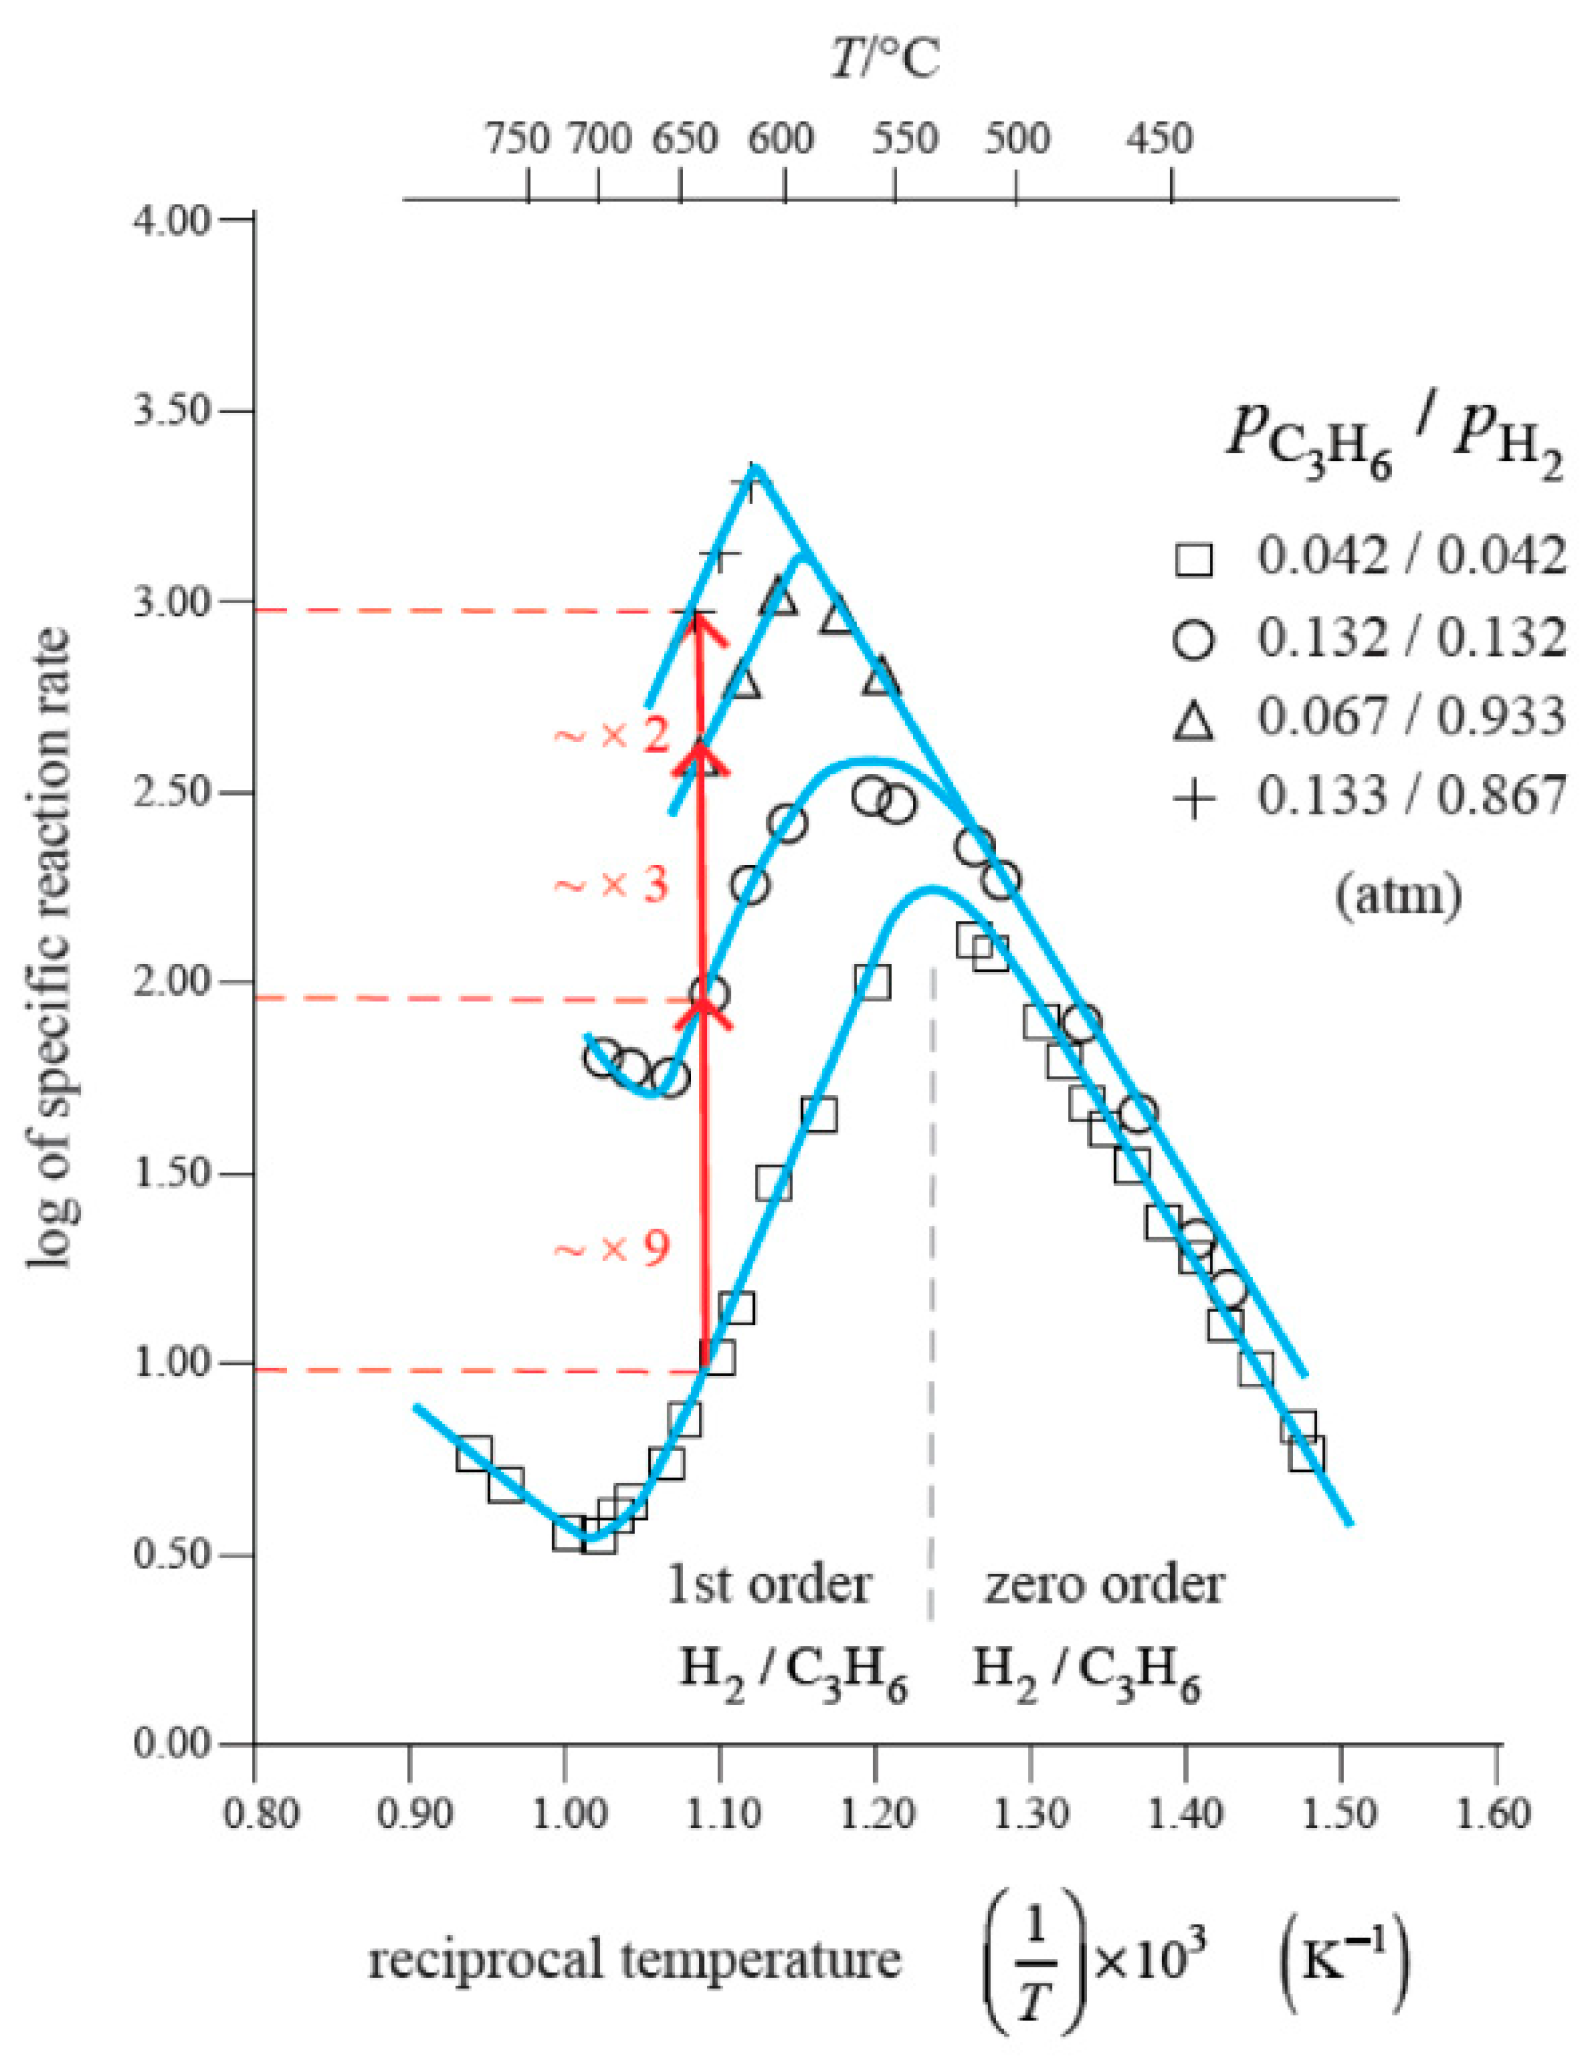
The kinetic study of carbon formation from hydrocarbons at low temperatures shows a region with negative activation energies (Figure 1 and Figure 2). The Arrhenius plots exhibit a maximum rate at about 500 °C [3,4,5,6,7]. This volcano shape is not very common in Arrhenius plots. When increasing the temperature, the rate increases, reaches a maximum, and then decreases. The observed kinetic changes are shown in the example of Figure 5. The kinetic studies must always be based on data from steady-state kinetic studies: linearity of the weight vs. time register observed [1,2].
When a volcano-shaped Arrhenius is obtained exhibiting a region of apparent negative activation energy, we propose that this kinetic behavior is due to high values of the adsorption enthalpies of reactant gases [9]. Taking the case of the C formation from C2H4/H2 in the temperature region where a slower surface reaction step controls, followed by a quick carbon bulk diffusion step (500–550 °C), we may write [10]:
![Carbon 05 00042 i001]()

The sum of the estimated adsorption enthalpies (∆H) of acetylene (−70 kcal/mole) and hydrogen (−20 kcal/mole) has a net (negative) value (−90 kcal/mole) larger than the activation energy of the surface reaction (~30 kcal/mole). The overall temperature dependence of the reaction rate is negative (Figure 1 and Figure 5). In practical terms, an increase in temperature increases the energy of each molecule but decreases the number of molecules adsorbed. This explains the existence of two very different operating regions with very different T dependence as well as the changing reaction order observed (from 0 to 1). The change of behavior with the same reaction mechanism operating (route I in Table 1) is explained by the very different nature of the two alternative controlling rate-determining steps.
Table 2 shows activation energies observed with different hydrocarbons [9]. Table 3 shows reaction orders observed by Bernardo [11], evidencing that the surface reaction exhibits kinetic Langmuir–Hinshelwood behavior. When the surface reaction step is rate-controlling, this behavior is evidenced, but when it is not rate-controlling. the Langmuir–Hinshelwood behavior is disguised. In our experiments, gas purity (99.9%) was essential to evidence the operating mechanism [3,5,6,12]. Gas phase composition did not vary during carbon formation experiments bellow 650 °C. Some pyrolysis of olefins occurred above 700 °C. Gas purity: In industrial production it is normal to use commercial gases with lower purity, but not in laboratory research.
An early observation of the kinetic behavior and explanation of the Arrhenius plots observed with different hydrogen and olefin pressures was schematized in 1971, as shown in Figure 6 [9].
Boudart and Djéga–Mariadsu, in their book [12], discuss in detail the work by Engel and Ertl in 1978 on the catalysis of CO oxidation, in which a similar volcano shape was observed [13]. Engel and Ertl studied and discussed the behavior based on COad and Oad coverage. Boudart simplified the analysis with the Oad concentration as a function of the adsorption equilibrium depending on temperature as a function of −∆HCOad, so that the total dependence on temperature is:
Exp (E + ∆HCOad) = exp(25–32) < 0
This explanation is the same as proposed above (Figure 6) for the volcano shape observed on the Arrhenius plot of the carbon formation from C2H2 and from low olefins catalyzed by Ni. In our case, steady-state rates must be established to draw reliable Arrhenius plots. Kinetic linearity (weight vs. time) must be observed to get consistent data and a reliable mechanistic perspective. Kinetics is the best key to overcome the present difficulties: “The central problem in nanotube science is still the mechanism” [14].
Other researchers have found a maximum in an intermediate temperature in the range 300–600 °C. Zaikovski et al. found a higher rate of carbon formation at 500 °C and a much slower rate at 600 and 700 °C [15]. Lattorre et al. also reported a decrease in rate, increasing in the same temperature range [16]. Puretzky et al. observed rates of growth with a maximum in a detailed study of multiwall carbon nanotube arrays [17]. The maximum observed with Fe is at about 650 °C [5].
It can be seen from the recent review of Kharlamova that very high temperatures have been more frequently used in recent studies [18]. At present, Arc discharge and laser ablation are the dominant technologies for producing carbon nanotubes, but the exact surface reaction conditions are more difficult to know [19]. These methods and molecular beam-controlled nucleation and growth of carbon nanotube arrays are of interest for industrial production [20].
At present, there are few detailed kinetic studies, particularly in the lower temperature range. The observation that “the central problem in nanotube science is still the mechanism” [14] seems to result from current research work aiming at optimizing production and properties of CNTs.
3. H Spillover Effect: An Illusion?
A synergism is observed frequently on the reaction rate when a noble metal (eg. Pd or Pt) is added to a transition metal catalyst (e.g., Fe, Co, or Ni), accelerating a carbon formation reaction. Synergism here means that the catalytic effect on the rate catalyzed by dispersed particles of two metals is made higher than its prediction by adding the separate effect of each metal used alone. Example: Rates (R) observed with cobalt and platinum RCo+Pt >> RCo + RPt.
The probable cause of that effect is explained below. This effect may be observed both in the catalytic route and in the hybrid route of the carbon formation (see Table 1) [1]. Jing, Liu et al. reported a study of the synergism of Pt/Fe2O3 in the hydrogenation of nitroarenes at 30 °C [21]. In carbon nanofibers growth, many researchers studied this synergism of Pd or Pt combined with a transition metal. Atwater, Phillips, and Leseman used Pd with Co [22] and Teng et al. used Pt with Co-Cr [23] found a high increase in the growth rate of CNTs, combining a transition and a noble metal. In the first case, the reactants were C2H2 and H2, and in the second case, the reactants were CH4 and H2. In the presence of Pt or Pd, H2 splits easily into two atoms. H atoms diffuse easily through several metals, and other solids and can diffuse easily through a silica wafer [22] or a ceramic boat [23], as used in either experimental work mentioned above. The transition metal nanoparticle can be an alloy, such as Ni-Cu or Co-Cr.
The role of Pt or Pd is to supply H atoms with the metal catalyst nanoparticles, reaching the catalytic surface and accelerating the hydrocarbon surface reaction decomposition. A continuous C atoms bulk diffusing flux inside the metal nanoparticles supply C for the growth of CNTs (Figure 7).
A model assuming diffusion of H through the bulk of the solids was not used [12,24]. The spillover of H atoms using Pt or Pd particles on SiO2 is a myth, in our opinion, although that model has still an important support in surface science and catalysis [25].
Bulk diffusion of C, N, and H trough solids was studied (1863–1904) in more detail in the 1930s and 1940s. H atoms free on the surface are unstable, combining or reacting very easily. C, N, O, or H atoms diffuse interstitially through transition and noble metals (Ni, Co, Fe, Cu, Rh, Pt, Pd) moving as stable single atoms. Barrer’s book, Diffusion in and Through Solids [26], summarizes data on H diffusion in metals ([26] (a) Chapter IV: Gas flow through metals, early studies: Graham in 1866 (H/Pd); Cailletet in 1864 (H/Fe); Deville and Troost in 1863 and 1884 (H/Pt); Richardson, Nichol and Parnell 1904 (H/Pt)). Interstitial diffusion of carbon also operates in transition, and noble metals operates in transition when the ratio of the covalent radius of solute and solid “solvent” is less than 0.59.
Barrer lists data of solubility and diffusivity of hydrogen in metals (particularly Fe, Co, Ni, Cu, Pt, and Pd) and SiO2 ([26] (b) Extensive data on H bulk diffusion, solubility and heats of solution in metals and other solids is listed in Tables (39,40,42) and Figures. (42,52)) and discusses the question of surface diffusion vs. bulk diffusion of atoms in solids, discarding the proposal that mobility of adsorbed atoms or ions in solids occurred along surfaces, advanced by Smekal in 1925, who used Einstein’s diffusion equation: D = BkT (B denotes mobility). The surface diffusion proposal led to impossible values in the diffusivity equation.
The solubility of H in Ni, Co, Fe, and Cu is endothermic or slightly exothermic, while the solubility in Pd, V, Th Zr, and Ti is exothermic. Surprisingly, the solubility in Ti, Zr, and Th is constant, up to ca. 800 °C. Solubility and diffusivity are usually opposed: High solubility means low diffusivity and vice versa. In kinetic studies, the diffusivity of an atom reactant is the key property to consider.
The great interest in studying diffusion of hydrogen through solids 100 years ago was due to the problem of the explosion of zeppelins when transporting passengers. In the most notable disaster (Hindenburg, New Jersey, 1936), the conclusion that a static spark ignited a hydrogen leakage was widely accepted. Since 1902, many zeppelin disasters happened due to unexplained fire. Hydrogen was replaced by helium as the filling gas in the 1940s. Surprisingly, the bulk diffusion of H atoms has not been considered since the 1970s.
Boudart [10] supported the proposal of a H spillover advanced by Khobiar in 1964 [27] as well as several other distinguished authors [28,29,30,31,32]. Since 1964, that concept has been used to explain observed synergisms involving H. In our perspective, that model is not correct. Spillover is just an illusion.
The effect of H in carbon formation seems to be a mystery for many scientists. An important reason for that mystery is the fact that, in carbon formation from hydrocarbons below 500 °C, the presence of H2 is required but the reaction order is 0. The explanation for this behavior is the fact that the rate determining step prevailing is the bulk diffusion of carbon atoms through the catalyst particle (see Figure 2). The other step, surface reaction decomposition, is fast and not rate-controlling and so it is “kinetically invisible”. However, H2 is required: Without H2 there is no C formation catalysis. Kinetic studies of volcano-type changes of rate determining steps for Co, Ni, and Fe/steel proved that, as discussed above.
Recent use of Pd-doped multi-walled CNTs to enhance hydrogen uptake has been reported. Doped CNTs showed hydrogen adsorption and desorption at low temperatures (38 °C) while un-doped CNTs showed increased hydrogen adsorption-desorption at around 600 °C. This low temperature behavior is similar to the study by Jing, Liu et al. [21] mentioned above. The formation of alloy systems of hydrogen and metals at low temperatures was studied in the 1930s and is also summarized in Barrer’s book [26]. Budnikov and Ginstling also summarized the important advances in solid-state chemistry in the period between 1920–1970 [33]. The scientific approach was based mostly on studying the kinetic behavior: A very effective route to understanding the details of the mechanism operating.
The study of alternatives for hydrogen storage capacity is a now a priority. The use of multi-walled carbon nanotubes is being tested. In a recent study following a supercritical CO2 deposition method, a Pd doping led to a substantial H storage capacity increase [34,35]. Understanding the H atoms storage and bulk diffusion is important for the advancement of science and technology.
4. Conclusions
1. The mechanism carbon formation operating at low temperatures (350–550 °C) is more clearly explained based on detailed kinetic studies performed earlier (Figure 2). The rate increases with increasing temperature up to ~500 °C but decreases above that. The “volcano shape” of the Arrhenius plot is explained.
2. Optimizing the industrial production of carbon nanotubes is an important objective. Knowing the mechanisms that are operating helps to control properties, optimize production, and reduce costs more easily. We get very valuable information to get fast CNTs growth at relatively low temperatures.
3. The catalytic synergism observed using Pt or Pd added to Ni, Co, or Fe is understood by adopting a H atoms bulk diffusion mechanism, as researched in solid-state chemistry studies 100 years ago.
The interaction between formed graphene and the metal particle is essential for effective carbon growth catalysis (routes I and II). Similarly, in the carbon gasification carbon/catalyst particle, effective contact is essential. Operating above the Tammann temperature of the metal is required in that case [36,37]. Operating above the Tammann temperature is also required for bamboo-like carbon formation growth [38].
Acknowledgments
I acknowledge Carlos Bernardo for using data from his thesis and revising this paper.
Conflicts of Interest
The authors declare no conflict of interest.
References
- Lobo, L.S. Catalytic carbon formation: Clarifying the alternative kinetic routes and defining a kinetic linearity for sustained growth concept. Reac. Kinet. Mech. Catal. 2016, 118, 393–414. [Google Scholar] [CrossRef]
- Lobo, L.S. Nucleation and growth of carbon nanotubes and nanofibers: Mechanism and catalytic geometry control. Carbon 2017, 114, 411–417. [Google Scholar] [CrossRef]
- Lobo, L.S.; Trimm, D.L. Complex temperature dependencies of rate of carbon deposition on nickel. Nat. Phys. Sci. 1971, 234, 15–16. [Google Scholar] [CrossRef]
- Puretzky, A.A.; Merkulov, I.A.; Rouleau, C.M.; Eres, G.; Geohegan, D.B. Revealing the surface and bulk regimes of isothermal graphene nucleation and growth on Ni with in situ kinetic measurements and modeling. Carbon 2014, 79, 256–264. [Google Scholar] [CrossRef] [Green Version]
- Bernardo, C.A.; Lobo, L.S. Kinetics of Carbon Formation from acetylene and 1-Butene on Cobalt. In Studies in Surface Science and Catalysis; Delmon, B., Froment, G., Eds.; Elsevier: Amsterdam, The Netherlands, 1980; pp. 409–420. [Google Scholar]
- Figueiredo, J.L. Carbon Formation in Steam Reforming Catalysts. Ph.D. Thesis, Imperial College, London, UK, 1975. [Google Scholar]
- Lobo, L.S.; Franco, M.D. Kinetics of catalytic carbon formation on steel surfaces from light hydrocarbons. Catal. Today 1990, 7, 247–256. [Google Scholar] [CrossRef]
- Koziol, K.K.; Ducati, C.; Windle, A.H. Carbon nanotubes with catalyst controlled chiral angle. Chem. Mater. 2010, 22, 4904–4911. [Google Scholar] [CrossRef]
- Lobo, L.S. Carbon Formation from Hydrocarbons on Metals. Ph.D. Thesis, Imperial College, London, UK, 1971. Available online: http://hdl.handle.net/10044/1/16515 (accessed on 18 April 2019).
- Boudart, M.; Djéga-Mariadassou, G. Kinetics of Heterogeneous Catalytic Reactions; Princeton University Press: Princeton, NJ, USA, 1984. [Google Scholar]
- Bernardo, C.A. Carbon Deposition and gasification in the context of nickel catalysts. Ph.D. Thesis, Imperial College, London, UK, 1977. [Google Scholar]
- Bernardo, C.A.; Lobo, L.S. Kinetics of carbon formation from acetylene on nickel. J. Catal. 1975, 37, 267–278. [Google Scholar] [CrossRef]
- Engel, T.; Ertl, G. A molecular beam investigation of the catalytic oxidation of CO on Pd (111). J. Chem. Phys. 1978, 69, 1267. [Google Scholar] [CrossRef]
- Harris, P. Carbon Nanotube Science; Cambridge University Press: Cambridge, UK, 2011. [Google Scholar]
- Zaikovski, V.I.; Chesnokov, V.V.; Buyanov, R.A. The relationship between the state of active species in a ni/al2o3 catalyst and the mechanism of growth of filamentous carbon. Kinet. Catal. 2001, 42, 803–820. [Google Scholar] [CrossRef]
- Latorre, N.; Romeo, E.; Villacampa, J.I.; Cazaña, F.; Royo, C.; Monzón, A. Kinetics of carbon nanotubes growth on a Ni-Mg-Al catalyst by CCVD of methane: Influence of catalyst deactivation. Catal. Today 2010, 154, 217–223. [Google Scholar] [CrossRef]
- Puretzky, A.A.; Geohegan, D.B.; Jesse, S.; Ivanov, I.N.; Eres, G. In situ measurements and modeling of carbon nanotubes array growth kinetics during CVD. Appl. Phys. A 2005, 81, 223–240. [Google Scholar] [CrossRef]
- Kharlamova, M.V. Investigation of growth dynamic of carbon nanotubes. Bielstein J. Nanotechnol. 2017, 8, 826–856. [Google Scholar] [CrossRef] [PubMed]
- Rahman, G.; Najaf, Z.; Mehmood, A.; Bilal, S.; Shah, A.; Mian, S.; Ali, G. An Overview of the recent progress in the synthesis and applications of carbon nanotubes. C J. Carbon Res. 2019, 5, 3. [Google Scholar] [CrossRef]
- Eres, G.; Kinkhabwala, A.A.; Cui, H.; Geohegan, D.B.; Puretzky, A.A.; Lowndes, D.H. Molecular beam-controlled nucleation and growth of vertically aligned single-wall carbon nanotube arrays. J. Phys. Chem. B 2005, 109, 16684–16694. [Google Scholar] [CrossRef] [PubMed]
- Jing, P.; Gan, T.; Zheng, B.; Chu, X.; Yu, G.; Yan, W.; Zou, Y.; Zhang, W.; Liu, G. Synergism of Pt nanoparticles and iron oxide support for chemoselective hydrogenation of nitroarenes under mild conditions. Chin. J. Catal. 2019, 40, 214–222. [Google Scholar] [CrossRef]
- Atwater, M.A.; Phillips, J.; Leseman, Z.C. Accelerated growth of carbon nanofibers using physical mixtures and alloys of Pd and Co in an ethelyne-hydrogen environment. Carbon 2011, 49, 1058–1066. [Google Scholar] [CrossRef]
- Teng, I.J.; Huang, C.S.; Hsu, H.L.; Chung, I.C.; Jian, S.R.; Kherani, N.P.; Kuo, C.Z.; Juang, J.Y. On the use of new oxidized Co-Cr-Pt-O catalysts for vertically aligned few-walled carbon nanotube forest synthesis in electron cyclotron resonance CVD. Carbon 2014, 80, 808–822. [Google Scholar] [CrossRef]
- Weigle, J.C.; Phillips, J. Modelling hydrogen spillover in dual bed catalytic reactors. AIChE J. 2004, 50, 821–828. [Google Scholar] [CrossRef]
- Guerrero-Ruiz, A.; Rodriguez-Ramos, I. (Eds.) Spillover and Mobility of Species on Solid Surfaces. In Studies in Surface Science and Catalysis; Elsevier: Amsterdam, The Netherlands, 2001. [Google Scholar]
- Barrer, R.M. Diffusion in and Through Solids; Cambridge University Press: Cambridge, UK, 1941. [Google Scholar]
- Khoobiar, S. Particle to particle migration of hydrogen atoms on platinum-alumina catalysts from particle to neighboring particles. J. Phys. Chem. 1964, 68, 411. [Google Scholar] [CrossRef]
- Verhoeven, W.; Delmon, B. Actions des Metaux Etrangers Divisés sur la Reduction de l’Oxyde de Nickel par l’Hydrogène. C.R. Acad. Sci. 1966, 262, 33. [Google Scholar]
- Delmon, G.F. Froment. Remote control of catalytic sites by spillover species: a chemical reaction engineering approach. Catal. Rev: Sci. Eng. 1996, 38, 1. [Google Scholar] [CrossRef]
- Inui, T. (Ed.) Studies in Surface Science and Catalysis. In New Aspects of Spillover Effect in Catalysis; Elsevier: Amsterdam, The Netherlands, 1993. [Google Scholar]
- Prinz, R. Hydrogen spillover. facts and fiction. Chem. Rev. 2012, 112, 2714–2738. [Google Scholar] [CrossRef]
- Beaumont, S.K.; Alayoglu, S.; Specht, C.; Kruse, N.; Somorjai, G.A. A Nanoscale demonstration of hydrogen atom spillover and surface diffusion across silica using the kinetics of co2 methanation catalyzed on spatially separate pt and co nanoparticles. Nano Lett. 2014, 14, 4792. [Google Scholar] [CrossRef]
- Budnikov, P.P.; Ginstling, A.M. Principles of Solid State Chemistry, Reactions in Solids; Gordon & Breach Science Publishers Inc.: Philadelphia, PA, USA, 1968. [Google Scholar]
- Erunal, E.; Ulusl, F.; Aslan, M.Y.; Guzel, B.; Uner, D. Enhancement of hydrogen storage capacity of MWCNTs with Pd doping prepared through supercritical CO2 deposition method. Int. J. Hydrog. Energy 2018, 43, 10755–10764. [Google Scholar] [CrossRef]
- Carraro, P.M.; Garcia Blanco, A.A.; Lener, G.; Barrera, D. Nanostructured carbons modified with nickel potential novel reversible hydrogen storage materials: Effects on nickel particle size. Microporous Mesoporous Mater. 2019, 273, 50–59. [Google Scholar] [CrossRef]
- Lobo, L.S. Intrinsic kinetics in carbon gasification. Understanding linearity, “nanoworms” and alloy catalysts. Appl. Catal. B: Environ. 2014, 148, 136–143. [Google Scholar] [CrossRef]
- Lobo, L.S.; Carabineiro, S.A.C. Kinetics and mechanism of catalytic carbon gasification. Fuel 2016, 183, 157–469. [Google Scholar] [CrossRef]
- Lobo, L.S. Bamboo-like carbon fibers growth mechanism. Relevance of catalyst’s Tammann temperature. Submitted to C. 2019. [Google Scholar]
Figure 1.
Arrhenius plots record showing three catalytic alternative routes operating in a carbon formation from hydrocarbons. Reaction orders indicated. Left side is colored grey to show the gas phase pirolytic carbon formed at T > 625 °C.
Figure 1.
Arrhenius plots record showing three catalytic alternative routes operating in a carbon formation from hydrocarbons. Reaction orders indicated. Left side is colored grey to show the gas phase pirolytic carbon formed at T > 625 °C.

Figure 2.
Arrhenius plots of the rates of C formation on Ni, Co, and steel foils [3,5,7]. Rates of C growth (µg/cm2·min) vs. reciprocal temperature (1/T) × 10−3 (K−1).

Figure 3.
Nucleation and growth alternatives: Top nucleation and growth (a) vs. bottom nucleation and growth (b). The mechanism is just the same. Once a nucleation occurs, the carbon concentration inside the particle is reduced. No further nucleation occurs on other regions of the particle. The two reaction steps are the surface gas decomposition (at S1) and the C bulk diffusion flux to the nucleation and growth regions (at S2).

Figure 4.
Nucleation and growth of an initial graphene layer on a Ni (111) nanoparticle surface. The graphene layer growth at the borders goes on by bending down. Six pentagons must form at six corners, in a perfect hexagon, or differently when the flat crystal face is oval. Example shown: Two pentagons form in the row, reaching the border earlier (P) and four pentagons in next row (P′).

Figure 5.
Carbon deposition on nickel foils: Complex temperature dependencies in the range 350–750 °C [6]. Carbon bulk diffusion (Rc) through the catalyst particles is the rate-controlling step at lower temperatures. Langmuir–Hinshelwood surface reactions (Rs) are rate-controlling at higher temperatures.

Figure 6.
Scheme showing the Arrhenius plot observed in carbon formation from olefins (O) and hydrogen (H) on Ni under various pressures, as indicated (po-olefin, pH-hydrogen). The negative apparent activation energy Ea observed above 550 °C is due to the surface reaction controlling the rate with negative values of the reactant’s adsorption enthalpies (Ea = E + ∆HO + ∆HH) and reaction orders: x = 1, y = 1 [9].

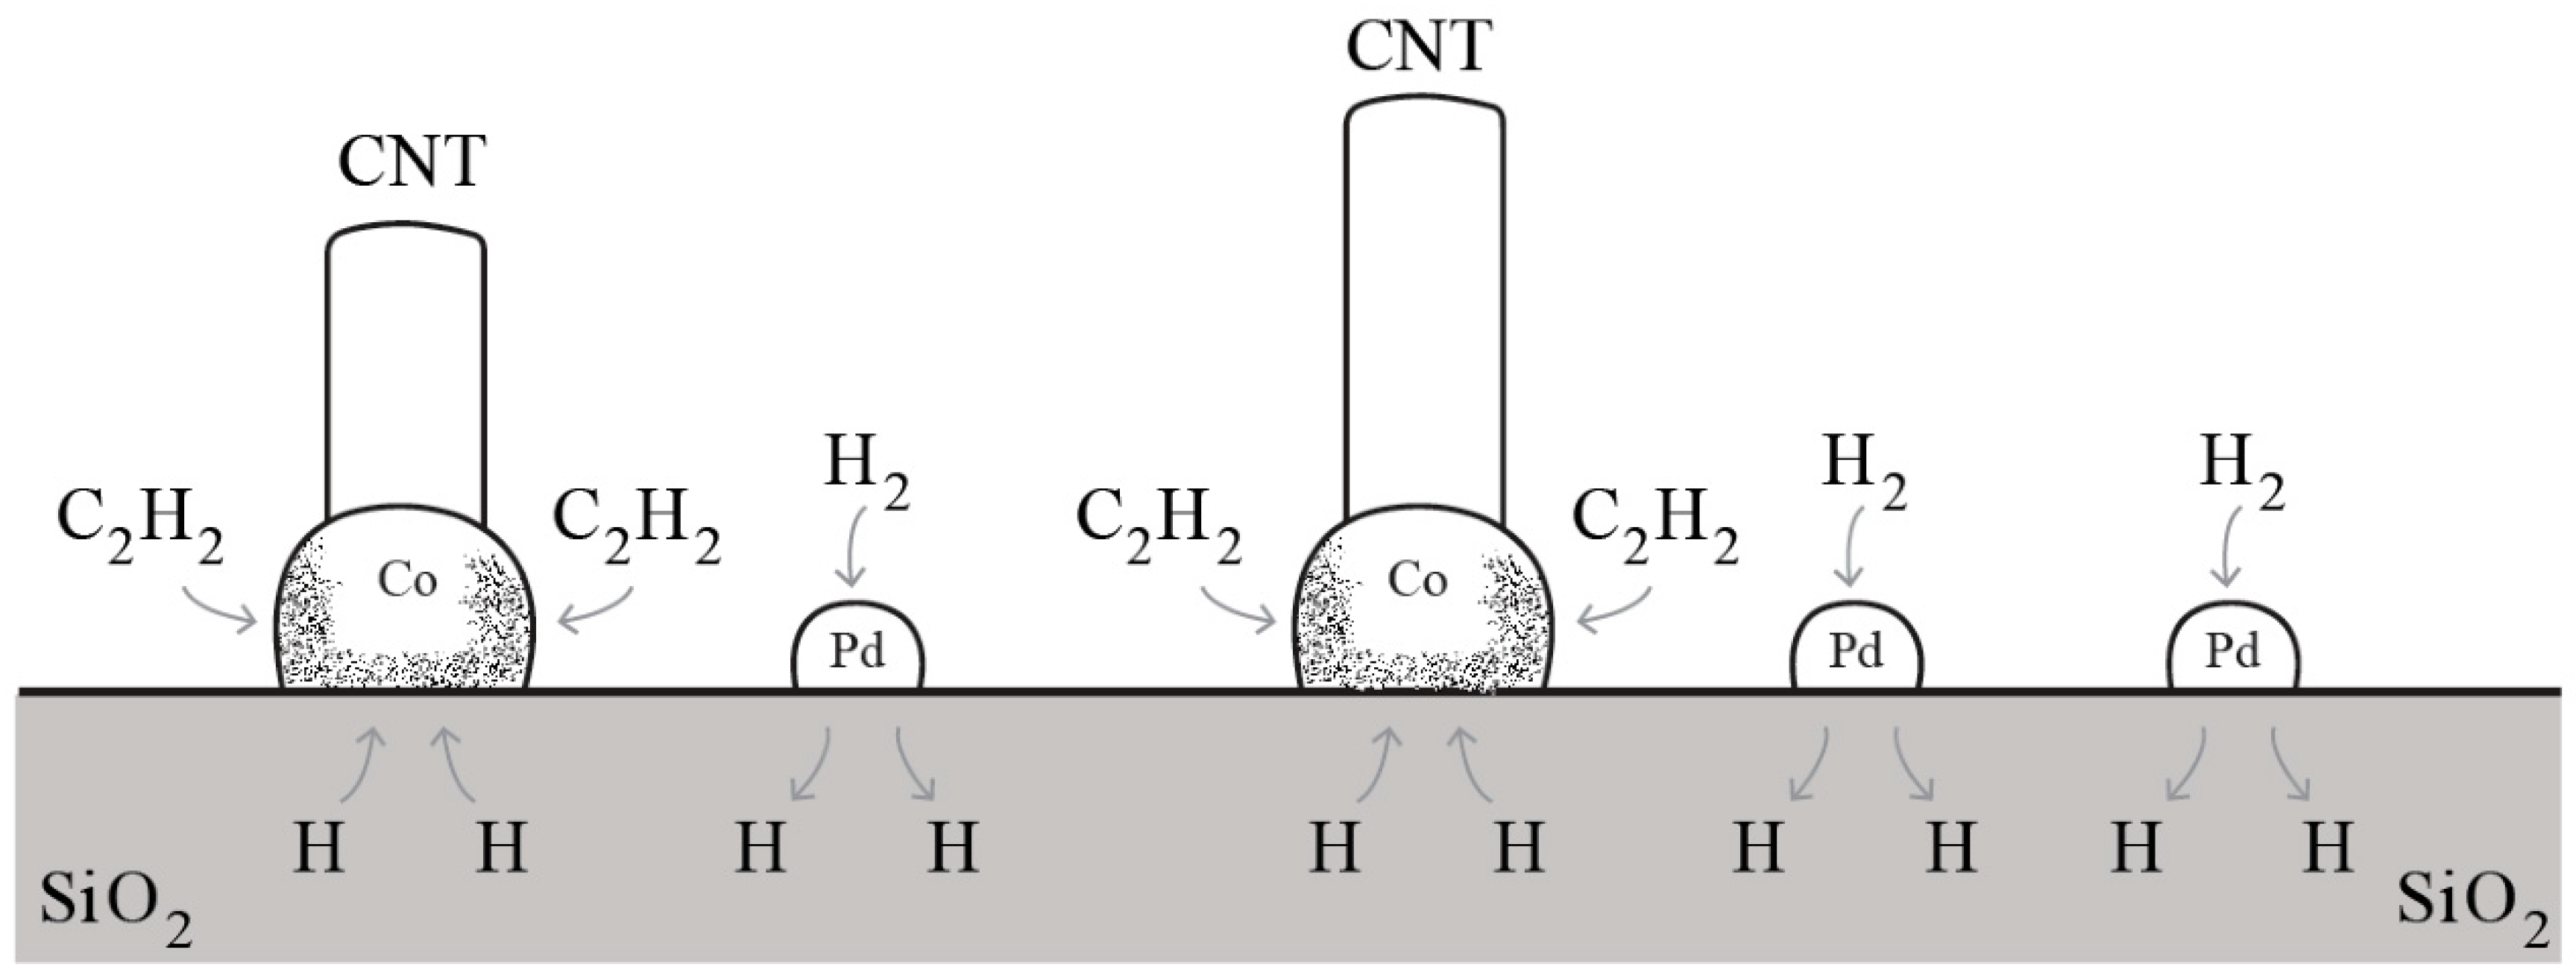
Figure 7.
Effect of H2 splitting by Pd nanoparticles and diffusion of H atoms to the CO particle surface, accelerating the rate of formation of C atoms from C2H2 decomposition and the rate of CNTs growth.
Figure 7.
Effect of H2 splitting by Pd nanoparticles and diffusion of H atoms to the CO particle surface, accelerating the rate of formation of C atoms from C2H2 decomposition and the rate of CNTs growth.


Table 1.
Summary of the three different routes of graphene formation from hydrocarbons prevailing over different temperature ranges [1,2]; (*) 700–1100 °C.
| Catalytic Routes | T Range | Gas Phase Reactions | Surf Catalysis | Carbon Diffusion | Nucleation, Initial Growth |
|---|---|---|---|---|---|
| I Catalytic | Low T 300–550 °C | None or negligible | Yes | Through catalyst nanoparticle | On catalyst surface Ex: Ni (111) |
| II Hybrid | Medium T 550–700 °C | Pyrolysis: C black. No gas changes | No | Through catalyst nanoparticle | On catalyst surface Ex: Mo |
| III Pirolytic | High T >700 (*) °C | Pyrolysis: C black. Gas changes | No | Moving over previous layer of graphene | Over previous graphene layer |
Table 2.
Carbon formation on Ni foils. Negative activation energies observed in the surface reaction-step controlling region (Route I) with different hydrocarbons [8]; 1 Torr = 1.33 mbar. Gas purity: 99.9%.
Table 2.
Carbon formation on Ni foils. Negative activation energies observed in the surface reaction-step controlling region (Route I) with different hydrocarbons [8]; 1 Torr = 1.33 mbar. Gas purity: 99.9%.
| Reactant Gas | P, Gas (torr) | P, H2 (torr) | Ea (Kcal/mole) |
|---|---|---|---|
| C3H6 | 100 | 25 | −79 |
| C3H6 | 25 | 25 | −33 |
| C2H2 | 82 | 345 | −53 |
| C2H4 | 82 | 68 | −75 |
| 1-C4H8 | 30 | 250 | −64 |
Table 3.
Orders of reaction observed (Route I, surface reaction-step controlling region): Order 1 at low pressures, order 0 at higher pressures (Langmuir–Hinshelwood mechanism) [10].
Table 3.
Orders of reaction observed (Route I, surface reaction-step controlling region): Order 1 at low pressures, order 0 at higher pressures (Langmuir–Hinshelwood mechanism) [10].
| Temp | Gas Pressure, Torr | PH2 (torr) | Orders | |||
|---|---|---|---|---|---|---|
| /°C | C2H2 | C2H4 | C4H8 | H2 | Hydr. | |
| 600 | 3–12 | - | - | 50 | - | 1 |
| 600 | 12.0 | - | - | 44–52 | ~0 | - |
| 625 | - | 8–13 | - | 9.5 | - | 1 |
| 625 | - | 13.0 | - | 9–14 | 1 | - |
| 625 | - | 13.0 | - | 50–66 | ~0 | - |
| 625 | - | - | 31–62 | 8 | 0 | - |
| 625 | - | - | 32.5 | 4–25 | - | 1 |
© 2019 by the author. Licensee MDPI, Basel, Switzerland. This article is an open access article distributed under the terms and conditions of the Creative Commons Attribution (CC BY) license (http://creativecommons.org/licenses/by/4.0/).
Share and Cite
MDPI and ACS Style
Lobo, L.S. Mechanism of Catalytic CNTs Growth in 400–650 °C Range: Explaining Volcano Shape Arrhenius Plot and Catalytic Synergism Using both Pt (or Pd) and Ni, Co or Fe. C 2019, 5, 42. https://0-doi-org.brum.beds.ac.uk/10.3390/c5030042
AMA Style
Lobo LS. Mechanism of Catalytic CNTs Growth in 400–650 °C Range: Explaining Volcano Shape Arrhenius Plot and Catalytic Synergism Using both Pt (or Pd) and Ni, Co or Fe. C. 2019; 5(3):42. https://0-doi-org.brum.beds.ac.uk/10.3390/c5030042
Chicago/Turabian StyleLobo, Luis Sousa. 2019. "Mechanism of Catalytic CNTs Growth in 400–650 °C Range: Explaining Volcano Shape Arrhenius Plot and Catalytic Synergism Using both Pt (or Pd) and Ni, Co or Fe" C 5, no. 3: 42. https://0-doi-org.brum.beds.ac.uk/10.3390/c5030042
Note that from the first issue of 2016, this journal uses article numbers instead of page numbers. See further details here.