Insights into the Electrochemical Behavior of Mercury on Graphene/SiC Electrodes


1
Semiconductor Materials, Department of Physics, Chemistry and Biology-IFM, Linköping University, S-58183 Linköping, Sweden
2
Frantsevich Institute for Problems of Materials Science, NASU—National Academy of Sciences of Ukraine, 142 Kyiv, Ukraine
3
Division of Physics and Electronics, Department of Science and Technology, Physics and Electronics-ITN, Linköping University, SE-58183 Linköping, Sweden
*
Author to whom correspondence should be addressed.
C 2019, 5(3), 51; https://0-doi-org.brum.beds.ac.uk/10.3390/c5030051
Submission received: 24 July 2019
/
Revised: 13 August 2019
/
Accepted: 20 August 2019
/
Published: 22 August 2019
(This article belongs to the Special Issue Optical and Electronic Properties of Carbon-Based Nanomaterials and Composites)
Abstract
:Fast and real time detection of Mercury (Hg) in aqueous solutions is a great challenge due to its bio-accumulative character and the detrimental effect on human health of this toxic element. Therefore, development of reliable sensing platforms is highly desirable. Current research is aiming at deep understanding of the electrochemical response of epitaxial graphene to Mercury exposure. By performing cyclic voltammetry and chronoamperometry measurements as well as density functional theory calculations, we elucidate the nature of Hg-involved oxidation-reduction reactions at the graphene electrode and shed light on the early stages of Hg electrodeposition. The obtained critical information of Hg behavior will be helpful for the design and processing of novel graphene-based sensors.
1. Introduction
Extensive anthropogenic activities (agriculture, heavy industry) are causing increased pollution of potable water sources, soil, and air with toxic substances, such as volatile organic compounds (VOCs) [1,2], pesticides [3,4], and heavy metals [5,6]. The most prominent consequence of mentioned pollution is contamination of food products such as fish [7], vegetables [8], and meat [9] via introduction of the listed pollutants in the ground and sea water, causing enhanced mortality and other health effects in poisoned humans. Among others, mercury (Hg) is regarded as one of the most toxic chemical elements [10] since long-term exposure to its complexes may result in memory problems [11], muscle weakness [12], kidney diseases [13], acrodynia [14], brain dysfunction [15], and inhibition of the human thioredoxin system [16]. Regarding Hg poisoning, it is imperative to develop viable preventive strategies towards its fast and real-time recognition in water followed by its complete removal. In this context, international community and governmental agencies in different countries have developed strict requirements concerning the acceptable limit of Hg2+ in drinking water, varying from 5.0 to 30.0 nM [17,18]. Therefore, it is natural that detection systems for reliable mercury sensing have been extensively developed during last decades [19,20]. Apart from the traditional analytical methods for Hg2+ detection (atomic absorption/fluorescence spectroscopy, inductively coupled plasma mass spectrometry, liquid chromatography-mass spectrometry [21]) and highly sensitive amperometric methods exploiting field-effect transistor (FET)-type discriminative sensors [22,23,24,25] that usually require complicated sample/device preparation procedures, electrochemical methods are more convenient ways to facilitate real-time monitoring of mercury at nanoconcentrations below permissible levels and have therefore attracted widespread attention due to their portability and simplicity [26,27]. In this regard, great efforts have been made to find an appropriate working electrode material—the main component of the typical electrochemical system—which is mainly responsible for the sensing performance. To be more exact, to attain a high sensitivity, the surface of such an electrode should provide a large enough number of electrochemically active sites available to accommodate and bind as many Hg species as possible.
Graphene and its derivatives, namely graphene quantum dots (GQDs), graphene oxide (GO), and reduced graphene oxide (rGO), have been demonstrated as unique low-dimensional materials which are capable of sensing individual adsorbates, enabling detection of even single-electron charge transfer events [28]. Such properties create excellent prerequisites of exploring these materials as high performance sensors [29]. At the same time, the use of graphene-family materials for electrochemical detection of mercury primarily limits one to modification and/or functionalization of the glassy carbon electrode (GCE) to enhance the adsorption energy of Hg species and consequently the intensity of the analytical signal [30,31,32,33,34,35,36,37,38,39,40,41,42]. Although the modified GCE demonstrates good short-term reversibility and repeatability towards Hg detection, its exploitation implies additional preparation steps. Furthermore, the adhesion strength of graphene flakes placed on its surface is not clear and requires using a binder (for example, Nafion) due to a lack of dangling bonds on the GCE. Poor adhesion can be problematic for long-term stability of the working electrode. Another strategy is to exploit 4H-SiC covered with graphene (also called epitaxial graphene, Gr/SiC) as the working electrode [43]. This kind of graphene is chemically stable due to the interaction with substrate [44], but it still demonstrates the key benefits of exfoliated graphene as a sensing platform [45]. Particularly, epitaxial graphene offers a combination of advantages over other graphene-family materials (especially, CVD graphene that has, in most cases, mosaic structure with rotated domains [46,47]): large surface area, high quality of monolayer graphene, thickness uniformity, wide potential window, high signal-to-noise ratio, transfer-free technology, and direct sublimation growth without precursors [44,48,49]. Despite the fact that the basal plane of epitaxial graphene has a lower number of electroactive sites compared to graphite (high number of edge sites) and CVD graphene (highly reactive domain boundaries), the signal readout of the sensor is higher for this two-dimensional material due to its higher conductivity and lower noise in comparison to CVD graphene and multilayer graphene. In this context, a balance between graphene quality and density of the electroactive sites must be reached. All these advantages provide excellent prerequisites for development of the monolithic wafer-scale sensorics. Taking the aforementioned into account, how the Gr/SiC system responds to Hg exposure is of interest. Recently, we have been studying the electrochemical activity of Gr/SiC towards the Pb2+/Pb0 redox couple and revealed a possibility to detect critically low Pb concentrations in aqueous solutions [50,51]. Nevertheless, the behavior of Hg on epitaxial graphene has not been reported so far and, thus, any attempts to elucidate the nature of this behavior are highly demanded. Here, by performing cyclic voltammetry and chronoamperometry measurements, we extend our previous electrochemical studies to mercury with the aim to investigate the electrochemical activity of Gr/SiC towards the Hg2+/Hg0 redox reaction and to uncover the nature of the Hg kinetics during early stages of Hg electrodeposition. We believe that knowledge on Hg kinetics will be beneficial to develop an electrochemical sensing platform based on epitaxial graphene for Hg detection.
2. Materials and Methods
Epitaxial graphene on on-axis 4H-SiC (Gr/SiC) was grown through high temperature thermal decomposition of Si-face (0001)4H-SiC substrate (7 × 7 mm2) in argon atmosphere by means of an inductively heated graphite container with a well-controlled temperature profile [52]. Optical reflectance mapping [53] showed that most of the substrate surface is covered with monolayer (1 ML) graphene, whereas bilayer (2ML) graphene inclusions are rarely observed. All room-temperature electrochemical measurements were performed by using a computer-controlled potentiostat (Autolab, EcoChemie, Metrohm, Utrecht, The Netherlands). The o-ring-type three-electrode electrochemical cell consists of Gr/SiC as a working electrode, Ag/AgCl as a reference electrode, and platinum wire as a counter electrode. More details on the design of the electrochemical cell have been reported previously [54]. To gain deep insights into the redox behavior of mercury, we performed cyclic voltammetry measurements within a potential region from −0.8 V to +0.5 V in two different buffer solutions (0.01 mol·L−1 and 0.1 mol·L−1 HClO4 in Milli-Q-water) with 0.1 mM Hg2+ (purity of Hg(NO3)2 is higher than 99%). We have chosen HClO4 buffer as a model electrolyte solution to monitor the Hg redox reactions at the epitaxial graphene electrode surface. Our choice can be explained by the fact that, compared to other chemicals, the perchlorate ions (ClO4−) exhibit a noncomplexing characteristic with respect to metal cations in aqueous solutions [55,56,57]. This means that electrochemical measurements performed in the frames of the current work will exclusively provide information on Hg-involved oxidation–reduction reactions, but not on the reactions involving more complicated chemical complexes. In order to study the Hg redox behavior and kinetics at the epitaxial graphene electrode, we used the Hg concentration of 0.1 mM, which is high enough to provide an intense electrochemical signal. The scan rate was 20 mV/s. The electrochemical reactions are expected to occur at the area of 3.1 mm2. To shed light on the nature of the kinetics of Hg, we recorded the current–time transients during the early stages of Hg electrodeposition on Gr/SiC. The Scharifker–Hills methodology was applied to define the nucleation mechanism [58]. The interaction between Hg and graphene was investigated based on density functional theory (DFT) calculations performed by using Gaussian 16 Rev. B.01 package [59]. Circumcoronene (C54H18) has been chosen as a model of graphene. All calculations were carried out using PBE1PBE level of theory with empirical dispersion correction [60,61]. The 6–31G basis set was used for carbon, oxygen, and hydrogen atoms, while the basis set developed by the Stuttgart–Dresden–Bonn group (SDD) was utilized for the Hg [62]. Noncovalent interaction (NCI) analysis has been performed using the Multiwfn program to better understand the Hg–carbon bonding characteristics [63].
3. Results and Discussion
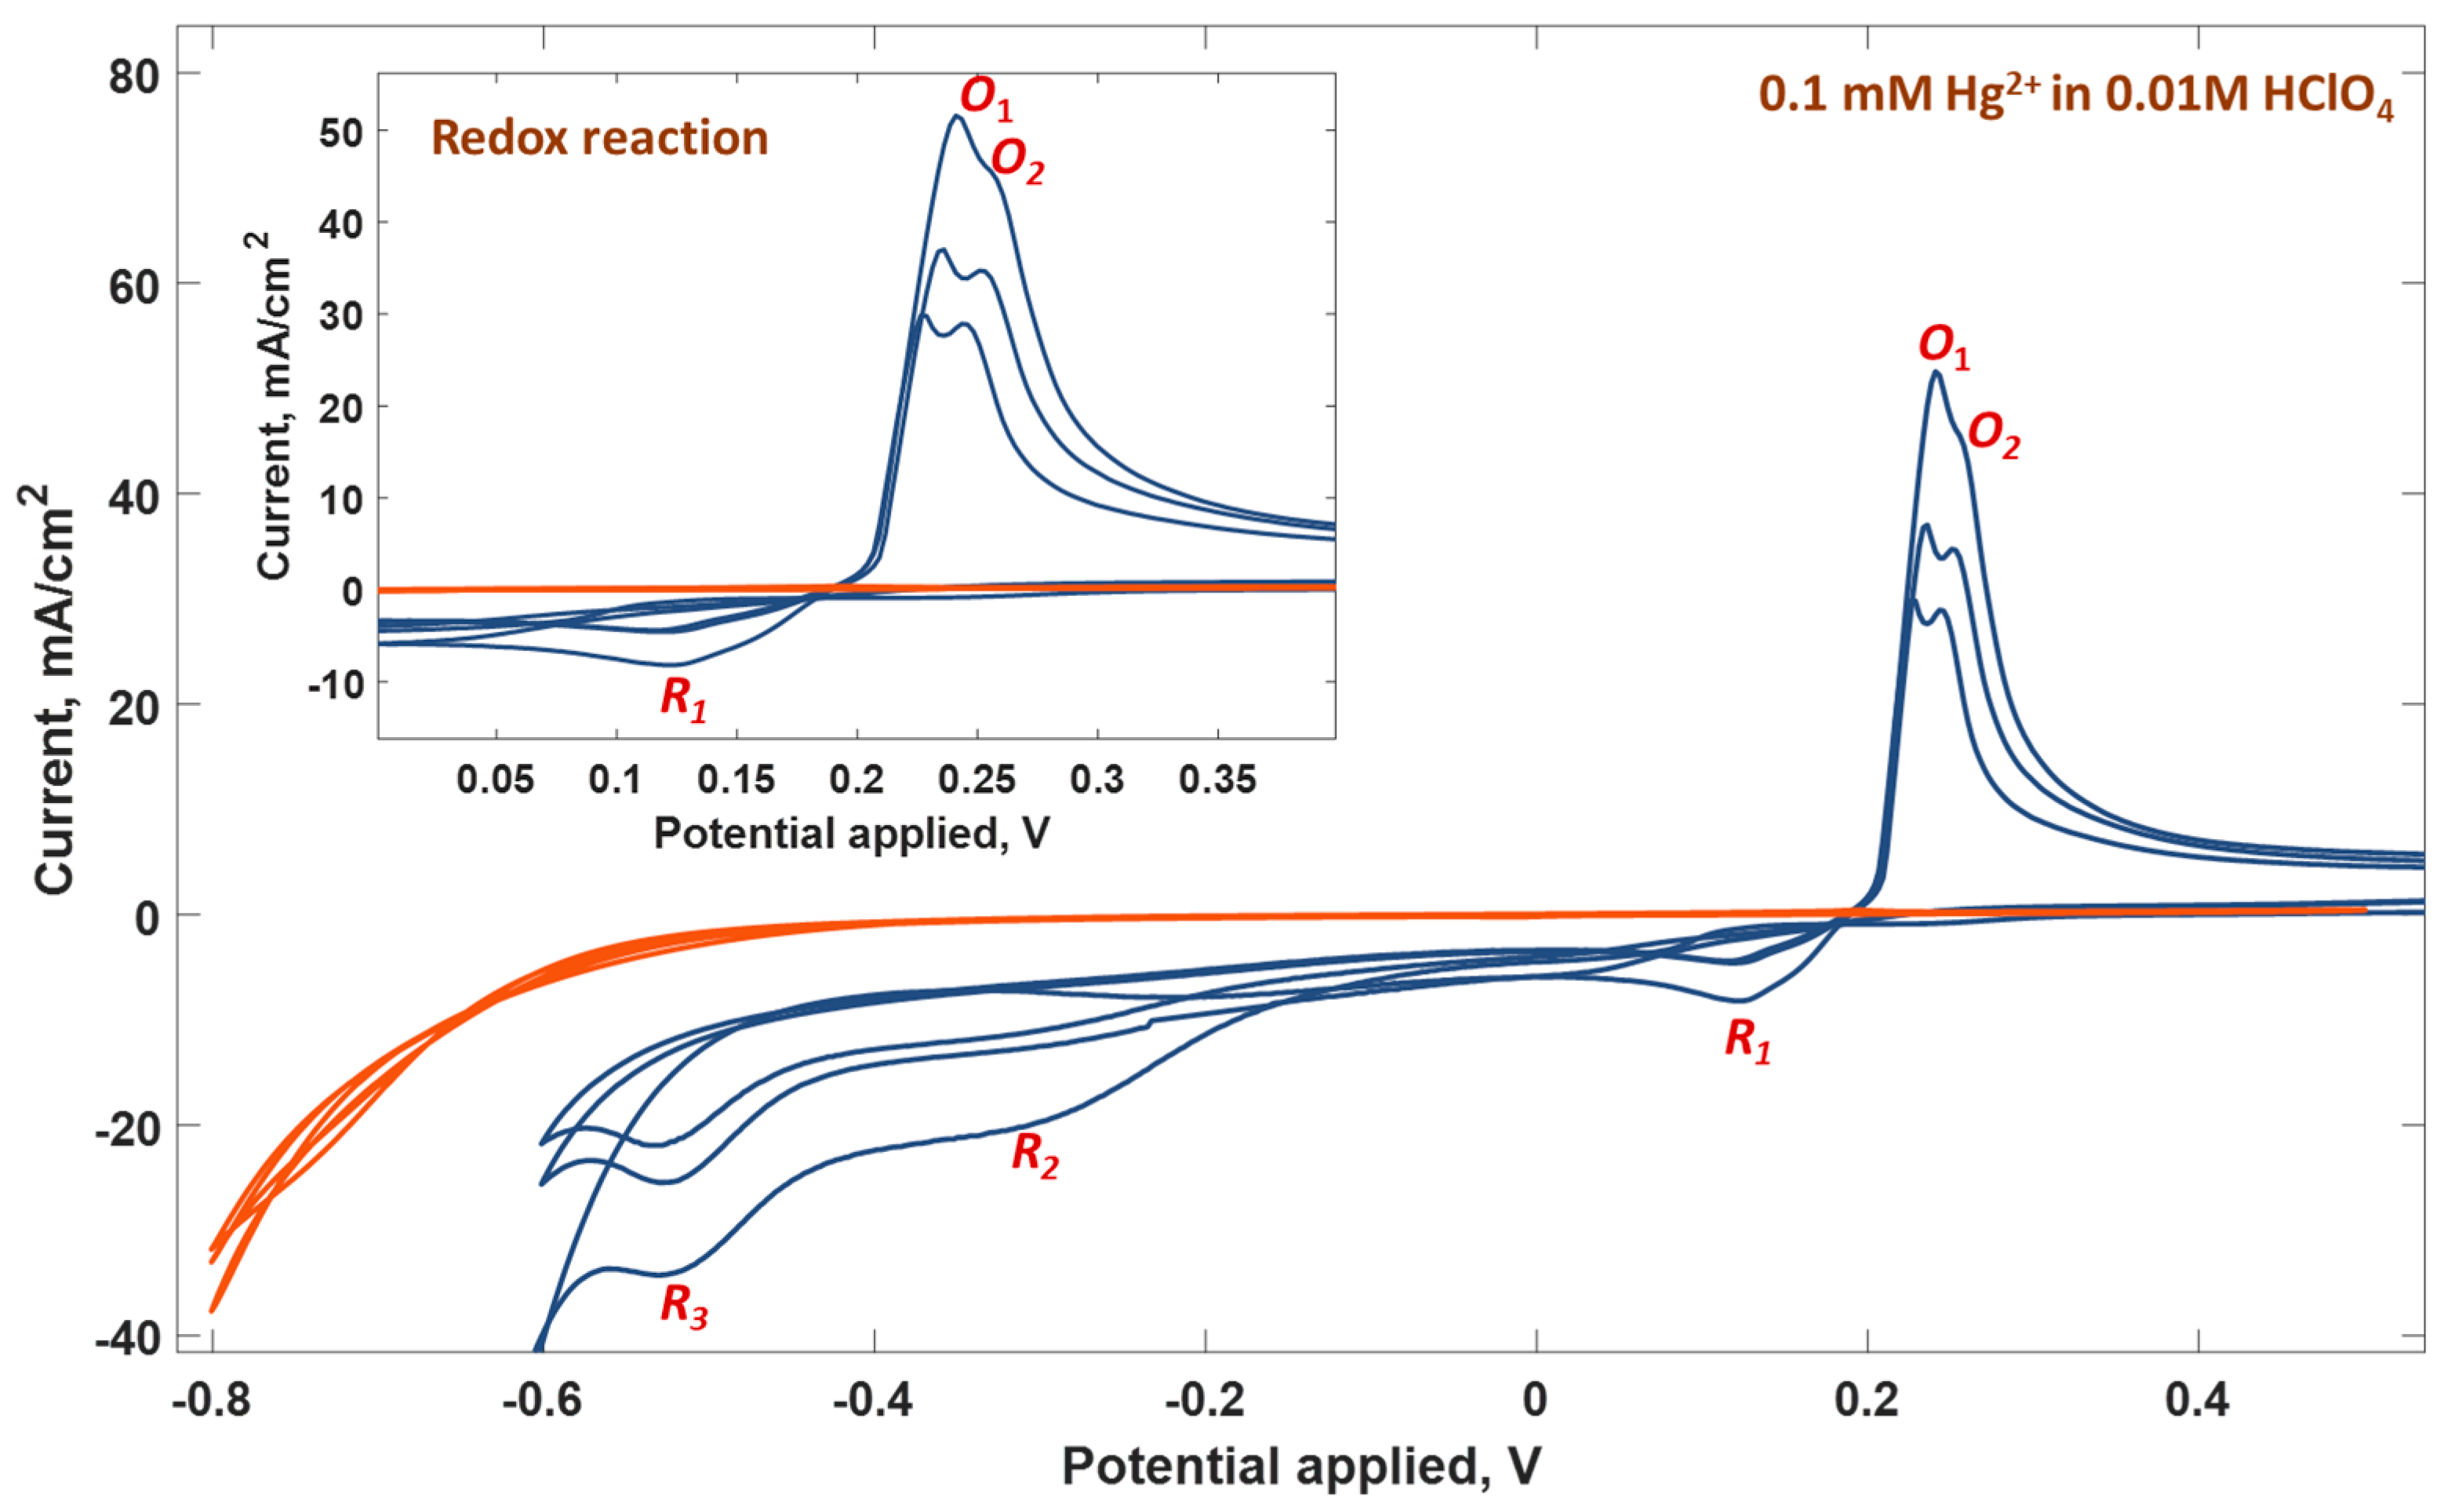
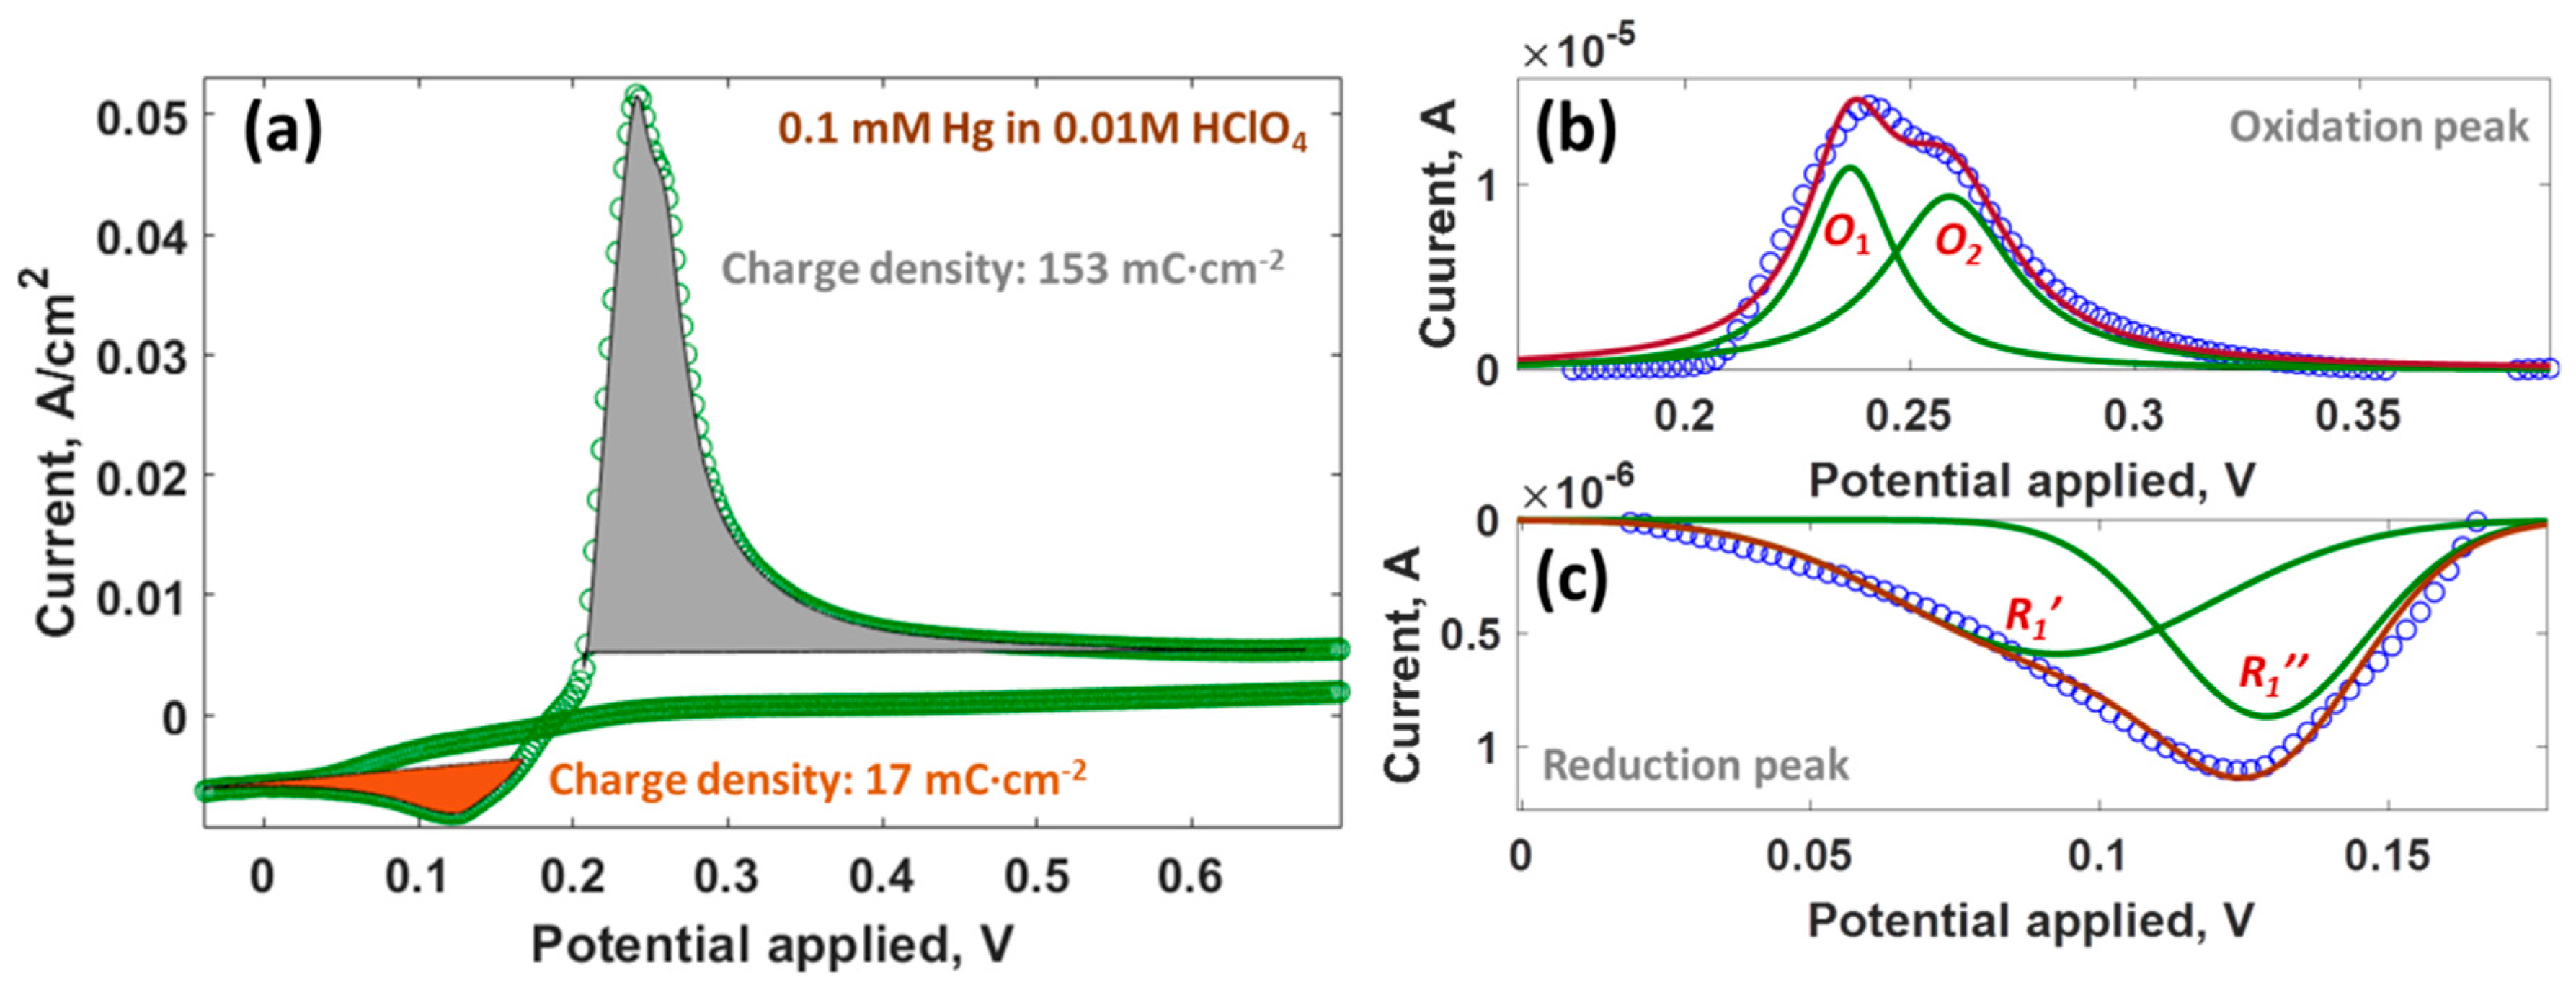
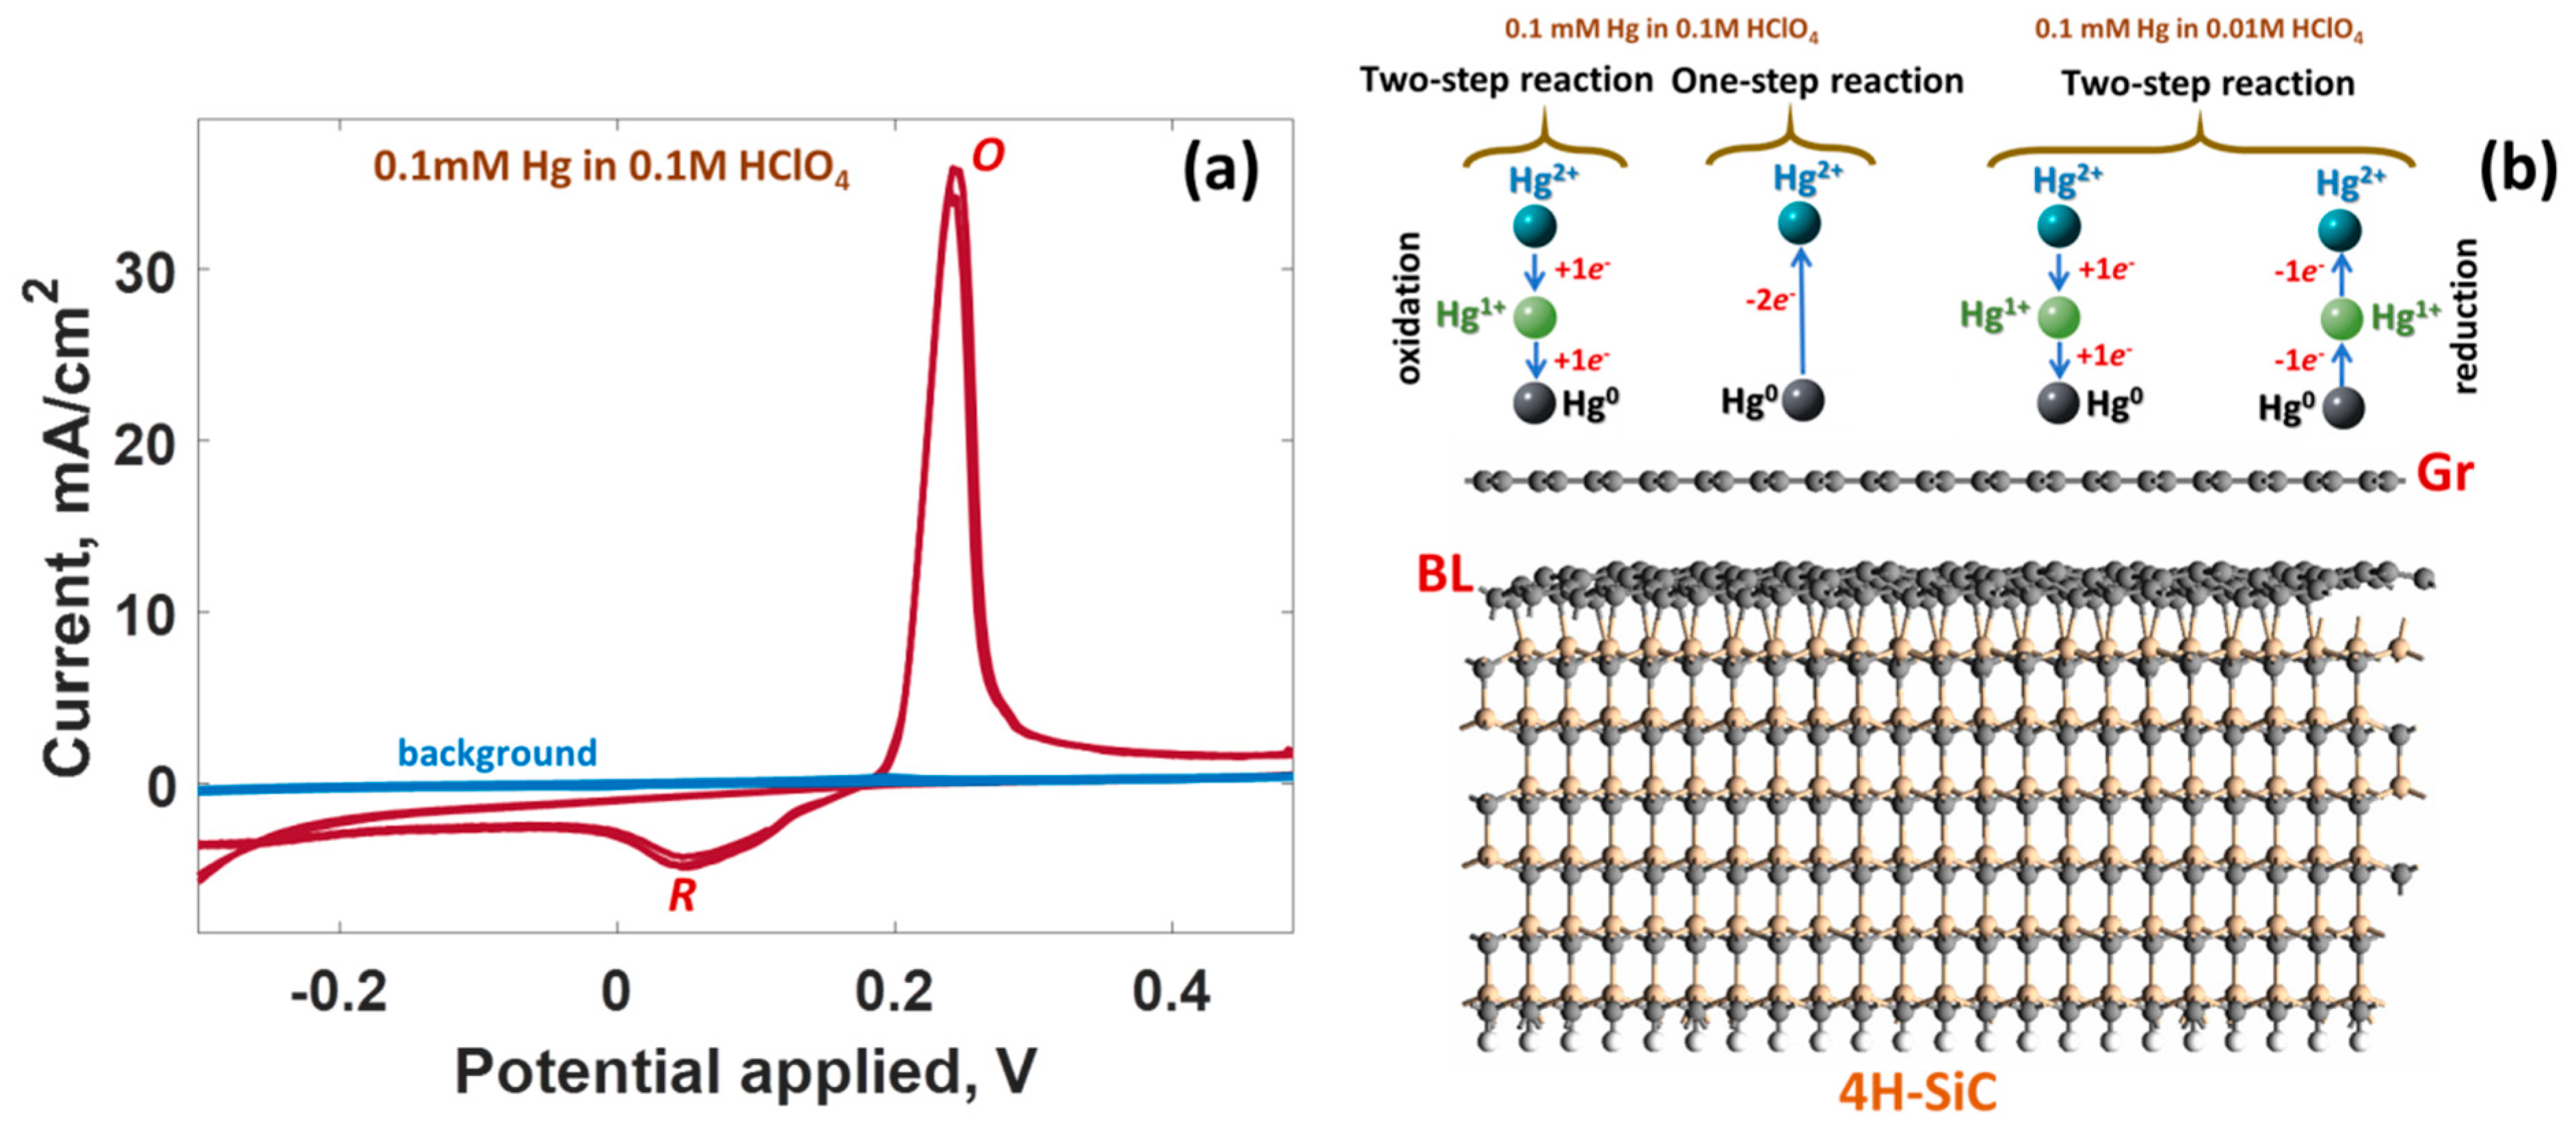
Figure 1 exhibits the voltammetric response of an epitaxial graphene electrode in solutions containing the supporting electrolyte (0.01 M HClO4) and mercury salt. An important point that can be noticed is the presence of a double layer region (between +0.5 V and −0.4 V) without any faradaic processes at the electrode immersed in pure electrolyte. A rapid increase of cathodic current occurred only below −0.6 V due to the hydrogen evolution reaction (HER) on Gr/SiC; see the deep orange colored curve in Figure 1. The 0.1 mM Hg2+ solution shows a reduction peak R1 ranging from 0 V to +0.18 V, followed by the corresponding oxidation wave in the potential range from +0.19 V to +0.42 V, which can be attributed to Hg redox reactions, see dark blue colored curve in Figure 1. The voltammogram also shows additional features (R2 plateau in the range −0.29 V to −0.41 V and R3 peak located at −0.52 V) possibly associated with overpotential deposition (opd) of Hg and oxygen electrosorption reactions [64]. The intense split oxidation peak with two distinguishable components (O1 and O2) related to Hg stripping is indicative of a two-step oxidation reaction at the electrode surface; see the inset in Figure 1 [65]. The total charge density corresponding to Hg stripping and plating can be estimated by the background-corrected integration of the area under the oxidation and reduction peaks (see Figure 2a) using the following formula:
where is cathodic and anodic surface charge density, is the scan rate, is the current density, and are the initial and final voltages, respectively. The integrated cathodic charge density of the C-V is 17 mC∙cm−2, which is significantly lower than the value of 153 mC∙cm−2 obtained for the anodic peak. The QC/QA ratio is estimated to be 8.9, which suggests electrochemically quasireversible redox reaction.
A closer look at the asymmetry of the oxidation and reduction peaks (see Figure 2b,c) enables assigning the components O1 at 0.236 V and O2 at 0.258 V for the oxidation process to two well-defined steps (Hg0 − 1e− = Hg1+ − 1e− = Hg2+), as well as R1′ at 0.09 V and R2′ at 0.128 V components for the reduction process to two one-electron steps (Hg2+ + 1e− = Hg1+ + 1e− = Hg0), respectively. Similar voltammetry response has also been observed for Hg at the partially oxidized graphene/poly(3,4-ethylenedioxythiophene):poly(styrenesulfonate) nanocomposite film-modified electrode [66], Hg at the Pt electrode [64], and Hg at the activated carbon modified glassy carbon electrode [67].
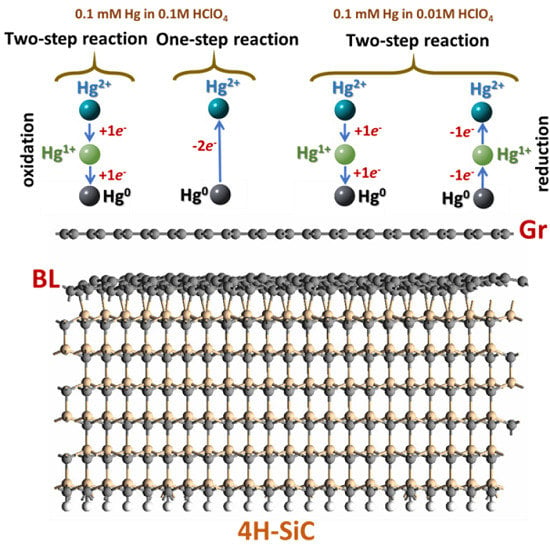
According to literature data, the redox behavior of Hg is strongly dependent on the scan rate [66] and pH level [67]. Particularly, it was shown that at high scan rates (>20 mV/s), mercury oxidation reaction takes places in two steps, which was evidenced by the presence of two oxidation peaks, while at low scan rates (<20 mV/s), the mercury stripping occurs only in one step [66]. Furthermore, Radhi et al. observed one oxidation peak in acidic electrolytes, and two oxidation peaks in alkaline solutions (at pH 8.5 to 10.5) [67]. The latter can be explained by the occurrence of two competitive oxidation processes: Hg+ − e− = Hg2+ and Hg0 − 2e− = Hg2+, respectively. Bearing this in mind, we then performed additional cycling voltammetry measurements by exploiting a higher concentration of perchloric acid in the electrolyte solution (0.1 M HClO4), but using the same Hg2+ concentration as in the initial experiment. A cyclic voltammogram recorded for 0.1 mM Hg2+ in 0.1 M HClO4 with a scan rate of 20 mV∙s−1 is shown in Figure 3a. Two distinguishable peaks associated with the redox couple of Hg2+/Hg0: cathodic peak at 0.043 V and intense anodic peak at 0.244 V, can be clearly seen, demonstrating that mercury undergoes a two-electron transfer redox reaction in more concentrated buffer solution. In this case, only one oxidation peak instead of two was observed after several cycles. The contribution of the shoulder peak is negligibly small. The reduction peak in the higher concentration of HClO4 is still quite asymmetric, possibly indicating two-step electron transfer process. Therefore, the mechanism that underlies the reduction and oxidation reaction at the epitaxial graphene surface can be expressed by the following equations:
The comparison of the one-step and two-step Hg-involved redox reactions at the epitaxial graphene electrode surface is visualized in Figure 3b. It is important to note that the peak-to-peak separation, ∆Ep, and the peak current ratio, Ipa/Ipc, are about 201 mV and 7.3, respectively. This suggests that the Hg redox process at the epitaxial graphene working electrode is an electrochemically quasireversible process [68,69]. To shed more light on the nature of the oxidation and reduction reactions, we also estimated the electron transfer rate constant for the plating and stripping process. At ∆Ep > 200 mV, the electron transfer rate constant can be calculated by means of the Klingler and Kochi relationship [70]:
where F is the Faraday constant, R is the gas constant, T is a temperature, α is the transfer coefficient (typically a value of 0.5 is assumed), D is the diffusion coefficient of oxidative (reduced) species in cm2∙s−1, n is the number of electrons transferred, v is the scan rate in V∙s−1. The unknown diffusion coefficients of the electroactive species for both oxidation and reduction process for quasireversible system at 298 K can be estimated by using Randles–Ševcik equations [68,69]:
where, and are the cathodic and anodic peak current densities in A∙cm−2, Da and Dc are the diffusion coefficients of the oxidative and reduced Hg species, C is the bulk concentration of oxidative species in solution, and A is the area of the working electrode. The estimated parameters are listed in Table 1.
It is obvious that the rate of the electron transfer for the anodic process is predicted to be higher than the rate of electron transfer for the cathodic process. As a result, the oxidative current peak is expected to increase more rapidly with increasing mercury concentration than the reduction current peak and can, therefore, be used as an analytic signal for mercury sensing in aqueous solutions. The knowledge on Hg redox reactions and kinetics on pristine epitaxial graphene can be considered as a starting point for further investigation and development of an epitaxial graphene-based sensing platform for real-time detection of mercury. Regarding selectivity, information on the correct positions of the Hg-related reduction and oxidation peaks is of great technological importance, since it can be helpful to design the sensors, which will be cross-sensitive to specific heavy metals. This is due to the fact that each metal has unique redox potential. Therefore, electrochemical measurements (square wave anodic stripping voltammetry, for instance) will enable one to distinguish between different metals. To be more specific, in the case of the epitaxial graphene working electrode, the corresponding oxidation peaks for the three most toxic heavy metals, namely Cd, Hg, and Pb, are located at −0.79 V, 0.24 V, and −0.43 V [50,71], which creates excellent prerequisites for discriminative analysis without overlapping redox peaks.
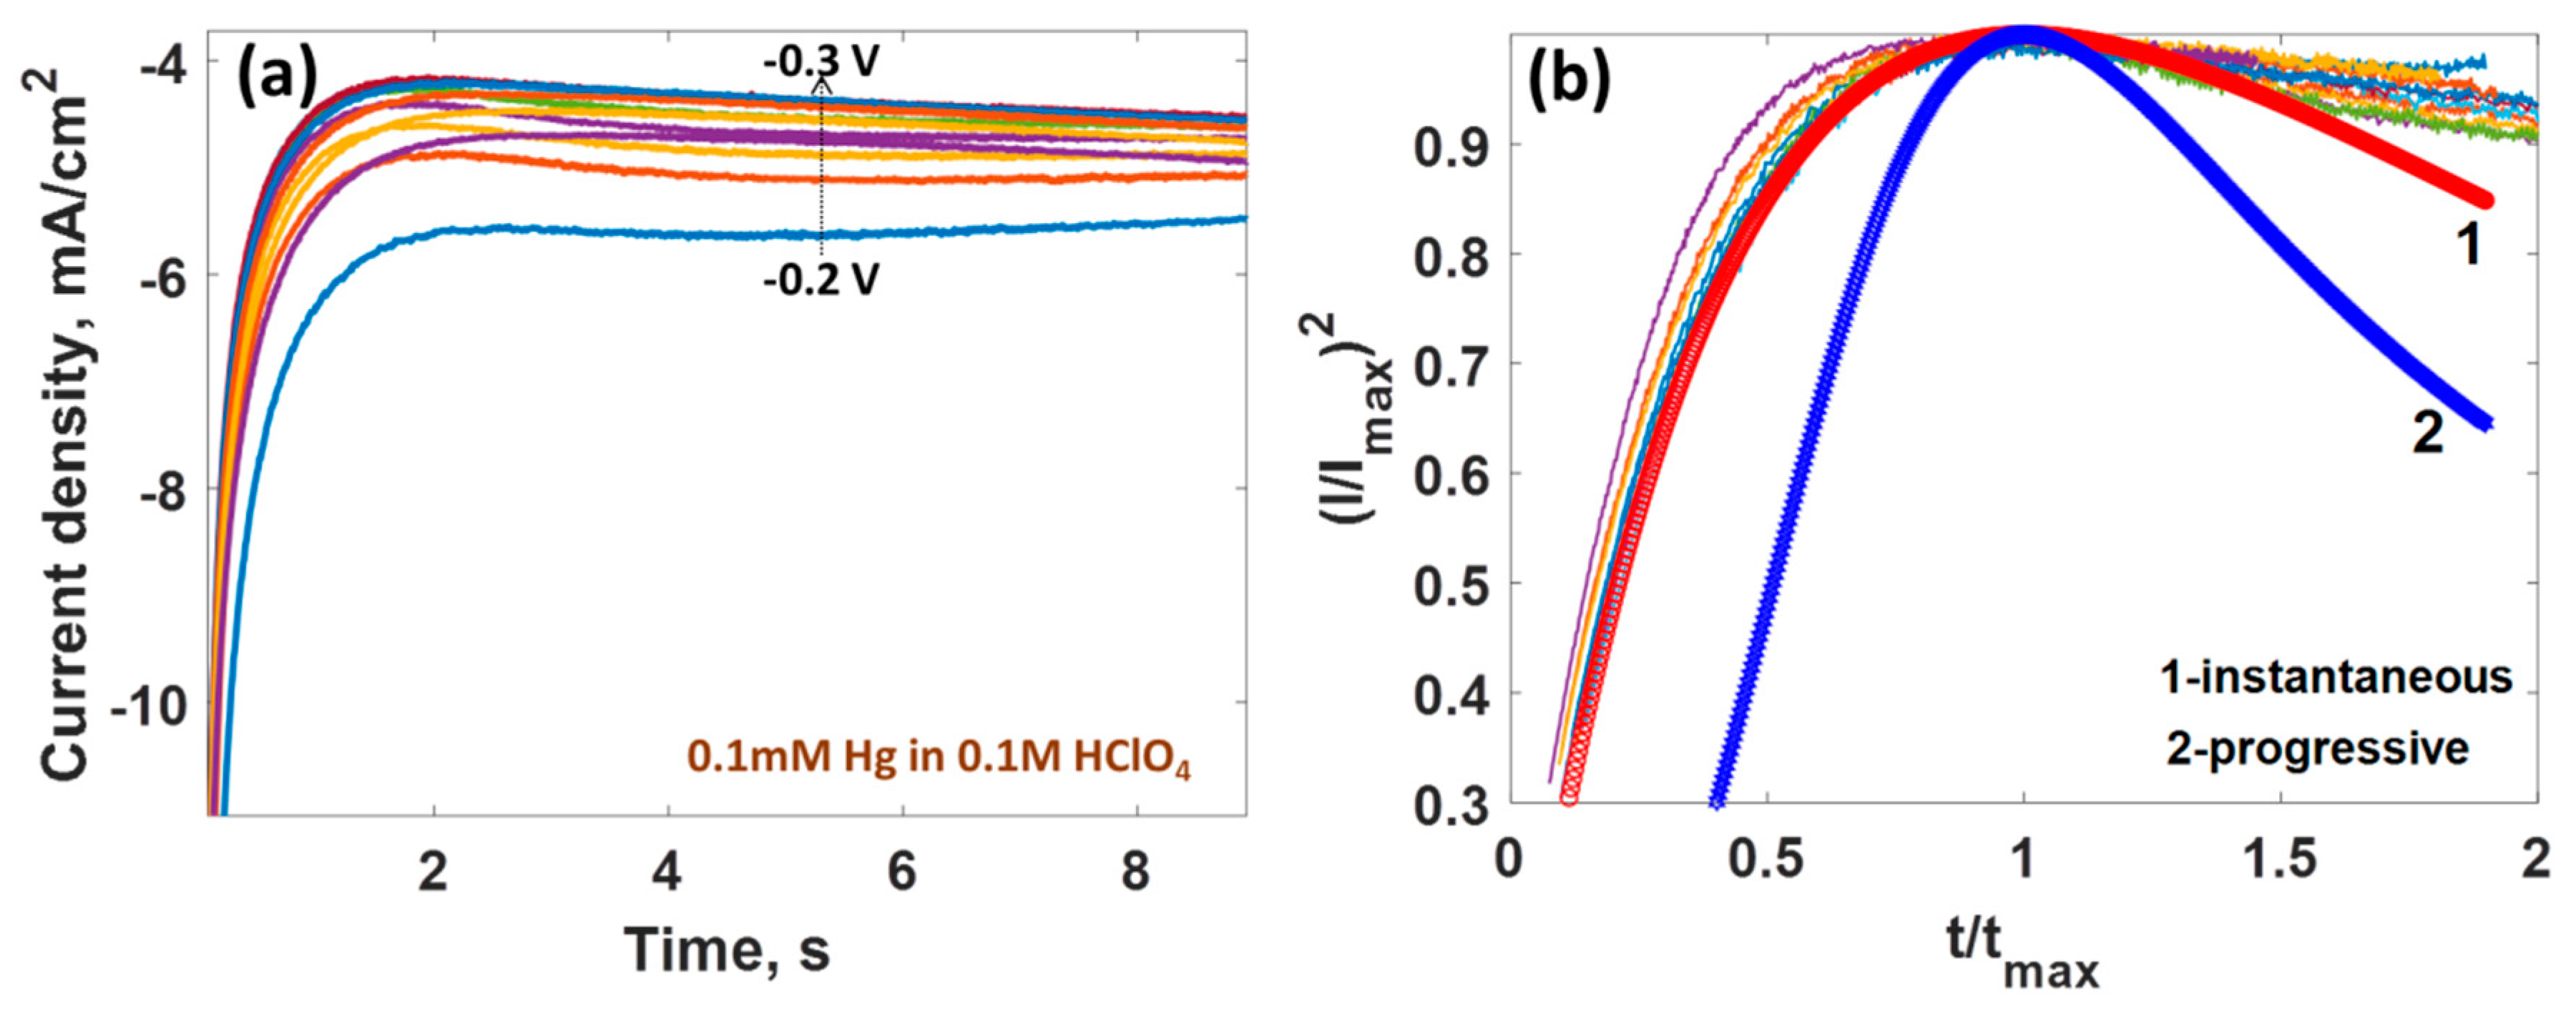
To better understand how the epitaxial graphene influences the Hg nucleation-growth process, we next carried out chronoamperometry measurements and recorded current–time transients during Hg electrodeposition. Typical current density–time transients at different deposition potentials are demonstrated in Figure 4a. In their early work, Scharifker and Hills originally proposed [58] two probable models of metal deposition on arbitrary substrates, namely instantaneous nucleation and progressive nucleation. In the case of the first nucleation mechanism, all the Hg nuclei are formed simultaneously, while the second mechanism implies that new Hg nuclei are gradually created during potential stepping. From a theoretical point of view, the current–time transients corresponding to instantaneous nucleation and progressive nucleation can be described by the following simplified relationships.
A comparison of the theoretical current–time curves with experimental ones presented in Figure 4b indicates that the initial kinetics of Hg species onto the epitaxial graphene electrode is governed by the three-dimensional instantaneous growth-nucleation mechanism, which is in agreement with the Hg electrodeposition mechanism reported for boron-doped diamond electrodes [72] and vitreous carbon electrodes [73]. At the initial stages, the parameter increases (which is associated with enlarging surface density of Hg nuclei) and then decreases gradually after it reaches some maximum dependent on the applied potential. During the early stages of Hg nucleation, the time corresponding to the maximum value of the parameter shortens with the increase in the deposition potential.
Further analysis of the experimental current–time transients (Figure 5) makes it possible to determine the diffusion coefficient of the mercury species, which can be calculated by using the Cottrell equation [74]:
From the slope of a linear plot of I vs. t−0.5 at different deposition potentials (Figure 5), the average value of the diffusion coefficient is found to be approximately 6.63 × 10⁻² cm2·s−1, which is significantly higher than the diffusion coefficient of Hg on a vitreous carbon electrode (1.4 × 10⁻⁵ cm2·s−1) [73] and on a boron-doped diamond electrode (~10−5 cm2·s−1) [72]. As has been shown in our previous work, Hg species can freely diffuse across the graphene surface with a negligible energy barrier [75]. Therefore, such a high diffusion coefficient implies barrierless surface migration of Hg at the epitaxial graphene electrode, suggesting a limited number of electroactive sites at the graphene surface. The average number density of nucleation sites (N0) on the Gr/SiC surface was determined by using the following formula [58]:
where n is the number of electrons involved, F is the Faraday constant, C is the concentration of species in the bulk, Vm is the molar volume, tmax is the peak time, and Imax is the peak current density. N0 was estimated to be as low as 5.59 × 103 cm−2.
A high diffusion coefficient of Hg and low number of active nucleation sites originating from weak interaction between Hg and pristine epitaxial graphene do not promote fast charge transfer reactions at the electrode surface and thus the sensitivity of the nominally pristine epitaxial graphene with respect to Hg is expected to be poor. Therefore, this material needs to be modified, possibly through introduction of additional electroactive sites (carbon vacancies, for instance) to attain desirable sensing performance, while maintaining the graphene’s quality. As has been shown in our previous work [76], the carbon vacancies can significantly improve the adsorption energy of Hg on graphene.
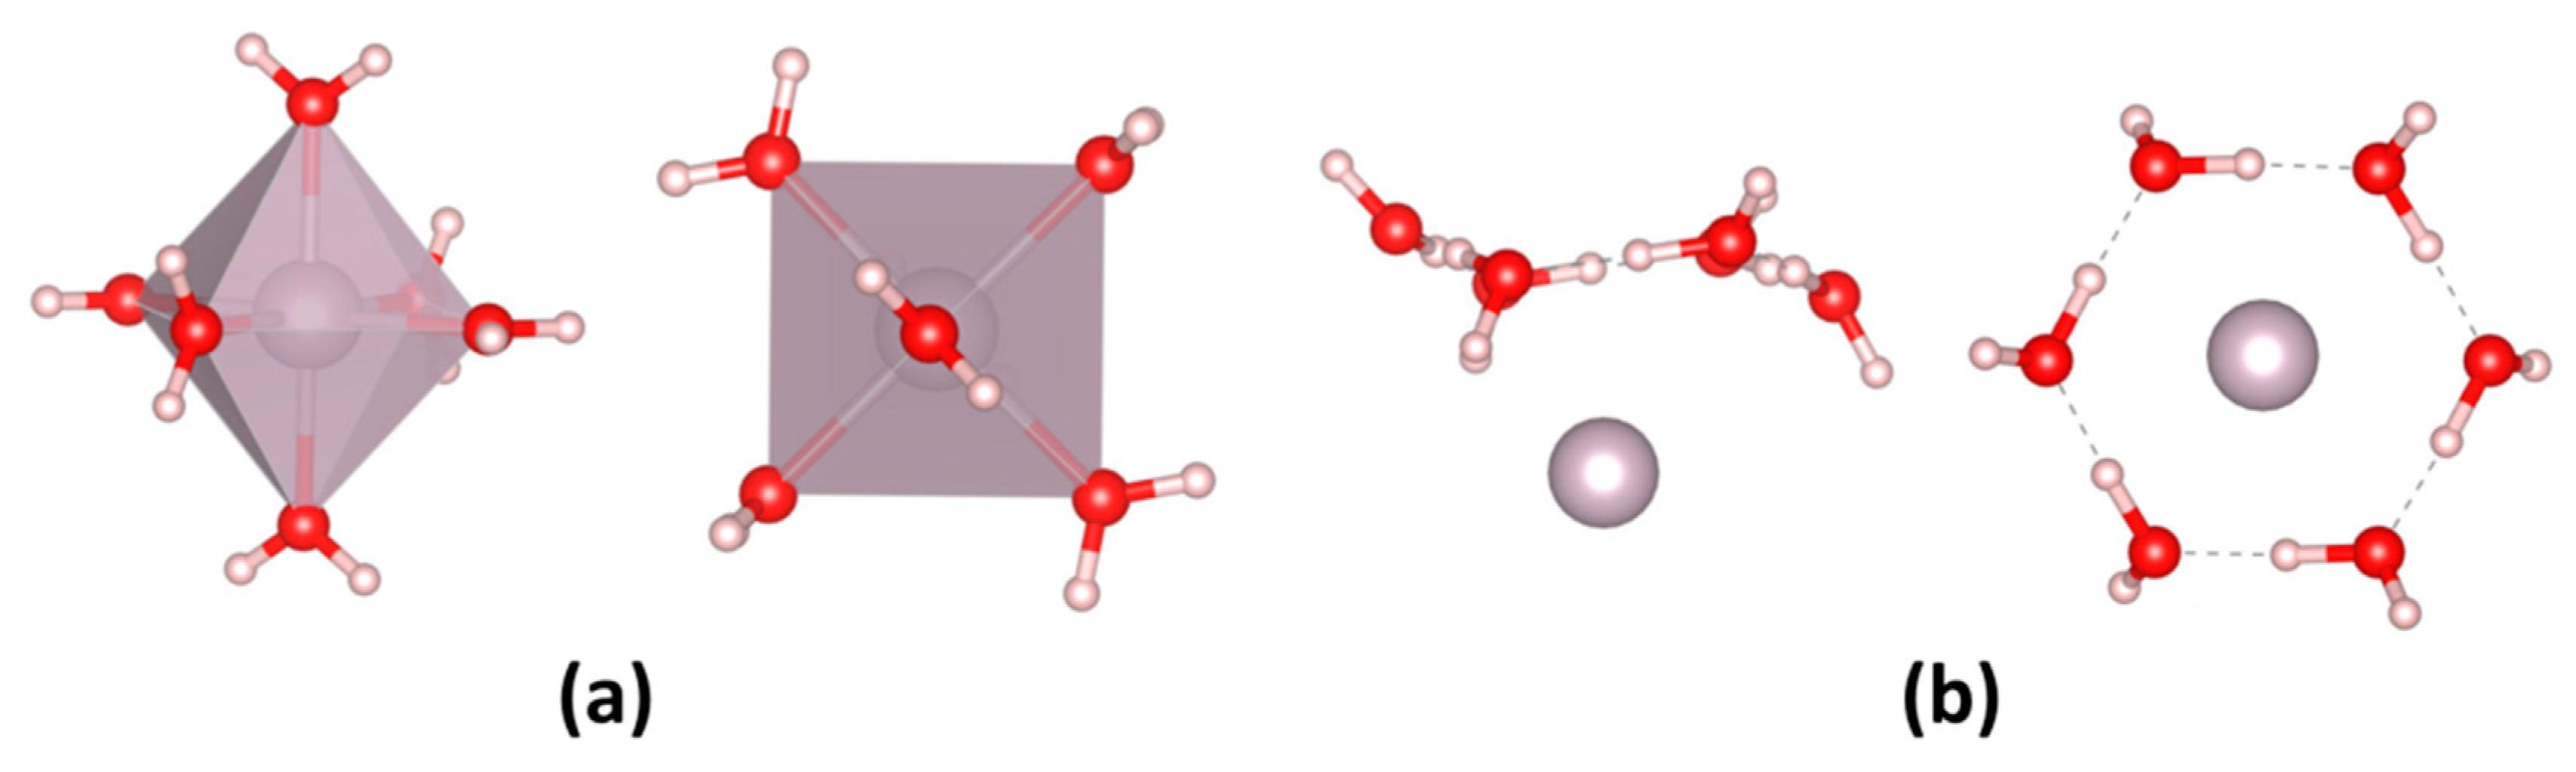
To gain better understanding of the nature of the Hg electroreduction (Hg2+→Hg0) at the graphene surface, we carried out DFT calculations by mimicking realistic reduction conditions with consideration of the hydration shell for the Hg2+ cation. Figure 6a demonstrates the first hydration shell structure around the Hg2+ ion. Such a structure is characterized by six water molecules with regular octahedral geometry.
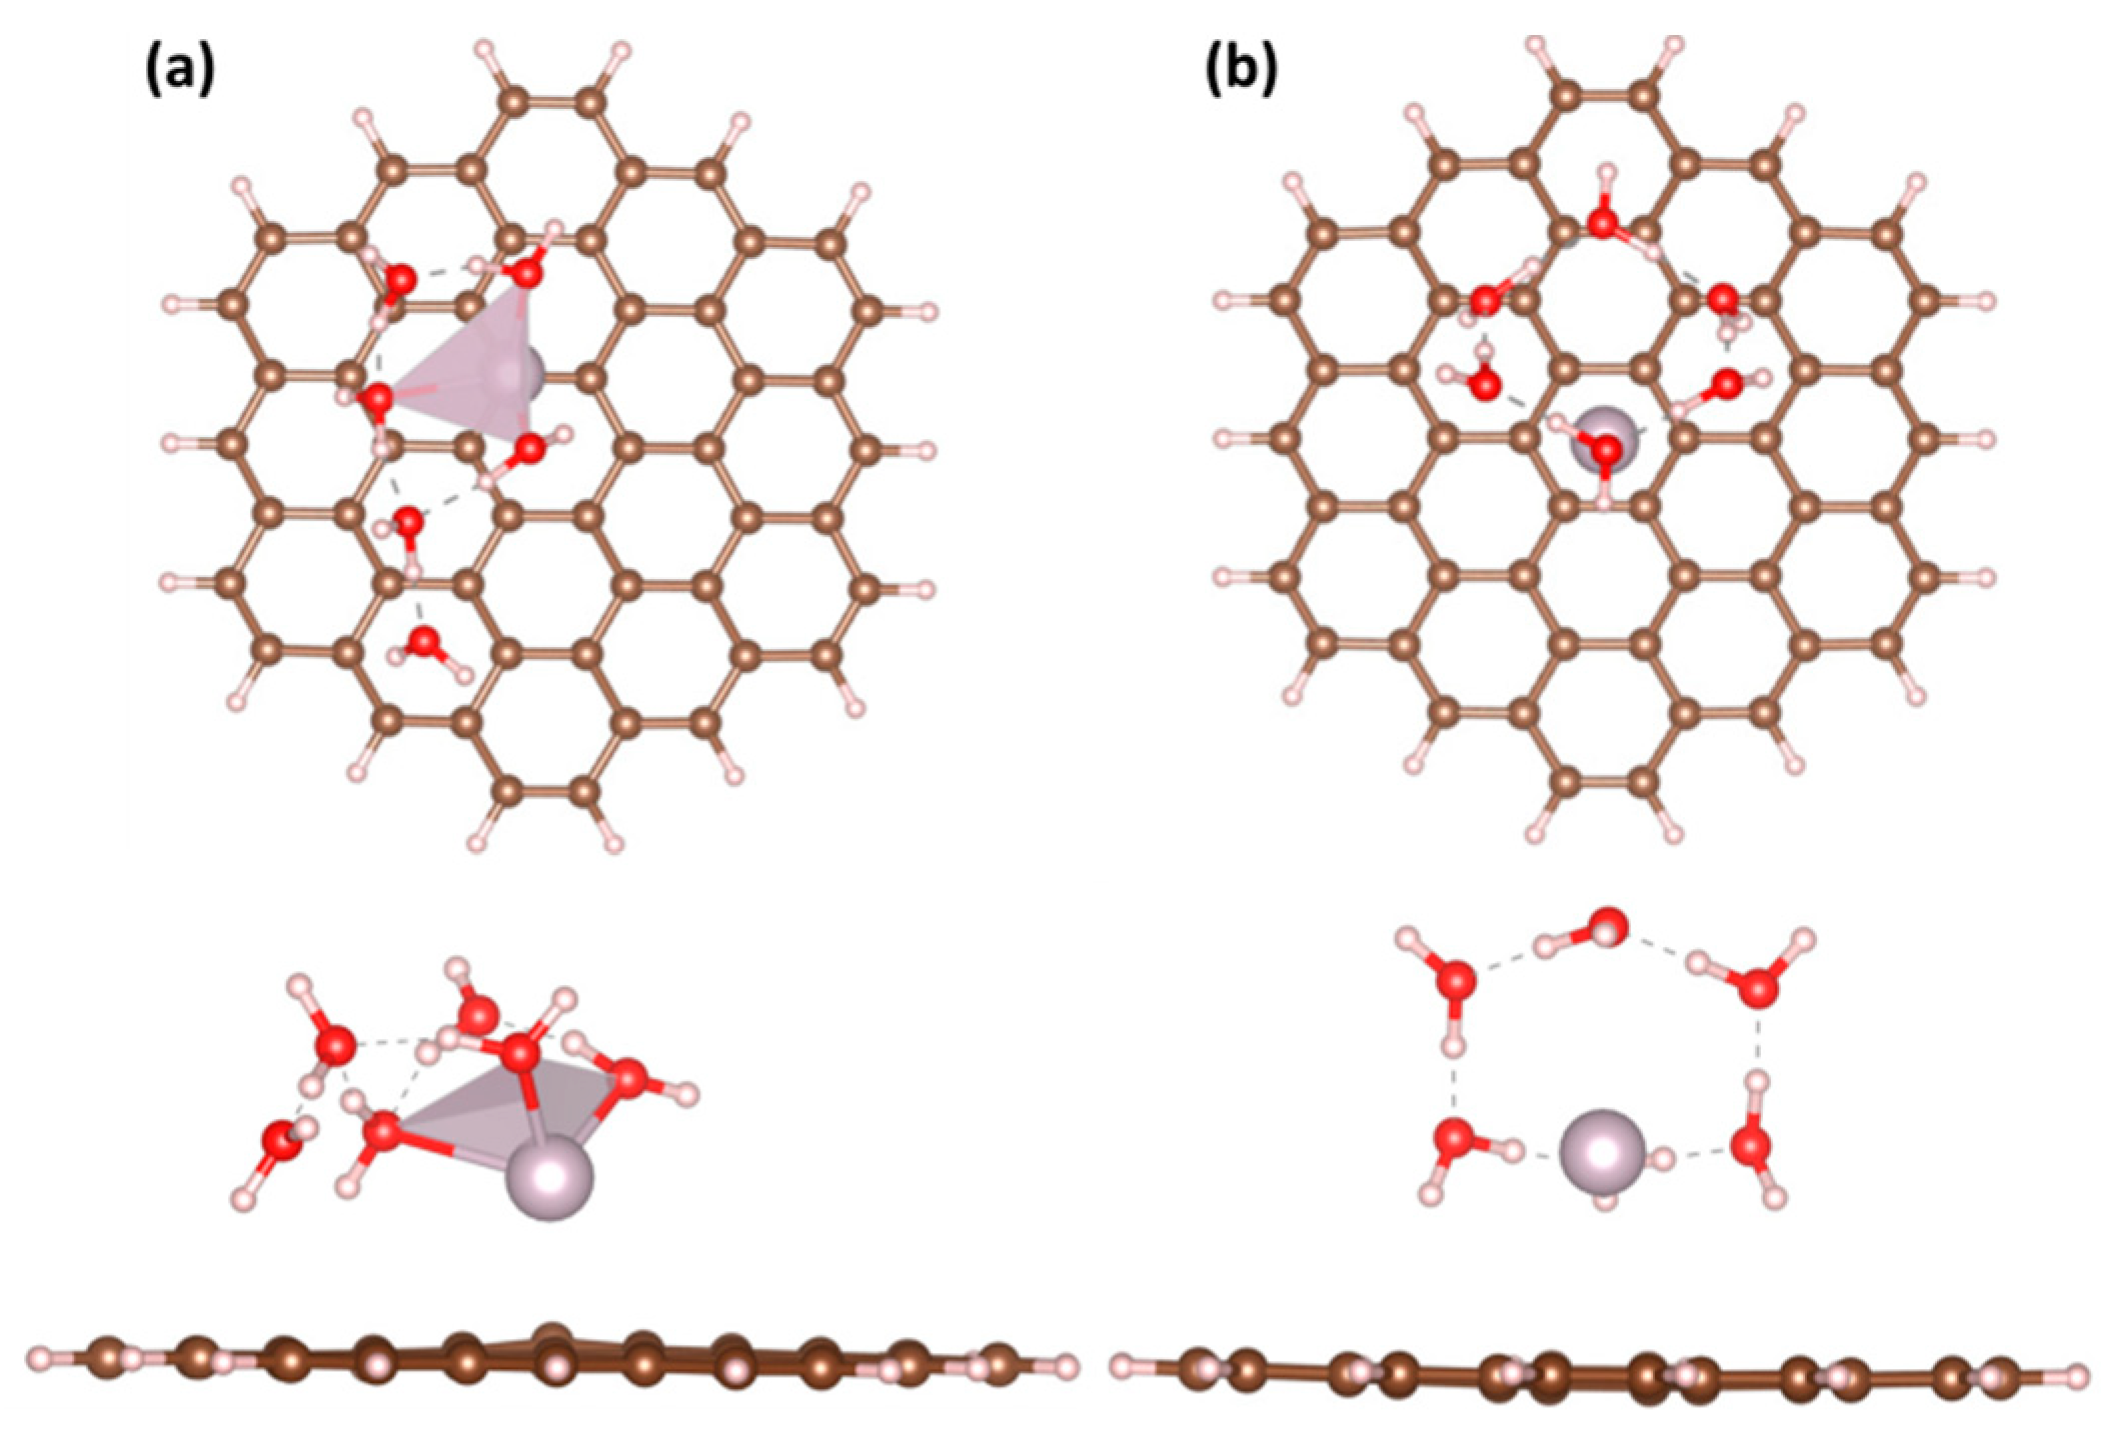
The mean bond length between the oxygen atom of the water molecule and Hg2+ ion is 2.34 Å. The Hirshfeld charge located on the Hg ion is predicted to be +0.643. Interestingly, after addition of two electrons to the [Hg(H2O)6]2+ complex, the Hg atom becomes neutral with a negligibly small Hirshfeld charge of +0.0036 due to breaking of the Hg–O bonds (Figure 6b). This implies a complete reduction of the mercury ion. In this case, the distance between Hg0 and oxygen is about 3.22 Å for the three closest O atoms and 3.55 Å for the others. At the next stage, we studied the behavior of the optimized [Hg(H2O)6]2+ complex at the graphene electrode surface. As can be seen in Figure 7a, the octahedral geometry of the first hydration shell is completely broken, and Hg ions form only three chemical bonds with water molecules (trigonal geometry). In this case, the Hirshfeld charge on the Hg ion is approximately +0.571, probably due to additional charge transfer from graphene to metal.
To simulate the reduction process at the graphene surface, we then added two electrons to graphene and allowed the [Hg(H2O)6]2+/(graphene+2e−) structure to be relaxed. The result of structural optimization is presented in Figure 7b. The Hg atom having the positive charge of +0.044 prefers to sit at the hollow site of graphene, with adsorption height of 3.15 Å. This finding indicates that the added electrons are completely employed to reduce the charge of the Hg ion.
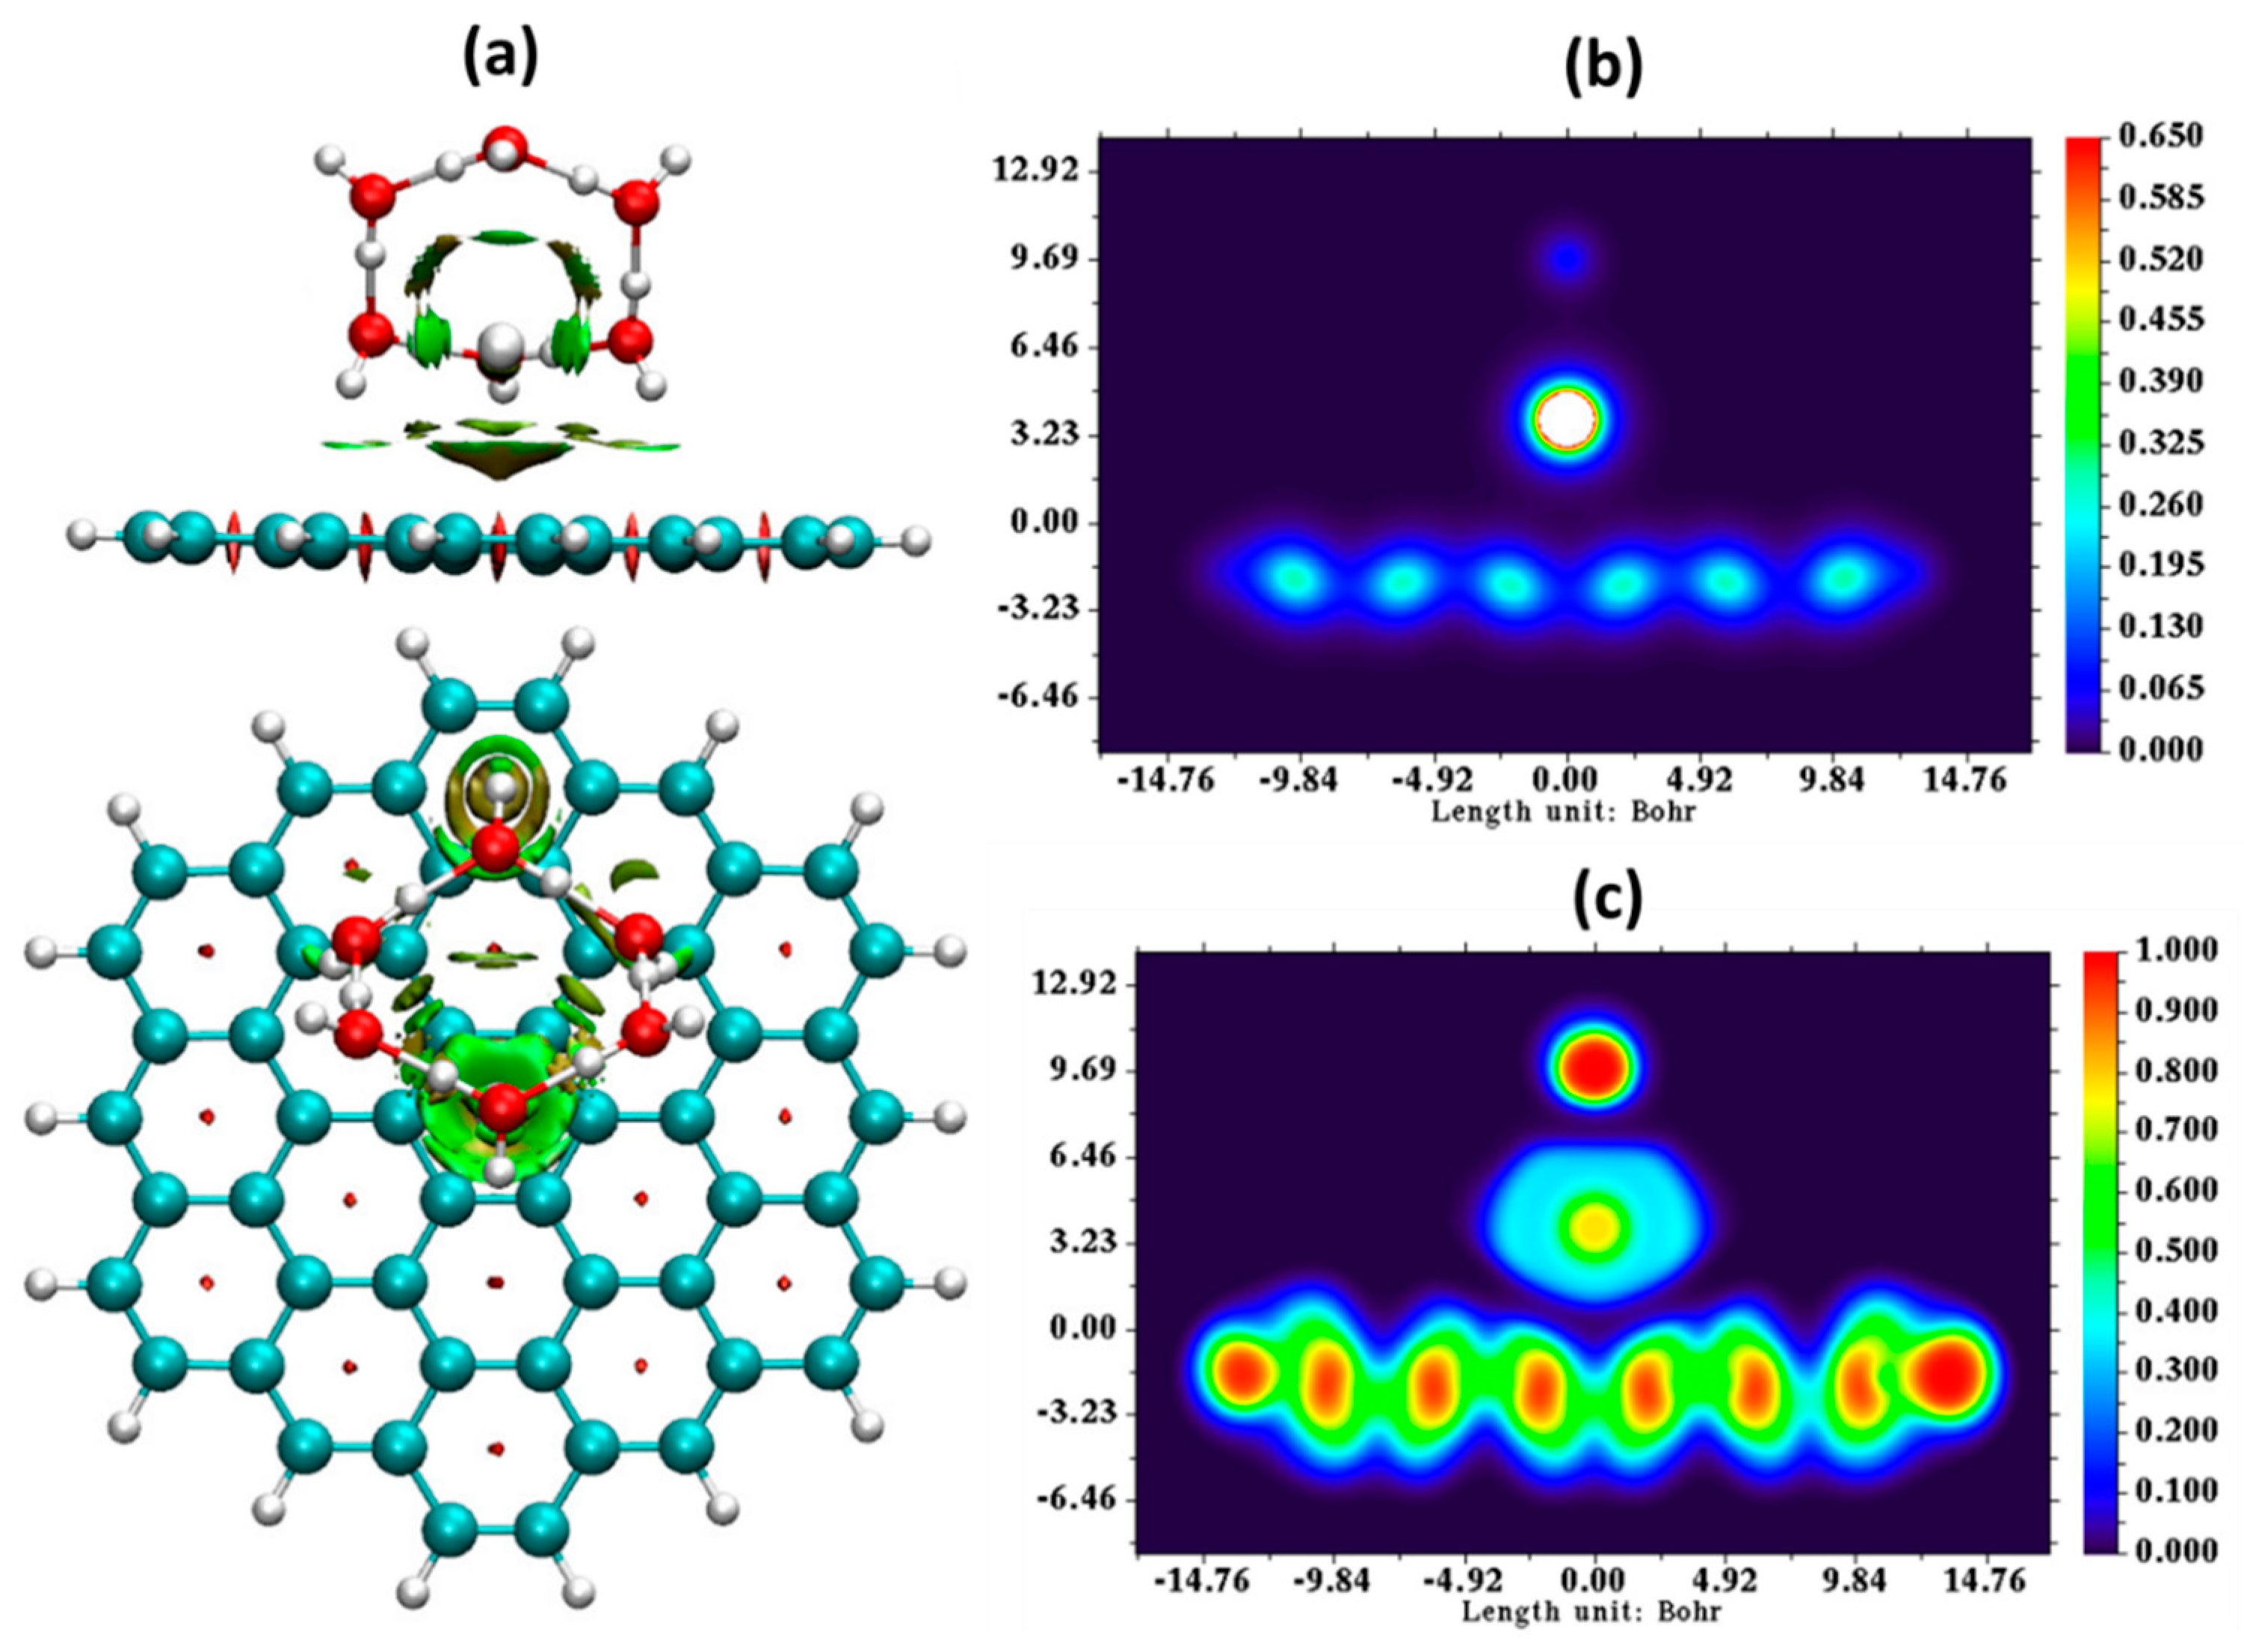
Noncovalent interaction (NCI) analysis allowed us to elucidate the nature of [Hg(H2O)6]0 –graphene interaction. For graphene interacting with the [Hg(H2O)6]0 complex, we observed the well pronounced green-colored area located at the hollow site seen in Figure 8a, which can be interpreted as a nonbonding interaction region.
This clearly indicates that van der Waals interaction between Hg and graphene dominates. The analysis of electron density and electron localization function (ELF) gives more information on charge redistribution in the [Hg(H2O)6]0–graphene system, see Figure 8a,b. It can be seen that there is no electron localization overlap between Hg and graphene, also confirming a pure physisoprtion of Hg on graphene. By performing DFT calculations, we revealed that the interaction of reduced Hg species with graphene surface occurs mainly through weak van der Waals interaction. This finding explains the experimentally derived high diffusion coefficient of Hg and low number of active nucleation sites. Due to the weak interaction, Hg species can freely migrate across the graphene surface without energy barriers. We also modeled the realistic reduction process considering the divalent Hg ion with its first hydration shell and found that added electrons are completely employed to reduce the charge of the Hg ion. This shows the principal possibility of Hg electroreduction at the graphene surface.
4. Conclusions
The results obtained in this study show that the electrochemical redox behavior of Hg2+ at the epitaxial graphene working electrode is quite complicated and strongly dependent on the concentration of perchloric acid in the electrolyte solution. In 0.01 M HClO4 buffer solution, the redox process occurs in two well-defined one-electron steps: Hg0 − 1e− = Hg1+ − 1e− = Hg2+, while in 0.1 M HClO4, mercury oxidation takes place in one two-electron step. In both cases, the anodic and cathodic peak potential separation values and current and peak area ratios indicate that the redox process is quasireversible. Chronoamperometry studies suggest that initial kinetics of the Hg species at the Gr/SiC surface is governed by the three-dimensional instantaneous nucleation mechanism with a relatively high diffusion coefficient of 6.63 × 10⁻² cm2·s−1. Such a behavior can be attributed to the negligibly low energy barriers for surface migration of Hg across the epitaxial graphene surface and the low number density of nucleation sites at Gr/SiC (5.59 × 103 cm−2). According to DFT calculations, the reduced Hg complex interacts with graphene mainly though weak dispersive forces, also pointing out its low binding ability and high surface migration rate at room temperature. From the point of view of sensing applications, to reach high-performance Hg detection, these parameters need to be improved. Particularly, it is necessary to increase the number of electroactive sites for Hg nucleation to enhance the interaction between Hg and epitaxial graphene.
Author Contributions
Conceptualization, I.S. and M.V.; methodology, I.S. and M.V.; software, I.S.; validation, I.S., M.V. and R.Y.; formal analysis, I.S.; investigation, I.S. and M.V.; resources, I.S., M.V. and R.Y.; data curation, I.S.; writing—original draft preparation, I.S.; writing—review and editing, I.S., M.V. and R.Y.; visualization, I.S.; supervision, R.Y.; project administration, R.Y.; funding acquisition, I.S. and R.Y.
Funding
The authors would like to thank the Swedish Foundation for Strategic research (SSF) for financial support through the grants GMT14-0077 and RMA15-024. I.S. acknowledges the support from Ångpanneföreningens Forskningsstiftelse (Grant 16-541). R.S. acknowledges financial support via VR grant 2018-04962.
Conflicts of Interest
The authors declare no conflict of interest.
References
- Cincinelli, A.; Martellini, T. Indoor Air Quality and Health. Int. J. Environ. Res. Public Health 2017, 14, 1286. [Google Scholar] [CrossRef] [PubMed]
- Montero-Montoya, R.; López-Vargas, R.; Arellano-Aguilar, O. Volatile Organic Compounds in Air: Sources, Distribution, Exposure and Associated Illnesses in Children. Ann. Glob. Health 2018, 84, 225–238. [Google Scholar] [CrossRef] [Green Version]
- Tago, D.; Andersson, H.; Treich, N. Pesticides and Health: A Review of Evidence on Health Effects, Valuation of Risks, and Benefit-Cost Analysis. Prefer. Meas. Health 2014, 24, 203–295. [Google Scholar]
- Nicolopoulou-Stamati, P.; Maipas, S.; Kotampasi, C.; Stamatis, P.; Hens, L. Chemical Pesticides and Human Health: The Urgent Need for a New Concept in Agriculture. Front. Public Health 2016, 4, 231. [Google Scholar] [CrossRef] [PubMed]
- Jaishankar, M.; Tseten, T.; Anbalagan, N.; Mathew, B.B.; Beeregowda, K.N. Toxicity, mechanism and health effects of some heavy metals. Interdiscip. Toxicol. 2014, 7, 60–72. [Google Scholar] [CrossRef] [PubMed] [Green Version]
- Tchounwou, P.B.; Yedjou, C.G.; Patlolla, A.K.; Sutton, D.J. Heavy Metals Toxicity and the Environment. Exp. Suppl. 2012, 101, 133–164. [Google Scholar] [PubMed]
- Gbogbo, F.; Arthur-Yartel, A.; Bondzie, J.A.; Dorleku, W.-P.; Dadzie, S.; Kwansa-Bentum, B.; Ewool, J.; Billah, M.K.; Lamptey, A.M. Risk of heavy metal ingestion from the consumption of two commercially valuable species of fish from the fresh and coastal waters of Ghana. PLoS ONE 2018, 13, e0194682. [Google Scholar] [CrossRef]
- Manzoor, J.; Sharma, M.; Wani, K.A. Heavy metals in vegetables and their impact on the nutrient quality of vegetables: A review. J. Plant Nutr. 2018, 41, 1744–1763. [Google Scholar] [CrossRef]
- Chen, S.-S.; Lin, Y.-W.; Kao, Y.-M.; Shih, Y.-C. Trace elements and heavy metals in poultry and livestock meat in Taiwan. Food Addit. Contam. Part B 2013, 6, 231–236. [Google Scholar] [CrossRef]
- Driscoll, C.T.; Mason, R.P.; Chan, H.M.; Jacob, D.J.; Pirrone, N. Mercury as a Global Pollutant: Sources, Pathways, and Effects. Environ. Sci. Technol. 2013, 47, 4967–4983. [Google Scholar] [CrossRef]
- Wojcik, D.P.; Godfrey, M.E.; Christie, D.; Haley, B.E. Mercury toxicity presenting as chronic fatigue, memory impairment and depression: Diagnosis, treatment, susceptibility, and outcomes in a New Zealand general practice setting (1994–2006). Neuroendocrinol. Lett. 2006, 27, 415–423. [Google Scholar] [PubMed]
- Björkman, L.; Lundekvam, B.F.; Lægreid, T.; Bertelsen, B.I.; Morild, I.; Lilleng, P.; Lind, B.; Palm, B.; Vahter, M. Mercury in human brain, blood, muscle and toenails in relation to exposure: An autopsy study. Environ. Health 2007, 6, 30. [Google Scholar]
- Hodgson, S.; Nieuwenhuijsen, M.J.; Elliott, P.; Jarup, L. Kidney disease mortality and environmental exposure to mercury. Am. J. Epidemiol. 2007, 165, 72–77. [Google Scholar] [CrossRef] [PubMed]
- Bjorklund, G. Mercury and Acrodynia. J. Orthomol. Med. 1995, 10, 145–146. [Google Scholar]
- Murata, K.; Weihe, P.; Budtz-Jørgensen, E.; Jørgensen, P.J.; Grandjean, P. Delayed brainstem auditory evoked potential latencies in 14-year-old children exposed to methylmercury. J. Pediatr. 2004, 144, 177–183. [Google Scholar] [CrossRef] [PubMed] [Green Version]
- Carvalho, C.M.; Chew, E.H.; Hashemy, S.I.; Lu, J.; Holmgren, A. Inhibition of the human thioredoxin system: A molecular mechanism of mercury toxicity. J. Biol. Chem. 2008, 283, 11913–11923. [Google Scholar] [CrossRef]
- GB 5749, Standards for Drinking Water Quality; National Standard of the People’s Republic of China: Beijing, China, 2006.
- Villanueva, C.M.; Kogevinas, M.; Cordier, S.; Templeton, M.R.; Vermeulen, R.; Nuckols, J.R.; Nieuwenhuijsen, M.J.; Levallois, P. Assessing Exposure and Health Consequences of Chemicals in Drinking Water: Current State of Knowledge and Research Needs. Environ. Health Perspect. 2014, 122, 213–221. [Google Scholar] [CrossRef] [Green Version]
- Kallithrakas, N.; Foteinis, S. Recent Advances in the Analysis of Mercury in Water—Review. Curr. Anal. Chem. 2016, 12, 122–136. [Google Scholar] [CrossRef]
- Suvarapu, L.N.; Baek, S.-O. Recent Developments in the Speciation and Determination of Mercury Using Various Analytical Techniques. J. Anal. Methods Chem. 2015, 2015, 1–18. [Google Scholar] [CrossRef] [Green Version]
- Leopold, K.; Foulkes, M.; Worsfold, P. Methods for the determination and speciation of mercury in natural waters—A review. Anal. Chim. Acta 2010, 663, 127–138. [Google Scholar] [CrossRef]
- Li, P.; Liu, B.; Zhang, D.; Sun, Y.; Liu, J. Graphene field-effect transistors with tunable sensitivity for high performance Hg (II) sensing. Appl. Phys. Lett. 2016, 109, 153101. [Google Scholar] [CrossRef]
- An, J.H.; Park, S.J.; Kwon, O.S.; Bae, J.; Jang, J. High-Performance Flexible Graphene Aptasensor for Mercury Detection in Mussels. ACS Nano 2013, 7, 10563–10571. [Google Scholar] [CrossRef] [PubMed]
- Chen, K.; Lu, G.; Chang, J.; Mao, S.; Yu, K.; Cui, S.; Chen, J. Hg(II) Ion Detection Using Thermally Reduced Graphene Oxide Decorated with Functionalized Gold Nanoparticles. Anal. Chem. 2012, 84, 4057–4062. [Google Scholar] [CrossRef] [PubMed]
- Tu, J.; Gan, Y.; Liang, T.; Hu, Q.; Wang, Q.; Ren, T.; Sun, Q.; Wan, H.; Wang, P. Graphene FET array biosensor based on ssDNA aptamer for ultrasensitive Hg2+ detection in environmental pollutants. Front. Chem. 2018, 6, 333. [Google Scholar] [CrossRef] [PubMed]
- Martín-Yerga, D.; Costa-García, A. Recent advances in the electrochemical detection of mercury. Curr. Opin. Electrochem. 2017, 3, 91–96. [Google Scholar] [CrossRef]
- Suherman, A.L.; Tanner, E.E.L.; Compton, R.G. Recent developments in inorganic Hg2+ detection by voltammetry. Trends Anal. Chem. 2017, 94, 161–172. [Google Scholar] [CrossRef]
- Schedin, F.; Geim, A.K.; Morozov, S.V.; Hill, E.W.; Blake, P.; Katsnelson, M.I.; Novoselov, K.S.; Morozov, S.; Novoselov, K. Detection of individual gas molecules adsorbed on graphene. Nat. Mater. 2007, 6, 652–655. [Google Scholar] [CrossRef] [PubMed]
- Yang, T.; Zhao, X.; He, Y.; Zhu, H. Graphene-Based Sensors; Elsevier BV: Amsterdam, The Netherlands, 2018; pp. 157–174. [Google Scholar]
- Devi, N.R.; Sasidharan, M.; Sundramoorthy, A.K. Gold Nanoparticles-Thiol-Functionalized Reduced Graphene Oxide Coated Electrochemical Sensor System for Selective Detection of Mercury Ion. J. Electrochem. Soc. 2018, 165, B3046–B3053. [Google Scholar] [CrossRef]
- Wang, S.; Zhai, S.; Li, Y.; Zhang, C.; Han, Z.; Peng, R.; Wang, X.; Lin, Z.; Lin, L.; Liu, Y.; et al. Simultaneously detection of Pb2+ and Hg2+ using electrochemically reduced graphene oxide. Int. J. Electrochem. Sci. 2018, 13, 785–796. [Google Scholar] [CrossRef]
- Ghanei-Motlagh, M.; Taher, M.A.; Heydari, A.; Ghanei-Motlagh, R.; Gupta, V.K. A novel voltammetric sensor for sensitive detection of mercury(II) ions using glassy carbon electrode modified with graphene-based ion imprinted polymer. Mater. Sci. Eng. C 2016, 63, 367–375. [Google Scholar] [CrossRef]
- Wang, Y.; Zhou, L.; Wang, S.; Li, J.; Tang, J.; Wang, S.; Wang, Y. Sensitive and selective detection of Hg2+ based on an electrochemical platform of PDDA functionalized rGO and glutaraldehyde cross-linked chitosan composite film. RSC Adv. 2016, 6, 69815–69821. [Google Scholar] [CrossRef]
- Xie, Y.-L.; Zhao, S.-Q.; Ye, H.-L.; Yuan, J.; Song, P.; Hu, S.-Q. Graphene/CeO2 hybrid materials for the simultaneous electrochemical detection of cadmium(II), lead(II), copper(II), and mercury(II). J. Electroanal. Chem. 2015, 757, 235–242. [Google Scholar] [CrossRef]
- Ding, L.; Liu, Y.; Zhai, J.; Bond, A.M.; Zhang, J. Direct Electrodeposition of Graphene-Gold Nanocomposite Films for Ultrasensitive Voltammetric Determination of Mercury(II). Electroanalysis 2014, 26, 121–128. [Google Scholar] [CrossRef]
- Wang, X.-M.; Wu, S.-G.; Liu, H.; Zhou, L.; Zhao, Q.-P. Graphene-gold nanoparticle composite film modified electrode for determination of trace mercury in environmental water. Chin. J. Chem. Phys. 2013, 26, 590–596. [Google Scholar] [CrossRef]
- Wei, Y.; Gao, C.; Meng, F.-L.; Li, H.-H.; Wang, L.; Liu, J.-H.; Huang, X.-J. SnO2/reduced graphene oxide nanocomposite for the simultaneous electrochemical detection of cadmium(II), lead(II), copper(II), and mercury(II): An interesting favorable mutual interference. J. Phys. Chem. C 2012, 116, 1034–1041. [Google Scholar] [CrossRef]
- Yao, Y. Facile Synthesis of Au Nanoparticles@Reduced Graphene Oxide Nanocomposition-Modified Electrode for Simultaneous Determination of Copper and Mercury Ions. Int. J. Electrochem. Sci. 2019, 14, 3844–3855. [Google Scholar] [CrossRef]
- Palisoc, S.T.; Bentulan, J.M.O.; Natividad, M.T. Determination of trace heavy metals in canned food using Graphene/AuNPs/[Ru(NH3)6]3+/Nafion modified glassy carbon electrodes. J. Food Meas. Charact. 2019, 13, 169–176. [Google Scholar] [CrossRef]
- Mejri, A.; Mars, A.; Elfil, H.; Hamzaoui, A.H. Graphene nanosheets modified with curcumin-decorated manganese dioxide for ultrasensitive potentiometric sensing of mercury(II), fluoride and cyanide. Microchim. Acta 2018, 185, 529. [Google Scholar] [CrossRef]
- Wen, G.-L.; Zhao, W.; Chen, X.; Liu, J.-Q.; Wang, Y.; Zhang, Y.; Huang, Z.-J.; Wu, Y.-C. N-doped reduced graphene oxide/MnO2 nanocomposite for electrochemical detection of Hg2+ by square wave stripping voltammetry. Electrochim. Acta 2018, 291, 95–102. [Google Scholar] [CrossRef]
- Hu, L.; Liu, Z.; Hu, Y.; Zhan, H.; Zhu, J.; Ge, X. Fabrication of high-intensity electron transfer electrochemiluminescence interface for Hg2+ detection by using reduced graphene oxide-Au nanoparticles nanocomposites and CdS quantum dots. J. Electroanal. Chem. 2018, 823, 397–406. [Google Scholar] [CrossRef]
- Shtepliuk, I.; Yakimova, R. Interaction of epitaxial graphene with heavy metals: Towards novel sensing platform. Nanotechnology 2019, 30, 294002. [Google Scholar] [CrossRef] [PubMed]
- Shtepliuk, I.; Khranovskyy, V.; Yakimova, R. Combining graphene with silicon carbide: Synthesis and properties—A review. Semicond. Sci. Technol. 2016, 31, 113004. [Google Scholar] [CrossRef]
- Pearce, R.; Iakimov, T.; Andersson, M.; Hultman, L.; Spetz, A.L.; Yakimova, R. Epitaxially grown graphene based gas sensors for ultra sensitive NO2 detection. Sens. Actuators B Chem. 2011, 155, 451–455. [Google Scholar] [CrossRef]
- Ogawa, Y.; Hu, B.; Orofeo, C.M.; Ikeda, K.-I.; Tsuji, M.; Mizuno, S.; Hibino, H.; Ago, H. Domain Structure and Boundary in Single-Layer Graphene Grown on Cu(111) and Cu(100) Films. J. Phys. Chem. Lett. 2012, 3, 219–226. [Google Scholar] [CrossRef]
- Jeon, C.; Hwang, H.-N.; Lee, W.-G.; Jung, Y.G.; Kim, K.S.; Park, C.-Y.; Hwang, C.-C. Rotated domains in chemical vapor deposition-grown monolayer graphene on Cu(111): An angle-resolved photoemission study. Nanoscale 2013, 5, 8210. [Google Scholar] [CrossRef] [PubMed]
- Virojanadara, C.; Syväjärvi, M.; Yakimova, R.; Johansson, L.I.; Zakharov, A.A.; Balasubramanian, T. Homogeneous large-area graphene layer growth on6H-SiC(0001). Phys. Rev. B 2008, 78, 245403. [Google Scholar] [CrossRef]
- Yazdi, G.R.; Iakimov, T.; Yakimova, R. Epitaxial Graphene on SiC: A Review of Growth and Characterization. Crystals 2016, 6, 53. [Google Scholar] [CrossRef]
- Shtepliuk, I.; Vagin, M.; Ivanov, I.G.; Iakimov, T.; Yazdi, G.R.; Yakimova, R. Lead (Pb) interfacing with epitaxial graphene. Phys. Chem. Chem. Phys. 2018, 20, 17105–17116. [Google Scholar] [CrossRef] [PubMed] [Green Version]
- Shtepliuk, I.; Santangelo, M.F.; Vagin, M.; Ivanov, I.G.; Khranovskyy, V.; Iakimov, T.; Eriksson, J.; Yakimova, R. Understanding Graphene Response to Neutral and Charged Lead Species: Theory and Experiment. Materials 2018, 11, 2059. [Google Scholar] [CrossRef]
- Yakimova, R.; Iakimov, T.; Syväjärvi, M. Process for Growth of Graphene. U.S. Patent US9150417B2, 6 October 2015. [Google Scholar]
- Ivanov, I.G.; Hassan, J.U.; Iakimov, T.; Zakharov, A.A.; Yakimova, R.; Janzén, E. Layer-number determination in graphene on SiC by reflectance mapping. Carbon 2014, 77, 492–500. [Google Scholar] [CrossRef] [Green Version]
- Vagin, M.Y.; Sekretaryova, A.N.; Ivanov, I.G.; Håkansson, A.; Iakimov, T.; Syväjärvi, M.; Yakimova, R.; Lundström, I.; Eriksson, M. Monitoring of epitaxial graphene anodization. Electrochim. Acta 2017, 238, 91–98. [Google Scholar] [CrossRef] [Green Version]
- Yamaguchi, T.; Nomura, M.; Wakita, H.; Ohtaki, H. An extended x-ray absorption fine structure study of aqueous rare earth perchlorate solutions in liquid and glassy states. J. Chem. Phys. 1988, 89, 5153–5159. [Google Scholar] [CrossRef]
- Sémon, L.; Boehme, C.; Billard, I.; Hennig, C.; Lützenkirchen, K.; Reich, T.; Rossini, I.; Wipff, G.; Roßberg, A.; Roßberg, A. Do Perchlorate and Triflate Anions Bind to the Uranyl Cation in an Acidic Aqueous Medium? A Combined EXAFS and Quantum Mechanical Investigation. ChemPhysChem 2001, 2, 591–598. [Google Scholar] [CrossRef]
- Binnemans, K. Applications of tetravalent cerium compounds. In Handbook on the Physics and Chemistry of Rare Earths, 1st ed.; Gschneidner, K.A., Jr., Bünzli, J.-C.G., Pecharsky, V.K., Eds.; Elsevier Science Publisher B.V.: Amsterdam, The Netherlands, 2006; Volume 3, pp. 306–307. ISBN 9780080466729. [Google Scholar]
- Scharifker, B.; Hills, G. Theoretical and experimental studies of multiple nucleation. Electrochim. Acta 1983, 28, 879–889. [Google Scholar] [CrossRef]
- Frisch, M.J. Gaussian 16, Revision B. 01; Gaussian Inc.: Wallingford, CT, USA, 2016. [Google Scholar]
- Adamo, C.; Barone, V. Toward reliable density functional methods without adjustable parameters: The PBE0 model. J. Chem. Phys. 1999, 110, 6158–6170. [Google Scholar] [CrossRef]
- Perdew, J.P.; Burke, K.; Ernzerhof, M. Generalized Gradient Approximation Made Simple. Phys. Rev. Lett. 1996, 77, 3865–3868. [Google Scholar] [CrossRef] [PubMed] [Green Version]
- Martin, G.; Sundermann, A. Correlation consistent valence basis sets for use with the Stuttgart–Dresden–Bonn relativistic effective core potentials: The atoms Ga–Kr and In–Xe. J. Chem. Phys. 2001, 114, 3408–3420. [Google Scholar] [CrossRef]
- Lu, T.; Chen, F. Multiwfn: A multifunctional wavefunction analyzer. J. Comput. Chem. 2012, 33, 580–592. [Google Scholar] [CrossRef]
- Martins, M.E.; Salvarezza, R.C.; Arvia, A.J. The electrodeposition of mercury from aqueous Hg22+ ion-containing acid solutions on smooth and columnar structured platinum electrodes. Electrochim. Acta 1998, 32, 438–450. [Google Scholar] [CrossRef]
- Orlik, M.; Galus, Z. Electrochemistry of Mercury. In Encyclopedia of Electrochemistry; Wiley: Hoboken, NJ, USA, 2007; Volume 7, pp. 958–991. [Google Scholar]
- Yasri, N.G.; Sundramoorthy, A.K.; Chang, W.-J.; Gunasekaran, S. Highly Selective Mercury Detection at Partially Oxidized Graphene/Poly(3,4-Ethylenedioxythiophene):Poly(Styrenesulfonate) Nanocomposite Film-Modified Electrode. Front. Mater. 2014, 1, 33. [Google Scholar] [CrossRef]
- Radhi, M.M.; Tan, W.T.; Ab Rahman, M.Z.B.; Kassim, A.B. Electrochemical Redox of Hg2+ Mediated by Activated Carbon Modified Glassy Carbon Electrode. Int. J. Electrochem. Sci. 2010, 5, 615–629. [Google Scholar]
- Brownson, D.A.C.; Banks, C.E. The Handbook of Graphene Electrochemistry; Springer: London, UK, 2014; Chapter 2; pp. 23–77. ISBN 978-1-4471-6427-2. [Google Scholar]
- Zanello, P. Inorganic Electrochemistry: Theory, Practice and Application; The Royal Society of Chemistry: Cambridge, UK, 2003; pp. 117–118. ISBN 0-85404-661-5. [Google Scholar]
- Klingler, R.J.; Kochi, J.K. Electron-transfer kinetics from cyclic voltammetry. Quantitative description of electrochemical reversibility. J. Phys. Chem. 1981, 85, 1731–1741. [Google Scholar] [CrossRef]
- Shtepliuk, I.; Vagin, M.; Iakimov, T.; Yakimova, R. Fundamentals of Environmental Monitoring of Heavy Metals Using Graphene. Chem. Eng. Trans. 2019, 73, 7–12. [Google Scholar]
- Vinokur, N.; Miller, B.; Avyigal, Y.; Kalish, R. Cathodic and Anodic Deposition of Mercury and Silver at Boron-Doped Diamond Electrodes. J. Electrochem. Soc. 1999, 146, 125. [Google Scholar] [CrossRef]
- Serruya, A.; Mostany, J.; Scharifker, B.R. The kinetics of mercury nucleation from Hg22+ and Hg2+ solutions on vitreous carbon electrodes. J. Electroanal. Chem. 1999, 464, 39–47. [Google Scholar] [CrossRef]
- Sharp, M.; Petersson, M.; Edström, K. Preliminary determinations of electron transfer kinetics involving ferrocene covalently attached to a platinum surface. J. Electroanal. Chem. Interfacial Electrochem. 1979, 95, 123–130. [Google Scholar] [CrossRef]
- Shtepliuk, I.; Caffrey, N.M.; Iakimov, T.; Khranovskyy, V.; Abrikosov, I.A.; Yakimova, R. On the interaction of toxic heavy metals (Cd, Hg, Pb) with graphene quantum dots and infinite graphene. Sci. Rep. 2017, 7, 3934. [Google Scholar] [CrossRef] [PubMed]
- Shtepliuk, I.; Yakimova, R. Interband transitions in closed-shell vacancy containing graphene quantum dots complexed with heavy metals. Phys. Chem. Chem. Phys. 2018, 20, 21528–21543. [Google Scholar] [CrossRef] [Green Version]
Figure 1.
Cyclic voltammogram of the epitaxial graphene working electrode in the 0.01 M HClO4 electrolyte solution without (deep orange colored curves correspond to three consequent cycles) and (dark blue colored curves correspond to three consequent cycles) with 0.1 mM Hg2+; scan rate: 20 mV∙s−1. Inset: zoomed region of the cyclic voltammogram, which represents the cathodic and anodic processes in the potential range from 0 to 0.4 V.

Figure 2.
(a) Cyclic voltammogram of epitaxial graphene working electrode in 0.01 M HClO4 electrolyte solution containing 0.1 mM Hg2+ at v = 20 mV∙s−1 scan rate. Shaded areas correspond to the integrated charges involved in each process: mercury electroreduction (deep orange color) and anodic stripping of mercury (grey color). Deconvolution of the Hg-related stripping (oxidation) peak (b) and plating (reduction) peak (c).

Figure 3.
(a) Voltammograms related to the electrodeposition and anodic stripping of Hg on the epitaxial graphene electrode in 0.1 M HClO4 + 0.1 mM Hg2+ at v = 20 mV∙s−1 scan rate. (b) Schematic representation of the one-step and two-step Hg-involved redox reactions at the epitaxial graphene surface.

Figure 4.
(a) Potentiostatic current transients for the electrodeposition of mercury onto the epitaxial graphene electrode from in 0.1 M HClO4 + 0.1 mM Hg2+ recorded at the cathodic potential pulses of different amplitudes (from blue-colored curve at −0.2 V to dark red-colored curve −0.3 V). (b) Comparison of the dimensionless experimental current–time transients for the electrodeposition on mercury onto epitaxial graphene electrode with the theoretical transients for instantaneous (bold solid red curve 1) and progressive (bold solid blue curve 2) nucleation.

Figure 5.
Plots of the current (recorded at the different deposition potentials: from −0.2 V to −0.26 V) as a function of the inverse square root of the time for electrodeposition of mercury on the epitaxial graphene from 0.1 M HClO4 + 0.1 mM Hg2+ electrolyte solution.
Figure 5.
Plots of the current (recorded at the different deposition potentials: from −0.2 V to −0.26 V) as a function of the inverse square root of the time for electrodeposition of mercury on the epitaxial graphene from 0.1 M HClO4 + 0.1 mM Hg2+ electrolyte solution.

Figure 6.
Side view and top view of the relaxed configurations of isolated (a) [Hg(H2O)6]2+ and (b) [Hg(H2O)6]0 complexes. Light pink, light magenta and red spheres represent H, Hg and O atoms, respectively. The polyhedra corresponding to bond generation are grey colored.
Figure 6.
Side view and top view of the relaxed configurations of isolated (a) [Hg(H2O)6]2+ and (b) [Hg(H2O)6]0 complexes. Light pink, light magenta and red spheres represent H, Hg and O atoms, respectively. The polyhedra corresponding to bond generation are grey colored.

Figure 7.
Side view and top view of the relaxed configurations of isolated (a) [Hg(H2O)6]2+ and (b) [Hg(H2O)6]0 complexes adsorbed on graphene. Brown, light pink, light magenta and red spheres represent C, H, Hg and O atoms, respectively. The polyhedra corresponding to bond generation are grey colored.

Figure 8.
(a) Side and top view plots of the noncovalent interaction (NCI) iso-surface (RDG = 0.5) for [Hg(H2O)6]0 on graphene. The iso-surfaces are colored according to sign(λ2)ρ over the range −0.035 to 0.02 a.u. Red indicates the steric repulsion region; green (light brown) indicates the van der Waals interaction region, and blue implies the strong attractive interaction. Contour plots of the (b) electron density and (c) electron localization function (ELF) for [Hg(H2O)6]0 adsorbed onto graphene.


Table 1.
Parameters describing the electrochemical behavior of the Hg2+/Hg0 redox couple at room temperature at the epitaxial graphene electrode.
Table 1.
Parameters describing the electrochemical behavior of the Hg2+/Hg0 redox couple at room temperature at the epitaxial graphene electrode.
| Parameter | Anodic Process Hg0 − 2e−→Hg2+ | Cathodic Process Hg2+ + 2e−→Hg0 |
|---|---|---|
| Current density, mA/cm2 | 35.75 | −4.88 |
| Potential, V | 0.244 | 0.043 |
| Surface charge density, mC/cm2 | 90 | 16 |
| Electron transfer rate constant, 10−2 × cm∙s−1 | 6.4 | 0.89 |
© 2019 by the authors. Licensee MDPI, Basel, Switzerland. This article is an open access article distributed under the terms and conditions of the Creative Commons Attribution (CC BY) license (http://creativecommons.org/licenses/by/4.0/).
Share and Cite
MDPI and ACS Style
Shtepliuk, I.; Vagin, M.; Yakimova, R. Insights into the Electrochemical Behavior of Mercury on Graphene/SiC Electrodes. C 2019, 5, 51. https://0-doi-org.brum.beds.ac.uk/10.3390/c5030051
AMA Style
Shtepliuk I, Vagin M, Yakimova R. Insights into the Electrochemical Behavior of Mercury on Graphene/SiC Electrodes. C. 2019; 5(3):51. https://0-doi-org.brum.beds.ac.uk/10.3390/c5030051
Chicago/Turabian StyleShtepliuk, Ivan, Mikhail Vagin, and Rositsa Yakimova. 2019. "Insights into the Electrochemical Behavior of Mercury on Graphene/SiC Electrodes" C 5, no. 3: 51. https://0-doi-org.brum.beds.ac.uk/10.3390/c5030051
Note that from the first issue of 2016, this journal uses article numbers instead of page numbers. See further details here.