Review

On the Emission Properties of Carbon Dots: Reviewing Data and Discussing Models

1
Department of Physics, University of Cagliari, sp 8, km 0.700, 09042 Monserrato, Italy
2
Department of Chemical and Geological Sciences and INSTM, University of Cagliari, sp 8, km 0.700, 09042 Monserrato, Italy
*
Author to whom correspondence should be addressed.
Submission received: 15 August 2019 / Revised: 25 September 2019 / Accepted: 30 September 2019 / Published: 2 October 2019

Abstract

:
The emission properties of carbon dots (CDs) have already found many potential applications, from bio-imaging and cell labelling, to optical imaging and drug delivery, and are largely investigated in technological fields, such as lighting and photonics. Besides their high efficiency emission, CDs are also virtually nontoxic and can be prepared through many green chemistry routes. Despite these important features, the very origin of their luminescence is still debated. In this paper, we present an overview of sounding data and the main models proposed to explain the emission properties of CDs and their tunability.

1. Introduction

Carbon-based quantum dots (CDs) are a large set of nanosized fluorescent particles with a high quantum yield (QY) that can be prepared by means of adaptable and bendy synthesis, spanning from top-down to bottom-up approaches. The first observation of carbon nanoparticles emission was reported in the early 2000s [1,2], and the CD acronym appeared afterward [3]. Since then, the research on this matter is exponentially increasing (according to Scopus, the search engine by Elsevier, more than 1900 search results for 2019 to date and even 28 already dated 2020), with thousands of papers published on the subject in the last few years [4]. Besides a high QY (even larger than 80% [5,6,7,8,9]), other appealing features of CDs are low toxicity, biocompatibility, and photo- and water stability [10,11,12], which make them suitable for applications in luminescence-related fields, such as bioimaging and sensing [13,14,15], photocatalysis [16,17], LED [18,19], lasing [20,21], printing, and cosmetics [22,23] or displays [24]. In addition, drug delivery applications were proposed, exploiting the easy surface functionalization of CDs’ surface [23,25,26]. All these applications take advantage of two quite unusual optical properties: a quite large Stokes shift (on average larger than 100 nm if we consider near UV excitation around 350 nm and the blue emission) and an excitation wavelength dependent peak position, allowing tuning of the emission from blue to red across the whole visible spectral range [4,27,28]. These properties strongly depend on the synthesis conditions, and several factors can affect the optical properties of CDs, including the synthesis technique, the chosen precursors or starting materials, the post-synthesis treatments, time and temperature of the synthesis, surface functionalization or passivation, and heteroatom doping. Not only do these factors affect the QY of the emission, but also the spectral features of the emission itself, leading to, for example, partial or full excitation wavelength independent emission properties [29,30]. With reference to the synthesis approach, CDs are separated into two large families: nanoparticles obtained through top-down cutting techniques and those prepared by bottom-up carbonization of organic precursors. Top-down synthesis starts from bulk carbon precursors (graphene, ash, or soot) that are cut down to nanosized dimensions by means of physical and chemical methods, such as laser ablation, electrochemistry, and wet oxidation. In the case of bottom-up approaches, the starting point is a mix of small organic molecules that undergoes pyrolysis. Through polymerization, the carbonization of the precursors can be achieved by means of microwave, ultrasonication, hydrothermal, or solvothermal treatments.
The very large number of variables (as shown by the vast literature on the subject) adds further complexity to the chase of a straightforward explanation of the origin of the CDs’ optical properties. Different emission mechanisms are reported, and the debate focuses on three main possibilities [4,31]: (1) the core emission, due to the conjugated π-domains of carbon core or to the quantum confinement effect; (2) the surface states, related to the presence of functional groups connected with the carbon backbone; and (3) the molecular state, where the emission originates from free or bonded fluorescent molecules. In the last few years, although a general consensus on the photoluminescence (PL) mechanism is still missing, the correlation between the structure and the chemical composition of the CDs emerged as the distinguishing feature to assign a specific model to a subclass of CDs. In this review, we present an overview of sounding data that promote a specific model, aiming to define, when possible, the singular character of each subgroup.

2. Materials and Methods

According to the two synthesis approaches, we can divide the starting materials into two large families: the macroscopic carbon-based resources, which undergo reduction to nanosized particles by means of physical or chemical treatments, and the molecular organic precursors, which react to build CDs via pyrolysis (Figure 1). The second group is virtually infinite, accounting for the endless possibility of organic chemistry, which includes foodstuff; the first one is restricted to carbon “bulk” samples, such as candle soot, graphite powders and rods, graphene, carbon black, and carbon nanotubes. The most popular precursor in the bottom-up synthesis is citric acid (CA), a nontoxic molecule with three carboxylic groups. CA is cheap, readily available, and even naturally present in numerous citrus fruits. The carbonization temperature is quite low, about 200 °C [32], thus making this molecule the choice of election for low-temperature carbonization synthesis, even though the QY of CDs prepared by solely CA is usually very low [29]. Indeed, the combination with other precursors, providing hydroxyl groups, carboxyl group, and heteroatoms [33,34], are required to achieve a larger QY (vide infra). Other carbon sources, such as glucose, sodium citrate, ethylenediamine (EDA), carbon nitride (C3N4), polymers, and so on, allow achieving a QY of the emission that is generally low if they are not combined with N-containing precursors [4,11,35]. Among them, the most popular one is EDA, a basic organic molecule containing two primary amines. EDA is the source of nitrogen doping and is also applied for surface passivation, allowing for an increase in the QY that is over 90% [9]. The way nitrogen atoms are embedded within the carbon network (the degree of nitrogen substitution) largely affects the final chemical structure and the optical properties of the CDs and depends on the numbers of amines of the precursors and the length of alkyl chains. For example, it was shown that primary amines are more efficient, concerning QY, than secondary and tertiary ones, with the latter showing optical properties similar to undoped CDs [36]. Furthermore, the number of amines affects the PL efficiency, with EDA allowing for a larger QY then ethanol amine [34], and the length of the alkyl chain acts on the same direction. By changing the nitrogen precursors, indeed, the number of doping atoms incorporated in CDs changes, leading to the formation of pyridinic and pyrrolic nitrogen structures around the core termination or the core edge, or as amine and imine groups, thus enhancing the conjugation of the system and improving the QY [35,37,38].

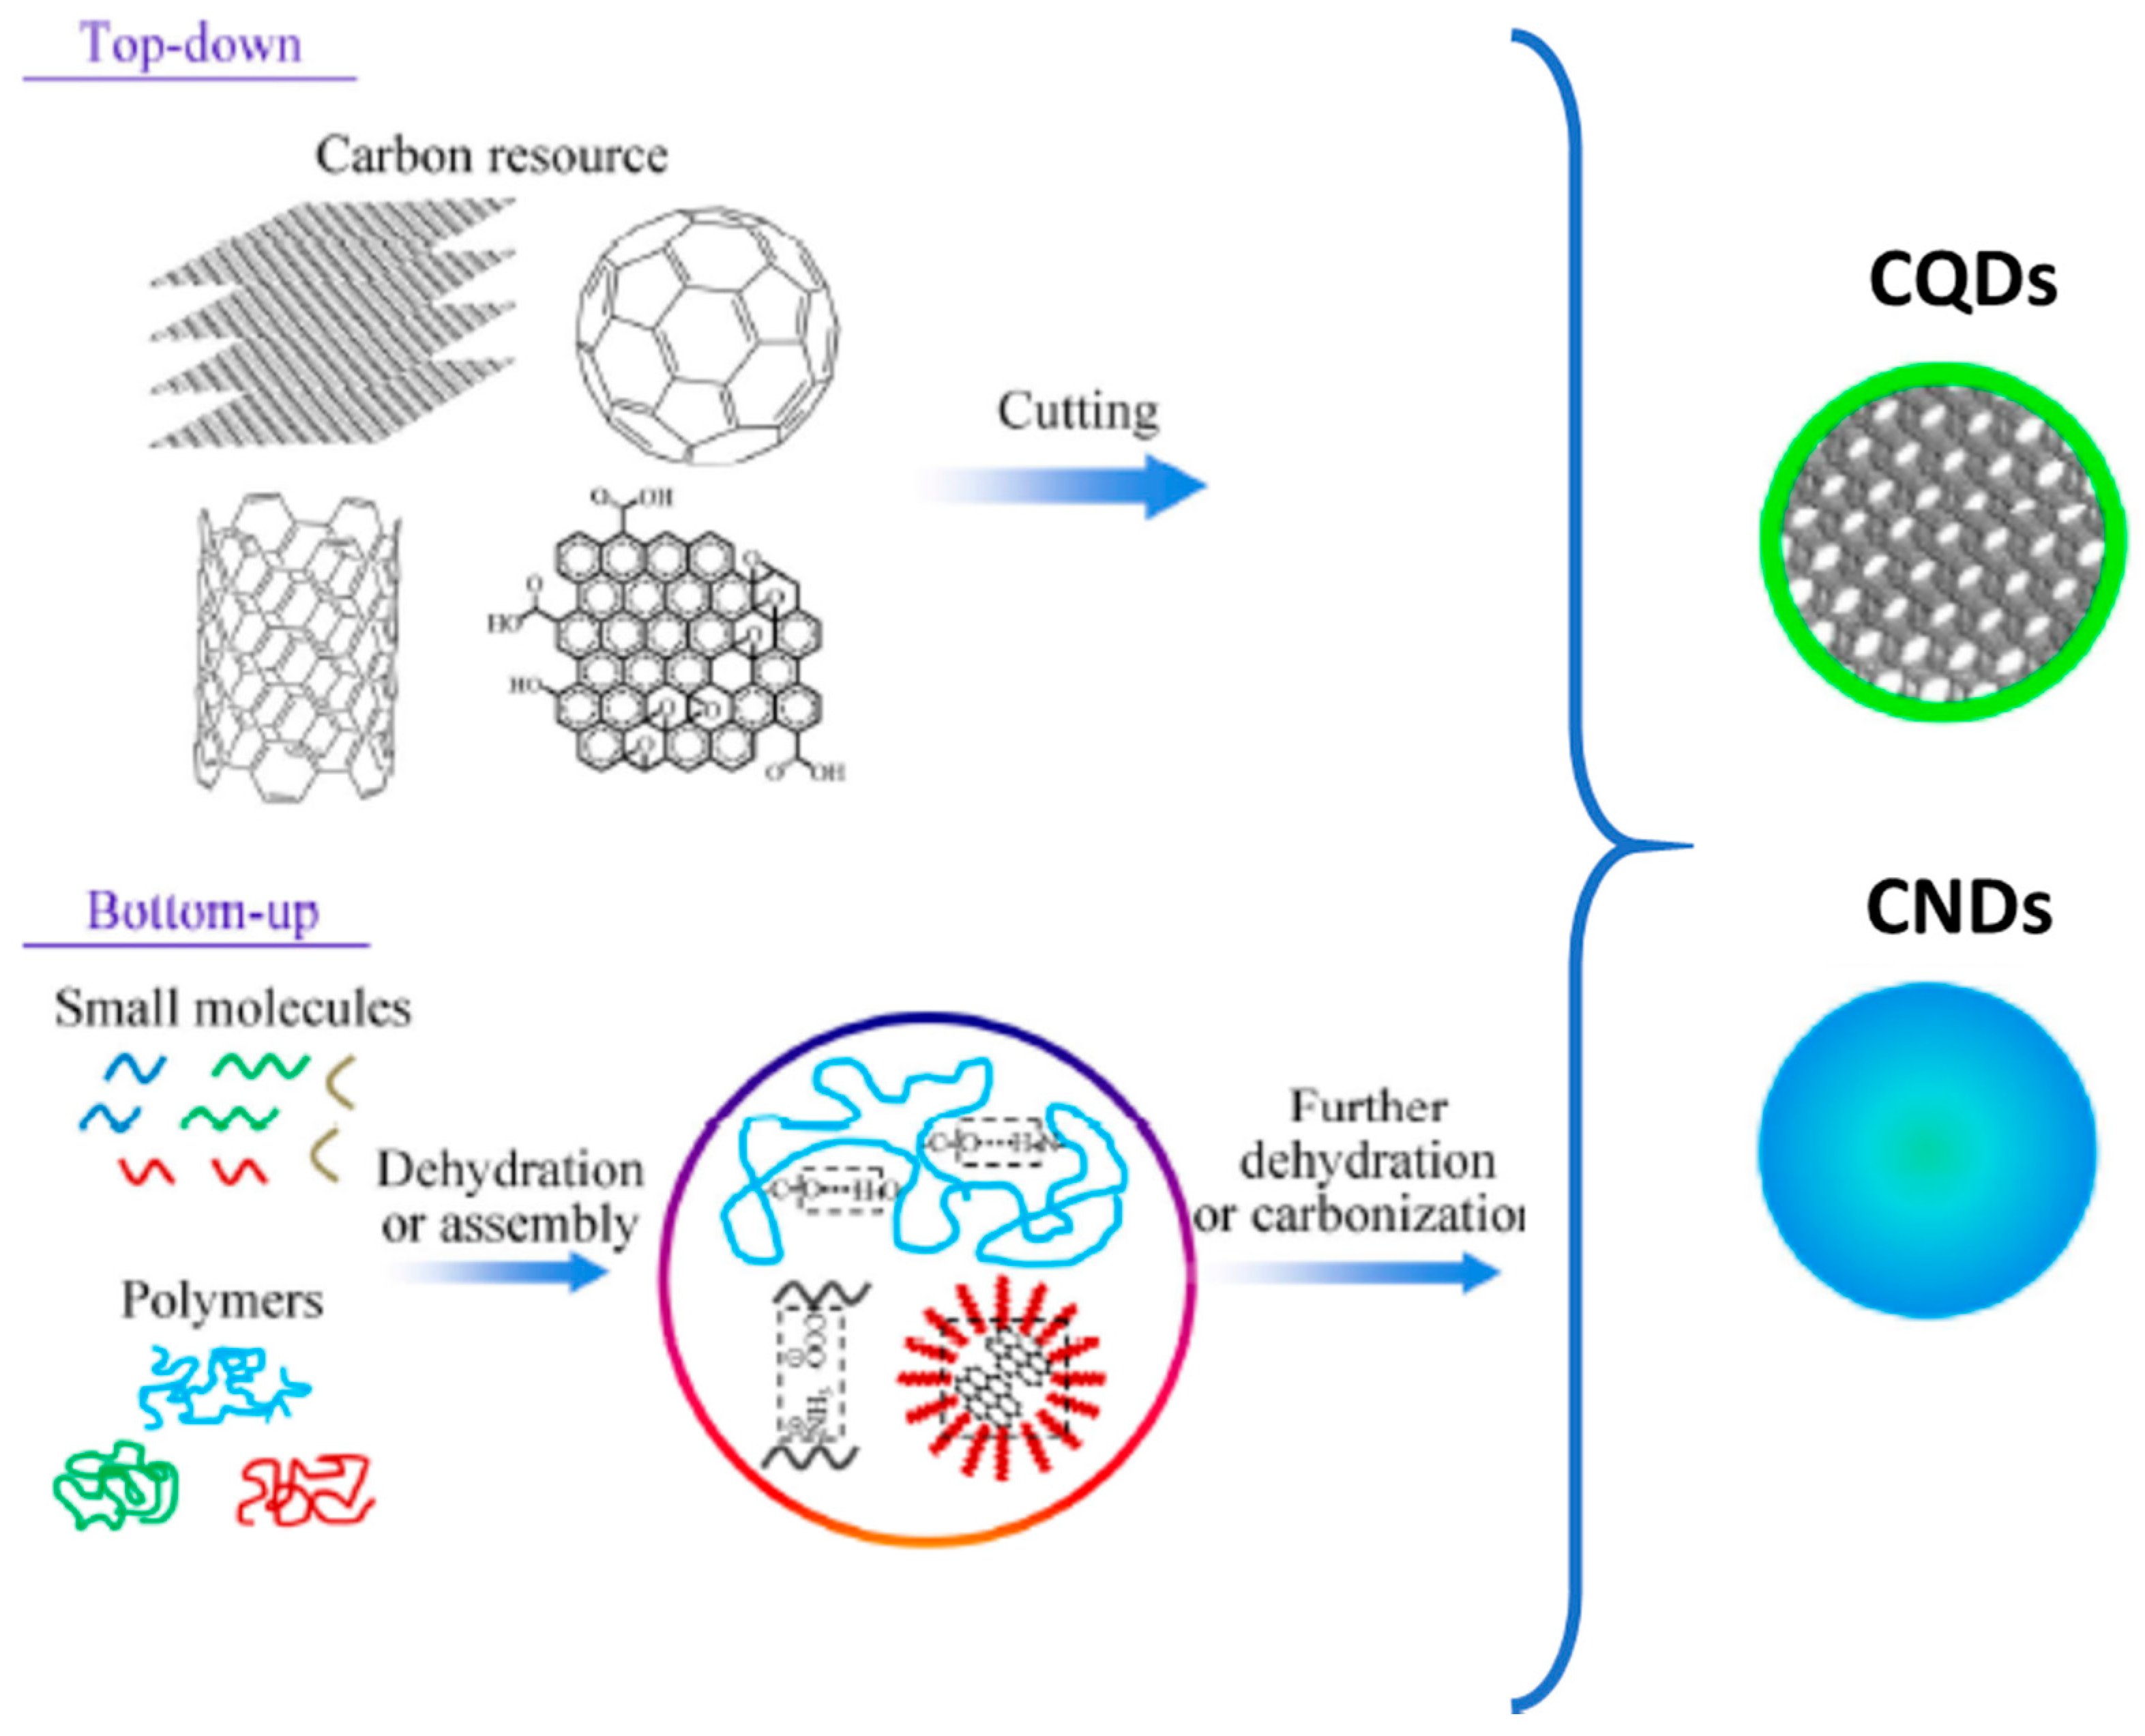
2.1. Top-Down Approaches

After the accidental discovery of fluorescent carbon nanoparticles [2], top-down methods led the research on CDs until 2009. Then, after that, CD research was overcome by bottom-up approaches because of more facile and less harsh conditions of synthesis. Obtained as by-products of carbon nanotubes during arc discharge experiments and after oxidation procedures [2], the first attempt of purpose synthesis was accomplished by laser ablation of graphite, holding fluorescent nanoparticles, after oxidation and surface passivation, with a QY of 10% [3]. Later, it was shown that both the carbon source and the experimental irradiation conditions affect the morphology and the optical properties of the cropped CDs [39]. Besides CDs extracted from burning candles or natural gas [40], late top-down synthesis exploited electrochemical etching of carbon nanotubes and fibers, whose spectral features largely depend on post-synthesis surface oxidation [41].

2.2. Bottom-Up Approaches

The pyrolysis of precursors containing carbon atoms and useful dopants produces fluorescent CDs of high QYs. The carbonization is typically achieved by solvothermal process, microwave burning, or thermal combustion [35]. The reaction is carried out in the 150–300 °C range, with the temperature and time of the synthesis being crucial parameters, besides the choice of the precursors. The first reported bottom-up approach was the hydrothermal synthesis of CDs, starting from citric acid and N-(2-hydroxyethyl)ethylenediamine at 300 °C [42]. Since this pioneering work, CA and EDA, or other dopant sources such as urea, were largely applied by changing the molar ratio of the precursors, and/or the kind and relative volume of the solvent, to achieve very efficient optical emissions in the visible range [14,43,44]. It was shown that a 1:4 molar ratio of citric acid and EDA burned in autoclave at 200 °C for 5 h allows a QY of 0.8 to be reached [14]. Recently, we reached the highest QY of about 0.99 by mixing CA and EDA in a 1:25 molar ratio (pyrolysis with an open vessel in oil bath at 190 °C for 2 h) [9]. It is worth noting that, during CA-based bottom-up synthesis, different intermediates can be produced, which participate in the formation of fluorescent compounds bonded to, or included in, the CD structure, or that could be exploited as new precursors for CD formation [9,35,45]. As a result, the higher the reaction temperature, the larger the carbogenic core; on the contrary, the lower the temperature, the larger the content of organic fluorophore and the greater the fluorescence intensity/QY [44,46,47].

3. Optical and Structural Properties of CDs

The most appealing features of CDs are their emission properties. CDs are always characterized by means of UV/vis absorption and fluorescence spectroscopies, typically paired with structural analysis, such as Raman, FTIR, and XPS, to correlate the optical characteristics to the chemical composition of the material. In the following, we summarize the main figures.

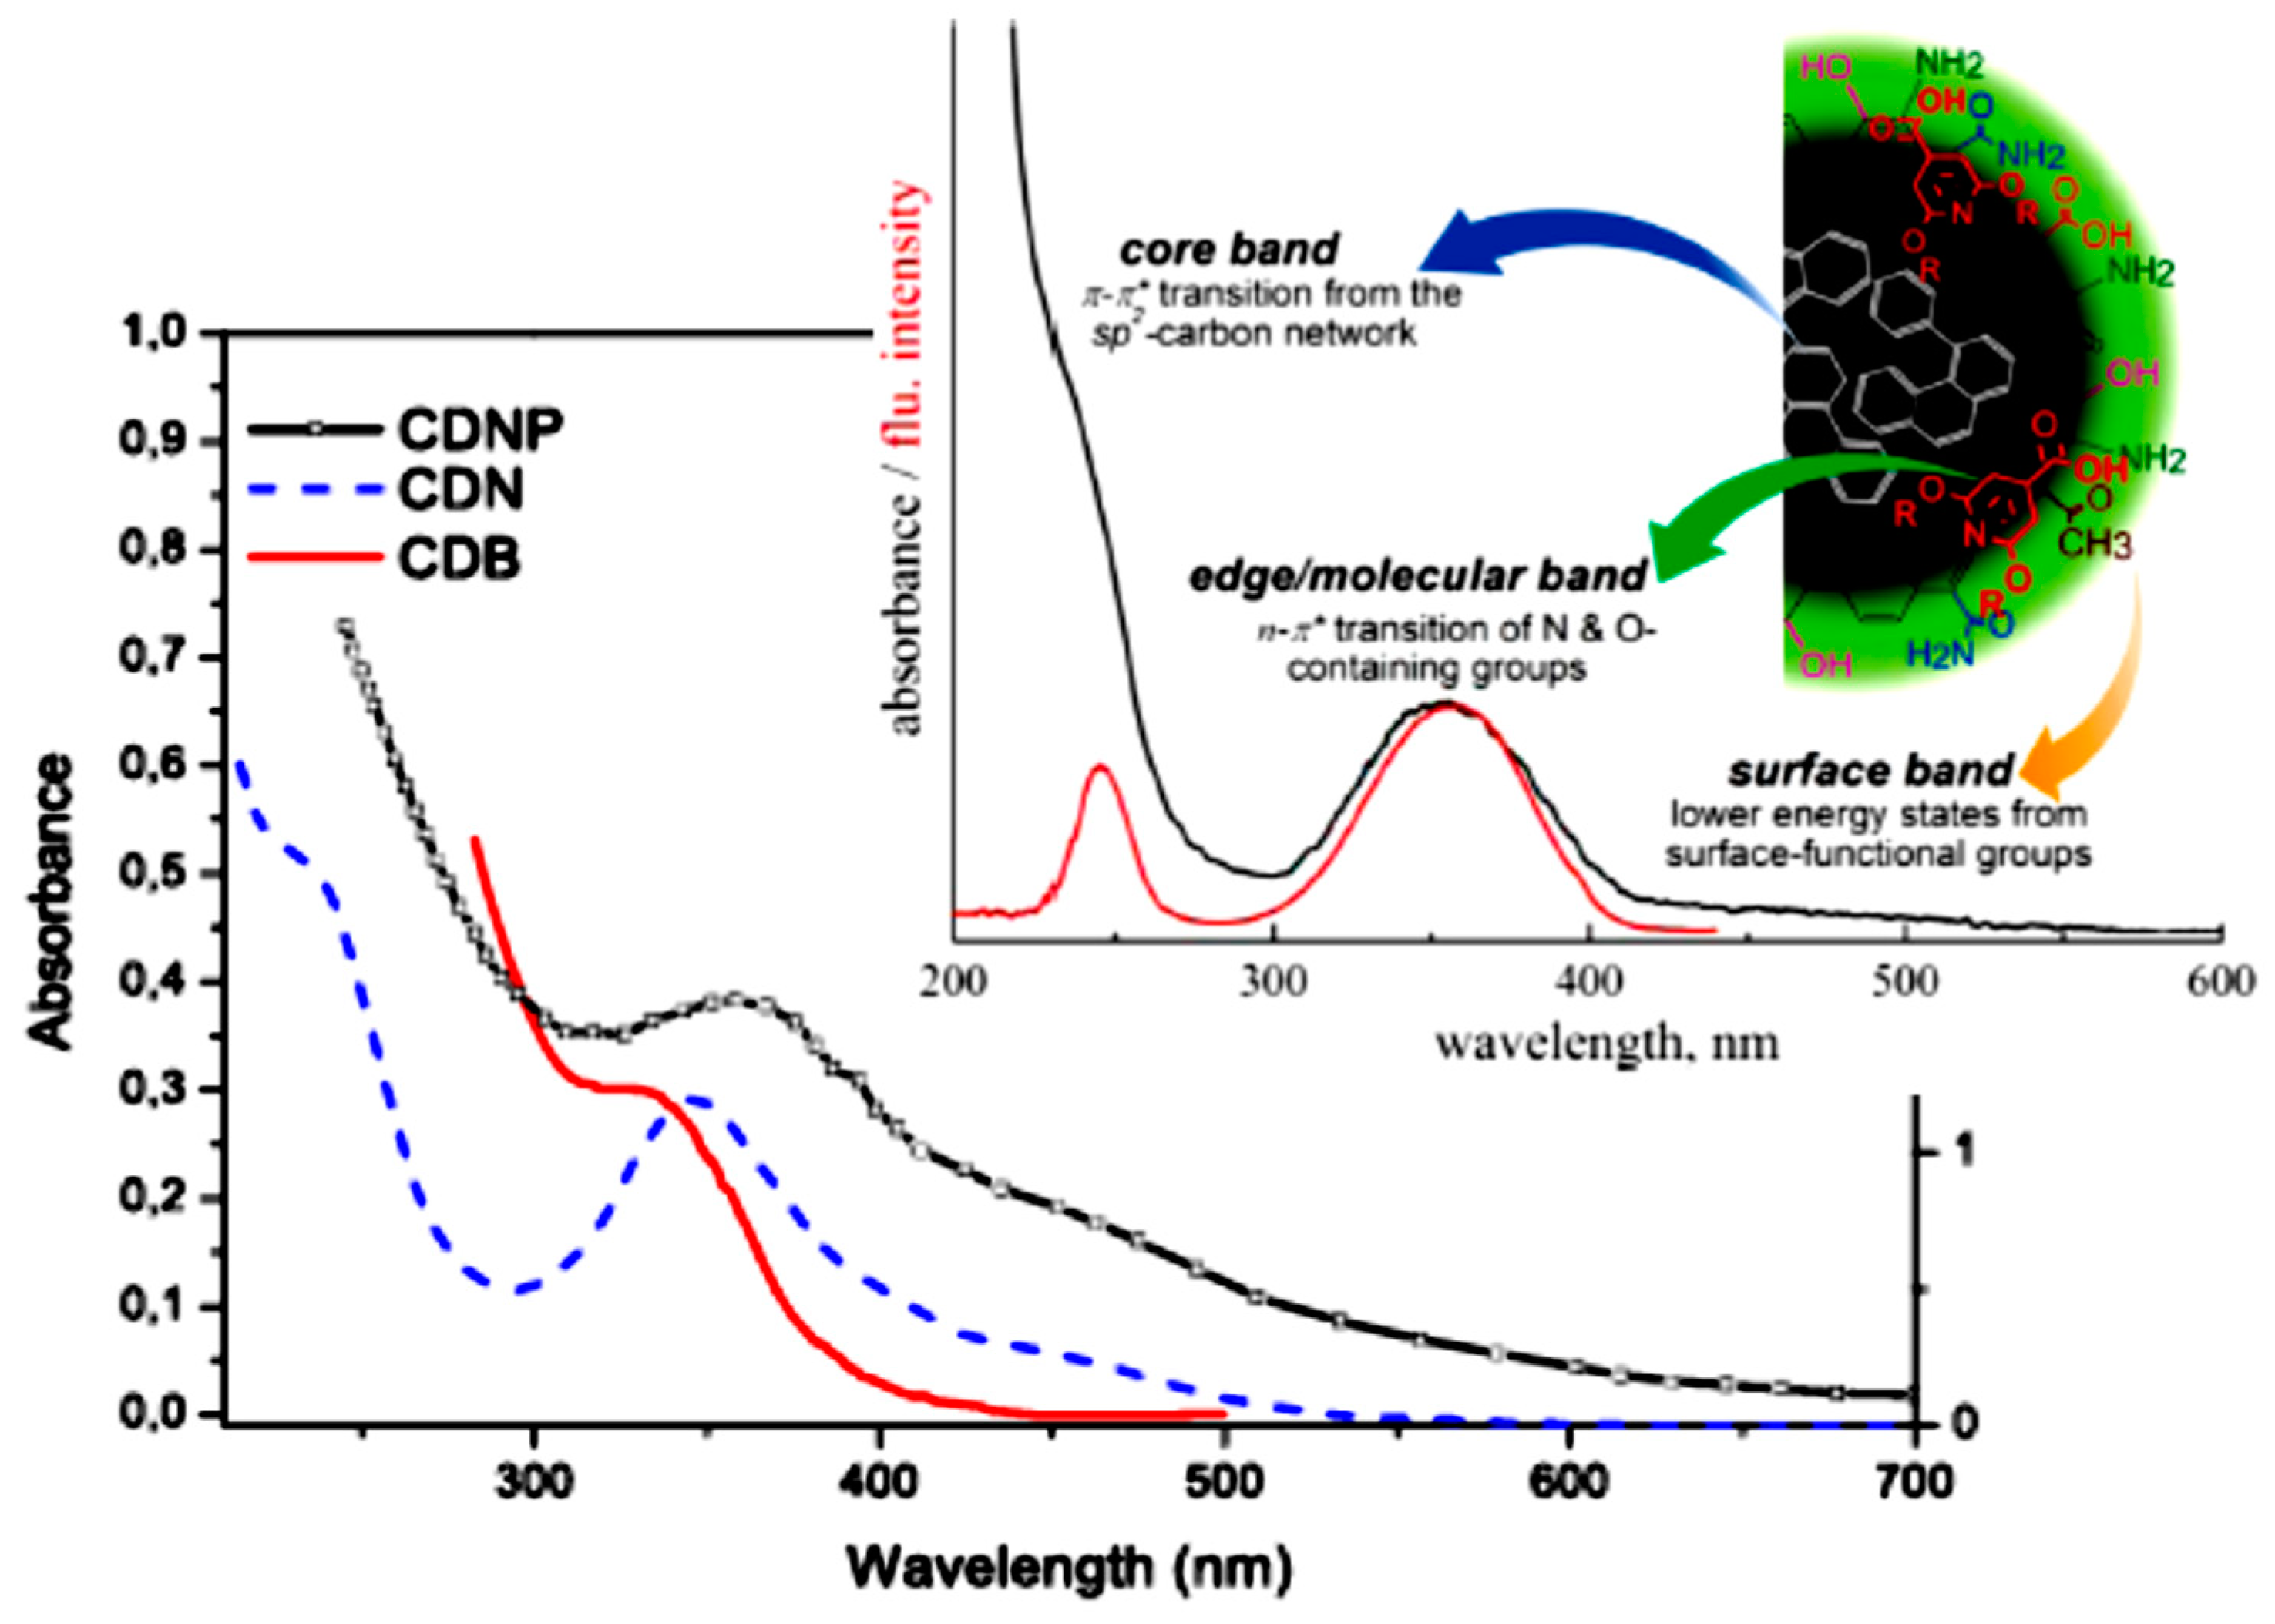
3.1. Optical Absorption

The optical absorption spectrum of CDs is in general made up of two main bands, peaked around 250 and 350 nm. This spectrum is always reported for doped CDs, irrespective of the synthesis procedure, but in the case of bare samples, where no heteroatoms are added as precursors or those atoms do not participate in the formation of specific optical centers, the near UV band is not resolved (Figure 2, CDB are bare samples, and CDN and CDNP are nitrogen-doped ones) [29,35,36]. These two bands are assigned to π-conjugated electrons in the sp2 atomic framework and the chemical groups connected at the edge of the nanoparticle. As illustrated in Figure 2, the far UV broad peak is ascribed to the π–π* transition of aromatic C=C bonds participating in the carbon network, whilst the near UV band around 350 nm is described either as an edge or molecular band due to the n–π* transitions of N or O containing structures at the edge of the carbon structure. Beside these two bands, a long tail extending into the visible range of the spectrum is often reported and ascribed to lower-energy surface centers, typically related to nanoparticle functionalization. As we will discuss in the following, in the last few years, the core-state picture for the absorption features was questioned based on the molecular model. Indeed, some molecules, whose formation was evidenced in particular in citric-acid-based synthesis [36,48] show comparable absorption spectra in the 200–400 nm range. The presence of those molecules at the CD surface or within the CD structure, and even the formation of emitting aggregates of them, could be the origin, at least in part, of the reported features.
Quantomechanical calculations, performed by using a simple multilayer model of oxygen functionalized pyrene and coronene building blocks [49], identified the π–π* transition of sp2 conjugated aromatic carbon rings to the far UV band, and a mixed π–π* and n–π* contribution to its tail of this band around 300 nm. By modeling N-doped CDs with graphene single layer, Strauss et al. confirmed the far UV π–π* transition, calling for blue-shift when pyridinic nitrogen and epoxy-oxygen atoms are inserted in the model [50]. Recently, the presence of graphitic nitrogen was shown to have an electron-doping effect, causing pronounced red-shift of their absorption spectra. Other kinds of nitrogen, including pyridinic, pyrrolic, and amino centers, had no appreciable effects on the CDs’ absorption properties [38].

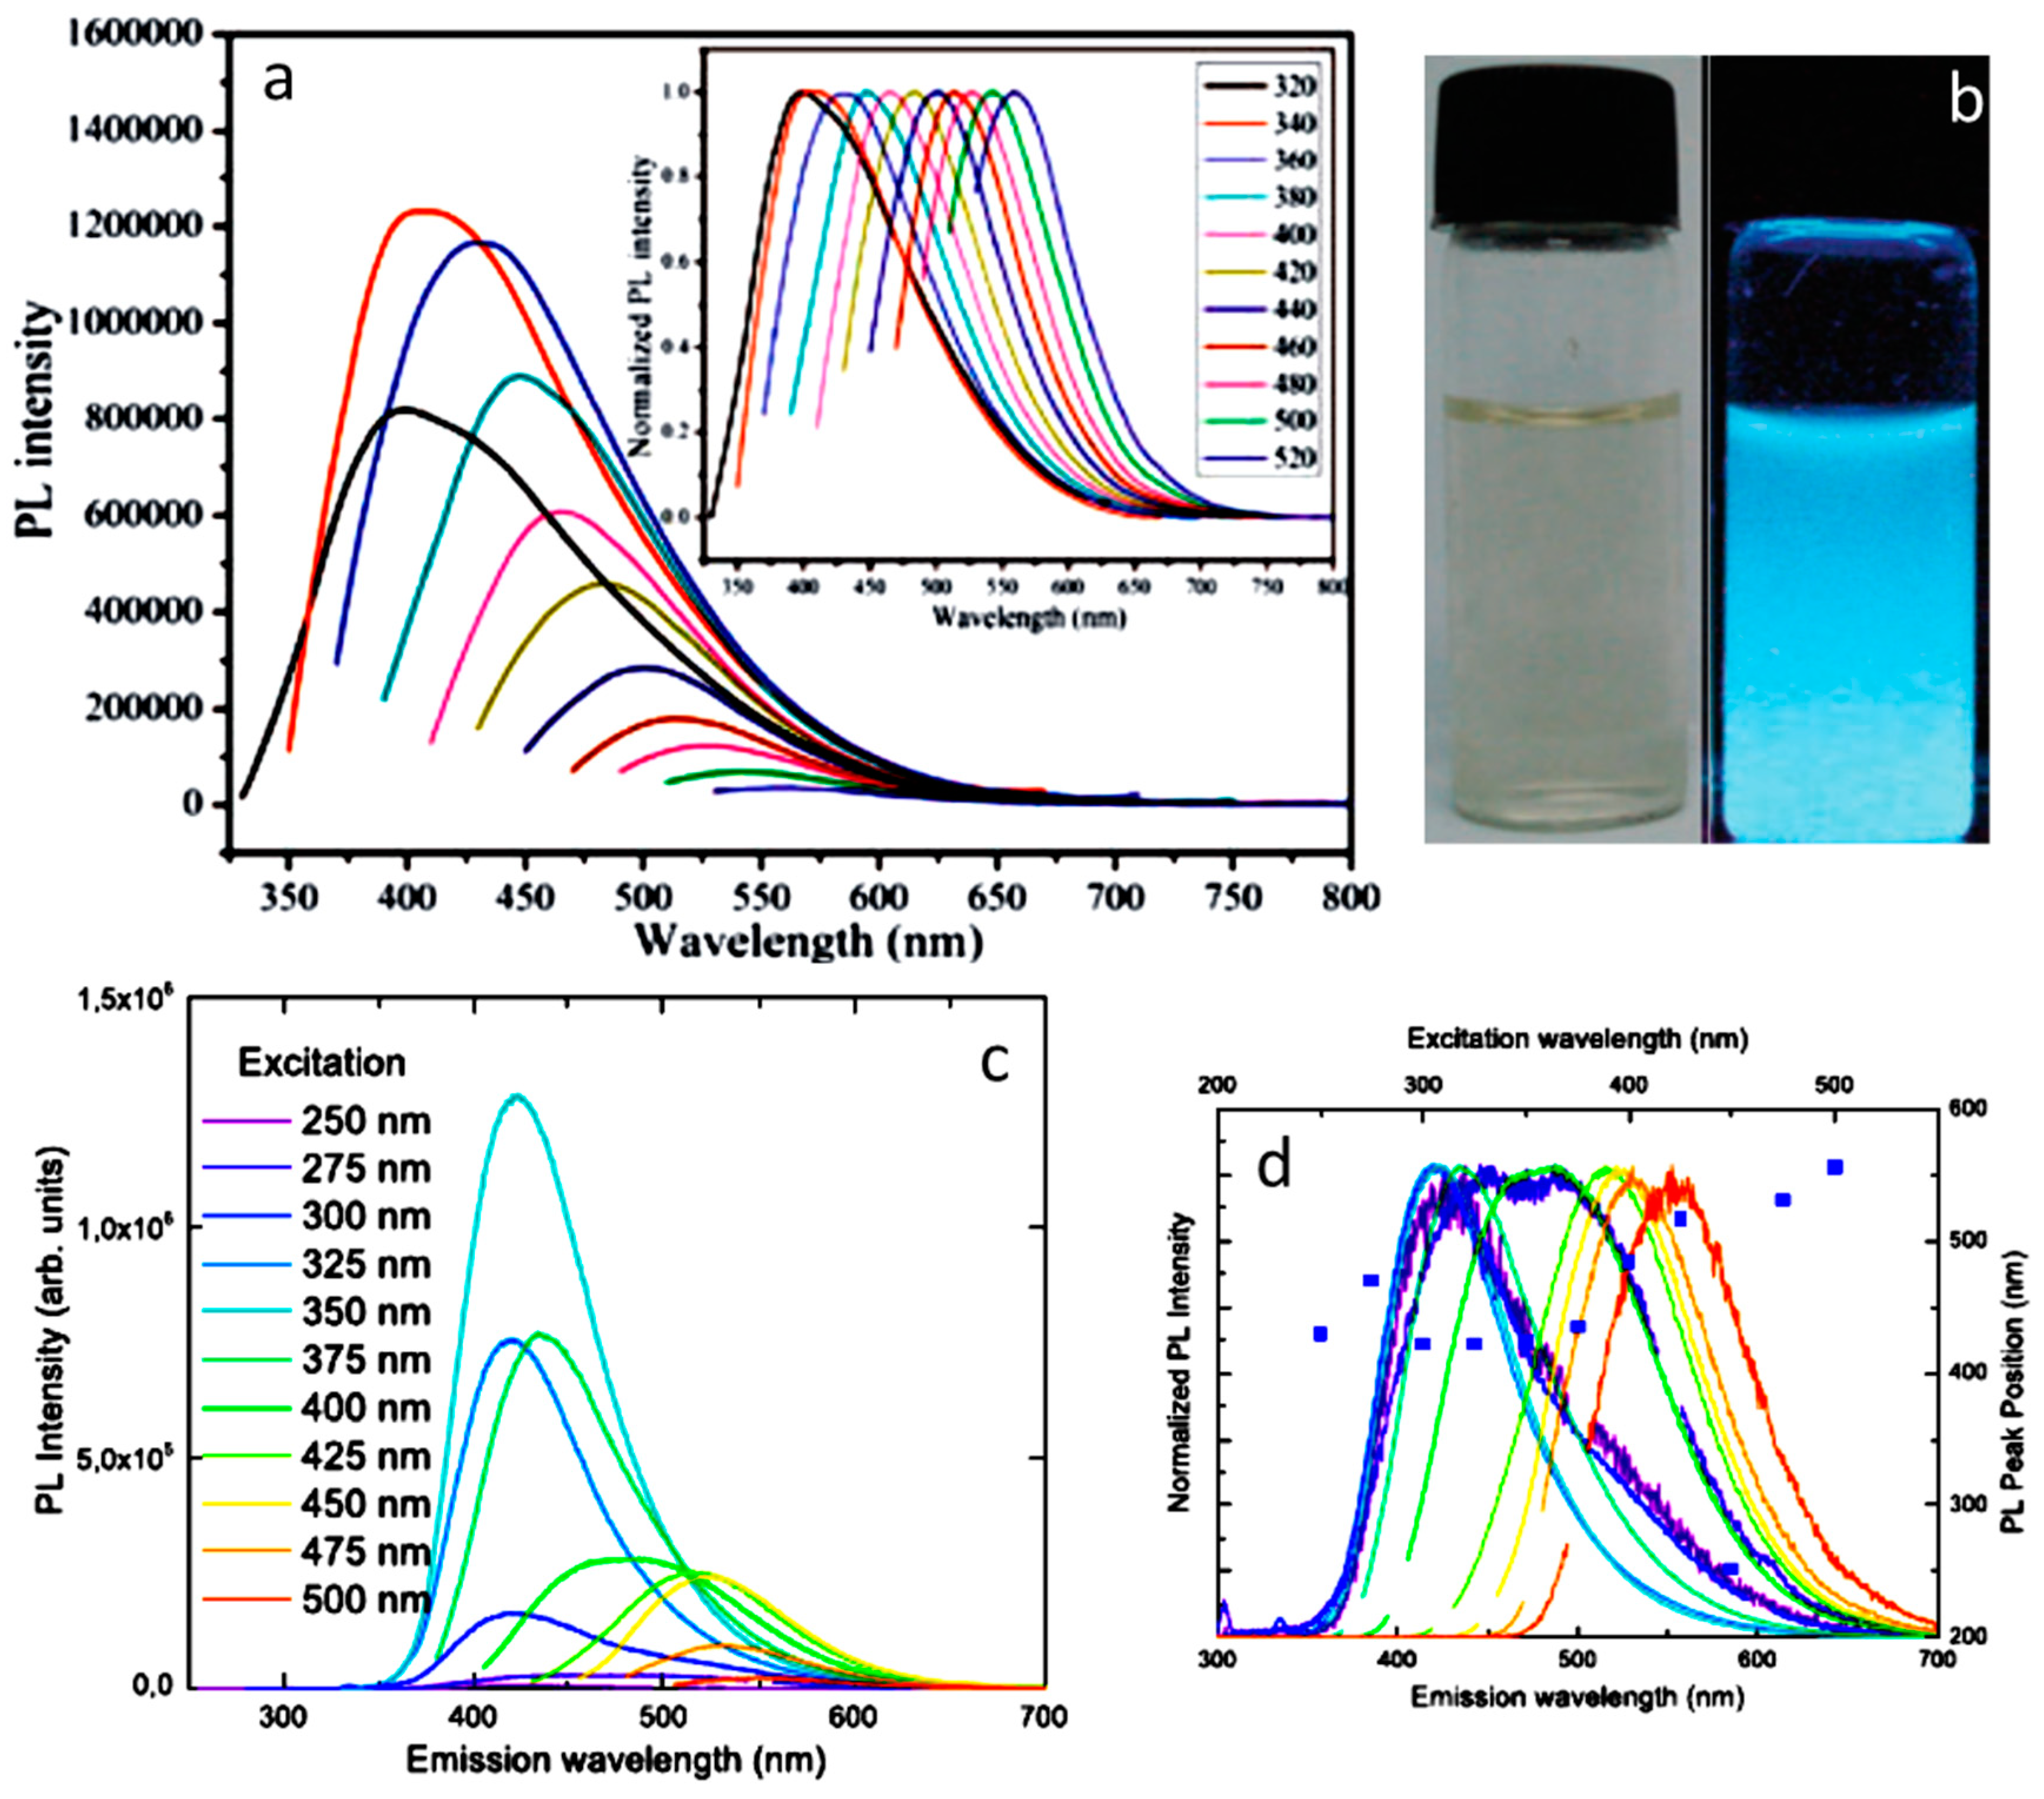
3.2. Emission and Excitation Spectra

CDs’ main emission band is located in the blue, typically at about 450 nm when excited in the n–π* absorption band. This emission is quite intense whilst the excitation in the far UV (π–π* absorption band) typically returns very low photoluminescence [29,35]. The distinguishing emission property of CDs is that the photoluminescence spectrum is excitation-wavelength dependent, undergoing bathochromic shift as the excitation red shifts (Figure 3) [3,51] and decreasing intensity because of low optical absorption in the visible range (see Figure 3a,c for bare and nitrogen-doped CDs, respectively). There is, however, a threshold trend: the PL peak position keeps almost constant when increasing the excitation wavelength from UV to near visible around 380–400 nm, and then it keeps increasing in wavelength as the excitation spans the visible range (Figure 3d, blue dots refer to the PL peak position, top and right axis). The reason of this peculiar feature is grounded in the very mechanism of the optical emission, which will be discussed later in detail, but excitation-wavelength indipendent emissions were also reported [8,52,53]. The excitation/emission matrix evidenced, in some cases, two distinct PL bands, in the blue and green region, with different excitation dependence, calling for multiple contributions to the emission spectrum [29,43,53,54]. Chemical composition and morphostructure of the CDs are intimately related to their optical properties. Undoped, or bare CDs, contain only carbon and oxygen atoms, if not subjected to post-synthesis treatment, whilst doped nanoparticles exploit doping, mostly by means of nitrogen, but sulfur, chlorine, and phospor are also reported, to boost their emission features [35]. As for the absorption properties, the quantum chemical calculations evidenced the strong correlation between optical properties and structural and chemical composition. It was shown that nitrogen can be present within the CD structure in the form of amine, pyridinic, and pyrrolic moieties. Pyridinic and pyrrolic doping caused a blue-shift in the absorption and fluorescence maxima, whilst a red-shift was related to the presence of amine groups [55].
As reported previously, and optimally reviewed by Mintz et al. [4], QY largely depends on the synthesis conditions, the highest values recorded in bottom-up approaches (up to 99% [9]), whilst the QY in top-down routes is typically not larger than 15% (but a value of 50% was reported for Zn-doped CDs prepared by laser ablation [56]). The lifetime of the fluorescence was in the nanosecond range (4–15 ns), and no significative differences were recorded with the different synthetic approach. With very few exceptions [57,58], the PL decay is a non-single exponential, an indication of multiple contributions to the overall emission and also of non-radiative pathways being accessibile to the whole PL spectrum. To single out the decay of a specific component is quite hard when a distribution of emitting centers or CDs are being probed at the same time. Schneider et al. [36] reported that faster decays are assigned to undoped nanoparticles, whilst a variable decay of about 8–10 ns, depending on the excitation, is the fingerprint of fluorescent molecules. Recently, a long-lasting phosphorescence emission was reported, with a lifetime of about a few seconds and a very small QY [59,60].

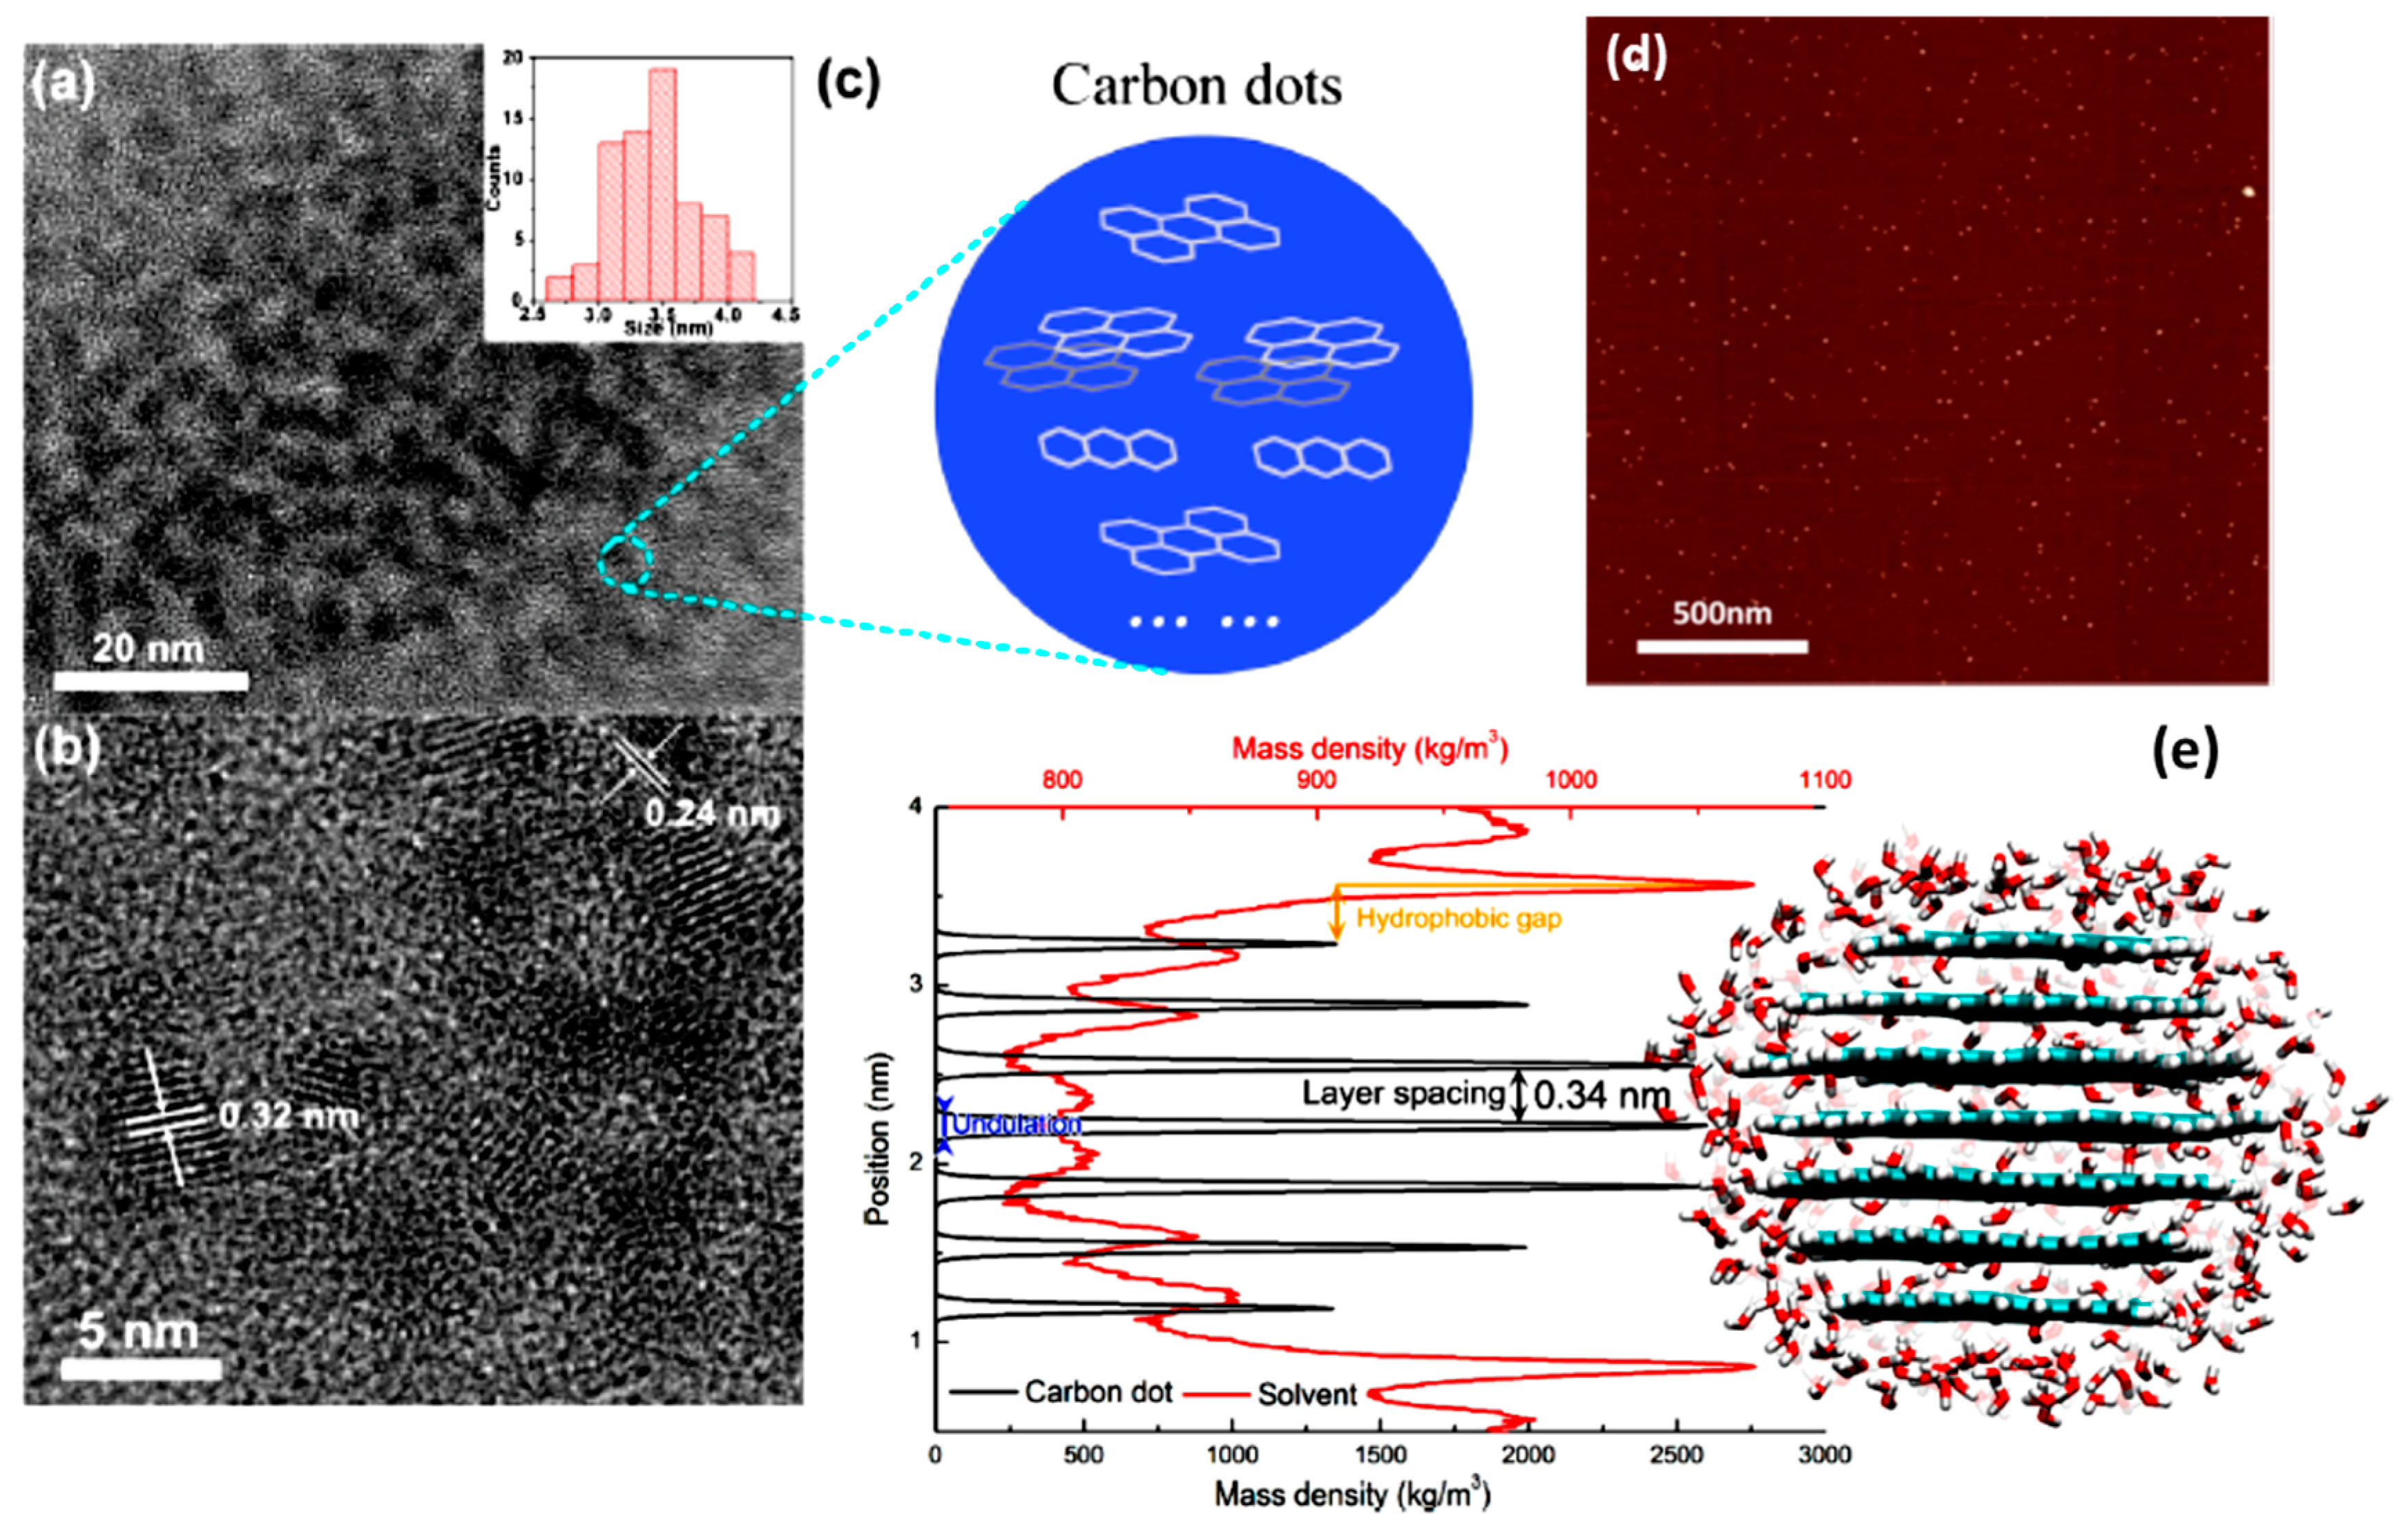
3.3. Morphology and Structure

CD nanoparticles have dimensions in the nanometer scale. Figure 4 shows TEM and AFM images of rounded particles with a 2–10 nm of diameter. The fringes detected by electron diffraction analysis of HRTEM images call for (001) and (002) lattice planes of graphite (2.1–2.4 Å and 3.2–3.8 Å distances, respectively) [42,61], but also almost non-crystalline particles, with no evidence of lattice planes, are reported [15,62]. The disorder is ascribed to turbostratic stacking among multiple graphitic layers, and it is correlated well with broad diffraction peaks observed in X-ray diffraction (XRD) patterns [29]. Recently, Paloncýová et al. [63] succeeded in generating rounded CDs, by means of molecular dynamics calculations, with an interlayer distance of 3.4 Å. The CD surface was functionalized by various oxygen terminations that participate in stabilizing the structure and bestowing hydrophilic character to the particle. It is worth noting that the simulations evidenced a dynamic structure, with each graphitic layer showing fluctations and rotations around its equilibrium position.
Although the separation between ordered and disordered CDs is not sharp, with disordered domains also being osserved with ordered ones, CDs are grouped in two classes, crystalline carbon quantum dots (CQDs) and disordered carbon nanodots (CNDs), depending on their core feature. CQDs present a core constituted by stacked π-conjugated graphitic-like nanosheets, whilst a disordered core with sp2/sp3 variable ratio is the fingerprint of CNDs [62]. A core-shell description is also often applied, where the core ordered structure is surrounded by a disordered passivation external layer [29]. Raman spectroscopy can be exploited to characterize the nanoparticles through the intensity ratio ID/IG of the D and G bands, at about 1350 and 1560 cm−1, respectively [64,65]. The latter is related to sp2 crystalline domains, and the former pertains to the disordered framework; thus, the ID/IG ratio measures the amount of defects and disorder present in the CD structure. It was shown that undoped, oxidized CDs are more disordered than doped CDs [8], but also the last ones can give ID/IG ratio of about 1 [22,28,29]. The reason is that the structure is largely affected by the chemical composition of the CD, including termination groups at the particle surface and dopant element embedded within the CD Core. The elemental analysis, carried out by X-ray photoelectron spectroscopy (XPS) to monitor C and N bonding, evidences C–C, C–O and C–N species. Nitrogen doping causes the embedding of pyrrolic and pyridinic species, beside N–O bonds [36,66]. Fourier-transform infrared spectroscopy (FTIR) is also useful in determining the chemical composition, typically showing vibrational features of O–H, N–H, C–H (3500–2700 cm−1), C=N, C=O, C–O, and C–C (1700–1000 cm−1) [48], and it allows characterization of the intermediates during bottom-up synthesis [45,66].

4. Photoluminescence Mechanisms

The photoluminescence mechanism of CDs is still largely debated, with the research being focused on pursuing the origin of the excitation photoluminescence dependence. The chase is inherently difficult because of the wide diversity of preparation methods and precursors that affect both the structure and the composition of the CDs. The proposed explanation can be summarized in three main mechanisms: (1) the quantum confinement effect or the core emission, which is due to the conjugated π-domains of carbon core; (2) the surface states, which are related to the presence of functional groups connected with the carbon backbone; and (3) the molecular state, where the emission originates from free or bonded fluorescent molecules.

4.1. The Core Emission

Since the discovery of CDs, the excitation-dependent emission was related to the nanometer dimension of the particles, looking for a quantum confinement effect (QCE) on the optical features as for the quantum dots. There are few papers reporting sounding evidences for QCE, mainly related to the observation of crystalline carbon core (CQDs). Kang et al. [67] reported the red-shift of the emission from the UV to the near IR in top-down synthesized CDs by changing the CD dimension from 1.2 to 3.8 nm and correlated the phenomenon to the quantum-sized graphite structure of the nanoparticles. Recently, solvothermal approach allows the production of crystalline CDs with similar properties, calling for QCE, somehow conjugated to the surface oxidation [58,68]. Figure 5 reports the emission of multicolor (blue, green, yellow, orange, and red) bandgap fluorescent (BF) emitting CDs (CQDs), with average sizes of about 1.95 (B-), 2.41 (G-), 3.78 (Y-), 4.90 (O-), and 6.68 nm (R-BF-CQDs). The observed features recall those of graphene quantum dots [31,43,69], where a synergic effect between conjugated π-domains and surface/edge state is often encountered.
Aside the QCE, the role of the core state was largely discussed [4]. Indeed, carbon-core states participate in the PL of CDs through the radiative recombination of excitons in the core, resulting from the π–π* transition of sp2 clusters assisted by the quantum confinement effect [44,70]. The core emission is usually at shorter wavelengths and exhibits a low PL QY, but the presence of graphitic nitrogen allows red-shifting of absorption and emission properties [66], pointing out, once again, the role of the core structure [70]. As for the oxidation process, it was reported that it increases the sp3 shell region and reduces the sp2 core structures, which can be further disordered by N-doping, causing the formation of emissive core trap states [71].

4.2. The Surface States

Accounting for pH sensitivity, solvatochromic effect, oxidation effect, and surface passivation/functionalization, the surface states are the most popular solution for the peculiar emission of CDs. Mutating the description of semiconductor fields, as proposed by [4], we can distinguish intrinsic and extrinsic surface centers. Intrinsic surface states are due to the termination of the particle lattice facing the environment, whilst extrinsic centers are surface lattice defects also due to adsorbed or bonded chemical species. In general, the latter are responsible for the emission surface states, where the hybridization of the carbon backbone and the connected chemical groups contribute to determine the electronic levels [31]. Just to give few examples, the excitation-dependence of the emission was attributed to the oxidation of the surface by [28,30], with the emission red-shift being correlated to an increase of the surface oxidation (Figure 6). The distortion of the electronic environment by oxidation on sp2 carbons was indicated as the source of the emission electronic levels in model graphene oxide by means of quantum chemical calculations [72]. Sun and et al. [3] found that surface passivation by means of organic molecules provides stable surface energy traps that participate in the PL emission. The presence of different atoms at the surface, in particular different moieties of N, was shown to tune the emission properties of CDs [62,70,73], ascribing the blue emission to pyrrolic nitrogen, the green one to pyridinic nitrogen, and the red PL to the distortion of p-phenylenediamine [73]. Blue, green, and yellow emissions were related to surface states because of pH and solvent effects in CDs prepared via hydroquinone and EDA [31,74]. XPS findings suggested the emissions were correlated to imine groups located at the surface and producing defect-related energy levels.

4.3. The Molecular State

The presence of fluorescent molecular species, free or attached to the CD structure, is the base of the molecular state model [36,53,75]. In particular, in citric-acid-based bottom-up synthesis, two organic molecules (imidazo[1,2-a]pyridine-7-carboxylic acid (IPCA), 1,2,3,5-tetrahydro-5-oxo-7-indolizinecarbaldehyde, and 4-hydroxy-1H-pyrrolo[3,4-c]pyridine-1,3,6(2H,5H)-trione (HPPT)) were recognized as being responsible for the blue (IPCA) and green (HPPT) emissions. Figure 7 reports the calculated quantomechanical properties of IPCA (structure, energy level, and optical spectra, Figure 7a–c) [75]. However, molecules are characterized by excitation-independent emission (Kasha–Vavilov rule); thus, other mechanisms and/or the presence of a set of emitting molecules is required. Indeed, it was also shown that a proper cocktail of polycyclic aromatic hydrocarbons (PAHs) can easily explain the whole spectral properties of the CDs [61]. In this perspective, CDs can be considered molecular nanocrystals where PAHs are embedded within a sp3-hybridized carbon matrix. A set of stacked PAHs, such as anthracene, pyrene, and perylene, can account for the emission excitation dependence because of their different band gaps.
Recently, Righetto et al. [76] claimed the observation of free molecules by combining fluorescence correlation spectroscopy and time-resolved electron paramagnetic resonance. However, the reported fluctuations and rotations of carbon layers [63] may account for the estimated molecular hydrodynamic radius, in the case of molecules attached to or inserted within the layers. In addition, aggregates of fluorophores were also reported to play a role in the absorption and emission features [48,77,78]. According to these findings, CDs may be rationalized as hybrid particles, built from fluorophores, eventually aggregated, within or attached to a carbonized core. To further support this picture, it was shown that temperature and time of synthesis can modify the molecular state/core state equilibrium [47]. It is interesting to note that multiple parallel routes were proposed to explain the formation of CDs during hydrothermal synthesis of CA and EDA [75], including direct carbonization and polymers or molecules mediated carbonization, thus supporting the formation of a mix of different emission centers in the same CD or the formation of a heterogeneous mix of different CDs characterized by distinct emissions. From this point of view, we should also consider the related crosslink-enhanced PL mechanism pertaining to polymer dots (PDs), prepared by means of non-conjugated polymers by dehydration, condensation, carbonization, or assembly routes [79,80]. Indeed, PDs show an excitation-dependent emission feature, which was ascribed to the presence of amine-based fluorescent centers whose rotational and vibrational motions are hindered by the crosslinked polymeric skeleton [81]. Surface states can also be involved in the engineering of the emission from CDs when supported in host matrices, such as silica or ZnO, in view of solid-state applications [24,29,82].

5. Conclusions and Perspectives

In this work, we reviewed the optical properties of CDs, aiming to clarify the origin of their peculiar excitation-dependent emission. The subject is quite complex because of the enormous number of papers published in the last fifteen years on samples prepared by different techniques and starting from different materials. The three mechanisms reported in the literature cannot be claimed as general; on the contrary, they can be applied to a specific subset of CDs. According to the reviewed data, the core state model, including the quantum confinement effect, is appropriate to describe the emission from crystalline CDs (CQDs), where the dimensions of the core or the presence of graphitic nitrogen causes the red shift of the optical properties. The molecular state model is the reference model when considering samples obtained from specific organic carbon precursors, such as citric acid. The most applied model is the surface state model, where the emission originates from a plethora of defects that are mainly located in the shell of the CDs and successfully explains main data of disordered CDs (CNDs). However, those defects are mainly related to the time/temperature conditions of the synthesis and to the presence of heteroatoms added to improve the optical features. The defects and the dopant atoms could also be embedded within the core structure, thus affecting the core emission, and could be the seed for the formation of fluorescent species, embedded or attached to the CDs surface. In this scenario, we can imagine a distribution of slightly different samples where the optical properties are related to a synergic interaction of core and surface and/or molecular states, as also suggested for the graphene quantum dots. Tuning of the emission could be achieved by controlling the structure of the core or the chemical composition of the emitting surface centers. To achieve a better comprehension of the emission mechanism and fully exploit it in the numerous applications envisaged for these nanoparticles, a controlled synthesis is mandatory.

Author Contributions

Supervision, funding acquisition, and writing the original draft was done by C.M.C.; Visualization was performed by R.C., F.M. and P.C.R.; M.S. and C.O. accomplished data curation; revision and final editing was done by S.V.T.

Funding

This research was funded by MIUR—the Italian Ministry of Instruction, University and Research, grant number 2017W75RAE.

Conflicts of Interest

The authors declare no conflict of interest.

References

  1. Riggs, J.E.; Guo, Z.; Carroll, D.L.; Sun, Y.P. Strong luminescence of solubilized carbon nanotubes. J. Am. Chem. Soc. 2000, 122, 5879–5880. [Google Scholar] [CrossRef]
  2. Xu, X.; Ray, R.; Gu, Y.; Ploehn, H.J.; Gearheart, L.; Raker, K.; Scrivens, W.A. Electrophoretic Analysis and Purification of Fluorescent Single-Walled Carbon Nanotube Fragments. J. Am. Chem. Soc. 2004, 126, 12736–12737. [Google Scholar] [CrossRef] [PubMed]
  3. Sun, Y.P.; Zhou, B.; Lin, Y.; Wang, W.; Fernando, K.A.S.; Pathak, P.; Meziani, M.J.; Harruff, B.A.; Wang, X.; Wang, H.; et al. Quantum-sized carbon dots for bright and colorful photoluminescence. J. Am. Chem. Soc. 2006, 128, 7756–7757. [Google Scholar] [CrossRef] [PubMed]
  4. Mintz, K.J.; Zhou, Y.; Leblanc, R.M. Recent development of carbon quantum dots regarding their optical properties, photoluminescence mechanism, and core structure. Nanoscale 2019, 11, 4634–4652. [Google Scholar] [CrossRef]
  5. Zheng, C.; An, X.; Gong, J. Novel pH sensitive N-doped carbon dots with both long fluorescence lifetime and high quantum yield. RSC Adv. 2015, 5, 32319–32322. [Google Scholar] [CrossRef]
  6. Yu, S.; Chen, K.; Wang, F.; Zhu, Y.; Zhang, X. Polymer composite fluorescent hydrogel film based on nitrogen-doped carbon dots and their application in the detection of Hg2+ ions. Luminescence 2017, 32, 970–977. [Google Scholar] [CrossRef]
  7. Roy, P.; Chen, P.C.; Periasamy, A.P.; Chen, Y.-N.; Chang, H.T. Photoluminescent carbon nanodots: Synthesis, physicochemical properties and analytical applications. Mater. Today 2015, 18, 447–458. [Google Scholar] [CrossRef]
  8. Dong, Y.; Pang, H.; Yang, H.B.; Guo, C.; Shao, J.; Chi, Y.; Li, C.M.; Yu, T. Carbon-Based Dots Co-Doped with Nitrogen and Sulfur for High Quantum Yield and Excitation-Independent Emission. Angew. Chem. Int. Ed. 2013, 52, 7800–7804. [Google Scholar] [CrossRef]
  9. Mura, S.; Ludmerczki, R.; Carbonaro, C.M.; Ricci, P.C.; Casula, M.F.; Malfatti, L.; Innocenzi, P. Integrating sol-gel and carbon dots chemistry for the fabrication of fluorescent hybrid organic-inorganic films. Sci. Rep. 2019. accepted. [Google Scholar]
  10. Kozák, O.; Sudolská, M.; Pramanik, G.; Cígler, P.; Otyepka, M.; Zbořil, R. Photoluminescent Carbon Nanostructures. Chem. Mater. 2016, 28, 4085–4128. [Google Scholar] [CrossRef]
  11. Baker, S.N.; Baker, G.A. Luminescent Carbon Nanodots: Emergent Nanolights. Angew. Chem. Int. Ed. 2010, 49, 6726–6744. [Google Scholar] [CrossRef] [PubMed]
  12. Lim, S.Y.; Shen, W.; Gao, Z. Carbon quantum dots and their applications. Chem. Soc. Rev. 2015, 44, 362–381. [Google Scholar] [CrossRef] [PubMed]
  13. Hola, K.; Zhang, Y.; Wang, Y.; Giannelis, E.P.; Zboril, R.; Rogach, A.L. Carbon Dots - Emerging Light Emitters for Bioimaging, Cancer Therapy and Optoelectronics. Nano Today 2014, 9, 590–603. [Google Scholar] [CrossRef]
  14. Zhu, S.; Meng, Q.; Wang, L.; Zhang, J.; Song, Y.; Jin, H.; Zhang, K.; Sun, H.; Wang, H.; Yang, B. Highly Photoluminescent Carbon Dots for Multicolor Patterning, Sensors, and Bioimaging. Angew. Chem. Int. Ed. 2013, 52, 3953–3957. [Google Scholar] [CrossRef]
  15. Nie, H.; Li, M.; Li, Q.; Liang, S.; Tan, Y.; Sheng, L.; Shi, W.; Zhang, S.X.-A. Carbon Dots with Continuously Tunable Full-Color Emission and Their Application in Ratiometric pH Sensing. Chem. Mater. 2014, 26, 3104–3112. [Google Scholar] [CrossRef]
  16. Yang, P.; Zhao, J.; Wang, J.; Cui, H.; Li, L.; Zhu, Z. Pure carbon nanodots for excellent photocatalytic hydrogen generation. RSC Adv. 2015, 5, 21332–21335. [Google Scholar] [CrossRef]
  17. Bhattacharyya, S.; Ehrat, F.; Urban, P.; Teves, R.; Wyrwich, R.; Döblinger, M.; Feldmann, J.; Urban, A.S.; Stolarczyk, J.K. Effect of nitrogen atom positioning on the trade-off between emissive and photocatalytic properties of carbon dots. Nat. Commun. 2017, 8, 1401. [Google Scholar] [CrossRef]
  18. Sun, C.; Zhang, Y.; Sun, K.; Reckmeier, C.; Zhang, T.; Zhang, X.; Zhao, J.; Wu, C.; Yu, W.W.; Rogach, A.L. Combination of Carbon dot and Polymer Dot Phosphors for White Light-Emitting Diodes. Nanoscale 2015, 7, 12045–12050. [Google Scholar] [CrossRef]
  19. Panniello, A.; Di Mauro, A.E.; Fanizza, E.; Depalo, N.; Agostiano, A.; Curri, M.L.; Striccoli, M. Luminescent Oil-Soluble Carbon Dots toward White Light Emission: A Spectroscopic Study. J. Phys. Chem. C 2018, 122, 839–849. [Google Scholar] [CrossRef]
  20. Qu, S.; Liu, X.; Guo, X.; Chu, M.; Zhang, L.; Shen, D. Amplified Spontaneous Green Emission and Lasing Emission from Carbon Nanoparticles. Adv. Funct. Mater. 2014, 24, 2689–2695. [Google Scholar] [CrossRef]
  21. Yuan, F.; Xi, Z.; Shi, X.; Li, Y.; Li, X.; Wang, Z.; Fan, L.; Yang, S. Ultrastable and Low-Threshold Random Lasing from Narrow-Bandwidth-Emission Triangular Carbon Quantum Dots. Adv. Opt. Mater. 2019, 7, 1801202. [Google Scholar] [CrossRef]
  22. Qu, S.; Wang, X.; Lu, Q.; Liu, X.; Wang, L. A Biocompatible Fluorescent Ink Based on Water-Soluble Luminescent Carbon Nanodots. Angew. Chem. Int. Ed. 2012, 51, 12215–12218. [Google Scholar] [CrossRef] [PubMed]
  23. Zhou, Y.; Mintz, K.J.; Sharma, S.K.; Leblanc, R.M. Carbon Dots: Diverse Preparation, Application, and Perspective in Surface Chemistry. Langmuir 2019, 35, 9115–9132. [Google Scholar] [CrossRef] [PubMed]
  24. Suzuki, K.; Malfatti, L.; Takahashi, M.; Carboni, D.; Messina, F.; Tokudome, Y.; Takemoto, M.; Innocenzi, P. Design of Carbon Dots Photoluminescence through Organo-Functional Silane Grafting for Solid-State Emitting Devices. Sci. Rep. 2017, 7, 5469. [Google Scholar] [CrossRef] [PubMed]
  25. Wang, Q.; Huang, X.; Long, Y.; Wang, X.; Zhang, H.; Zhu, R.; Liang, L.; Teng, P.; Zheng, H. Hollow luminescent carbon dots for drug delivery. Carbon 2013, 59, 192–199. [Google Scholar] [CrossRef]
  26. Li, S.; Peng, Z.; Dallman, J.; Baker, J.; Othman, A.M.; Blackwelder, P.L.; Leblanc, R.M. Crossing the blood−brain−barrier with transferrin conjugated carbon dots: A zebrafish model study. Colloids Surf. B 2016, 145, 251–256. [Google Scholar] [CrossRef]
  27. Yuan, T.; Meng, T.; He, P.; Shi, Y.; Li, Y.; Li, X.; Fan, L.; Yang, S. Carbon quantum dots: An emerging material for optoelectronic applications. J. Mater. Chem. C 2019, 7, 6820–6835. [Google Scholar] [CrossRef]
  28. Ding, H.; Yu, S.B.; Wei, J.S.; Xiong, H.M. Full-Color Light-Emitting Carbon Dots with a Surface-State-Controlled Luminescence Mechanism. ACS Nano 2016, 10, 484–491. [Google Scholar] [CrossRef]
  29. Carbonaro, C.M.; Chiriu, D.; Stagi, L.; Casula, M.F.; Thakkar, S.V.; Malfatti, L.; Suzuki, K.; Ricci, P.C.; Corpino, R. Carbon Dots in Water and Mesoporous Matrix: Chasing the Origin of their Photoluminescence. J. Phys. Chem. C 2018, 122, 25638–25650. [Google Scholar] [CrossRef]
  30. Zhang, Y.; Hu, Y.; Lin, J.; Fan, Y.; Li, Y.; Lv, Y.; Liu, X. Excitation Wavelength Independence: Toward Low-Threshold Amplified Spontaneous Emission from Carbon Nanodots. ACS Appl. Mater. Interfaces 2016, 8, 25454–25460. [Google Scholar] [CrossRef]
  31. Zhu, S.; Song, Y.; Zhao, X.; Shao, J.; Zhang, J.; Yang, B. The Photoluminescence Mechanism in Carbon Dots (Graphene Quantum Dots, Carbon Nanodots, and Polymer Dots): Current State and Future Perspective. Nano Res. 2015, 8, 355–381. [Google Scholar] [CrossRef]
  32. Dong, Y.; Wang, R.; Li, H.; Shao, J.; Chi, Y.; Lin, X.; Chen, G. Blue luminescent graphene quantum dots and graphene oxide prepared by tuning the carbonization degree of citric acid. Carbon 2012, 50, 2810–2815. [Google Scholar] [CrossRef]
  33. Du, Y.; Guo, S. Chemically doped fluorescent carbon and graphene quantum dots for bioimaging, sensor, catalytic and photoelectronic applications. Nanoscale 2016, 8, 2532–2543. [Google Scholar] [CrossRef] [PubMed]
  34. Qu, D.; Zheng, M.; Zhang, L.; Zhao, H.; Xie, Z.; Jing, X.; Haddad, R.E.; Fan, H.; Sun, Z. Formation mechanism and optimization of highly luminescent N-doped graphene quantum dots. Sci. Rep. 2014, 4, 5294. [Google Scholar] [CrossRef] [PubMed]
  35. Reckmeier, C.J.; Schneider, J.; Susha, A.S.; Rogach, A.L. Luminescent colloidal carbon dots: Optical properties and effects of doping. Opt. Express 2016, 24, A312–A340. [Google Scholar] [CrossRef]
  36. Schneider, J.; Reckmeier, C.J.; Xiong, Y.; von Seckendorff, M.; Susha, A.S.; Kasak, P.; Rogach, A.-L. Molecular Fluorescence in Citric Acid-Based Carbon Dots. J. Phys. Chem. C 2017, 121, 2014–2022. [Google Scholar] [CrossRef]
  37. Wang, J.; Zhang, P.; Huang, C.; Liu, G.; Leung, K.C.; Wáng, Y.X. High performance photoluminescent carbon dots for in vitro and in vivo bioimaging: Effect of nitrogen doping ratios. Langmuir 2015, 31, 8063–8073. [Google Scholar] [CrossRef]
  38. Sarkar, S.; Sudolská, M.; Dubecký, M.; Reckmeier, C.J.; Rogach, A.L.; Zboril, R.; Otyepka, M. Graphitic Nitrogen Doping in Carbon Dots Causes Red-Shifted Absorption. Phys. Chem. C 2016, 120, 1303–1308. [Google Scholar] [CrossRef]
  39. Hu, S.L.; Liu, J.; Yang, J.L.; Wang, Y.Z.; Cao, S.R. Laser synthesis and size tailor of carbon quantum dots. J. Nanopart. Res. 2011, 13, 7247–7252. [Google Scholar] [CrossRef]
  40. Tian, L.; Ghosh, D.; Chen, W.; Pradhan, S.; Chang, X.; Chen, S. Nanosized carbon particles from natural gas soot. Chem. Mater. 2009, 21, 2803–2809. [Google Scholar] [CrossRef]
  41. Bao, L.; Zhang, Z.L.; Tian, Z.Q.; Zhang, L.; Liu, C.; Lin, Y.; Qi, B.; Pang, D.W. Electrochemical tuning of luminescent carbon nanodots: From preparation to luminescence mechanism. Adv. Mater. 2011, 23, 5801–5806. [Google Scholar] [CrossRef] [PubMed]
  42. Bourlinos, A.B.; Stassinopoulos, A.; Anglos, D.; Zboril, R.; Karakassides, M.; Giannelis, E.P. Surface functionalized carbogenic quantum dots. Small 2008, 4, 455–458. [Google Scholar] [CrossRef] [PubMed]
  43. Wang, L.; Zhu, S.J.; Wang, H.-Y.; Qu, S.N.; Zhang, Y.L.; Zhang, J.H.; Chen, Q.-D.; Xu, H.L.; Han, W.; Yang, B.; et al. Common origin of green luminescence in carbon nanodots and graphene quantum dots. ACS Nano 2014, 8, 2541–2547. [Google Scholar] [CrossRef] [PubMed]
  44. Krysmann, M.J.; Kelarakis, A.; Dallas, P.; Giannelis, E.P. Formation mechanism of carbogenic nanoparticles with dual photoluminescence emission. J. Am. Chem. Soc. 2012, 134, 747–750. [Google Scholar] [CrossRef]
  45. Ludmerczki, R.; Mura, S.; Carbonaro, C.M.; Mandity, I.M.; Carraro, M.; Senes, N.; Garroni, S.; Granozzi, G.; Calvillo, L.; Marras, S.; et al. Carbon dots from citric acid and its intermediates formed by thermal decomposition. Chem. Eur. J. 2019, 25, 11963–11974. [Google Scholar] [CrossRef]
  46. Wang, W.; Wang, B.; Embrechts, H.; Damm, C.; Cadranel, A.; Strauss, V.; Distaso, M.; Hinterberger, V.; Guldi, D.M.; Peukert, W. Shedding light on the effective fluorophore structure of high fluorescence quantum yield carbon nanodots. RSC Adv. 2017, 7, 24771–24780. [Google Scholar] [CrossRef] [Green Version]
  47. Ehrat, F.; Bhattacharyya, S.; Schneider, J.; Löf, A.; Wyrwich, R.; Rogach, A.L.; Stolarczyk, J.K.; Urban, A.S.; Feldmann, J. Tracking the Source of Carbon Dot Photoluminescence: Aromatic Domains versus Molecular Fluorophores. Nano Lett. 2017, 17, 7710–7716. [Google Scholar] [CrossRef]
  48. Sharma, A.; Gadly, T.; Neogy, S.; Ghosh, S.K.; Kumbhakar, M. Molecular Origin and Self-Assembly of Fluorescent Carbon Nanodots in Polar Solvents. J. Phys. Chem. Lett. 2017, 8, 1044–1052. [Google Scholar] [CrossRef]
  49. Sudolska, M.; Dubecky, M.; Sarkar, S.; Reckmeier, C.J.; Zboril, R.; Rogach, A.L.; Otyepka, M. Nature of absorption bands in oxygen-functionalized graphitic carbon dots. J. Phys. Chem. C 2015, 119, 13369–13373. [Google Scholar] [CrossRef]
  50. Strauss, V.; Margraf, J.T.; Dolle, C.; Butz, B.; Nacken, T.J.; Walter, J.; Bauer, W.; Peukert, W.; Spiecker, E.; Clark, T.; et al. Carbon nanodots: Toward a comprehensive understanding of their photoluminescence. J. Am. Chem. Soc. 2014, 136, 17308–17316. [Google Scholar] [CrossRef]
  51. Zong, J.; Zhu, Y.; Yang, X.; Shen, J.; Li, C. Synthesis of photoluminescent carbogenic dots using mesoporous silica spheres as nanoreactors. Chem. Commun. 2011, 47, 764–766. [Google Scholar] [CrossRef] [PubMed]
  52. Zhao, Q.L.; Zhang, Z.L.; Huang, B.H.; Peng, J.; Zhang, M.; Pang, D.W. Facile preparation of low cytotoxicity fluorescent carbon nanocrystals by electrooxidation of graphite. Chem. Commun. 2008, 41, 5116–5118. [Google Scholar] [CrossRef] [PubMed]
  53. Kasprzyk, W.; Swiergosz, T.; Bednarz, S.; Walas, K.; Bashmakova, N.V.; Bogdał, D. Luminescence phenomena of carbon dots derived from citric acid and urea - a molecular insight. Nanoscale 2018, 10, 13889–13894. [Google Scholar] [CrossRef] [PubMed]
  54. Wen, X.; Yu, P.; Toh, Y.-R.; Hao, X.; Tang, J. Intrinsic and Extrinsic Fluorescence in Carbon Nanodots: Ultrafast Time-Resolved Fluorescence and Carrier Dynamics. Adv. Opt. Mater. 2013, 1, 173–178. [Google Scholar] [CrossRef]
  55. Sudolská, M.; Otyepka, M. Exact roles of individual chemical forms of nitrogen in the photoluminescent properties of nitrogen-doped carbon dots. Appl. Mater. Today 2017, 7, 190–200. [Google Scholar]
  56. Sun, Y.P.; Wang, X.; Lu, F.; Cao, L.; Meziani, M.J.; Luo, P.G.; Gu, L.; Veca, L.M. Doped Carbon Nanoparticles as a New Platform for Highly Photoluminescent Dots. J. Phys. Chem. C 2008, 112, 18295–18298. [Google Scholar] [CrossRef] [Green Version]
  57. Yang, Z.; Xu, M.; Liu, Y.; He, F.; Gao, F.; Su, Y.; Wei, H.; Zhang, Y. Nitrogen-doped, carbon-rich, highly photoluminescent carbon dots from ammonium citrate. Nanoscale 2014, 6, 1890–1895. [Google Scholar] [CrossRef]
  58. Yuan, F.; Wang, Z.; Li, X.; Li, Y.; Tan, Z.; Fan, L.; Yang, S. Bright Multicolor Bandgap Fluorescent Carbon Quantum Dots for Electroluminescent Light-Emitting Diodes. Adv. Mater. 2016. [Google Scholar] [CrossRef]
  59. Green, D.C.; Holden, M.A.; Levenstein, M.A.; Zhang, S.; Johnson, B.R.G.; Gala de Pablo, J.; Ward, A.; Botchway, S.W.; Meldrum, F.C. Controlling the fluorescence and room-temperature phosphorescence behavior of carbon nanodots with inorganic crystalline nanocomposites. Nat. Commun. 2019, 10, 206. [Google Scholar] [CrossRef]
  60. Su, Q.; Lu, C.; Yang, X. Efficient room temperature phosphorescence carbon dots: Information encryption and dual-channel pH sensing. Carbon 2019, 152, 609–615. [Google Scholar] [CrossRef]
  61. Fu, M.; Ehrat, F.; Wang, Y.; Milowska, K.Z.; Reckmeier, C.; Rogach, A.L.; Stolarczyk, J.K.; Urban, A.S.; Feldmann, J. Carbon dots: A unique fluorescent cocktail of polycyclic aromatic hydrocarbons. Nano Lett. 2015, 15, 6030–6035. [Google Scholar] [CrossRef] [PubMed]
  62. Sciortino, A.; Cayuela, A.; Soriano, M.L.; Gelardi, F.M.; Cannas, M.; Valcárcel, M.; Messina, F. Different natures of surface electronic transitions of carbon nanoparticles. Phys. Chem. Chem. Phys. 2017, 19, 22670–22677. [Google Scholar] [CrossRef] [PubMed]
  63. Paloncýová, M.; Langer, M.; Otyepka, M. Structural Dynamics of Carbon Dots in Water and N,N-Dimethylformamide Probed by All-Atom Molecular Dynamics Simulations. J. Chem. Theory Comput. 2018, 14, 2076–2083. [Google Scholar] [CrossRef] [PubMed]
  64. Ferrari, A.C.; Robertson, J. Interpretation of Raman Spectra of Disordered and Amorphous Carbon. Phys. Rev. B Condens. Matter Mater. Phys. 2000, 61, 14095. [Google Scholar] [CrossRef]
  65. Matthews, M.J.; Pimenta, M.A.; Dresselhaus, G.; Dresselhaus, M.S.; Endo, M. Origin of Dispersive Effects of the Raman D Band in Carbon Materials. Phys. Rev. B Condens. Matter Mater. Phys. 1999, 59, R6585. [Google Scholar] [CrossRef]
  66. Holá, K.; Sudolská, M.; Kalytchuk, S.; Nachtigallová, D.; Rogach, A.L.; Otyepka, M.; Zbořil, R. Graphitic Nitrogen Triggers Red Fluorescence in Carbon Dots. ACS Nano 2017, 11, 12402–12410. [Google Scholar] [CrossRef]
  67. Li, H.T.; He, X.D.; Kang, Z.H.; Huang, H.; Liu, Y.; Liu, J.L.; Lian, S.Y.; Tsang, C.H.; Yang, X.B.; Lee, S.T. Water-soluble fluorescent carbon quantum dots and photocatalyst design. Angew. Chem. Int. Ed. 2010, 49, 4430–4434. [Google Scholar] [CrossRef]
  68. Tian, Z.; Zhang, X.; Li, D.; Zhou, D.; Jing, P.; Shen, D.; Qu, S.; Zboril, R.; Rogach, A.L. Full-Color Inorganic Carbon Dot Phosphors for White-Light-Emitting Diodes. Adv. Opt. Mater. 2017, 5, 1700416. [Google Scholar] [CrossRef]
  69. Zhu, S.; Song, Y.; Wang, J.; Wan, H.; Zhang, Y.; Ning, Y.; Yang, B. Photoluminescence mechanism in graphene quantum dots: Quantum confinement effect and surface/edge state. Nano Today 2017, 13, 10–14. [Google Scholar] [CrossRef]
  70. Sciortino, L.; Sciortino, A.; Popescu, R.; Schneider, R.; Gerthsen, D.; Agnello, S.; Cannas, M.; Messina, F. Tailoring the Emission Color of Carbon Dots through Nitrogen- Induced Changes of Their Crystalline Structure. J. Phys. Chem. C 2018, 122, 19897–19903. [Google Scholar] [CrossRef]
  71. Xu, Y.; Wu, M.; Liu, Y.; Feng, X.Z.; Yin, X.B.; He, X.W.; Zhang, Y.K. Nitrogen-doped carbon dots: A facile and general preparation method, photoluminescence investigation, and imaging applications. Chemistry 2013, 19, 2276–2283. [Google Scholar] [CrossRef] [PubMed]
  72. Chien, C.T.; Li, S.S.; Lai, W.J.; Yeh, Y.C.; Chen, H.A.; Chen, I.S.; Chen, L.C.; Chen, K.H.; Nemoto, T.; Isoda, S.; et al. Tunable photoluminescence from graphene oxide. Angew. Chem. Int. Ed. 2012, 51, 6662–6666. [Google Scholar] [CrossRef] [PubMed]
  73. Yuan, K.; Zhang, X.; Qin, R.; Ji, X.; Cheng, Y.; Li, L.; Yang, X.; Lu, Z.; Liu, H. Surface state modulation of red emitting carbon dots for white light-emitting diodes. J. Mater. Chem. C 2018, 6, 12631–12637. [Google Scholar] [CrossRef]
  74. Han, L.; Liu, S.G.; Dong, J.X.; Liang, J.Y.; Li, L.J.; Li, N.B.; Luo, H.Q. Facile synthesis of multicolor photoluminescent polymer carbon dots with surface-state energy gap-controlled emission. J. Mater. Chem. C 2017, 5, 10785–10793. [Google Scholar] [CrossRef]
  75. Song, Y.; Zhu, S.; Zhang, S.; Fu, Y.; Wang, L.; Zhao, X.; Yang, B. Investigation from chemical structure to photoluminescent mechanism: A type of carbon dots from the pyrolysis of citric acid and an amine. J. Mater. Chem. C 2015, 3, 5976. [Google Scholar] [CrossRef]
  76. Righetto, M.; Privitera, A.; Fortunati, I.; Mosconi, D.; Zerbetto, M.; Curri, M.L.; Corricelli, M.; Moretto, A.; Agnoli, S.; Franco, L.; et al. Spectroscopic Insights into Carbon Dot Systems. J. Phys. Chem. Lett. 2017, 8, 2236–2242. [Google Scholar] [CrossRef]
  77. Reckmeier, C.J.; Schneider, J.; Xiong, Y.; Häusler, J.; Kasák, P.; Schnick, W.; Rogach, A.L. Aggregated Molecular Fluorophores in the Ammonothermal Synthesis of Carbon Dots. Chem. Mater. 2017, 29, 10352–10361. [Google Scholar] [CrossRef] [Green Version]
  78. Sharma, A.; Gadly, T.; Neogy, S.; Ghosh, S.K.; Kumbhakar, M. Addition to “Molecular Origin and Self-Assembly of Fluorescent Carbon Nanodots in Polar Solvents”. J. Phys. Chem. Lett. 2017, 8, 5861–5864. [Google Scholar] [CrossRef]
  79. Qiao, Z.A.; Huo, Q.S.; Chi, M.F.; Veith, G.M.; Binder, A.J.; Dai, S. A “ship-in-a-bottle” approach to synthesis of polymer dots@silica or polymer dots@carbon core-shell nanospheres. Adv. Mater. 2012, 24, 6017–6021. [Google Scholar] [CrossRef]
  80. Zhu, S.J.; Zhang, J.H.; Wang, L.; Song, Y.B.; Zhang, G.Y.; Wang, H.Y.; Yang, B. A general route to make nonconjugated linear polymers luminescent. Chem. Commun. 2012, 48, 10889–10891. [Google Scholar] [CrossRef]
  81. Zhu, S.J.; Wang, L.; Zhou, N.; Zhao, X.H.; Song, Y.B.; Maharjan, S.; Zhang, J.H.; Lu, L.J.; Wang, H.Y.; Yang, B. The crosslink enhanced emission (CEE) in non-conjugated polymer dots: From the photoluminescence mechanism to the cellular uptake mechanism and internalization. Chem. Commun. 2014, 50, 13845–13848. [Google Scholar] [CrossRef] [PubMed]
  82. Suzuki, K.; Takahashi, M.; Malfatti, L.; Innocenzi, P. Carbon dots in ZnO macroporous films with controlled photoluminescence through defects engineering. RSC Adv. 2016, 6, 55393–55400. [Google Scholar] [CrossRef]
Figure 1. Top-down and bottom-up approaches; CQDs indicates crystalline carbon quantum dots, CNDs disordered carbon nanodots (vide infra). Adapted from [31] with permission of Springer, copyright 2015.
Carbon 05 00060 g001
Figure 2. Absorption spectra of bare (CDB) and nitrogen doped (CDN and CDNP) CDs (Reprinted from [29] with permission of American Chemical Society, copyright 2018); Inset: Absorption and excitation spectra with assignation scheme (Reprinted from [48] with permission of American Chemical Society, copyright 2017).
Carbon 05 00060 g002
Figure 3. Emission spectra of CDs excited at different excitation wavelength. Panel (b) reports a water solution of bare CDs (the same of panel (a)) under visible and 365 nm excitation light. Panels (c) and (d) refer to N-doped CDs. Blue square dots in panel (d) are the PL peak position vs. the excitation wavelength (right and top axis). Panels (a) and (b) reprinted from [51] with permission of Royal Society of Chemistry, copyright 2011; panels c and d reprinted from [29] with permission of American Chemical Society, copyright 2018.
Carbon 05 00060 g003
Figure 4. TEM and AFM images of CDs and structure of CDs by molecular dynamics calculations. Panels (a), (b), and (c) from [61] with permission of American Chemical Society, copyright 2015; panel (d) adapted from [47] with permission of American Chemical Society, copyright 2017; panel (e) from [63] with permission of American Chemical Society, copyright 2018.
Carbon 05 00060 g004
Figure 5. Emission properties of CDs and correlation with size. Panel (a) shows the emission of multicolor (blue, green, yellow, orange, and red) bandgap fluorescent (BF) emitting CDs (CQDs). Panel (b) reports the dependence of HOMO and LUMO energy level on particle size. Reproduced from [58] with permission of Wiley-VCH, copyright 2016.
Carbon 05 00060 g005
Figure 6. Photoluminescence (PL) of CDs as a function of surface oxidation. Reproduced from [28] with permission of American Chemical Society, copyright 2016.
Carbon 05 00060 g006
Figure 7. (ac) Calculated structure and optical properties of IPCA molecule (reproduced from [75] with permission of Royal Society of Chemistry, copyright 2015); (d) Contribution to PL and structure of CDs vs. synthesis time (reproduced from [47] with permission of American Chemical Society, copyright 2017).
Carbon 05 00060 g007

