Recycling Oxacillin Residues from Environmental Waste into Graphene Quantum Dots


1
Regional Institute for Applied Chemistry Research, IRICA, E-13004 Ciudad Real, Spain
2
Department of Analytical Chemistry and Food Technology, Faculty of Pharmacy, University of Castilla–La Mancha, 02071 Albacete, Spain
3
Departamento de Química Analítica, Instituto Universitario de Investigación en Química Fina y Nanoquímica IUIQFN, Edificio anexo Marie Curie, Campus de Rabanales, Universidad de Córdoba, E-14071 Córdoba, Spain
*
Author to whom correspondence should be addressed.
C 2019, 5(4), 68; https://0-doi-org.brum.beds.ac.uk/10.3390/c5040068
Submission received: 28 September 2019
/
Revised: 29 October 2019
/
Accepted: 30 October 2019
/
Published: 1 November 2019
(This article belongs to the Special Issue Optical and Electronic Properties of Carbon-Based Nanomaterials and Composites)
Abstract
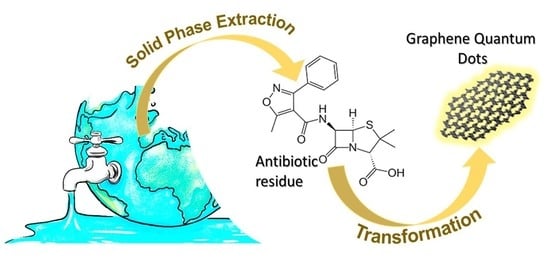
:Of great concern are the residual antibiotics from dirt that can be found in farm soil and wastewater. This kind of emerging pollutant into engineered nanomaterials is riveting. This work proposes the elimination and transformation of a beta-lactam antibiotic, oxacillin, from environmental waste to graphene quantum dots (GQDs). Two protocols were followed in which the use of ethylenediamine (EDA) in the transformation leads to GQDs with excellent optical properties. Therefore, two types of GQDs were synthesized in a Teflon-lined stainless autoclave by a thermal procedure using oxacillin in the absence and presence of EDA. The ensuing e-GQDs from oxacillin and EDA display a stronger fluorescence emission in comparison to those synthesized without EDA (o-GQDs). The combination of Kaiser test analyses, infrared (IR) and Raman measurements revealed the presence of oxygen-containing groups and primary amines at the edges of the graphitic nanolayer for e-GQDs. This straightforward strategy brings hope and opens a new interest in waste recycling by means of extracting residual contaminants from the environment for their further transformation into adequate non-toxic graphitic nanomaterials with potential applications.
1. Introduction
Non-biodegradable anthropogenic organic molecules are uncontrolled discharged at low concentrations in industrial streams, without preventing them from entering the environment and interacting with living organisms. Of great concern are many pharmaceutical compounds which are characterized for being noxious and resistant to microbial degradation. Such pollutants can be accumulated over long periods of time in soils and natural waters, causing resistance in diverse bacterial populations and posing a serious challenge and a threat to the ecosystem and global health.
Oxacillin is a second-generation penicillin-resistant beta-lactam antibiotic [1] employed for treating bacterial infections in human medicine and for preventing diseases in domestic animals. Its mechanism of action involves its binding to certain proteins in order to debilitate and alter the cell wall formation, causing inhibition of cell growth and promoting cell lysis [2]. However, a large consumption of this type of antibiotic and its unmodified excretion via urination/feces into the sewage system produced a mass-residual contamination which is responsible for newly more-resistant bacterial strains.
Residual amounts of oxacillin are recorded in agricultural and municipal wastewater [3,4], which usually affect rivers [5]. The removal of such types of semisynthetic acid-stable penicillin from contaminated soils and wastewaters is difficult to accomplish. The treatments of wastewater containing antibiotics can be classified into biotic (biodegradation) [6] and nonbiotic (oxidation) processes [7]. Giraldo et al. [6] evaluated various oxidation pathways with chloride ions to degrade oxacillin residues into biodegradable compounds. In this regard, new proposals are needed to develop recycling methodologies for this emerging pollutant, with an emphasis on those that provide substantial profits.
In recent decades, a special interest in exploring newly nano-sized carbon allotropes with outstanding properties is turning to graphitic quantized nanodots [8,9,10] because of their myriad of applications in many fields of research [11,12,13,14]. Graphene quantum dot (GQD) displays exceptional electronic properties accordingly to its laminar structure, size and quantum confinement effect. Many preparation methods of GQDs have been developed until now by both bottom-up and top-down methodologies [3] using a plethora of precursors (recently with attention in biomass substances [15,16,17,18,19] and synthetic conditions with conventional [20] and non-conventional reactors [21,22]). The need for a more rational synthetic procedure for such nanodots with specific optical properties [23] by means of tuning their bandgap from selecting the specific reaction conditions and precursors is therefore desirable to establish a series of relationships between the nanosheet structure and their photophysical features [24,25] according to the effects of internal structure, composition, size and surface. In this respect, some investigations suggested that the use of polar protic solvents promotes the appearance of certain functional groups at the GQD edges (namely, carboxyl moieties) capable of forming hydrogen bonds with certain molecules (tuning GQD selectivity), which concretely affected in their optical properties; on the contrary, polar aprotic solvents like dimethylformamide appear to be involved in the graphitic framework formation by increasing both nitrogen content and conjugation length of the graphene layer, which is reflected in a red-shifting emission [26]. Others reported that the nitrogen content in the laminar defects is substantial for boosting the catalytic, electrical-optical and photovoltaic performances as well as displaying red-shifting in the emission or even an efficient two-photon emission of the nanolayers, which is of special interest in applications like electrocatalysis, electrochemical/optical sensing, photovoltaic and imaging applications [27,28,29,30,31,32,33]. There exists an ongoing debate on the photoluminescence origin of this newly graphitic family; thus, further research is being undertaken on that point to design newly low-cost synthetic pathways of GQDs with specific physicochemical properties [25].
In order to stimulate companies operating according to the green chemistry, this communication proposes the reuse and transformation of an antibiotic residue, oxacillin, into a photoluminescence nanomaterial intended to be used as a sensing probe, giving more hopes to researchers to eliminate waste throughout a process that provides benefits.
2. Materials and Methods
2.1. Materials and Instrumentation
Kaiser test kit, oxacillin sodium salt monohydrate, ethylenediaminetetraacetic acid (EDTA, 99%), ethylenediamine (EDA, 99.5%), 9,10-bisphenylethynylanthracene, and sulfuric acid (99.999% purity) were purchased from Sigma Aldrich (Madrid, Spain). Ethanol (99%) and methanol (99.8%) were purchased from PanReac AppliChem (Darmstadt, Germany). All reagents were used without further purification. All glassware was rinsed with EDTA at 5% and then with ultrapure water (HPLC grade) prior to use. Oasis Hydrophilic-Lipophilic-Balanced (HLB) tubes were purchased from Waters (Milford, CT, USA). Also, 0.45-µm pore size nylon-filter membranes were supplied from Sartorius Stedim Biotech (Göttingen, Germany). Water samples were collected from Guadiana river.
Fluorescence emission and absorption spectra were recorded on a Photon Technology International QuantaMaster™ spectrofluorometer equipped with an 814-photomultiplier tube (PMT) detection system. The instrument contains a 75 W Xenon short arc lamp (for the fluorescence measurements) and a deuterium/halogen light source (for the absorption measurements) and is controlled by the Felix 32 software. All optical measurements were recorded at room temperature using micro quartz cuvettes of 10 mm light path. Both emission and excitation slit widths were set at 3 nm unless otherwise indicated. Lifetimes of the respective deoxygenated solutions were measured at room temperature in 1 cm closed quartz cuvettes with a time correlated single photon counting spectrometer (Edinburgh Analytical Instrument FLS920P-model, Scotland). F980 operating software was used for data collection.
Raman and IR spectra of the respective dry solid materials were recorded with an AFM/Confocal/Raman spectrometer (alpha500; WITec GmbH, Ulm, Germany) with a laser of 532 nm and a Bruker Tensor37 attenuated total reflection Fourier transform infrared (ATR-FT-IR) spectrophotometer equipped with a deuterated triglycine Sulfate detector. The IR spectra were collected in the wavelength range from 500 to 3650 cm−1 at a resolution of 4 cm−1 with 64 coadded scans each. Data collection was collected with OPUS software (Bruker, Ettligen, Germany).
Zeta potential of the as-prepared GQD dispersions in water were measured in triplicate using a Zetasizer Nano ZSP equipped with a 633-nm laser, and a 173-degree scattering angle.
Microscopic images of the ensuing GQDs were performed using a transmission electron microscope (TEM) model JEOL JEM 2010. Samples were prepared by dropping the diluted solutions of each GQDs on a TEM grid and letting them dry under vacuum at 30 °C for 4 h.
The content of amine groups was determined in triplicate using the Kaiser test kit. pH values of the aqueous solutions were measured using a Basic 20 pH-meter. Ultrapure water was collected from a Millipore system.
2.2. Methods
2.2.1. Extraction, Preconcentration and Back Extraction Procedures
A solid phase extraction (SPE) method for recovering residual oxacillin from enriched river waters was selected as previously reported elsewhere [5]. Oasis HLB cartridge was preconditioned with methanol, hydrochloric acid solution (HCl, 0.5 N) and ultrapure water. After that, water samples were filtered, treated with 1 mL of an EDTA solution (5%) and passed through the SPE cartridge to isolate the oxacillin residues over the water surface. SPE cartridge was then washed with ultrapure water and the antibiotic was back extracted using methanol. All methanolic extracts were slowly evaporated under a nitrogen stream to obtain the crystalline residue. Oxacillin was then stored in refrigerator for further use. All the experiment took place within a day under light protection to avoid degradation [34]. Liquid chromatography (LC) was used to assure the presence or the absence of the antibiotic in methanolic extracts and river water samples.
2.2.2. Preparation and Optimization of the Graphene Quantum Dots
GQDs were synthesized from oxacillin as a single-source precursor (denoted as o-GQDs) as follows: 100.5 mg of oxacillin residue were sonicated with sulfuric acid for 5 min and then heated in a Lange thermoreactor (LT200), at 200 °C for 8 h. The synthetic treatment of the acidic mixture resulted in the formation of reddish-to-black aggregates in which the heat process allows to moisture and volatile compounds (ammonia) removal. After one hour, the visual appearance of a blackish wet gel-like cluster in contrast to the white crystalline precursor appears. After cooling the resulting black solid down to room temperature, it was subsequently treated with NaOH (0.1 M) and methanol to redisperse the o-GQDs, using between each step successive centrifugations (3000 r.p.m., 5 min) for separating insoluble impurities. The final brown colored aqueous solution was adjusted to neutral pH and stored in darkness for their posterior use.
A similar procedure was performed to synthesize other graphitic nanodots (designated as e-GQDs), but in this case oxacillin and ethylenediamine were used as carbon and nitrogen sources. The procedure is summarized as follows: 50 mg of oxacillin were heated in the presence of EDA (50 µL) and sulfuric acid in a thermoreactor at 200 °C. The final visual appearance is a gel-brownish dry solid. The ensuing nitrogen doped e-GQDs were then redispersed in acidic-water media and methanol, centrifuged and the resulting yellowish solution was stored in darkness at room temperature.
2.2.3. Kaiser Test Protocol
The amount of amine groups attached onto GQD surfaces were measured by the Kaiser Test, which procedure is shown below in summary: Approximately 1 mg of each type of modified GQD (in triplicate) was weighed accurately and mixed in a test tube with 75, 100 and 75 µL of solutions I, II and III of the Kaiser Test kit, respectively. The test tubes containing the nanosheets and other three tubes considered as the blank were then sonicated and incubated at 100 °C for ca. 7 min. Then, all test tubes were removed from heat and diluted with 2.8 mL of an ethanol solution (60% v/v). The absorbance of each sample (resulting in solutions of pale yellowish or purple colors) at 570 nm was recorded and compared to the blank (without GQDs). The following equation gives the amine loading, expressed as micromoles of amino groups per gram of GQDs:
3. Results and Discussion
3.1. Extraction of the Antibiotic from Wastewater
Analytical protocols for a fast and efficient decontamination of water resources containing residual antibiotics in agricultural and urban environments were already reported [5,6,7]. We pursued the extraction of oxacillin from water samples following a SPE procedure. Since oxacillin is considered a potential emerging contaminant [35] and LC analyses of river water did not detect its presence, contaminated wastewater was prepared by spiking a river water sample with the antibiotic. The sample was refrigerated at 4 °C to avoid degradation of the antibiotic.
In preliminary studies, retention of oxacillin with diverse filter membranes was evaluated, likewise observing than nylon either cellulosic membranes did not retain the antibiotic. Thus, a first-step filtration of the collected water in nylon membranes was performed prior the enrichment.
Extraction was then accomplished by flushing the refrigerated water sample (at pH 7.5) through the Oasis HLB tube. EDTA was used to avoid interfering metal ions. The content of oxacillin in water samples before and after the extraction and preconcentration process was assessed by monitoring its absorbance (210 nm). LC analyses of the filtered water after passing through the SPE cartridge suggested a total retention of the antibiotic. Before back extraction of the antibiotic, the cartridge was washed thoroughly to remove any interfering molecules trapped in the sorbent material. It was first necessary to test whether the antibiotic remained in the sorbent material or was degraded after washing with ultrapure water at different pH values. It was suitable to perform the washing steps with ultrapure water at pH 6 since the antibiotic remained in the sorbent material, as fluorescence within the cartridge under ultraviolet irradiation at 365 nm was observed.
Methanol, diethyl ether and acetonitrile were tested for back-extraction of the retained oxacillin from the SPE cartridge. It was observed that only methanol redissolved most the antibiotic from the sorbent material. The solvent of the back-extracted antibiotic was gently removed, and a portion of the resulting residue was then reconstituted in ultrapure water for the LC analysis. Isolated oxacillin was successfully recovered, and its optical characterization demonstrated that oxacillin did not undergo degradation along the extraction/preconcentration and back extraction protocols. Recovery of oxacillin resulted to be 87%, being similar to those previously reported [5].
3.2. Synthesis and Characterization of Two Types of Graphene Quantum Dots, o-GQDs and e-GQDs
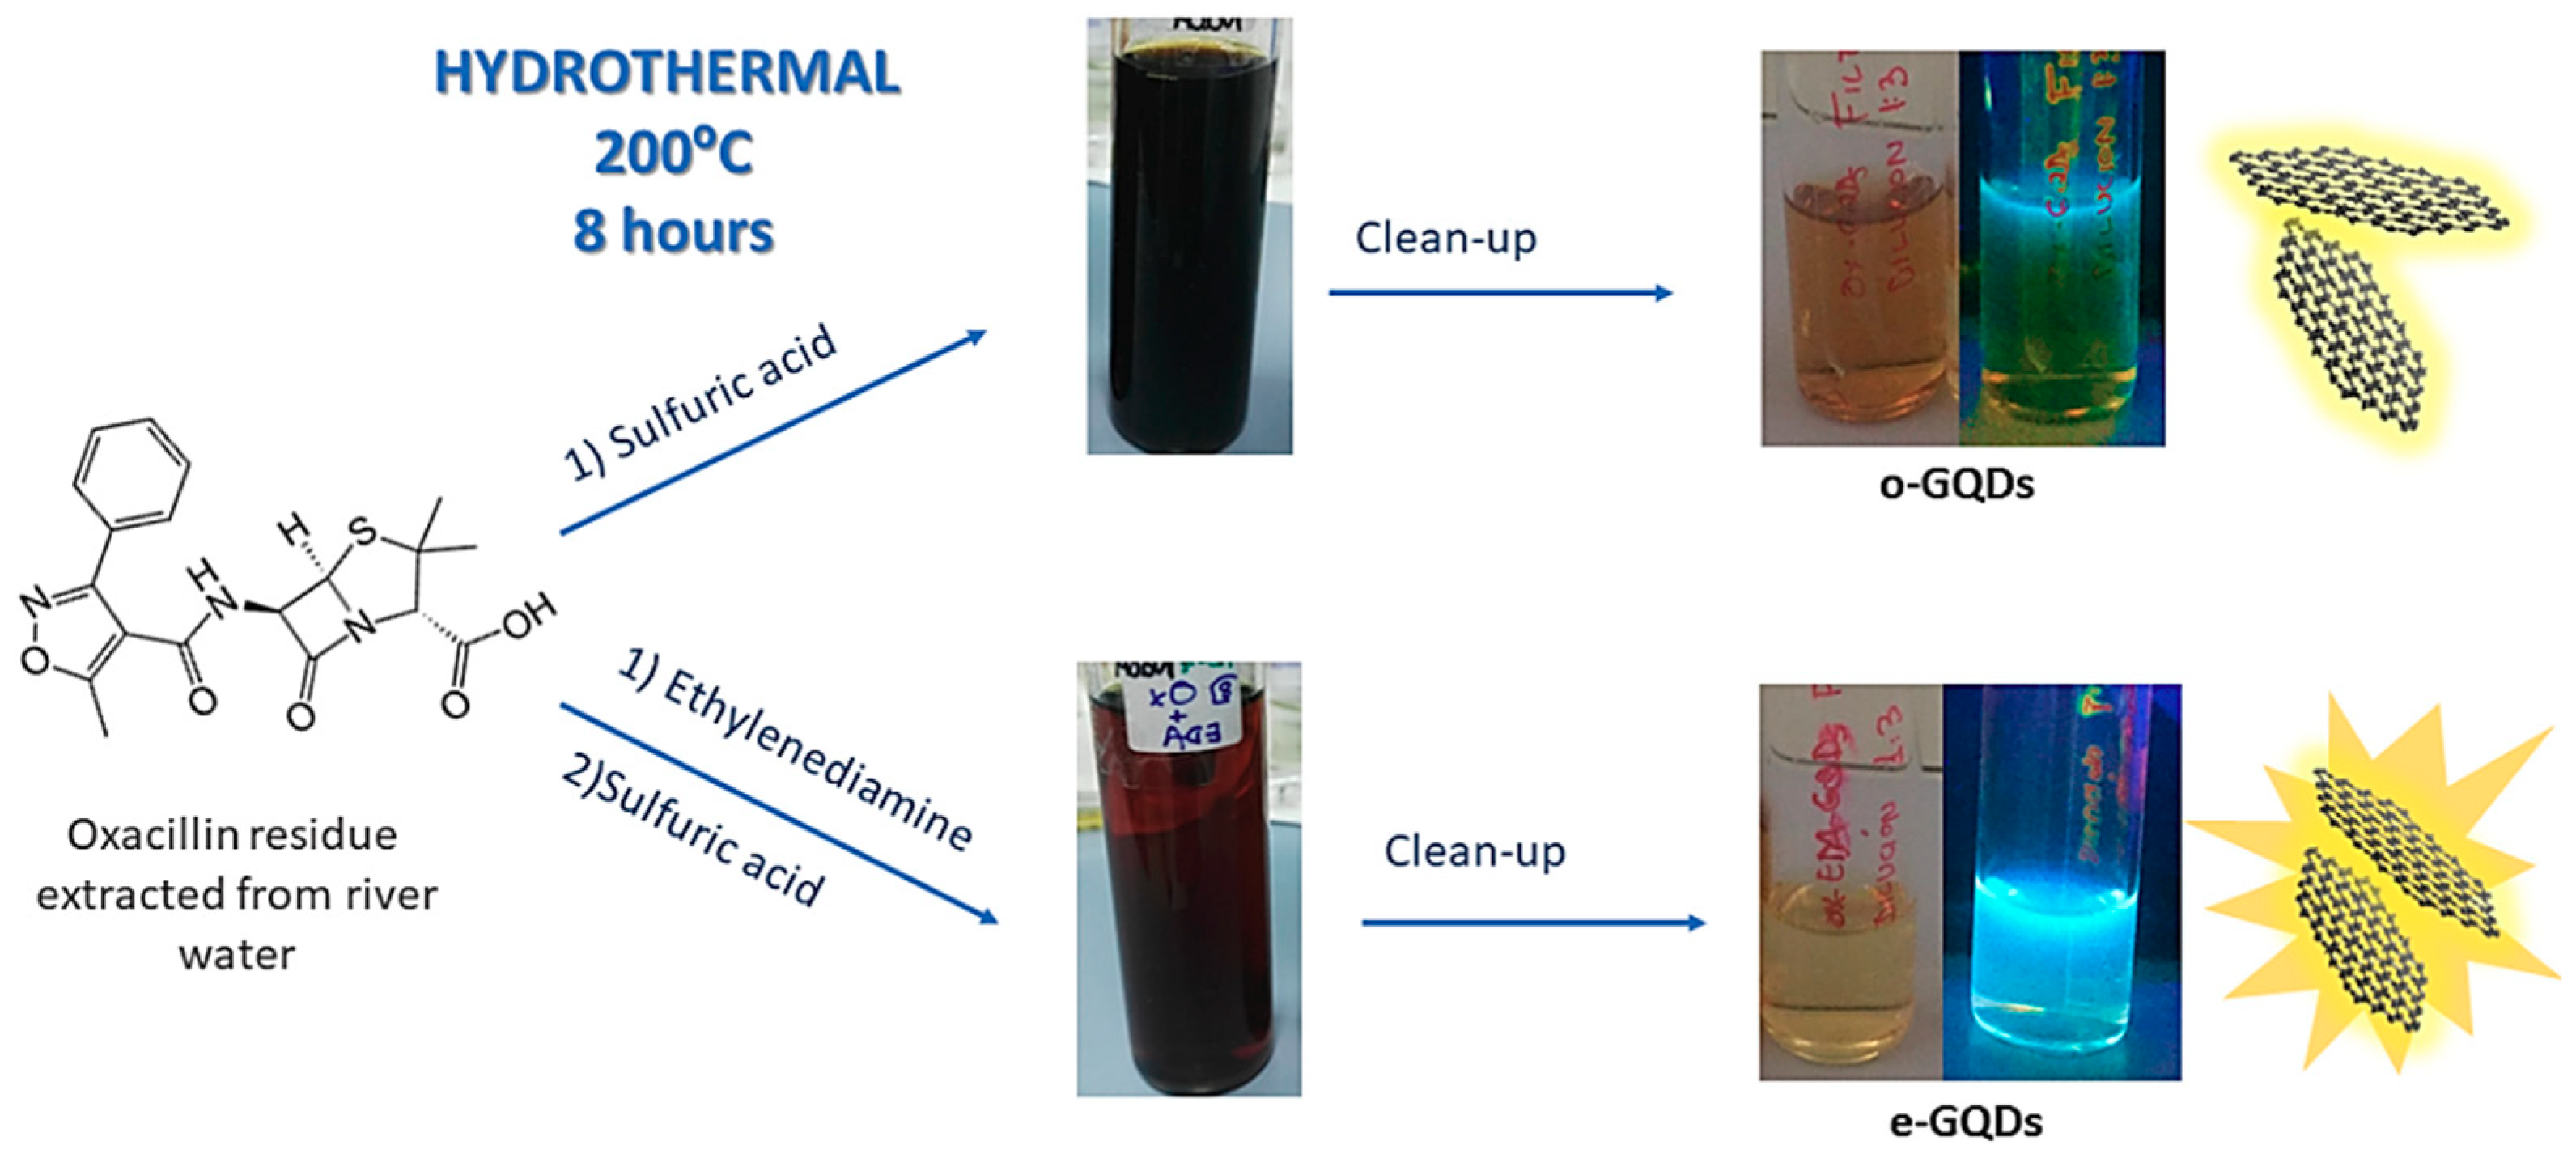
In this study, we went one step further by transforming the recovered oxacillin residue into a fluorescent material. Figure 1 illustrates the synthetic procedures of two types of graphitic structures derived from oxacillin residues. Briefly, o-GQDs were formed by oxidation in thermal and acidic conditions of oxacillin under air atmosphere, while conversion from oxacillin to e-GQDs took place in presence of EDA under identical conditions. The as-prepared GQD aqueous dispersions are highly stable, since no sign of precipitation or diminution of the respective emission intensities were found after 14 months. The aromatic core (non-polar) and highly oxygenated edges (polar) of such GQD structures denotes an amphiphilic nature.
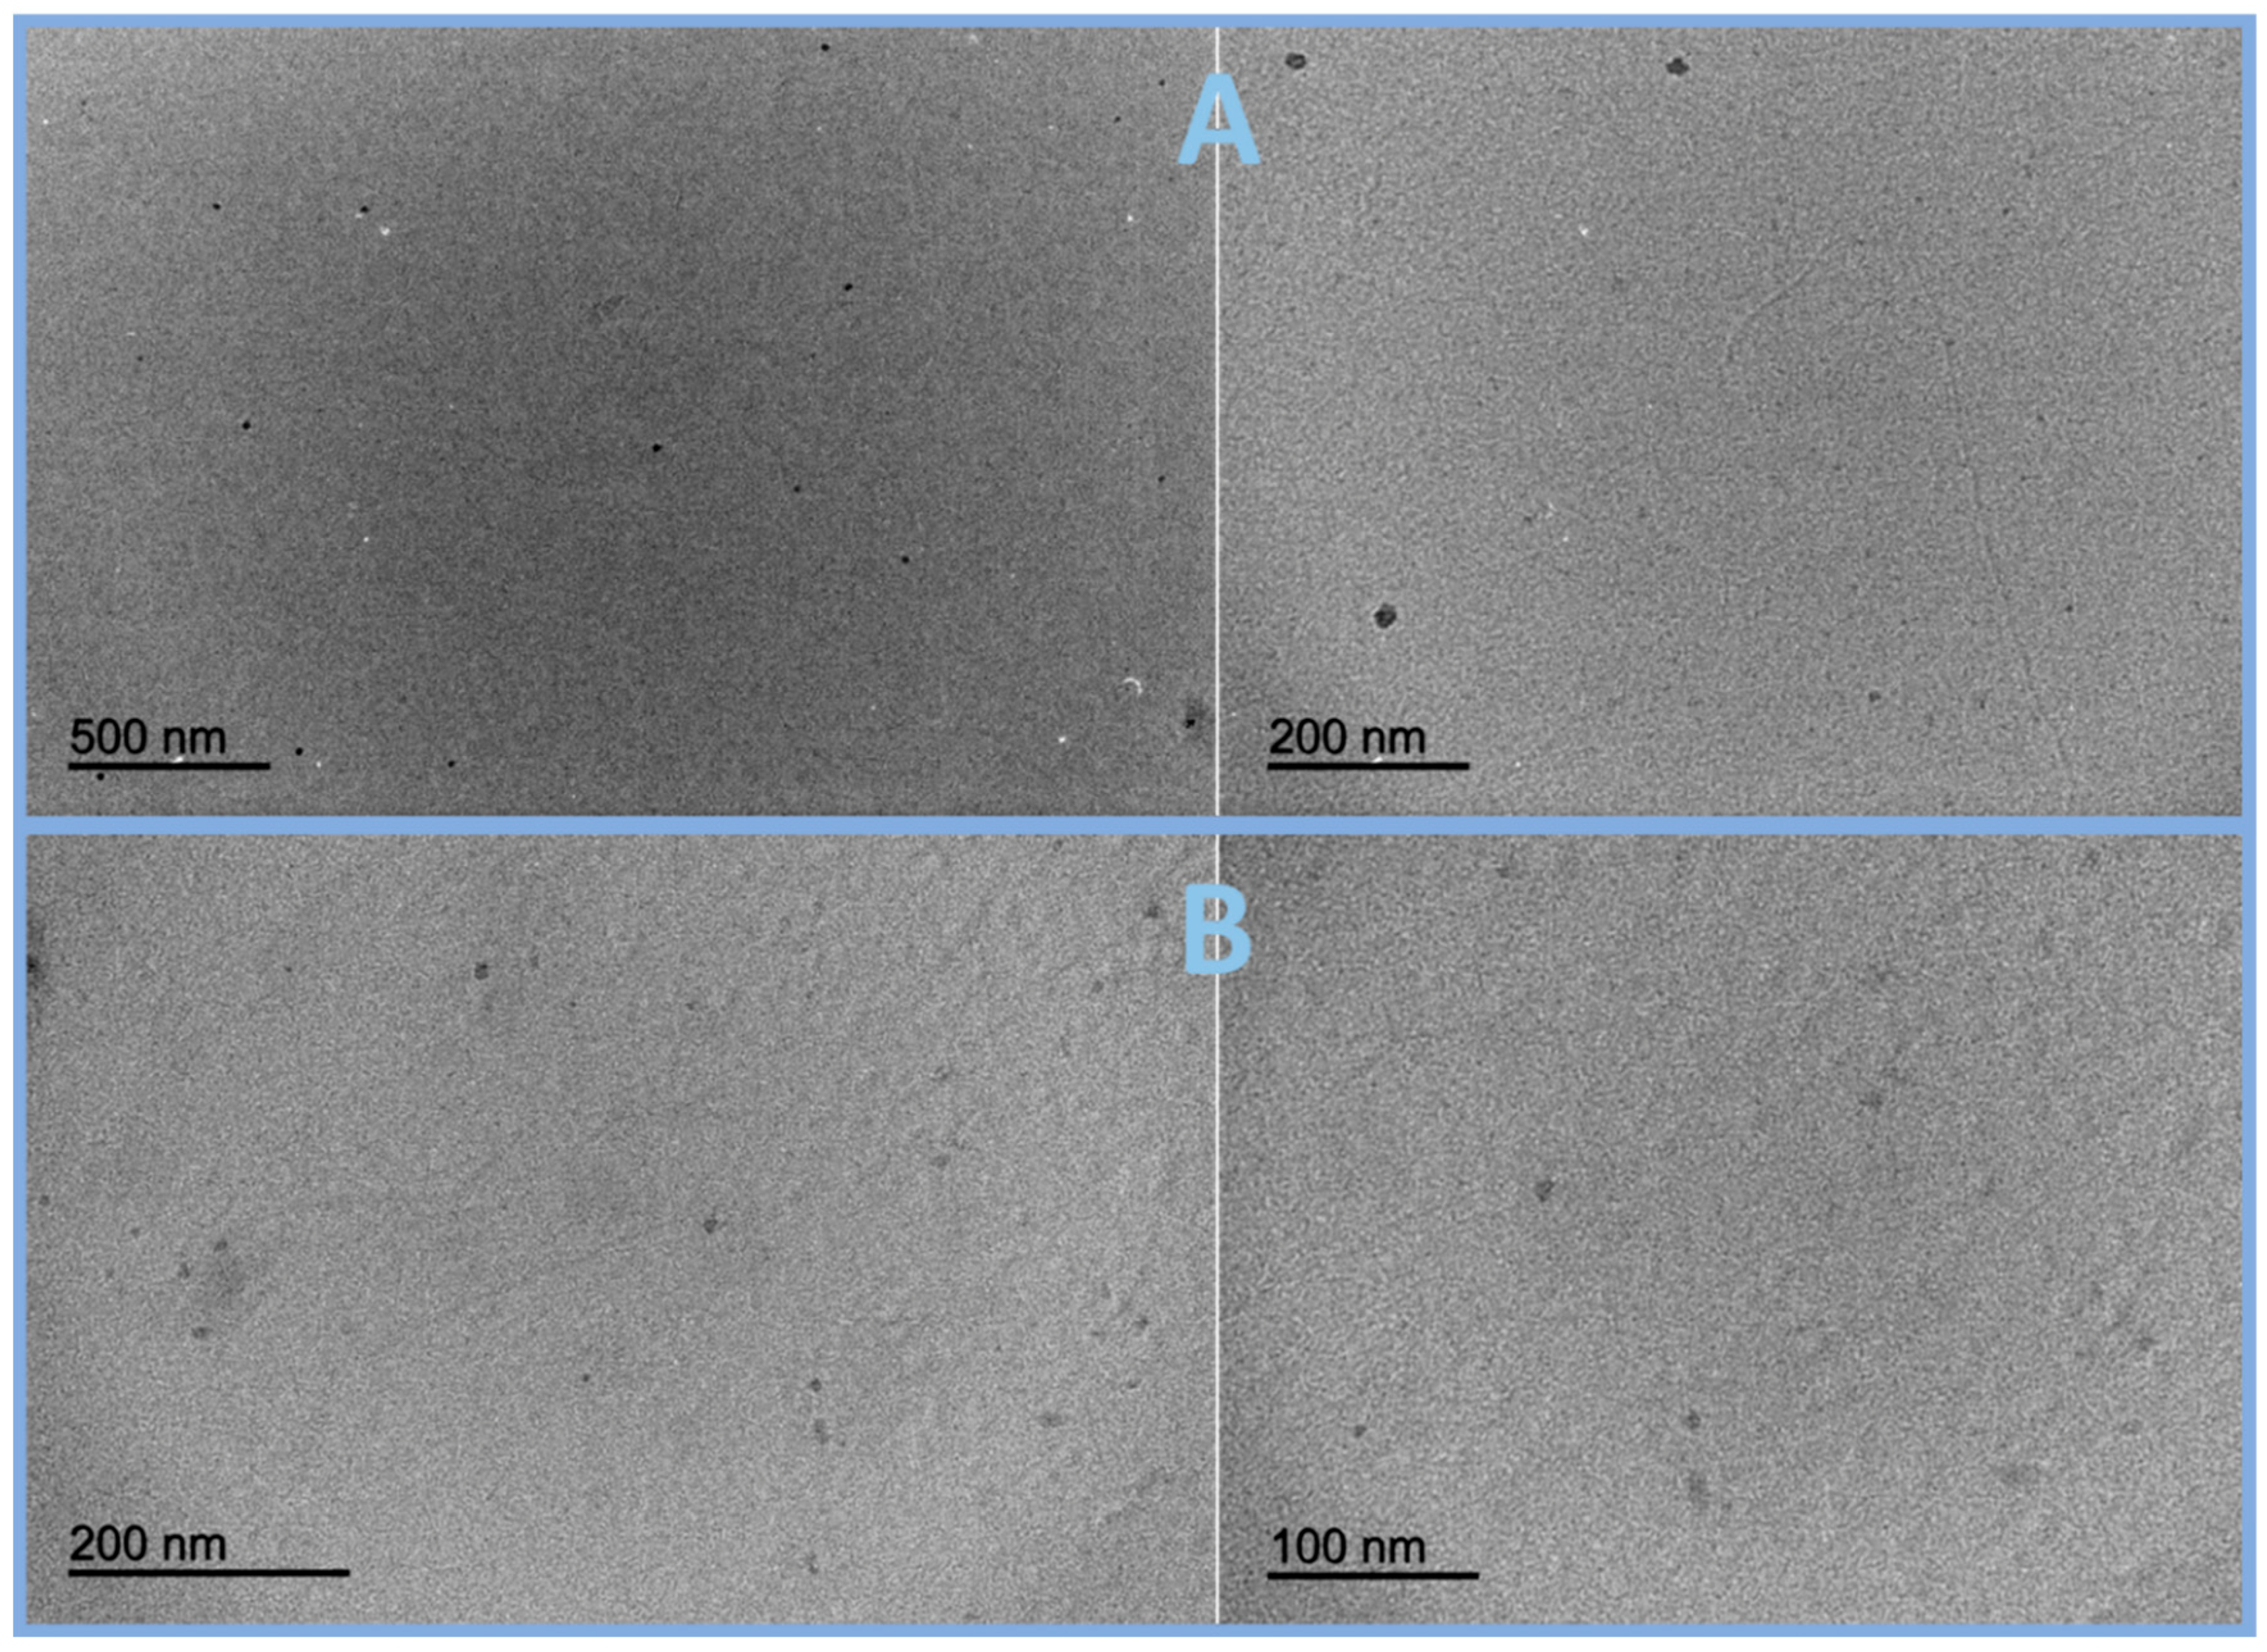
The former nanomaterials displayed a flakelike morphology with averaged diameters of 14 and 10 nm for o-GQDs and e-GQDs, respectively (Figure 2).
Regarding the surface functionalities of each nanographene, Kaiser test and IR experiments were performed. We estimated by Kaiser test the content of primary amine groups possibly attached to the graphitic edges and layer defects. The presence of amine groups was confirmed for e-GQDs exclusively (Table 1). IR spectra gave us information about the important IR-active functional groups of each nanographene. In contrast to oxacillin precursor, e-GQDs display broad bands around 3318 and 3190 cm−1 ascribed to vibrational modes of O–H, N–H and small peaks at 2946 cm−1 due to C–H stretching vibrational modes from any aliphatic fragment attached to the graphitic layers. Peaks at 1663 and 1576 cm−1 can be assigned to carbonyl groups (namely, amide) while other peaks appeared bellow 1560 cm−1 showing the fingerprint of the carbonic structure. IR profile for o-GQDs resembles the e-GQDs, as depicted in Figure S1.
Valuable information about the graphitized section and their defects was achieved by Raman spectroscopy. Raman spectrum of e-GQDs displays the two prominent broad D and G bands characteristic to the disordered sp2-hybridized carbon and the stretching vibration for sp2 carbon domains, respectively (Figure S2). It is important to mention that these features are similar for e-GQDs directly prepared from commercially-available oxacillin and for o-GQDs. In fact, there is an increase in the background for o-GQDs due to its inherent fluorescence. From the intensities of the bands related to the disordered amorphous and ordered graphitic carbon, e-GQD shows a slightly higher disordered degree than o-GQDs.
o-GQD solution owns a high negative zeta potential of −24.3 mV as result of the high content of carboxylic functionalities. e-GQDs exhibit less negative zeta potential, being −19.2 mV the cumulative surface charge, as a consequence of less carboxyl groups being present on the surface (i.e., part of carboxylic groups may form amide bonds by one part of EDA).
Diluted aqueous solutions of e-GQD and o-GQD were pale-orange brownish and pale reddish under visible light, respectively, whilst at naked eye blue fluorescence were observable under ultraviolet light irradiating at 365 nm (Figure S3).
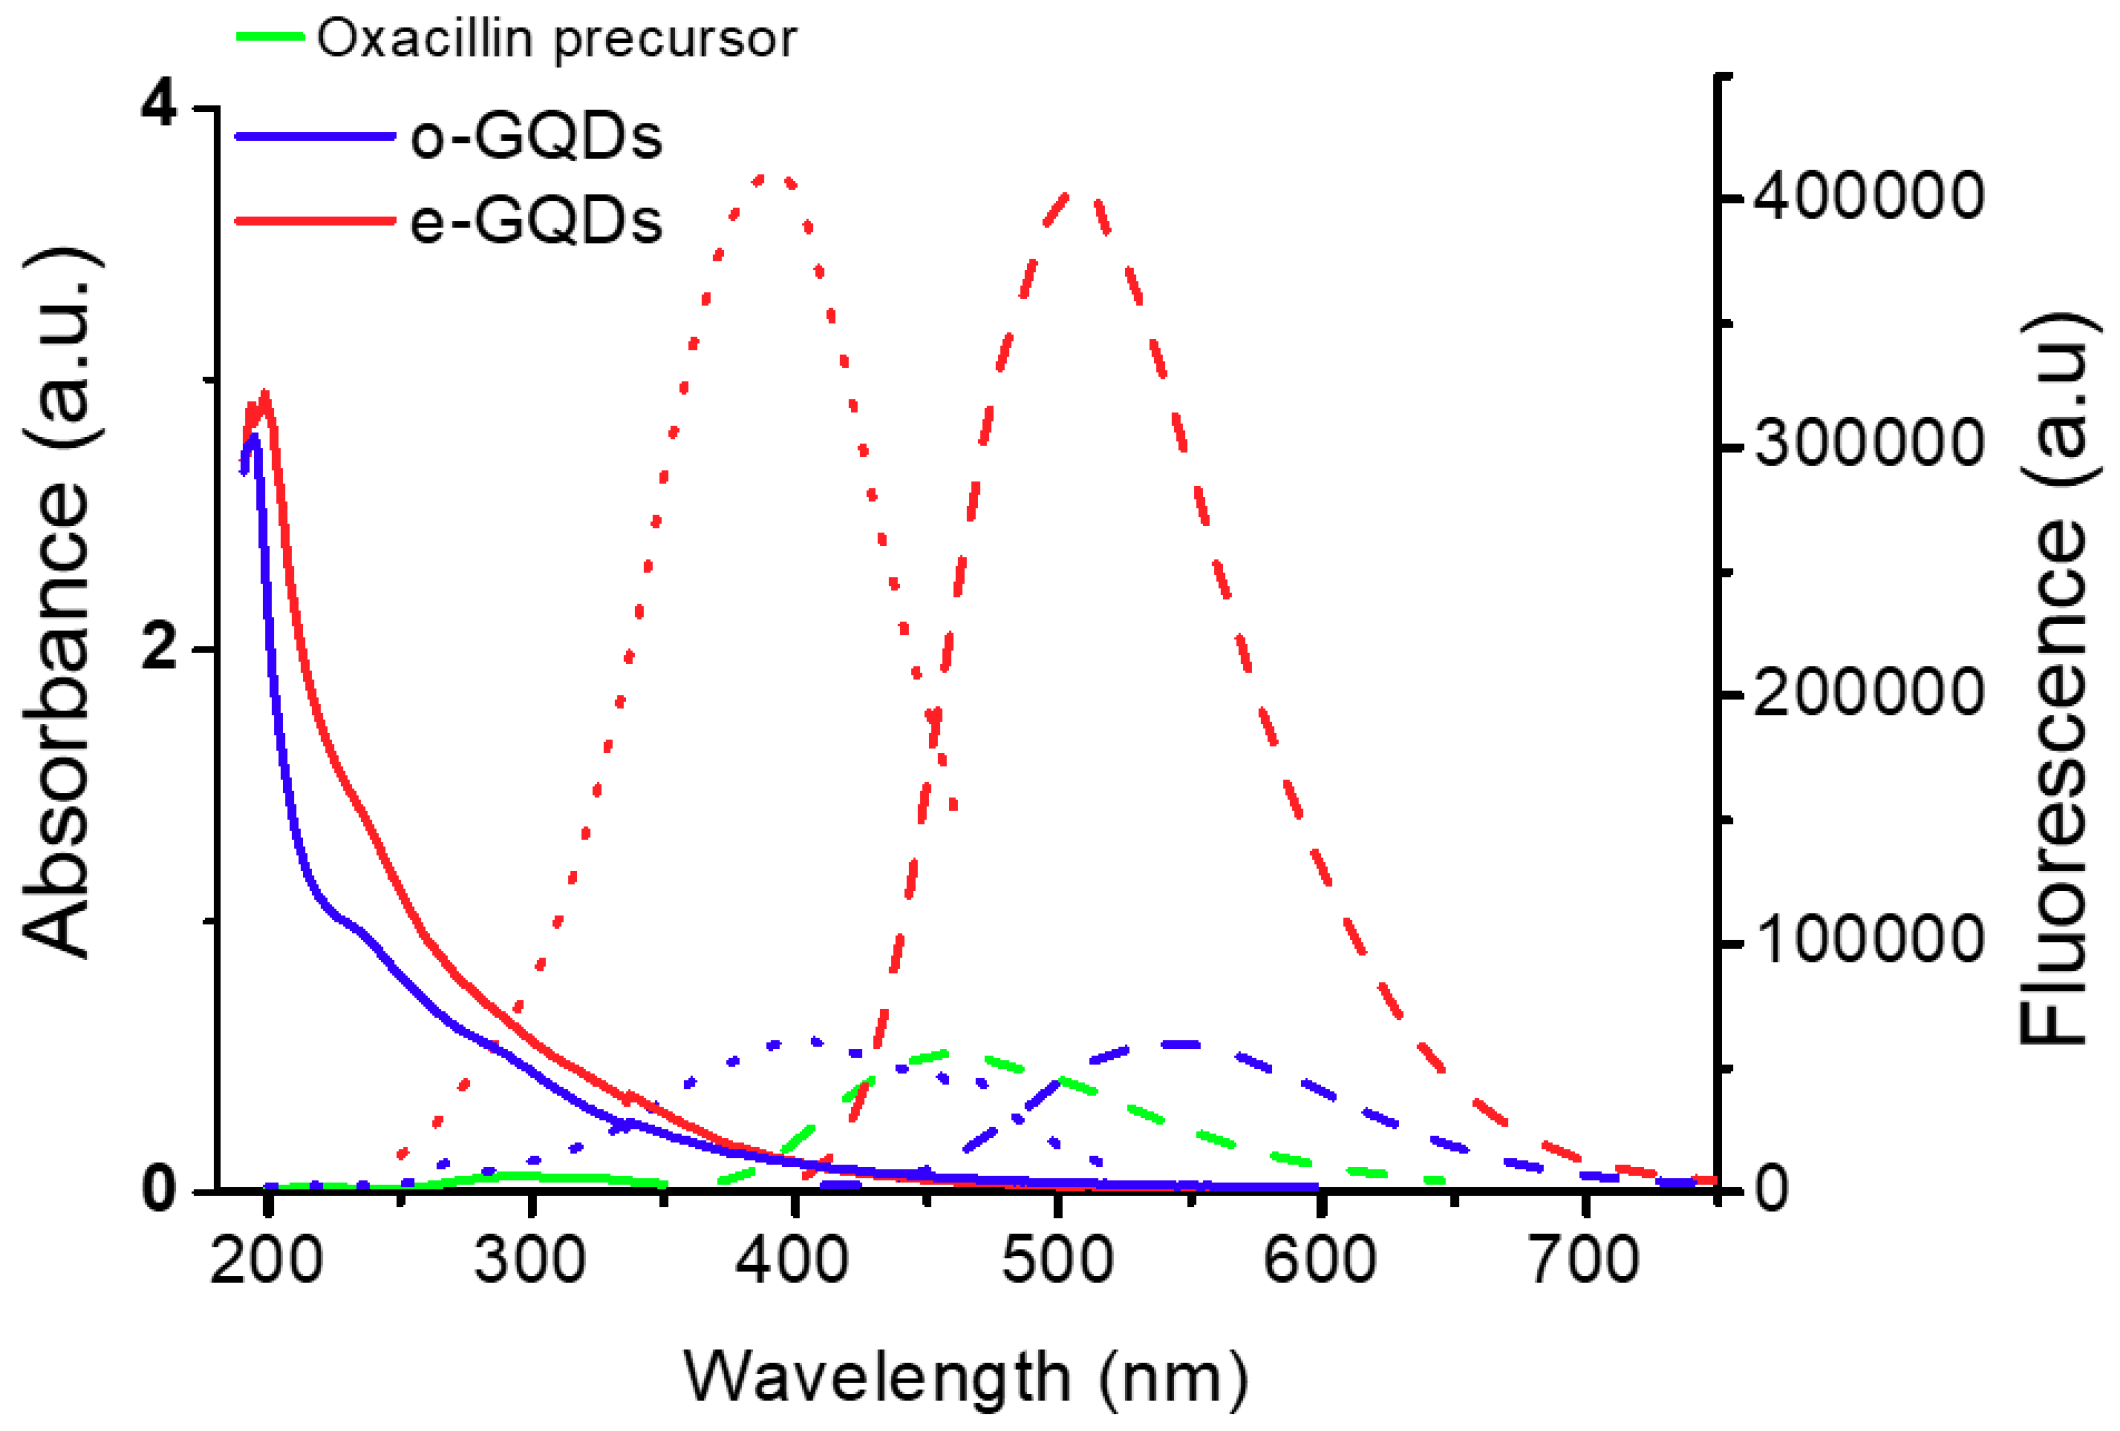
Absorption features of both GQDs are rather similar (Figure 3) consisting of a continuous UV absorption band associated with the sp2-carbon cores that became distended to the visible region derived from both surface defects and core defects linked to the double bonds of carbon and heteroatoms (nitrogen and oxygen). Both unstructured graphitic frameworks are characteristic of other carbon and graphene quantum nanodots previously reported [8,21].
As for most of carbonaceous nanodots [8], the fluorescence mechanism of GQDs is not completely understood. Fluorescence is mostly due to the zig-zag sites and surface energy traps within the graphitic layer. It is important to determine if the emission properties of both nanodots are tunable. Figure S3C,D reflects that the emission depends on the excitation wavelength for both graphitic structures in aqueous solution, as a result of the combination of at least two fluorescence contributions regarding the intrinsic quantum effects of core and surface defects [8]. Interestingly, the emission bands of e-GQDs displayed smaller shifting upon variable excitation wavelengths compared to o-GQDs, being the maxima intensities occurring at 506 nm and 543 nm for diluted e-GQD and o-GQD aqueous solutions, respectively. Full width at half maximum resulted in being narrower for e-GQDs (89 nm) compared to o-GQDs (113 nm) and most of the reports [8,36]. Broad emission bands imply a superposition of several emissions from diverse emitters (wider size distribution and higher superficial defects from the oxidation process) as occurred for o-GQDs. It is important to mention that the optical features of GQDs synthesized from the extracted oxacillin are the same as those nanodots obtained from the commercially-available antibiotic.
With an increase in π-conjugation of the graphitic nanosheet, the fluorescent emission of o-GQDs red-shifts. The existence of an electronic transition (involving a coupling between the surface and graphitic core) provokes an ultrafast charge separation of an electron from the core to the surface and their radiatively recombination with a free hole at the core. With these results, we expected that more surface defects are found in o-GQDs since higher surface oxidation implied a red-shifting emission. In addition, the higher excitation dependence of the o-GQD corroborates the higher size distribution found in this synthesis in the absence of EDA. These results are in agreement with TEM analyses, in which e-GQD displays a lower size distribution.
An essential factor regarding the fluorescence efficiency of the synthesized GQD is the quantum yield. Diluted samples of the nanodots gave rise to a quantum yield of 24% for the successfully produced nitrogen-doped e-GQDs and 4% for o-GQDs using 9,10-bisphenylethynylanthracene as reference. A successive inquiry on the doorstep is the decay kinetics of the fluorescence, which was studied by time-resolved experiments. As depicted in Table 2 and Table 3, both GQDs display an early decay kinetics in which the experimental data are fitted to triexponential behaviors. The nanosecond decay kinetics are dependent on the excitation wavelengths for both cases. The observation of lifetime values of a few nanoseconds suggested that the fluorescent transitions are dipole-allowed [8,21].
A possible fluorescence mechanism widely applied by most researchers is associated to an excitation-dependent emission behavior owing to multichromophoric moieties within these nanosystems, explaining that the emission is due to the presence of many different surface states while the absorption is due mainly to the core state. In our case, it is expected that diverse chromophore scaffolds are responsible for the excitation-dependent emission which is related to exciton self-trapping in aromatic network either surface chemical moieties. A second approach that typically governs the fluorescence of semiconductor quantum dots and many GQDs is due to the quantum confinement and considers that the dimensional distribution of nanodots are affecting the emission spectra, having typically excitation-independent emission behavior which emission is characteristic for each quantum dot size. In addition, the effect of the bidentate amine, EDA, in the synthesis also influences the final emission by providing new fluorophores on the GQD surface in the excited state which can act as templates for a narrow size distribution formation, as for instance amines acting as electron donors which can stabilize carbon frameworks in hydrogen bond acceptor solvents.
3.3. Interaction and Simple Detection of Fluoroquinolone Based on GQDs as Fluorescent Probes
We envisioned that GQDs could be used as sensing probes to detect fluorine-containing antibiotics in environmental waters.
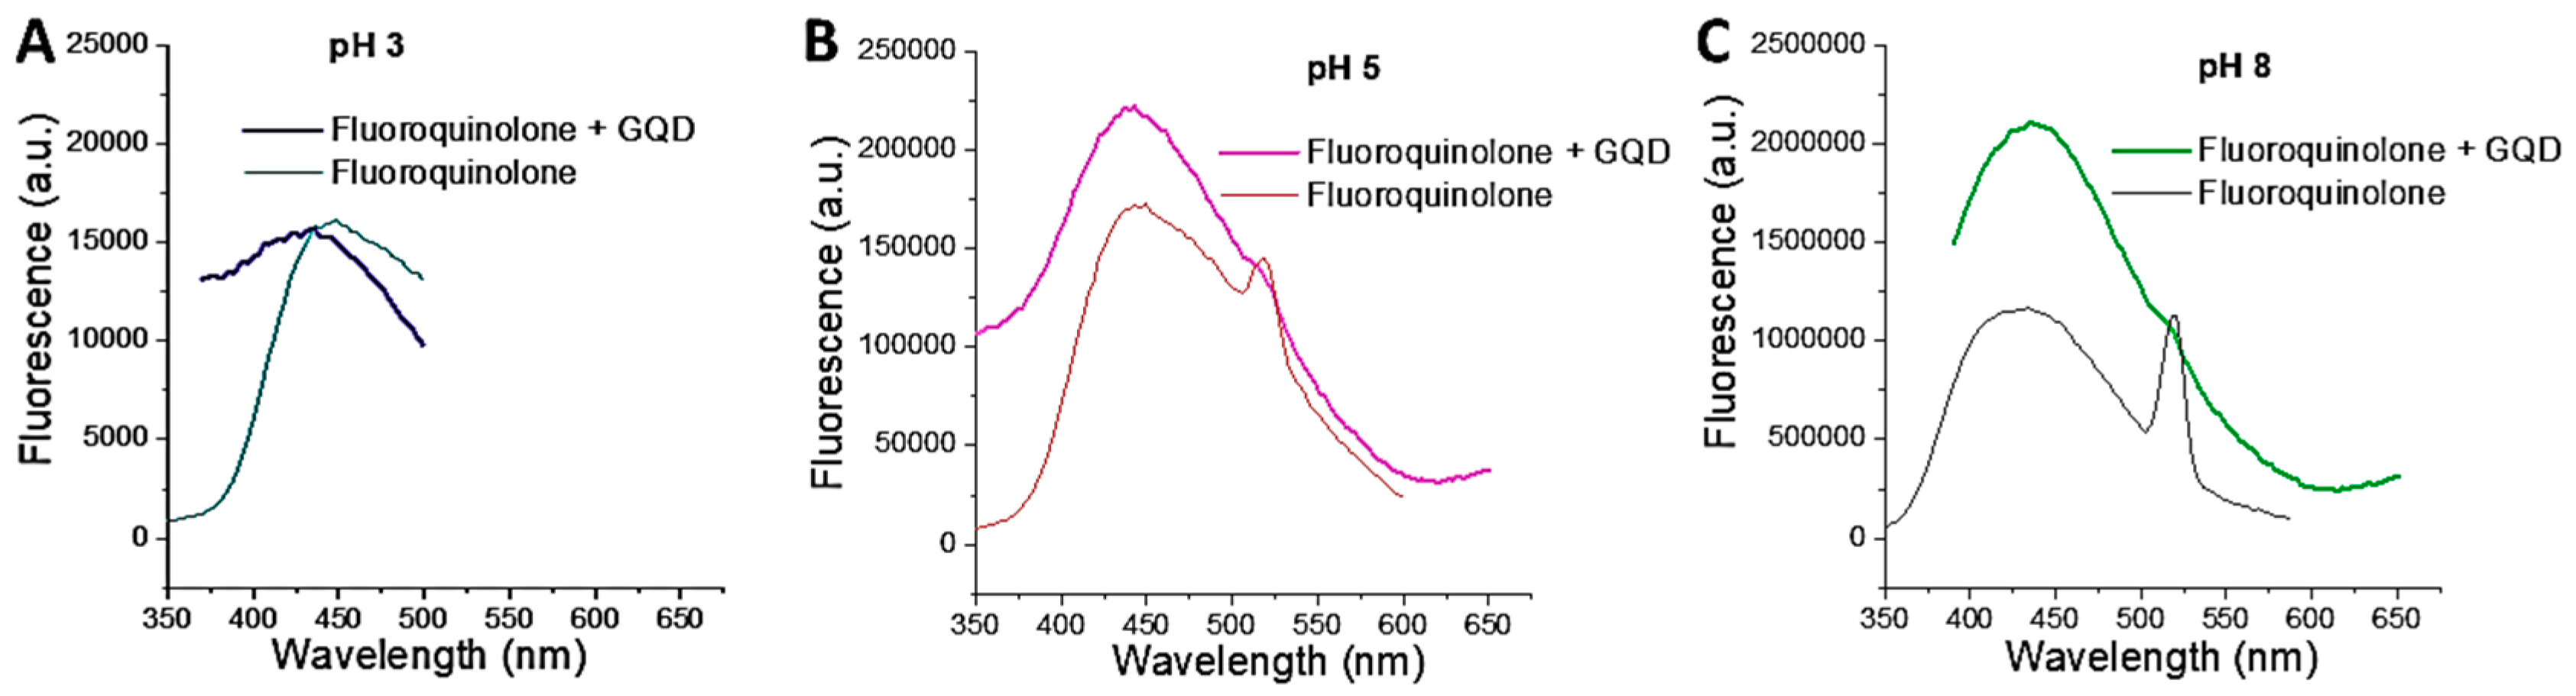
Preliminary experiments were focused on the evaluation of possible interactions between the synthesized GQDs and fluoroquinolone. It was found that only e-GQDs produced a significant change in the optical properties of norfloxacin (at 17.5 ng·L−1) at basic pH values. At a pH of 3, no improvement in the fluorescence of the antibiotic was observed whilst at pH 5 a slight enhancement occurred. The antibiotic doubled its fluorescence in presence of e-GQDs at a working pH of 8, as depicted in Figure 4. Similar results occurred for e-GQDs synthesized directly from pure oxacillin. However, the different behavior in the emission intensity of the antibiotic in presence of e-GQDs or o-GQDs is an indication of the variety in functionalities of each graphitic nanostructure. The higher nitrogen content of e-GQDs which is translated into an intense emission and a structured π-conjugation framework with primary amines enables their interaction electrostatically with the zwitterionic fluoroquinolone consisted of an anionic carboxylic group and a cationic piperazine moiety at such basic conditions (6.3 < pH < 8.7). The electrostatic forces could be reinforced by π–π stacking interactions between the GQD framework and the electron-poor heterocycle containing a fluorine atom (an electron-withdrawing ability), provoking a fluorescent enhancement response.
A fluorometric assay of fluoroquinolones in weakly basic media can be established by simply monitoring the degree of fluorescence enhancement of the selected fluoroquinolone exciting at its characteristic excitation wavelength.
4. Conclusions
This work offers an advantageous manner to remove contaminants from the environment with the benefit of synthesizing nanomaterials with exceptional optical features and sensing applications. This idea brings both social and economic gains since it proposes the transformation into new graphitic nanoparticles with potential applications from a pollutant that was recycled by an easy recovery process, being in-line to green chemistry.
Supplementary Materials
The following are available online at https://0-www-mdpi-com.brum.beds.ac.uk/2311-5629/5/4/68/s1. Figure S1: Infrared profiles (transmittance versus wavenumber) of the resulting GQDs after hydrothermal treatment of oxacillin residue at 200 °C, Figure S2: Raman scattering of the ensuing e-GQDs and o-GQDs, Figure S3: Photographs of the ensuing GQD aqueous solutions under sunlight (A) and UV light (B), and excitation-wavelength dependence emission of o-GQDs (C) and e-GQDs (D).
Author Contributions
Conceptualization, experimental performance, writing—original draft preparation was performed by M.L.S. Supervision by S.C.
Funding
This research was supported by the Spanish Ministry of Economy and Competitiveness for funding Project CTQ2017-83175R.
Acknowledgments
M.L. Soriano expresses her gratitude to the European Commission and the JJCC Castilla-La Mancha for the funding Project SBPLY/17/180501/000333. We want to thank the Central Service for Research Support (SCAI) of the University of Córdoba for the LC analyses and instrumental support.
Conflicts of Interest
Authors declare no conflicts of interest. The funders had no role in the design of the study; in the collection, analyses, or interpretation of data; in the writing of the manuscript, or in the decision to publish the results.
References
- Lobanovska, M.; Pilla, G. Penicillin’s Discovery and Antibiotic Resistance: Lessons for the Future? Yale J. Biol. Med. 2017, 90, 135–145. [Google Scholar]
- Katzung, B.; Trevor, A. Basic and Clinical Pharmacology, 13th ed.; Mcgraw-Hill: New York, NY, USA, 2014. [Google Scholar]
- Manyi-Loh, C.; Mamphweli, S.; Meyer, E.; Okoh, A. Antibiotic Use in Agriculture and Its Consequential Resistance in Environmental Sources: Potential Public Health Implications. Molecules 2018, 23, 795. [Google Scholar] [CrossRef] [PubMed]
- Michael, I.; Rizzo, L.; McArdell, C.S.; Manaia, C.M.; Merlin, C.; Schwartz, T.; Dagot, C.; Fatta-Kassinos, D. Urban wastewater treatment plants as hotspots for the release of antibiotics in the environment: A review. Water Res. 2013, 47, 957–995. [Google Scholar] [CrossRef] [PubMed]
- Cha, J.M.; Yang, S.; Carlson, K.H. Trace determination of b-lactam antibiotics in surface water and urban wastewater using liquid chromatography combined with electrospray tandem mass spectrometry. J. Chromatogr. A 2006, 1115, 46–57. [Google Scholar] [CrossRef] [PubMed]
- Giraldo, A.L.; Erazo-Erazo, E.D.; Flórez-Acosta, O.A.; Serna-Galvis, E.A.; Torres-Palma, R.A. Degradation of the antibiotic oxacillin in water by anodic oxidation with Ti/IrO2 anodes: Evaluation of degradation routes, organic by-products and effects of water matrix components. Chem. Eng. J. 2015, 279, 103–114. [Google Scholar] [CrossRef]
- Kurt, A.; Mert, B.K.; Özengin, N.; Sivrioğlu, Ö.; Yonar, T. Treatment of Antibiotics in Wastewater Using Advanced Oxidation Processes (AOPs). Phys.-Chem. Wastewater Treat. Resour. Recovery 2017, 175. [Google Scholar] [CrossRef]
- Cayuela, A.; Soriano, M.L.; Carrillo-Carrión, C.; Valcárcel, M. Semiconductor and carbon-based fluorescent nanodots: The need for consistency. Chem. Commun. 2016, 52, 1311–1326. [Google Scholar] [CrossRef]
- Geim, A.K.; Novoselov, K.S. The rise of graphene. Nat. Mater. 2007, 6, 183–191. [Google Scholar] [CrossRef]
- Ponomarenko, L.A.; Schedin, F.; Katsnelson, M.I.; Yang, R.; Hill, E.W.; Novoselov, K.S.; Geim, A.K. Chaotic Dirac billiard in graphene quantum dots. Science 2008, 320, 356–358. [Google Scholar] [CrossRef]
- Benítez-Martínez, S.; Valcárcel, M. Graphene quantum dots in analytical science. Trends Anal. Chem. 2015, 72, 93–113. [Google Scholar] [CrossRef]
- Du, Y.; Guo, S. Chemically doped fluorescent carbon and graphene quantum dots for bioimaging, sensor, catalytic and photoelectronic applications. Nanoscale 2016, 8, 2532–2543. [Google Scholar] [CrossRef] [PubMed]
- Zhang, Z.; Zhang, J.; Chen, N.; Qu, L. Graphene quantum dots: An emerging material for energy-related applications and beyond. Energy Environ. Sci. 2012, 5, 8869–8890. [Google Scholar] [CrossRef]
- Li, X.; Rui, M.; Song, J.; Shen, Z.; Zeng, H. Carbon and graphene quantum dots for optoelectronic and energy devices: A review. Adv. Funct. Mater. 2015, 25, 4929–4947. [Google Scholar] [CrossRef]
- Wang, Z.; Yu, J.; Zhang, X.; Li, N.; Liu, B.; Li, Y.; Dissanayake, S. Large-scale and controllable synthesis of graphene quantum dots from rice husk biomass: A comprehensive utilization strategy. Appl. Mater. Interfaces 2016, 8, 1434–1439. [Google Scholar] [CrossRef] [PubMed]
- Suryawanshi, A.; Biswal, M.; Mhamane, D.; Gokhale, R.; Patil, S.; Guin, D.; Ogale, S. Large scale synthesis of graphene quantum dots (GQDs) from waste biomass and their use as an efficient and selective photoluminescence on-off-on probe for Ag+ ions. Nanoscale 2014, 6, 11664–11670. [Google Scholar] [CrossRef] [PubMed]
- Jeong, Y.; Moon, K.; Jeong, S.; Koh, W.-G.; Lee, K. Converting Waste Papers to Fluorescent Carbon Dots in the Recycling Process without Loss of Ionic Liquids and Bioimaging Applications. ACS Sustain. Chem. Eng. 2018, 6, 4510–4515. [Google Scholar] [CrossRef]
- Xu, Q.; Gong, Y.; Zhang, Z.; Miao, Y.; Li, D.; Yan, G. Preparation of graphene oxide quantum dots from waste toner, and their application to a fluorometric DNA hybridization assay. Microchim. Acta 2019, 186, 483. [Google Scholar] [CrossRef]
- Sharma, V.; Singh, S.K.; Mobin, S.M. Bioinspired carbon dots: From rose petals to tunable emissive nanodots. Nanoscale Adv. 2019, 1, 1290–1296. [Google Scholar] [CrossRef]
- Ruiz-Palomero, C.; Soriano, M.L.; Benítez-Martínez, S.; Valcárcel, M. Photoluminescent sensing hydrogel platform based on the combination of Nanocellulose and S,N-codoped Graphene Quantum Dots. Sens. Actuators B 2017, 245, 946–953. [Google Scholar] [CrossRef]
- Fresco-Cala, B.; Soriano, M.L.; Sciortino, A.; Cannas, M.; Messina, F.; Cárdenas, S. One-pot synthesis of graphene quantum dot and simultaneous nanostructured self-assembly via a novel microwave-assisted method: Impact on triazines removal and efficiency monitoring. RSC. Adv. 2018, 8, 29939–29946. [Google Scholar] [CrossRef]
- Tian, P.; Tang, L.; Teng, K.S.; Lau, S.P. Graphene quantum dots from chemistry to applications. Mater. Today Chem. 2018, 10, 221–258. [Google Scholar] [CrossRef]
- Zhu, S.; Song, Y.; Zhao, X.; Shao, J.; Zhang, J.; Yang, B. The photoluminescence mechanism in carbon dots (graphene quantum dots, carbon nanodots, and polymer dots): Current state and future perspective. Nano Res. 2015, 8, 355–381. [Google Scholar] [CrossRef]
- Sk, M.A.; Ananthanarayanan, A.; Huang, L.; Lim, K.H.; Chen, P. Revealing the Tunable Photoluminescence Properties of Graphene Quantum Dots. J. Mater. Chem. C 2014, 2, 6954–6960. [Google Scholar] [CrossRef]
- Sweetman, M.J.; Hickey, S.M.; Brooks, D.A.; Hayball, J.D.; Plush, S.E. A practical guide to prepare and synthetically modify graphene quantum dots. Adv. Funct. Mater. 2019, 29, 1808740. [Google Scholar] [CrossRef]
- Qu, D.; Zheng, M.; Li, J.; Xie, Z.; Sun, Z. Tailoring color emissions from N-doped graphene quantum dots for bioimaging applications. Light Sci. Appl. 2015, 4, e364. [Google Scholar] [CrossRef]
- Li, Q.; Zhang, S.; Dai, L.; Li, L.-S. Nitrogen-Doped Colloidal Graphene Quantum Dots and Their Size-Dependent Electrocatalytic Activity for the Oxygen Reduction Reaction. J. Am. Chem. Soc. 2012, 134, 18932–18935. [Google Scholar] [CrossRef]
- Karimzadeh, A.; Hasanzadeh, M.; Shadjou, N.; de la Guardia, M. Electrochemical biosensing using N-GQDs: Recent advances in analytical approach. TrAC Trends Anal. Chem. 2018, 105, 484–491. [Google Scholar] [CrossRef]
- Karimzadeh, A.; Hasanzadeh, M.; Shadjou, N.; de la Guardia, M. Optical bio(sensing) using nitrogen doped graphene quantum dots: Recent advances and future challenges. TrAC Trends Anal. Chem. 2018, 108, 110–121. [Google Scholar] [CrossRef]
- Hasan, M.T.; Gonzalez-Rodriguez, R.; Ryan, C.; Pota, K.; Green, K.; Coffer, J.L.; Naumov, A.V. Nitrogen-doped graphene quantum dots: Optical properties modification and photovoltaic applications. Nano Res. 2019, 12, 1041–1047. [Google Scholar] [CrossRef]
- Kaur, M.; Kaur, M.; Sharma, V.K. Nitrogen-doped graphene and graphene quantum dots: A review on synthesis and applications in energy, sensors and environment. Adv. Coll. Interface Sci. 2018, 259, 44–64. [Google Scholar] [CrossRef]
- Geng, H.; Qiu, J.; Zhu, H.; Liu, X. Achieving stem cell imaging and osteogenic differentiation by using nitrogen doped graphene quantum dots. J. Mater. Sci. Mater. Med. 2018, 29, 85. [Google Scholar] [CrossRef] [PubMed]
- Liu, Q.; Guo, B.; Rao, Z.; Zhang, B.; Gong, J.R. Strong two-photon-induced fluorescence from photostable, biocompatible nitrogen-doped graphene quantum dots for cellular and deep-tissue imaging. Nano Lett. 2013, 13, 2436–2441. [Google Scholar] [CrossRef] [PubMed]
- Druart, S.; Kopelent-Frank, H. A rapid capillary electrophoretic assay for selective quantitation of oxacillin in the presence of its degradation products. J. Liq. Chromatogr. Relat. Technol. 2005, 28, 27–34. [Google Scholar] [CrossRef]
- Egea-Corbacho, A.; Gutiérrez, S.; Quiroga, J.M. Removal of emerging contaminants from wastewater through pilot plants using intermittent sand/coke filters for its subsequent reuse. Sci. Total Environ. 2019, 646, 1232–1240. [Google Scholar] [CrossRef]
- Zhu, S.; Zhang, J.; Liu, X.; Li, B.; Wang, X.; Tang, S.; Meng, Q.; Li, Y.; Shi, C.; Hu, R.; et al. Graphene quantum dots with controllable surface oxidation, tunable fluorescence and up-conversion emission. RSC Adv. 2012, 2, 2717–2720. [Google Scholar] [CrossRef]
Figure 1.
Schematic representation of the synthetic procedure of graphene nanostructures from oxacillin residues recovered from water samples. Pictures of graphene quantum dot (GQD) dispersions in water under sunlight (left) and UV lamp (right) irradiation are shown.
Figure 1.
Schematic representation of the synthetic procedure of graphene nanostructures from oxacillin residues recovered from water samples. Pictures of graphene quantum dot (GQD) dispersions in water under sunlight (left) and UV lamp (right) irradiation are shown.

Figure 2.
Transmission electron microscopic images of o-GQDs (A) and e-GQDs (B) whose diameters ranging 5–24 and 5–16 nm, respectively.
Figure 2.
Transmission electron microscopic images of o-GQDs (A) and e-GQDs (B) whose diameters ranging 5–24 and 5–16 nm, respectively.

Figure 3.
Absorbance (straight lines) and excitation (dot) and emission (dash) curves of o-GQDs and e-GQDs. Each GQD solution was appropriate diluted to get the highest intensity bands (avoiding GQD self-quenching and dilution effects).
Figure 3.
Absorbance (straight lines) and excitation (dot) and emission (dash) curves of o-GQDs and e-GQDs. Each GQD solution was appropriate diluted to get the highest intensity bands (avoiding GQD self-quenching and dilution effects).

Figure 4.
Emission spectra of norfloxacin (at 16.65 ng·L−1) in the presence and absence of e-GQDs (at 30 mg·mL−1) in aqueous solution at pH 8. Excitation wavelength was set at 260 nm.
Figure 4.
Emission spectra of norfloxacin (at 16.65 ng·L−1) in the presence and absence of e-GQDs (at 30 mg·mL−1) in aqueous solution at pH 8. Excitation wavelength was set at 260 nm.


Table 1.
Amine content found in Kaiser test of graphene quantum dots formed from oxacillin and ethylenediamine (EDA) precursors (e-GQDs) in triplicate.
Table 1.
Amine content found in Kaiser test of graphene quantum dots formed from oxacillin and ethylenediamine (EDA) precursors (e-GQDs) in triplicate.
| Run n° | GQD Sample (mg) | Amine Content Found (µmol/g) |
|---|---|---|
| 1 | 3.0 | 14.03 |
| 2 | 3.9 | 12.52 |
| 3 | 4.2 | 16.35 |
Table 2.
Fit parameters of the decay kinetic curves excited at different excitation wavelengths for graphene quantum dots formed from oxacillin precursor (o-GQDs).
Table 2.
Fit parameters of the decay kinetic curves excited at different excitation wavelengths for graphene quantum dots formed from oxacillin precursor (o-GQDs).
| λexc (nm) | τ1 (ns) | %Rel | τ2 (ns) | %Rel | τ3 (ns) | %Rel |
|---|---|---|---|---|---|---|
| 400 | 0.22 | 14 | 1.33 | 49 | 4.71 | 37 |
| 440 | 0.34 | 21 | 1.89 | 47 | 5.43 | 32 |
| 475 | 0.20 | 17 | 1.62 | 45 | 5.10 | 39 |
Table 3.
Fit parameters of the decay kinetic curves excited at diverse excitation wavelengths for e-GQDs formed from oxacillin and EDA as carbon and nitrogen sources.
Table 3.
Fit parameters of the decay kinetic curves excited at diverse excitation wavelengths for e-GQDs formed from oxacillin and EDA as carbon and nitrogen sources.
| λexc (nm) | τ1 (ns) | %Rel | τ2 (ns) | %Rel | τ3 (ns) | %Rel |
|---|---|---|---|---|---|---|
| 390 | 0.14 | 1 | 1.25 | 50 | 6.3 | 49 |
| 415 | 0.34 | 19 | 1.83 | 50 | 5.94 | 31 |
| 435 | 0.10 | 9 | 1.25 | 45 | 4.64 | 46 |
© 2019 by the authors. Licensee MDPI, Basel, Switzerland. This article is an open access article distributed under the terms and conditions of the Creative Commons Attribution (CC BY) license (http://creativecommons.org/licenses/by/4.0/).
Share and Cite
MDPI and ACS Style
Soriano, M.L.; Cárdenas, S. Recycling Oxacillin Residues from Environmental Waste into Graphene Quantum Dots. C 2019, 5, 68. https://0-doi-org.brum.beds.ac.uk/10.3390/c5040068
AMA Style
Soriano ML, Cárdenas S. Recycling Oxacillin Residues from Environmental Waste into Graphene Quantum Dots. C. 2019; 5(4):68. https://0-doi-org.brum.beds.ac.uk/10.3390/c5040068
Chicago/Turabian StyleSoriano, Maria Laura, and Soledad Cárdenas. 2019. "Recycling Oxacillin Residues from Environmental Waste into Graphene Quantum Dots" C 5, no. 4: 68. https://0-doi-org.brum.beds.ac.uk/10.3390/c5040068
Note that from the first issue of 2016, this journal uses article numbers instead of page numbers. See further details here.