Characterization of Carbon Materials for Hydrogen Storage and Compression
by
 , , ,
, , ,
Giuseppe Sdanghi
1 ,
,
Rafael L. S. Canevesi
1,
Alain Celzard
1,
Matthias Thommes
2,* and
Vanessa Fierro
1,* 1
Institut Jean Lamour, Université de Lorraine, CNRS, F-88000 Epinal, France
2
Institute of Separation Science and Technology, Department of Chemical and Biological Engineering (CBI), Friedrich-Alexander-University, 91058 Erlangen, Germany
*
Authors to whom correspondence should be addressed.
C 2020, 6(3), 46; https://0-doi-org.brum.beds.ac.uk/10.3390/c6030046
Submission received: 14 June 2020
/
Revised: 3 July 2020
/
Accepted: 7 July 2020
/
Published: 9 July 2020
(This article belongs to the Collection Carbon-Based Materials for Hydrogen Production, Storage and Conversion)
Abstract
:Carbon materials have proven to be a suitable choice for hydrogen storage and, recently, for hydrogen compression. Their developed textural properties, such as large surface area and high microporosity, are essential features for hydrogen adsorption. In this work, we first review recent advances in the physisorption characterization of nanoporous carbon materials. Among them, approaches based on the density functional theory are considered now standard methods for obtaining a reliable assessment of the pore size distribution (PSD) over the whole range from narrow micropores to mesopores. Both a high surface area and ultramicropores (pore width < 0.7 nm) are needed to achieve significant hydrogen adsorption at pressures below 1 MPa and 77 K. However, due to the wide PSD typical of activated carbons, it follows from an extensive literature review that pressures above 3 MP are needed to reach maximum excess uptakes in the range of ca. 7 wt.%. Finally, we present the adsorption–desorption compression technology, allowing hydrogen to be compressed at 70 MPa by cooling/heating cycles between 77 and 298 K, and being an alternative to mechanical compressors. The cyclic, thermally driven hydrogen compression might open a new scenario within the vast field of hydrogen applications.
1. Introduction
Storing hydrogen in carbon-based materials is seen as a viable solution for increasing the density of hydrogen, which is currently the main issue hampering the hydrogen supply chain [1]. Indeed, hydrogen becomes denser if it is stored within a porous solid rather than in the form of pure compressed gas. Several studies [2,3,4] assume that the density of hydrogen stored in nanoporous carbon materials can be approximated to the density of liquid hydrogen, i.e., 70 kg m−3. To reach such a value, which is four orders of magnitude higher than the density of gaseous hydrogen at room temperature and atmospheric pressure (0.089 kg m−3), the temperature of the system must be significantly lowered. For instance, at 77 K, the adsorption of hydrogen is improved by increasing its interaction with the carbon surface via van der Waals forces. Fierro et al. [5] proved that adsorption is the most efficient storage way at 298 K and up to 20 MPa. This means that, under these conditions, the amount of hydrogen stored is always higher in the presence of an adsorbent than in the case where hydrogen is stored by simple compression in an empty vessel having the same volume. Therefore, carbon-based storage would allow the use of a hydrogen tank of lower volume. Indeed, if 5 kg of hydrogen can be stored at 20 MPa and 298 K in an empty high-pressure tank of volume 340 L, the requested volume is lowered to 263 L in the presence of a carbon adsorbent, for storing the same amount of hydrogen under the same conditions [6]. Such advantages are conferred by the particular texture of porous carbons. Hence, to assess the potential of adsorbents such as carbons for hydrogen storage, a comprehensive and reliable textural characterization with regard to surface area, pore size, pore size distribution, etc. is necessary, and physical adsorption is here considered one of the key methods.
Hence, in this paper, we review, in addition to important aspects of the potential of carbons for hydrogen storage, some recent advances in the physical adsorption characterization relevant for nanoporous carbons. In the second part, we review the most relevant studies related to hydrogen storage on microporous carbon materials such as carbon nanotubes, carbon nanofibers, activated carbons, and carbons derived from zeolites and metal organic frameworks (MOFs). The third part of this work is dedicated to discussing the potential of carbon materials in the emerging technology for hydrogen compression. Hence, this paper should not be considered a comprehensive review, but we focus on important, selected aspects of the hydrogen storage potential of carbons and their textural properties.
2. Physical Adsorption: Characterization of Nanoporous Carbons
2.1. General
Physisorption (physical adsorption) occurs whenever a gas (the adsorptive) is brought into contact with a solid surface (the adsorbent). Adsorption in porous materials is governed by the interplay between the strength of fluid–wall and fluid–fluid interactions as well as the effects of confined pore space on the state and thermodynamic stability of fluids in narrow pores [7,8,9]. This is also reflected in the shape or type of the adsorption isotherm. IUPAC (International Union of Pure and Applied Chemistry) has published a classification of six types of adsorption isotherms and proposed to classify pores by their internal pore width (the pore width defined as the diameter in the case of cylindrical and spherical pores and as the distance between opposite walls in case of slit pores) [10]. According to their diameter, the pores are divided into three groups: micropores of width less than 2 nm, mesopores of width between 2 and 50 nm, and macropores of width greater than 50 nm. These pore size classes are embedded within the nanopore range, which defines pores up to 100 nm. Furthermore, the micropore range is often further subdivided into ultramicropores (pores smaller than 0.7 nm) and supermicropores (pores from 0.7 to 2 nm). The pore size is generally specified as the internal pore width, although for mesopores it has been customary to refer to the pore radius (or pore diameter). Of course, such terms have a precise meaning only when the pore shape is properly defined.
Over the last two decades, tremendous progress has been achieved with regard to the understanding of sorption phenomena in narrow pores, which in turn has led to major progress in physical adsorption. This progress is greatly associated with the development and application of microscopic methods, such as the density functional theory (DFT) of inhomogeneous fluids (e.g., nonlocal density functional theory, NLDFT) or computer simulation methods such as Monte Carlo (MC) and molecular dynamic (MD) simulations [11,12].
Although it is now possible to use physical adsorption to accurately determine pore size and volume distributions of ordered nanoporous materials, the in-depth characterization of highly disordered porous materials remains challenging. Application of characterization techniques to materials consisting of pores spanning the entire micro-, meso-, and (in some cases) macropore range has revealed new phenomena such as cavitation processes during desorption and has led to significant refinement of these techniques. Advanced adsorption methodologies have been developed, which are based on the combination of various adsorptives at various temperatures coupled with dedicated methods based on DFT or molecular simulation. This allows one to differentiate between different types of interconnected pore networks and to quantify the accessible pore volume [13,14].
Despite this progress, there are still limitations and challenges with regard to the characterization of nanoporous materials with complex pore networks including nanoporous carbons, and for this a combination of advanced physisorption experiments with complementary techniques, including methods based on digital image analysis, in-situ X-ray, and neutron scattering, is necessary [13,14,15]. However, within the scope of this paper, we focus only on selected aspects of applying physisorption for the characterization of nanoporous carbons.
2.2. Choice of Adsorptive
2.2.1. Standard Adsorptives
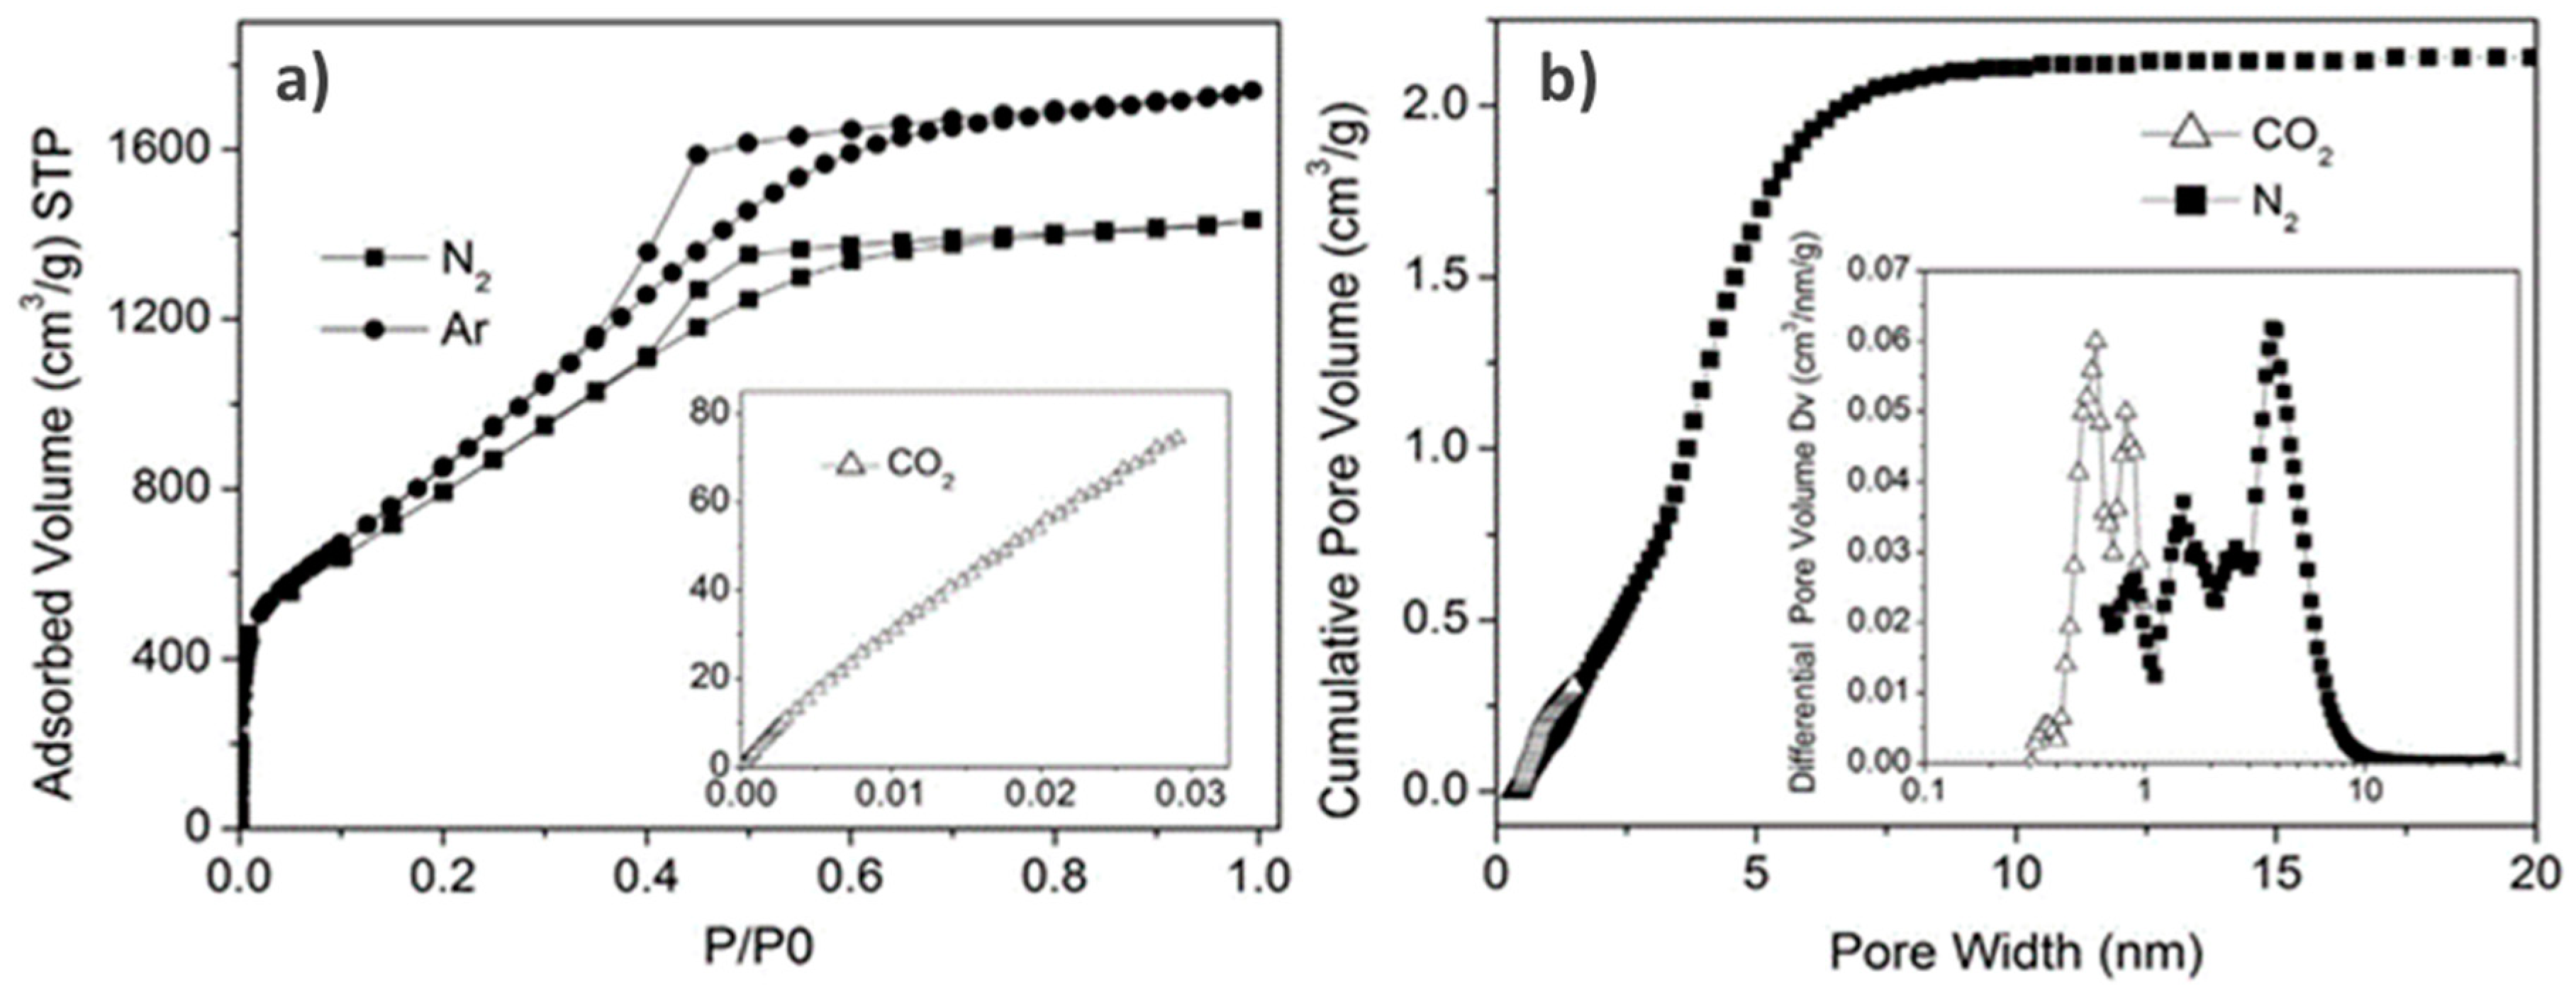
To perform a reliable surface area and pore structure analysis, choosing the proper adsorptive is critical. In fact, if the goal is to obtain information about pore structure and surface area, ideally, the adsorptive and experimental conditions should be chosen in a way that the obtained adsorption isotherm can be considered as a fingerprint of the texture of the porous material. Although nitrogen (N2) adsorption at 77 K has been the accepted standard adsorptive for both micropore and mesopore size analysis for many years, it has been shown that N2 is in many cases less than optimal for surface area and pore size analysis. Nonpolar materials, and specifically non-functionalized carbons, can be accurately analyzed using N2 at 77 K; however, specific interactions between the quadrupole moment of the N2 molecule and various surface functional groups and exposed ions that are present in materials such as MOFs or zeolites, lead to inaccurate analyses. This affects both the orientation of the adsorbed N2 molecules and the micropore filling pressure. Such specific interactions shift the pore-filling pressure of N2 to very low relative pressures (a P/P0 equal to about 10−7) (e.g., [10,11,12,13]); consequently, the pore-filling pressure is not correlated with micropore size. In contrast to the issues with N2 adsorption, argon (Ar) adsorption at 87 K (the boiling temperature of Ar) does not display any specific interactions with surface functionality or uncertainty in orientation, and is the recommended choice by IUPAC for micropore characterization [10]. In addition to using liquid Ar, a variety of commercially available cryostats and cryo-coolers make it now possible to control the experimental temperature at 87 K with high precision. Because Ar (87 K) adsorption fills micropores in many cases at significantly higher P/P0 than N2, it is possible to reliably resolve small differences in micropore size. However, activated carbons may contain significant amounts of ultramicropores (i.e., often active carbons exhibit pores <0.5 nm) and access to these micropores is further limited by diffusion. To address this problem, the use of carbon dioxide (CO2) as adsorptive was proposed for adsorption measurements at temperatures close to 273 K. It was shown that CO2, with slightly smaller kinetic diameter and high temperature of adsorption, enables higher diffusion rates, ultimately producing better resolution of ultra-micropores [16,17]. Because of these experimental advantages, CO2 adsorption at 273 K has become a standard tool for the assessment of microporous carbons [7]. Consequently, advanced DFT and grand canonical Monte Carlo (GCMC) methods have been developed for calculating the pore-size distribution from the CO2 adsorption isotherm ([12] and references therein). An example is presented in Figure 1, which shows the micro-mesopore size analysis of a graphene-based nanoporous carbon for supercapacitor applications by combining N2 and Ar adsorption at their boiling temperatures with CO2 adsorption at 273 K coupled with the application of dedicated NLDFT methods.
More recent advances include the development of 2D-NLDFT approaches allowing to assess the ultramicropores of extremely heterogeneous chars and activate carbons by a combination of N2 and CO2 at 77 K and 273 K, respectively [18,19]. Coupling CO2 adsorption with N2 and Ar adsorption in order to obtain the combined micro-mesopore analysis is needed because, at 273 K and up to atmospheric pressure (i.e., the maximum pressure in conventional adsorption equipment utilized for physisorption characterization), CO2 is restricted to the pore filling of pores that are narrower than about 1 nm because of the high saturation pressure (26141 torr, 1 torr = 133.322 Pa), i.e., ambient pressure corresponds to a relative pressure of only approximately 10−2. Hence, to expand the pore size analysis of carbon based on CO2 adsorption at 273 K, one would need to utilize high pressure CO2 adsorption data, measured up to saturation pressure (ca. 0.35 MPa) [20].
It is important to note that CO2 exhibit an even stronger quadrupole moment compared to N2, which affects the adsorption behavior on surfaces with polar surface functionalities and hence prohibits the use of CO2 as adsorptive for a reliable pore size analysis of materials such as zeolites and MOFs. In addition, caution has to be applied for the characterization of carbons containing appreciable amounts of oxygen surface functionalities.
2.2.2. Other Adsorptives for Carbon Characterization
With the recent growing interest in hydrogen storage and fuel cell applications, there has been increased research on hydrogen adsorption on carbon materials and pore-size determination using hydrogen at 77 K. Although highly supercritical at this temperature, it has been shown that, by using hydrogen adsorption at 77 K coupled with a proper NLDFT approach, pore size analysis can be extended to pore sizes smaller than those that can be characterized with other adsorptives, including CO2 [21]. However, the use of hydrogen as an adsorptive for pore-size analysis is limited to a pore width range smaller than 0.5 nm [22]. Recently, efforts have been made to develop methodologies for carbon characterization by combining H2 and O2 adsorption at 77 K in order to obtain a full pore size distribution curve. Pore size analysis is performed using molecular models based on classical and quantum-corrected 2D-NLDFT [23].
To assess the smallest pore dimensions in microporous materials, Kaneko et al. suggested the use of helium, which is the smallest inert molecule [24]. Of course, the experiments have to be performed below helium’s critical temperature (ca. 5.2 K) and Kaneko et al. [24,25] measured helium adsorption at 4.2 K on activated carbon fibers. From these data, micropore volumes 20–50% greater than those obtained from N2 adsorption at 77 K were found. The excess amount of helium adsorption was ascribed to the presence of ultramicropores, which cannot be accessed by N2 molecules.
2.3. Aspects of Surface Area Assessment
2.3.1. BET Method
Surface area is the crucial parameter to optimize porous carbons for many applications, including hydrogen storage. In fact, as we discuss in more detail below, it has been shown that particularly at low pressures and at low temperatures (e.g., 77 K) the amount of hydrogen adsorbed on a carbon material is determined mainly by its accessible surface area coupled with well defined, narrow micropore size distribution (PSD) [26,27]. For instance, at this temperature, it is assumed that the amount of hydrogen adsorbed gradually increases by 1 wt.% per 500 m2 g−1 of surface area for carbon adsorbents. This behavior is generally known as “Chahine’s rule” [28]. However, the assessment of reliable surface area for nanoporous carbons is challenging.
The standard tool, commonly used to calculate it, is the BET method, proposed by Brunauer, Emmett, and Teller (see [7,8,9,10] and references therein). Despite the well-known limitations, the Brunauer–Emmett–Teller (BET) method continues to be widely used for the evaluation of surface areas of micro- and mesoporous adsorbents, including nanoporous carbons. Indeed, under certain, carefully controlled conditions, the BET area of a non-porous, macroporous, or mesoporous solid giving rise to Type II or IVa isotherms can be regarded as the probe accessible area or the effective area available for the adsorption of specified adsorptives. A concise critical appraisal of the BET method is given in the 2015 IUPAC recommendations and in Ref. [10]. In addition to problems arising from the chemical and geometrical heterogeneity of the surface, the porosity (i.e., existence of micro- and/or mesopores) plays an important role for the applicability of the BET equation. In the presence of micropores (i.e., Type I isotherms and combinations of Types I and II or Types I and IV isotherms, which are characteristic of many micro–mesoporous materials), the application of the BET method only leads to an apparent surface area (i.e., BET area). This is also correlated with the fact that it is impossible to separate the processes of monolayer–multilayer adsorption and micropore filling. Within the same context, it also appears that the BET method is inaccurate for estimating the surface area of mesoporous materials exhibiting a Type IVb isotherm. Here, pore condensation is observed at pressures very close to the pressure range where monolayer–multilayer formation on the pore walls occurs: this may lead to a significant overestimation of the monolayer capacity in a BET analysis.
As already indicated, the BET theory is not applicable in the presence of micropores, and, by applying the BET method, the linear BET range is often shifted to significantly lower relative pressures. As a result, for predominantly microporous materials, linear BET plots are typically found at relative pressures of 0.1 and even lower. A useful procedure was introduced [29,30,31] which allows one to overcome this difficulty and to determine the linear BET range in an unambiguous way for purely microporous materials. However, it should be stressed that the BET area derived from an isotherm obtained on a microporous should not be treated as a realistic probe accessible surface area but rather as an apparent surface area (ABET), which however still may serve as a useful “fingerprint” of the adsorbent.
Furthermore, the heterogeneous nature of many surfaces causes another problem. As mentioned in the previous sections, it is well known that the quadrupole moment of the N2 molecule leads to specific interactions with potential polar surface sites (such as hydroxyl groups) causing an orienting effect on the adsorbed N2 molecule. Consequently, the effective cross-sectional area is smaller than the customary value of 0.162 nm2. For a completely hydroxylated surface, a cross-sectional area of 0.135 nm2 was proposed [9,10]. Accordingly, these uncertainties concerning the assumption of a proper cross-sectional may affect the accuracy of BET areas obtained from N2 (77 K) adsorption up to 20–30%. Hence, as discussed above, Ar adsorption (at 87 K) may be a useful alternative adsorptive for surface area determination as the Ar molecule is monatomic and mainly because of the absence of a quadrupole moment far less reactive than the diatomic N2 molecule. Hence, the cross-sectional area of Ar (0.142 nm2 at 87 K) is also less sensitive to structural differences of the adsorbent surface. Consequently, as also discussed in the 2015 IUPAC recommendations, Ar has significant advantages compared to N2 as a probe for the textural characterization of powders and porous materials.
To summarize, one has to take extreme caution when applying the BET method to materials with appreciable amounts of microporosity such as can be found in many nanoporous carbon materials. The obtained BET area (preferably calculated from the Ar at 87 K isotherm) can only be considered as an apparent surface area, which may be regarded as a useful adsorbent “fingerprint”.
2.3.2. Other Methods for Surface Area Assessment
Other methods to obtain a specific surface area from gas adsorption are based on the application of the standard isotherm concept, e.g., t- and alpha-s methods (including the high resolution alpha-s analysis) [7,8,9,30]. A micropore surface area can also be obtained by methods related to the Dubinin approach (i.e., the Dubinin–Kaganer method) [7,8,9]. Another alternative to obtain quite accurate surface areas of nanoporous carbons and to differentiate between micro- and external surface area is the application of the DFT method, which calculates the specific cumulative surface area (specific surface area as a function of pore size) over the complete range of micro- and mesopores. However, accurate results are obtained only if the given experimental adsorptive/adsorbent system is compatible with one of the available DFT methods. A systematic study of 190 different porous carbons suggested that the application of methods derived from the Dubinin–Radushkevitch approach, methods based on density functional theory (NLDFT and QSDFT), and the application of immersion calorimetry are useful concerning the surface area determination of microporous carbons [32].
2.4. Pore Size and Porosity Analysis
Purely microporous materials exhibit a Type I isotherm (according to the IUPAC classification) with a horizontal plateau. In addition, mesoporous materials containing no macropores exhibit Type IV isotherms, which remain nearly horizontal over the upper relative pressure range. For such cases, the pore volume, Vp, is then derived from the amount of vapor adsorbed at a relative pressure close to unity such as P/P0 = 0.95, by assuming that the pores are filled with the adsorbate in the bulk liquid state and applying the Gurvich rule [7,8,9]. If macropores are present, the isotherm is no longer nearly horizontal near P/P0 = 1 and the total pore volume can no longer be evaluated.
Very often, microporous materials contain additional mesoporosity and in this case the micropore volume can be obtained by applying the already above-mentioned comparison plot methods. These empirical methods allow one to determine micropore volume, external surface area and, in principle, information about the average pore size. For carbon materials, methods based on the Dubinin–Radushkevich (DR) approach are frequently applied to obtain micropore volume. A more advanced method which allows for the determination of the micropore size distribution of microporous carbons up to a pore width of 2 nm was put forward by Horvath and Kawazoe (HK) [33]. The HK method allows for the calculation of the micropore volume distribution from a low pressure N2 adsorption isotherm obtained on a slit pore carbon. The advantage of the HK methods compared to methods based on Dubinin approaches is that they are specific with respect to the pore shape and adsorbate–adsorbent interaction potential. However, a disadvantage is that they do not give a realistic description of the micropore filling because they neglect the inhomogeneity of the adsorbed molecules in the micropores. In addition, the modified Kelvin equation, which serves as the basis for many classical methods of mesopore analysis, including the widely used BJH (Barrett–Joyner–Halenda) method [7,8,9] is based on macroscopic, thermodynamic assumptions. However, the validity of the Kelvin equation becomes questionable for narrow mesopores because macroscopic concepts can no longer be applied. In fact, it has been demonstrated that the mentioned classical, macroscopic thermodynamic methods may significantly underestimate the true pore size for pores of up to 20–25% (particularly for pores <10 nm) [4,6,7].
The problems associated with the above-mentioned macroscopic, thermodynamic methods have been addressed by applying microscopic methods based on molecular simulation or DFT, which yield the thermodynamic and density profiles of confined fluids and describe details of the adsorbed phase on a molecular level [11,12,33]. They capture the essential features of the pore filling mechanism of micropores and the mechanism of pore condensation, evaporation, and hysteresis. As a consequence, they allow one to obtain (compared to the classical methods) much more reliable pore size distributions over the complete range of micro- and mesopores. With such advanced methods it is now also possible to describe the underlying mechanisms of pore condensation and hysteresis in mesopores and hence obtain reliable information from both the adsorption and desorption branches of the hysteresis loop (in case mesopores are present), which is crucial for pore size characterization of carbons consisting of an interconnected micro–mesoporous network [34,35,36,37,38]. It has been demonstrated that the application of DFT-based methods provides a much more accurate and comprehensive pore-size analysis compared to macroscopic thermodynamic methods (e.g., Kelvin equation, BJH, and Horvath–Kawazoe), i.e., accurate pore-size and pore-volume information can be obtained over the complete micro- and mesopore range [10,11,12,13,14].
A drawback of the conventional DFT approaches (such as the non-local density functional theory, NLDFT) for the pore size characterization of disordered carbon materials is that the solid surface is treated as molecularly smooth and its predictions imply pronounced layering steps on adsorption isotherms, which are not observed in experimental adsorption isotherms on amorphous carbons. This can cause prominent artifacts in the NLDFT pore size distributions, such as the gap at ca. 1 nm, which is characteristic of many porous activated carbons. Several approaches have been suggested to account for the heterogeneity of carbon materials including the development of advanced structural models of porous carbons by reverse Monte Carlo techniques which, however, are still too complex to be implemented for routine pore size analyses. Others suggested modeling porous carbons with a mixed geometry model [38]. Molecular simulations have also demonstrated that the surface roughness and defects significantly affect the shape of adsorption isotherms on heterogeneous surfaces [39]. Within the framework of the standard slit-pore model of carbons, variability of pore wall thickness was introduced [39], but it led to just a marginal improvement over the standard NLDFT approach. To account quantitatively for the effects of surface heterogeneity in carbons in a practical way, quenched solid density functional theory (QSDFT) was introduced for carbon characterization [40]. In contrast to the conventional NLDFT models that assume flat, structureless graphitic pore walls, the solid is modeled using the distribution of solid atoms rather than the source of the external potential field. The surface heterogeneity in the QSDFT model is characterized by a single roughness parameter that represents the characteristic width of molecular level surface corrugations. The QSDFT method for carbons has originally been developed assuming slit-shaped pores, which are typical model pores in activated microporous carbons. However, due to the emergence of novel materials with pre-designed pore morphology obtained by synthesis routes which make use of structure directing agents or hard templates, the QSDFT method has been extended to micro–mesoporous carbons with cage-like and channel-like pore geometries [40,41]. The development of two-dimensional versions of the NLDFT theory (2D-NLDFT) can also be considered a major progress with regard to nanoporous carbon characterization [42,43]. The first models took into account slit pores having parallel disc-shaped walls “cut” from graphene sheets. Such a model is of finite size in all directions but, due to its circular symmetry, it can only be treated in two dimensions. A refinement of this model was made to by considering the energy heterogeneity and the geometrical corrugated surface of carbon pores. With this much more realistic pore size distributions of nanoporous carbons can be obtained.
Summarizing, it has been shown that both the QSDFT model as well as the novel approaches based on 2D-NLDFT significantly improve the reliability of the pore size analysis of heterogeneous carbon nanopores. An example is shown in Figure 2, which shows the QSDFT pore size analysis of two coal-based active carbons based on high-resolution N2 adsorption experiments. The isotherm data are shown in both linear and semi-log display, which reveals details of the micropore structure. The obtained QSDFT pore size analysis was used to qualitatively correlate the pore structure of the carbon to the activation conditions of the material, and allowed determining which pores control the gas storage (here, CO2) filling capacity and selectivity [43].
2.5. Effect of Pore Size Distribution on Hydrogen Storage
Here, we discuss some aspects concerning the correlation between pore size and pore size distribution (PSD) of nanoporous carbons and their effect on hydrogen storage potential. For this purpose, we took a published dataset of textural properties and hydrogen capacities of 17 lab-made activated carbons (ACs) [5]. We already reported [5] results on their textural characterization and absolute hydrogen uptake, at 77 K and up to 8 MPa, which were obtained in a gravimetric device. These ACs were prepared by KOH or NaOH activation at temperatures ranging from 973 to 1073 K and they had BET areas (ABET) between ca. 1300 and 3300 m2 g−1 (labeled T1332 and T3297, respectively, the number after T being the ABET value). ACs with lower ABET had pore size distributions (PSD) shifted to narrower pores while those with larger ABET showed a higher fraction of wider pores. Materials with lower ABET reached their maximum hydrogen adsorption capacities at lower pressures than those having a larger ABET, but all of them reached the maximum hydrogen adsorption at about 4 MPa. In this manuscript, we deepen the understanding of hydrogen adsorption on these ACs in light of their PSD and study the effect of PSD on the pressure at which the maximum hydrogen capacity was obtained.
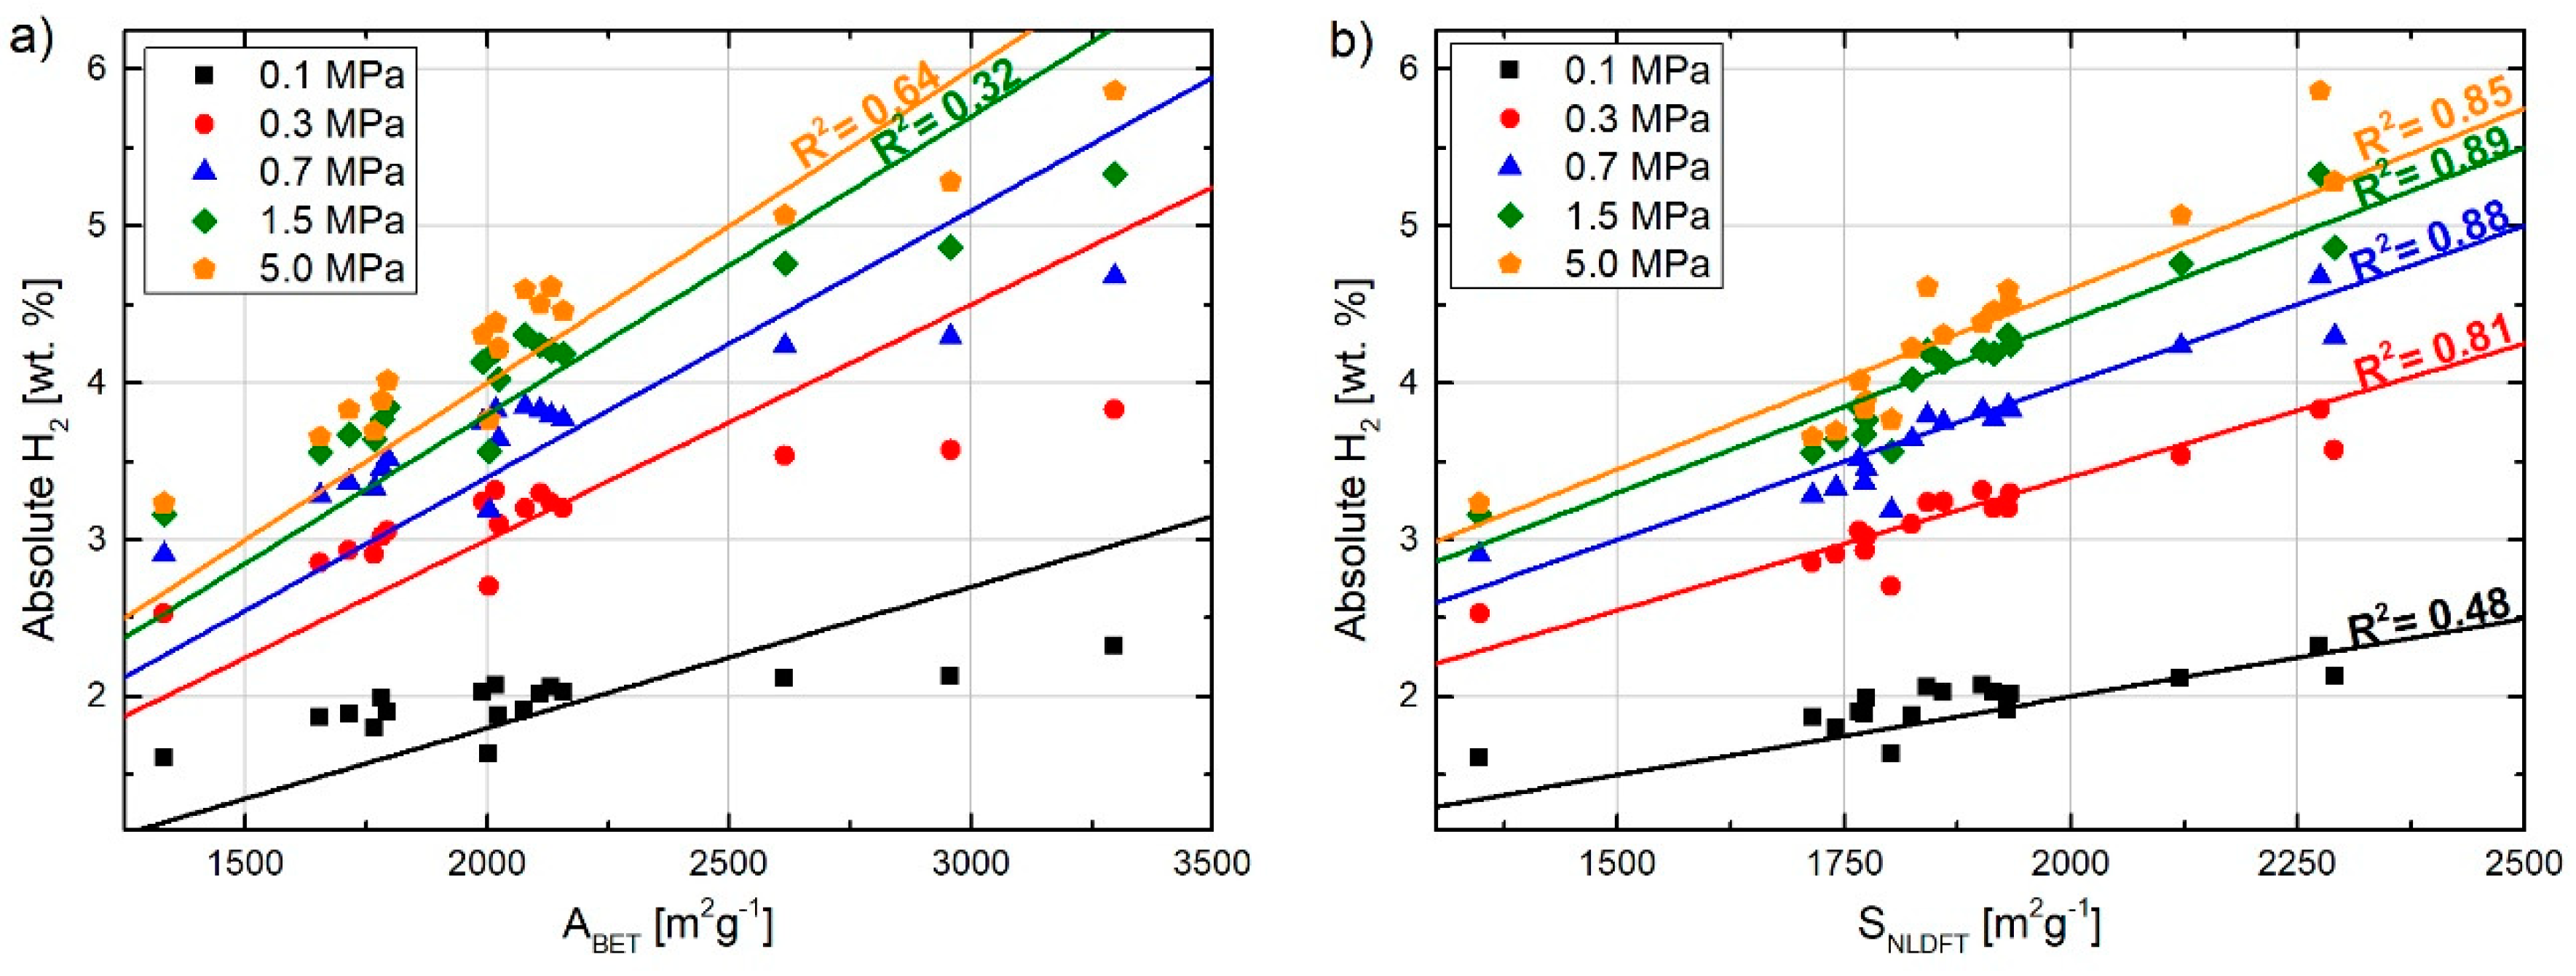
Figure 3a shows the absolute hydrogen uptake at 77 K as a function of ABET when the adsorption pressure increases from 0.1 to 5 MPa. It can be seen that the determination factor increases with the storage pressure due to the higher surface coverage, and the trend approaches the Chahine’s rule only at 5 MPa. However, the determination factor is still far from 1, which is certainly reflecting the discussed limitations of the BET method for surface area assessment. Hence, in Figure 3b, the absolute hydrogen uptake was plotted as a function of SNLDFT (using 2D-NLDFT model) instead of ABET as in Figure 3a. The determination factor at each considered pressure increases considerably when compared to those given in Figure 3a, although at 0.1 MPa it is still quite low (R2= 0.48), which confirms that a more accurate surface area for these carbons could be obtained by applying 2D-NLDFT instead of the BET method. In addition, the fact that SNLDFT was obtained from a combination of N2 and CO2 adsorption allowed assessing pores smaller than 0.6 nm, where hydrogen is preferentially adsorbed [44,45,46]. Consequently, even more accurate surface areas and correlation with hydrogen storage should be obtained by using H2 instead of CO2 (e.g., coupled with N2) characterization [23]. At pressures higher than 0.1 MPa, the pores are progressively filled and the effect of the pores that are not accessible to CO2 is less important.
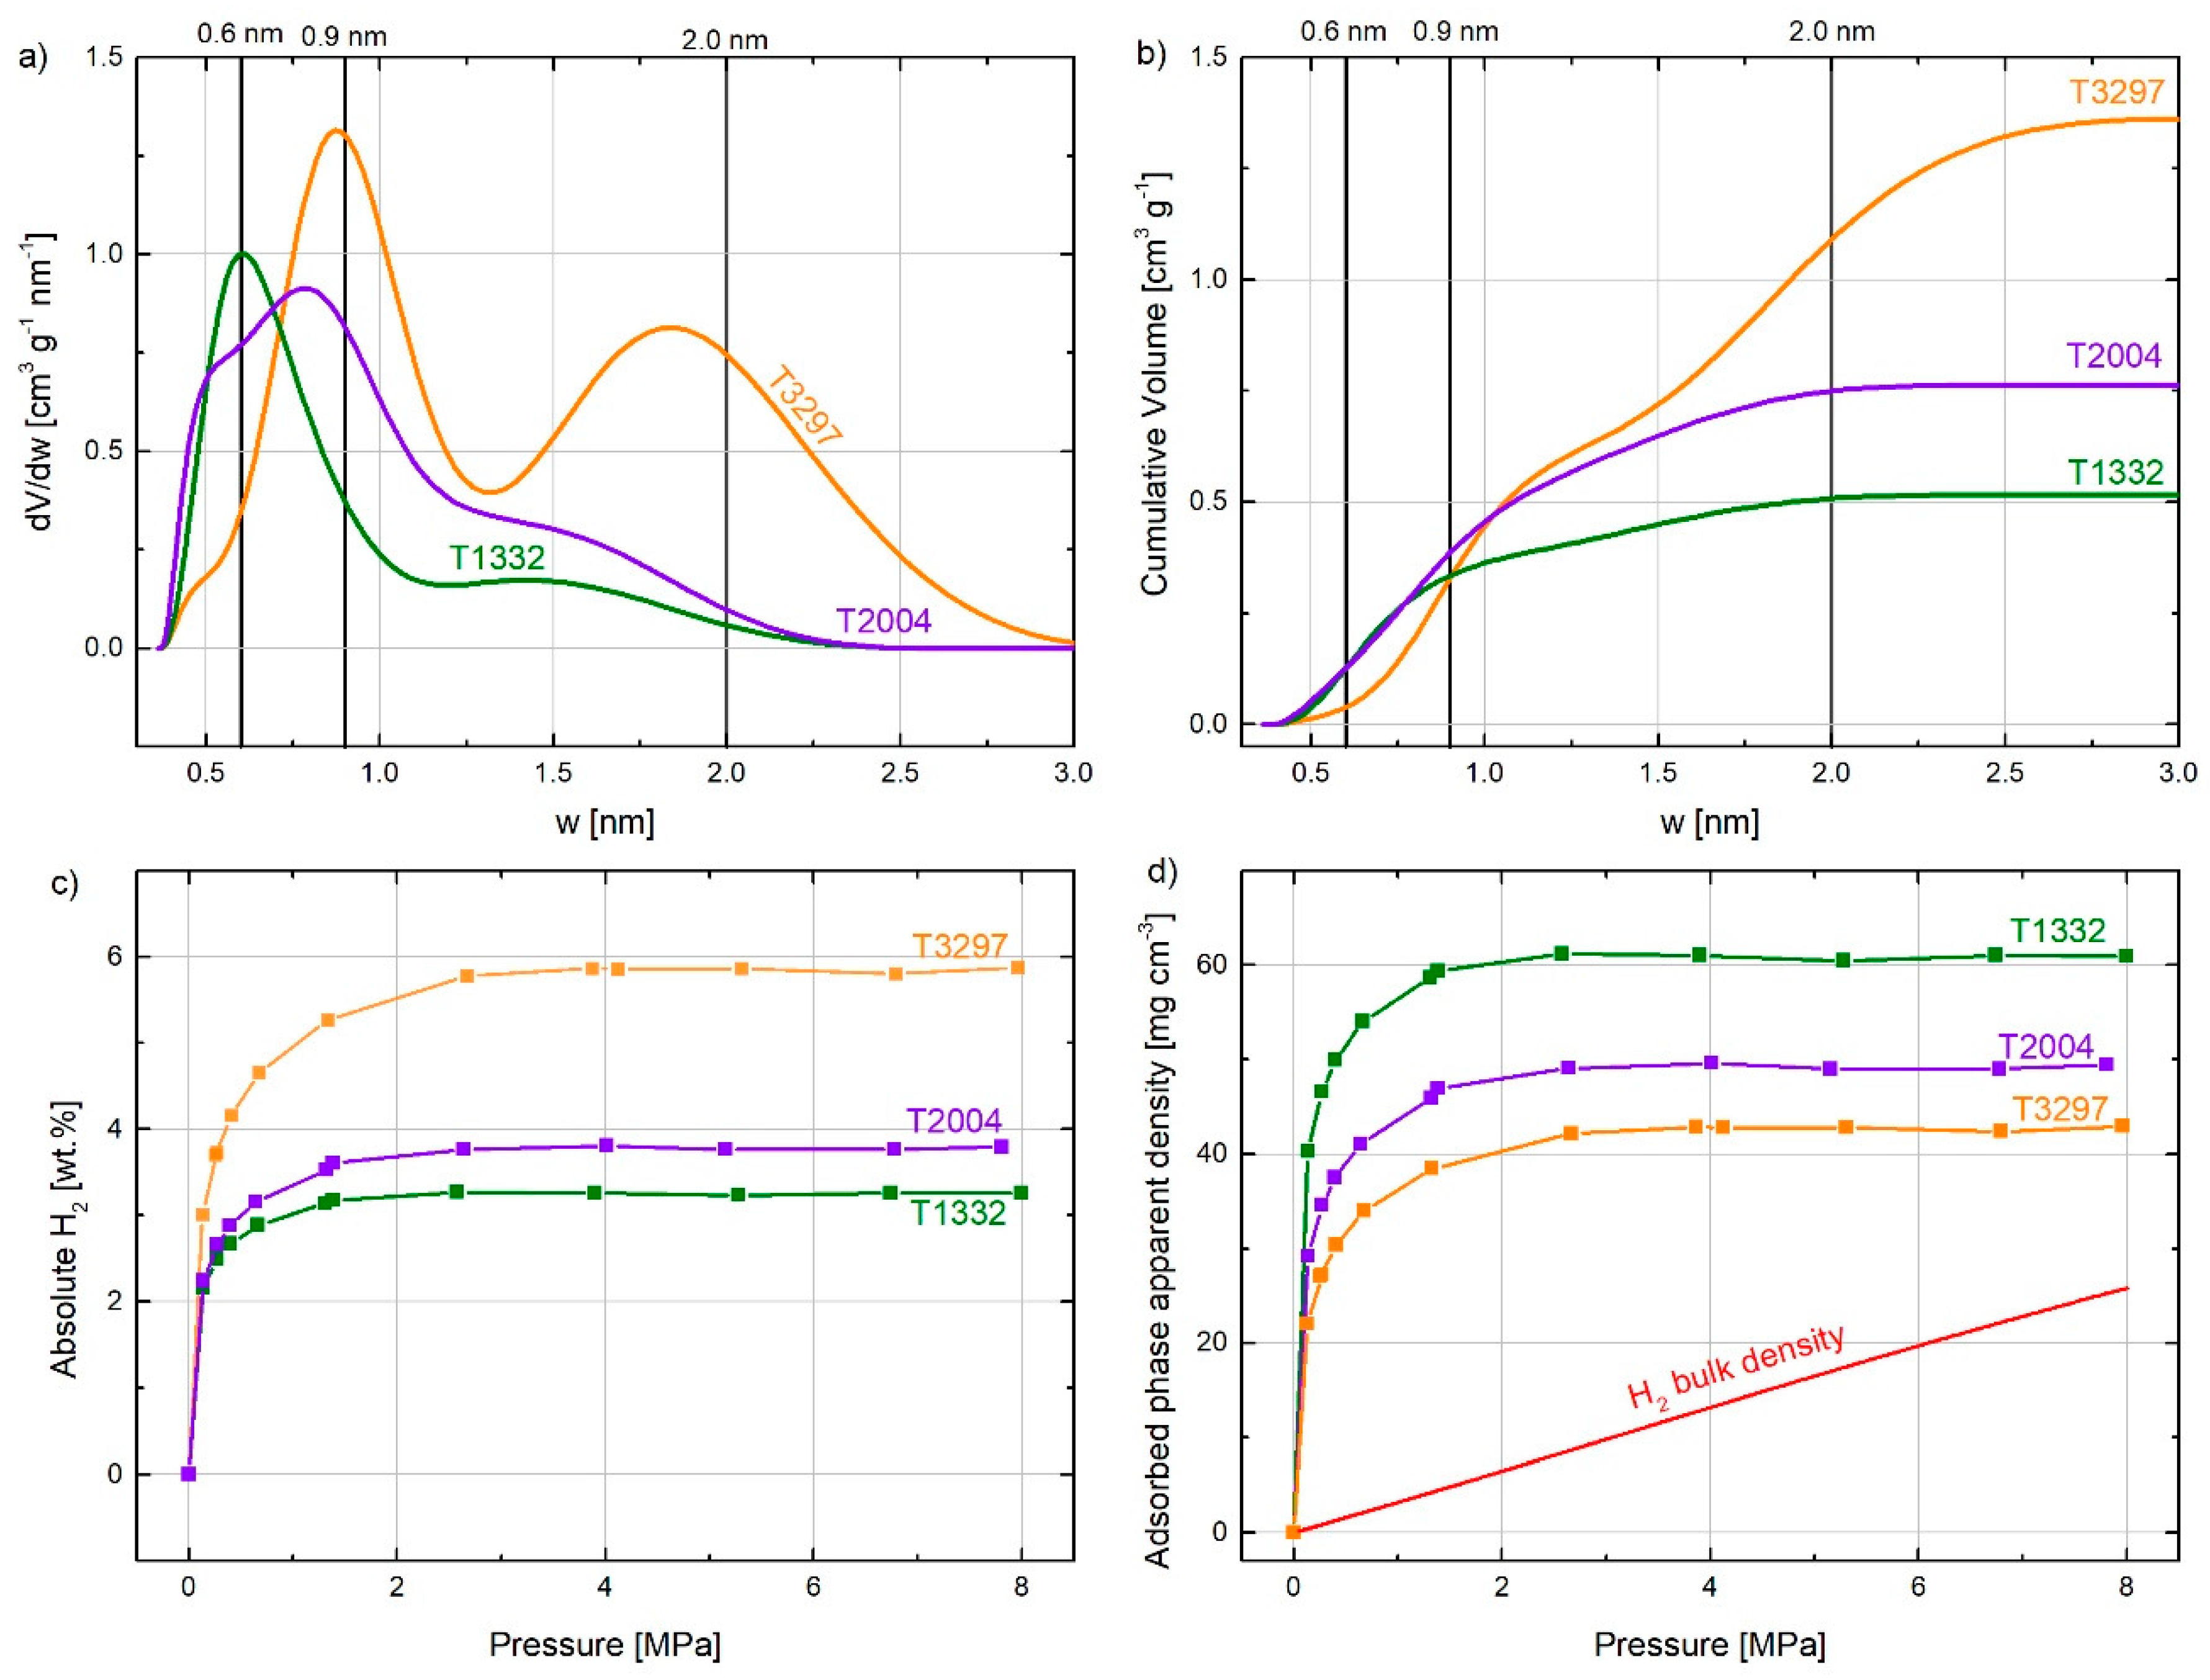
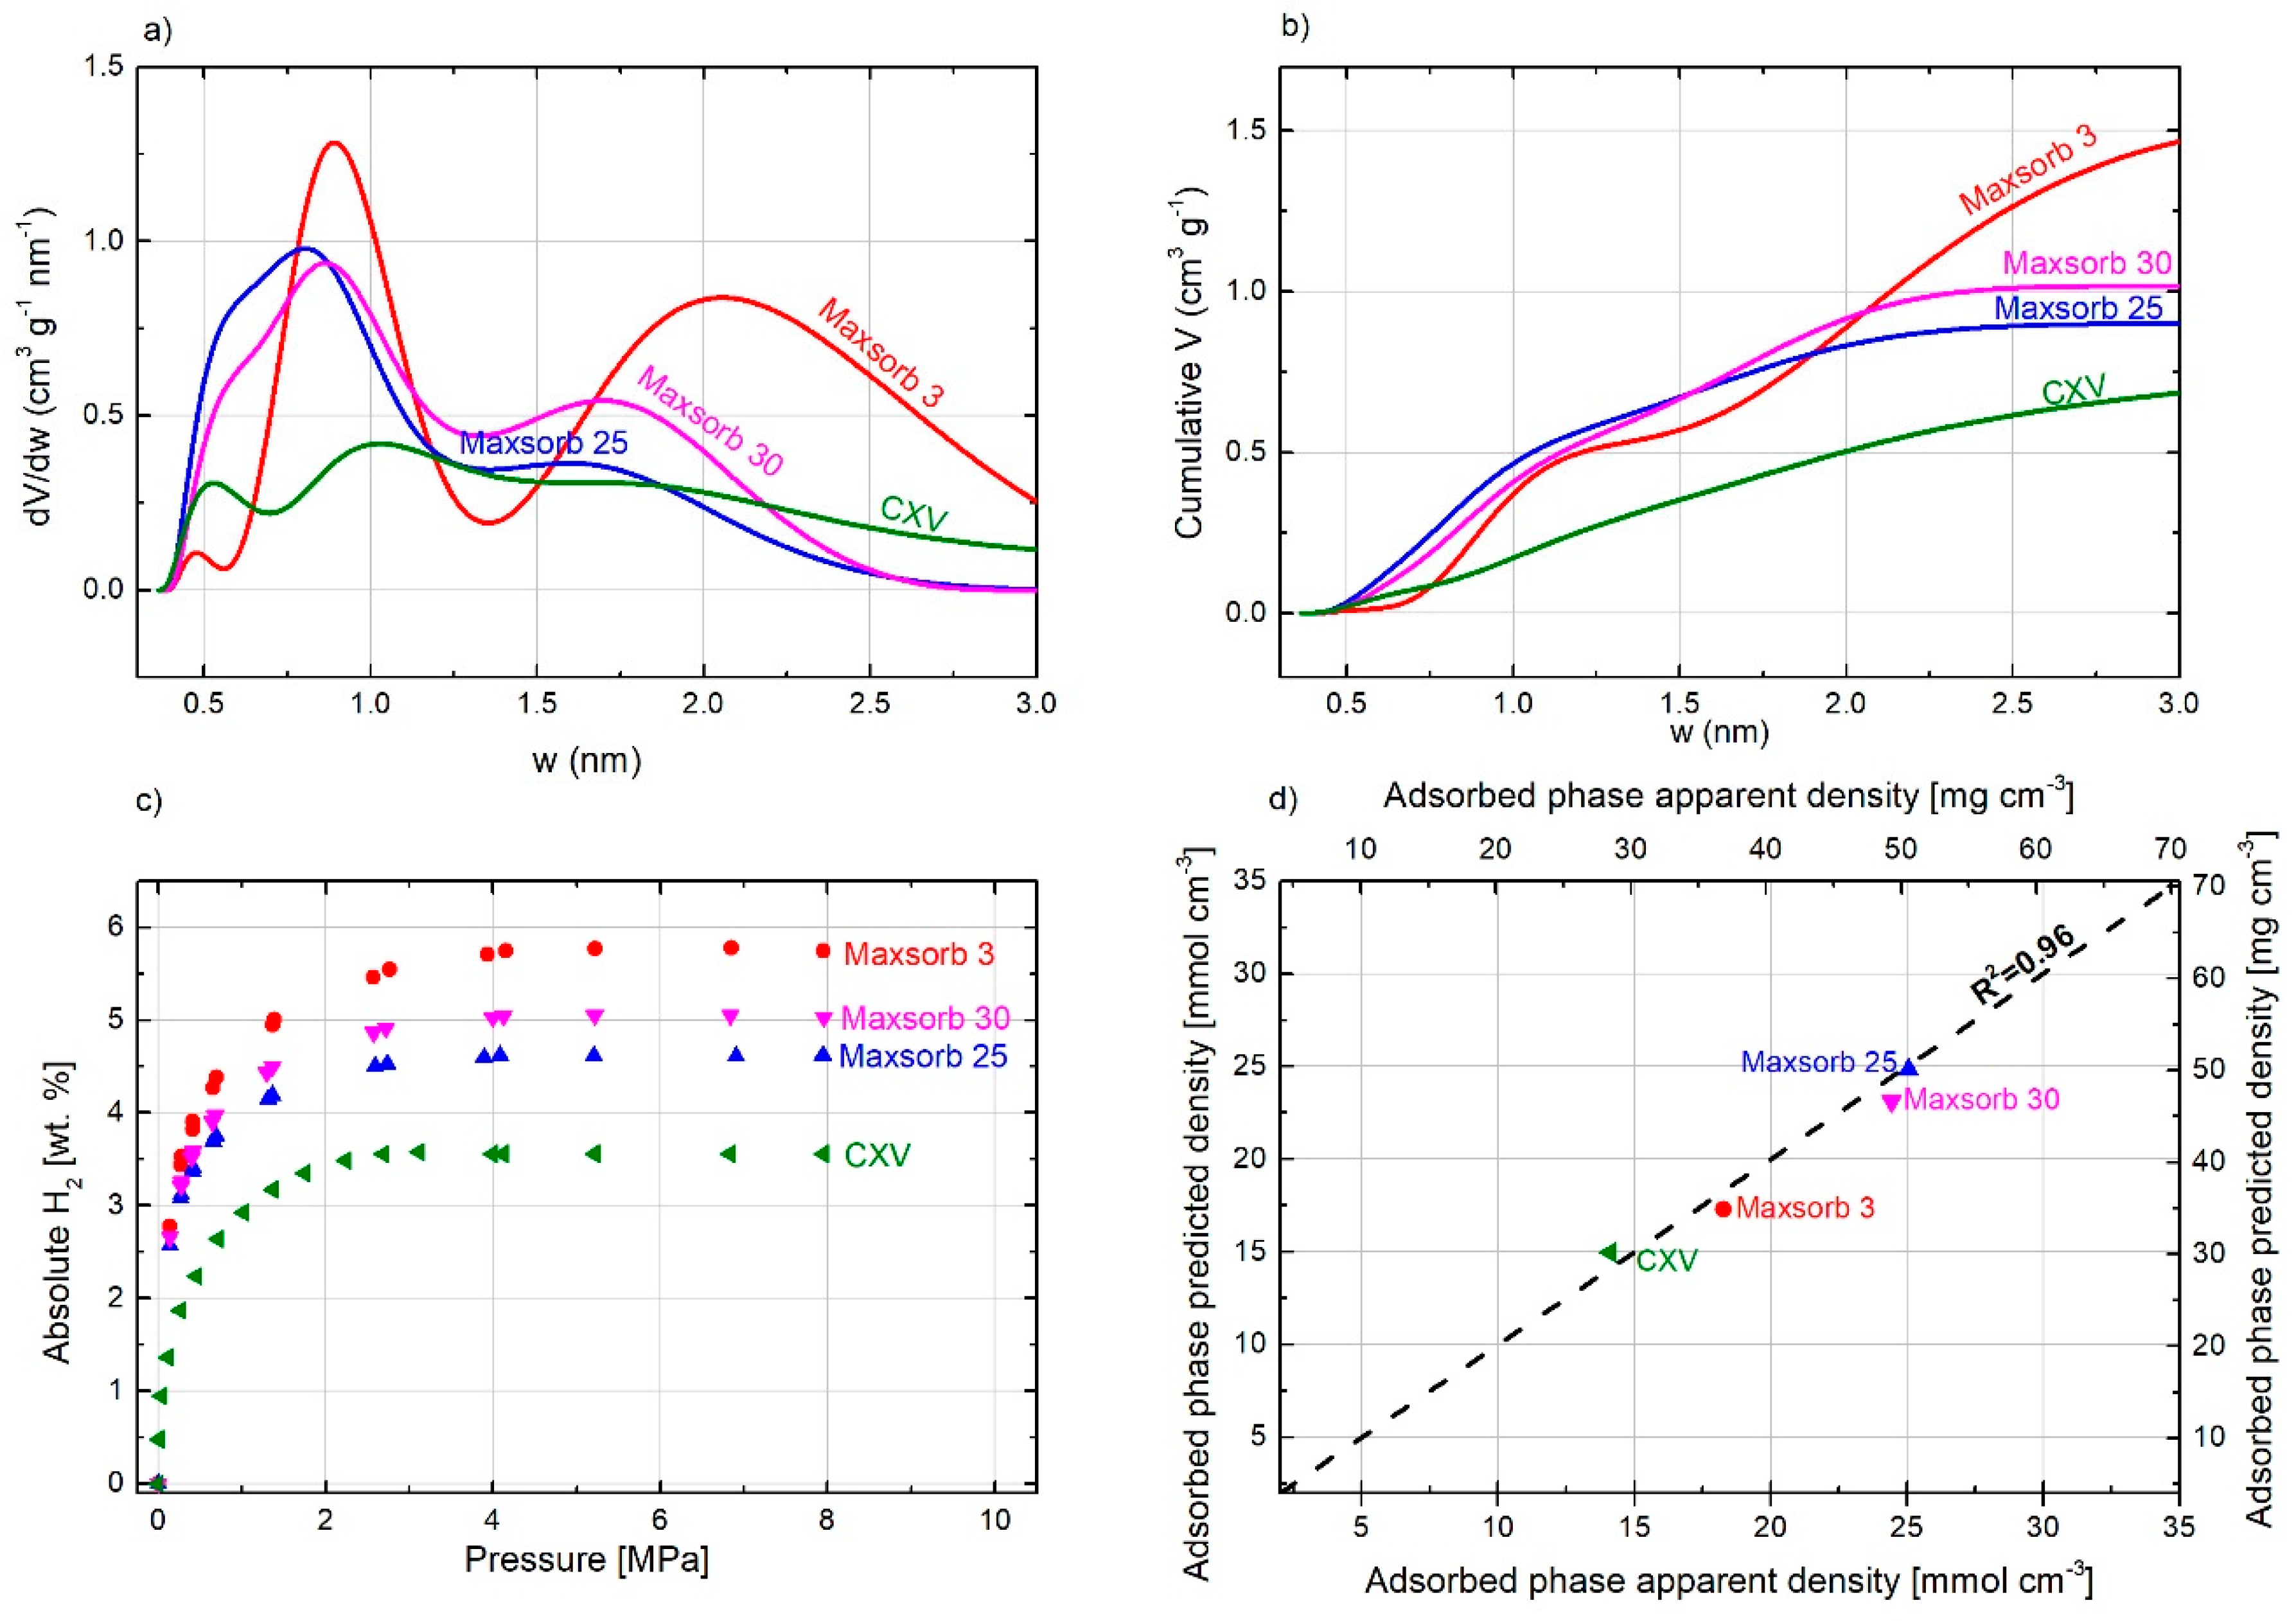
The open literature on hydrogen adsorption reports a significant number of carbon materials with similar ABET values but very different H2 uptakes [5,44,47,48,49,50,51] at 77 K and at pressures lower than 3 MPa. This could be explained by their very different PSD, which is unfortunately not often taken into account. Figure 4a,b, respectively, show the PSD and cumulative pore volumes as a function of pore width for three ACs having very different values of ABET, i.e., 1332, 2004, and 3297 m2 g−1 (labeled T1332, T2004, and T3297, respectively). This figure also shows that an increase in ABET is accompanied by pore widening if ACs are synthesized by KOH or NaOH activation. T3297 therefore has higher volume and fraction of wider pores and, on the contrary, the pore volume corresponding to pores narrower than 0.9 is smaller because these pores merged into wider pores. Figure 4c shows absolute H2 adsorption isotherms for these three ACs. At low pressure (around 0.3 MPa), the ACs show similar uptake but, at higher pressure, the H2 uptake is correlated to the total pore volume. This figure also shows that ACs with a higher fraction of narrow pores reach the maximum uptake at lower pressures than those having a greater contribution of wider pores. Based on the H2 uptake at each pressure and the total pore volume of each carbon, it is possible to plot the evolution of the average density of the adsorbed hydrogen with pressure (see Figure 4d). This graph shows that the carbon material with the highest percentage of narrowest pores, below 0.6 nm (T1332), has a higher average density than the one with the largest surface area and wider pores (T3297). T2004, with intermediary PSD between T1332 and T3297, also shows an intermediary average density of the hydrogen adsorbed. For the sake of comparison, the evolution of the H2 bulk density with pressure at 77 K is also shown in the same figure. The average densities of adsorbed hydrogen were around 4.6, 3.8, and 3.2 times that in the bulk phase for the T1332, T2004, and T3297, respectively, at 4 MPa.
A useful empirical approach to understand the effect of the PSD on the absolute H2 uptake is to use a polynomial expression where the hydrogen stored in each range of considered pore diameters [47,52] reads as follows:
where H2 [wt.%] is the absolute H2 adsorbed at each pressure; ai (wt.% g cm−3) and Vi (cm3 g−1) are the adsorbed density factor (ADF) and the pore volume of each range of pore diameter, respectively; and n is the number of pore size ranges. The ADF for each pore class was obtained by mathematical optimization using the sum of the quadratic error as an objective function and downhill Simplex [53] as the optimization method.
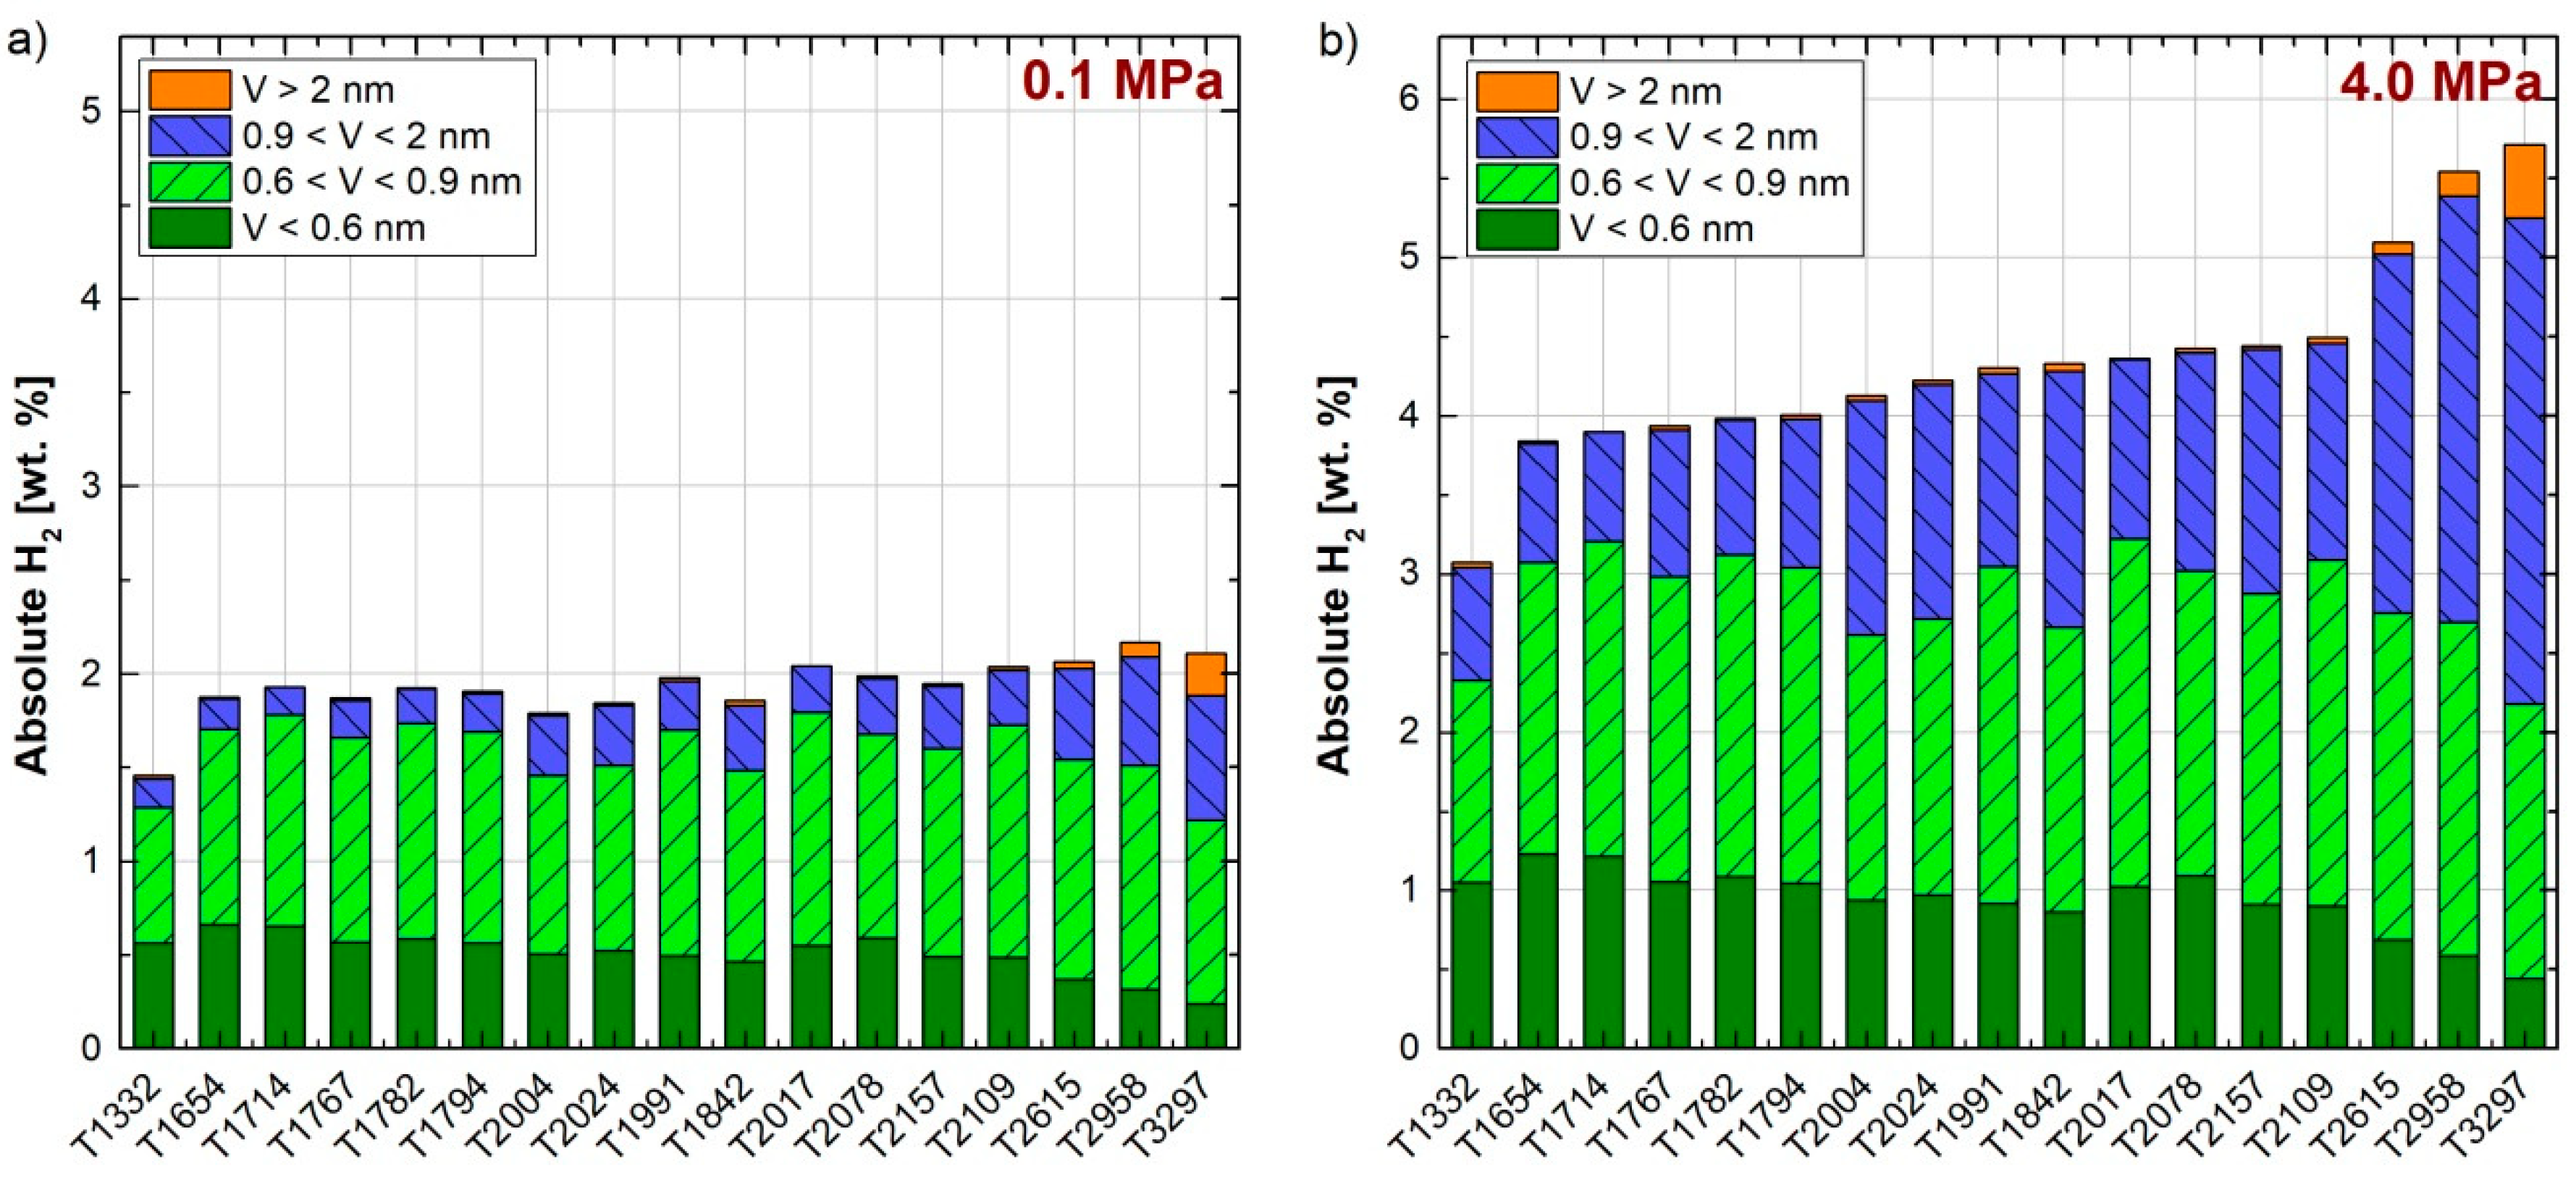
Equation (1) was applied to four ranges of pore width: narrower than 0.6 nm; between 0.6 and 0.9 nm; between 0.9 and 2 nm; and wider than 2 nm. The first range was based on the kinetic diameter of the hydrogen molecule, 0.296 nm [23], thus 0.6 nm is approximately the pore width to accommodate two layers of adsorbed H2, one on each wall. The second range of pore sizes, 0.6–0.9 nm, was considered to accommodate three layers of hydrogen molecules between the pore walls. The pore size range of 0.9–2 nm was considered to complete the micropore range. The fourth pore range corresponds to the pores wider than 2 nm, i.e., mesopores, which also present in high-surface activated carbons. Figure 5a,b shows the absolute hydrogen adsorption at 77 K and 0.1 MPa and 7 MPa, respectively, on each of the 17 lab-made ACs [5], and the contribution of each of the four pore size ranges. From these figures, it can be concluded that the contribution of the narrow pores to the total hydrogen storage capacity is more relevant at low pressure, in good agreement with Figure 4c. By increasing the storage pressure, the absolute hydrogen adsorbed increases and wider pores are necessary to reach such a high storage capacity. Although the optimal pore width for hydrogen storage should approximately be 0.6 nm [45,46,54,55,56,57] and the maximum density in these pores is reached at 1 MPa, it is not possible to obtain high surface ACs with unimodal PSDs. Therefore, pores wider than 0.6 nm and pressures higher that 3 MPa are essential to reach high hydrogen storage capacities at 77 K.
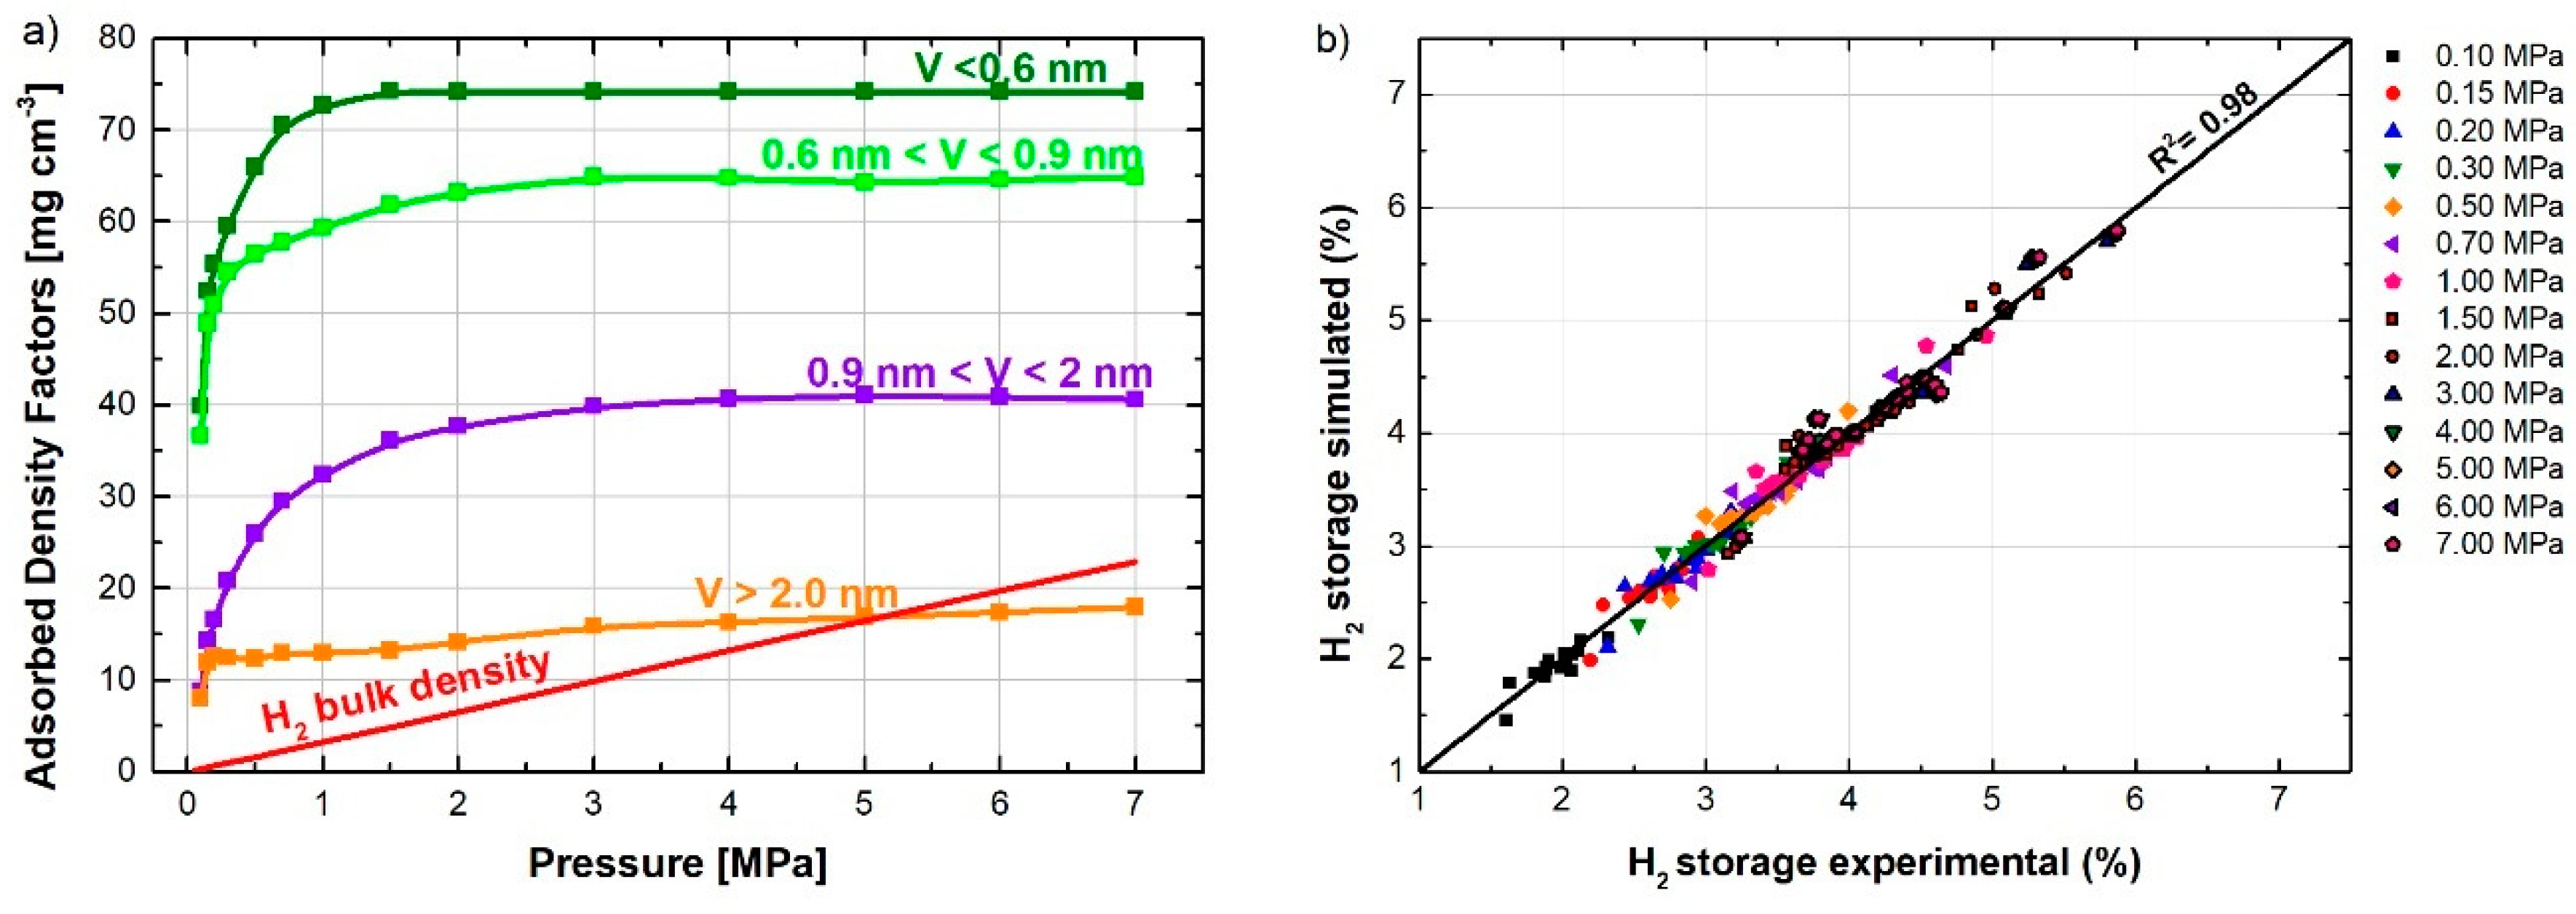
To understand better the effect of the different ranges of pore sizes at different pressures, Equation (1) was fitted to the hydrogen adsorption data at 14 pressures between 0.1 and 4.0 MPa. For this purpose, experimental hydrogen adsorption data were fitted for the 17 ACs at the same pressure using splines. Figure 6a shows the dependence of the ADF (defined in Equation (1)) on the pressure. The ADF for the narrowest pores (<0.6 nm) reached the maximum value at around 1 MPa and the pressure at which the ADF gets the maximum value increased with the pore width, i.e., 3 MPa for 0.6–0.9 nm, 4 MPa for 0.9–2 nm, and 6 MPa for 2–50 nm. In addition, the value of the ADF for the widest range of pores was much smaller (around ¼) those of the two narrowest classes. H2 adsorbed on micropores narrower than 0.6 nm had an ADF almost six times greater than the H2 density in the bulk phase at 4 MPa, while the ADF for pores wider than 2 nm was very similar to the H2 density in the bulk phase at 4 MPa.
Figure 6b shows the good fit of Equation (1) to the experimental H2 isotherms for each pressure considered. In addition, the global determination coefficient, considering all the pressures, was 0.98. The ADF values obtained at 1 atm were 40, 37, 9, and 8 mg cm−3 for the four ranges of pore width <0.6, 0.6–0.9, 0.9–2, and 2–50 nm, respectively. These ADFs are close to the average values, i.e., 58, 38, 13, and 8 mg cm−3, respectively, estimated from hydrogen densities calculated for selected pore widths [23].
To demonstrate the soundness of the ADF approach, we used four commercial carbon materials, whose PSDs and hydrogen storage capacities were reported elsewhere [47]. These materials were not used to perform the initial fitting of the ADFs. Using their PSDs (see Figure 7a) and the ADFs (Figure 6a), the predicted adsorbed phase density was calculated at 7 MPa for each of them. The experimental average adsorbed phase density was calculated by dividing the hydrogen uptake at 7 MPa (Figure 7c) by the total pore volume (Figure 7b). Figure 7d shows the good agreement between the values of the predicted and experimental adsorbed phase densities, the determination factor was 0.96. Therefore, we clearly demonstrated that the estimation of the maximum hydrogen storage capacity of a carbon material can be estimated provided that a correct textural characterization is available.
Figure 8a shows the pressure required for each range of pore size to reach 95% of the maximum adsorption density. It can be observed that the latter is reached with the narrowest pores at only 0.6 MPa, while pores wider than 2.0 nm require 5.4 MPa to reach 95% of this maximum adsorption density.
To represent better the effect of the PSD on hydrogen adsorption, Equation (1) was applied to a hypothetical material with a total pore volume of 1.0 cm3 g−1. The theoretical absolute adsorptions of hydrogen on ACs with different PSD were calculated for a pressure of 4 MPa and are presented in Figure 8b. The results show that a carbon material composed mainly of pores narrower than 0.9 nm can have a hydrogen adsorption capacity of more than 6 wt.%. On the other hand, a material composed exclusively of mesopores will have a capacity of less than 2 wt.% for the same total pore volume.
Obviously, the most economical solution would be to have the theoretical maximum surface area for carbon, 2630 m2 g−1 [58], with only pores narrower than 0.9 nm because the pressure required for maximum storage would be lower than 1.5 MPa. However, we have seen that carbons having the highest fraction of pores of width less than 0.9 nm also have a low surface area.
In the next section, we review the hydrogen uptakes obtained in different carbon materials. In most published works, the textural characterization is limited to ABET. Sometimes, the micropore and total pore volumes are given too, but details on the PSD are scarce. For this reason, although we have clearly indicated the limitations of the BET method, ABET remains a useful parameter for comparison purposes, so we have plotted the excess hydrogen uptake as a function of ABET. The experiments were done using a volumetric equipment so that the excess hydrogen adsorption is given below. More information on total, absolute, and excess hydrogen uptakes is given elsewhere [59].
3. Carbon-Based Materials for Hydrogen Storage
3.1. Graphene-Derived Carbons: Carbon Nanotubes and Nanofibers
The storage of hydrogen in carbon materials received particular attention after the study published in 1998 by Chambers et al. [60]. These authors measured the hydrogen uptake for different carbon nanofibers (CNFs), i.e., fibrous carbon materials consisting of graphitized filaments with graphitic layers that can be arranged in several ways, forming complex structures. They published the highest value of hydrogen uptake ever reported in the open literature, i.e., 67.5 wt.% at 298 K and 11.3 MPa, when using CNFs with a herringbone configuration, whose carbon filaments form angles of 45° with the graphitic sheets. At the same temperature and pressure, the authors obtained an uptake of 53.68 wt.% with a platelet configuration (graphitic sheets perpendicular to the carbon filaments) and 11.26 wt.% with a tubular configuration (graphitic sheets concentric to the filament). These values were obtained using the temperature-programmed desorption (TPD) method. Many researchers around the world were unable to confirm the aforementioned values. Rzepka et al. [61] repeated the same investigation on re-prepared samples precisely following the original specifications. Nevertheless, they obtained a maximum uptake of 0.4 wt.% using both the volumetric and gravimetric approaches for the measurements.
Chemical vapor deposition (CVD) is the most commonly used method today to produce large amount of CNFs. Furthermore, several kinds of CNFs can be produced by CVD using different types of carbon precursors. The surface area and the pore volume of the CNFs thus produced can be improved by chemical activation using NaOH and KOH. Jaybhaye et al. [62] obtained excess uptakes equal to 0.51, 0.42, and 0.65 wt.% at 298 K and 1 MPa, when using acetylene, ethanol, and cotton fibers, respectively, as carbon precursors followed by chemical activation with KOH. Decoration with Ni nanoparticles was found to be a good solution for increasing the hydrogen uptake at room temperature. Indeed, Kim et al. [63,64] obtained total hydrogen uptakes higher than 2 wt.% at 298 K and 10 MPa using physically activated, Ni-decorated, graphite nanofibers. This material had a relatively low ABET of about 200–300 m2 g−1 compared to other carbon materials. Thus, these high storage values can be explained by the spillover phenomenon that occurs at room temperature, i.e., the dissociative chemisorption of molecular hydrogen on metal nanoparticles followed by migration and diffusion of atomic hydrogen over the carbon surface [65,66].
Similar to CNFs, carbon nanotubes (CNTs) are also considered a possible source of solid-state reversible hydrogen storage medium due to their high surface area, developed nanoporous texture, tunable properties, cage-like structure, chemical stability, and easy synthesis methods [67]. Compared to CNFs, CNTs have a simpler graphite-like structure, consisting of one or multiple graphene sheets rolled up to form filaments having a cylindrical shape. Depending on the number of layers, CNTs can be divided into single-walled carbon nanotubes (SWCNTs) or multi-walled carbon nanotubes (MWCNTs), the latter consisting in several graphitic filaments concentric to the same axis. Several SWCNTs can also be arranged in bundles. The length of CNTs is on the order of microns, whereas the inner diameter is thousands of times smaller [68]. Dillon et al. [69] first reported the highest hydrogen uptake of SWCNTs, reaching 5–10 wt.% at 273 K and 0.04 MPa. Chen et al. [70] obtained even higher values with alkali-doped CNTs. A hydrogen uptake of 20 wt.% was obtained with Li-MWCNTs in the temperature range 473–673 K and 0.1 MPa, whereas 14 wt.% was obtained with K-MWCNTs for temperatures lower than 313 K and 0.1 MPa. The aforementioned results were obtained using the temperature-programmed desorption method. However, a further study of Yang [71] revisited the aforementioned results, attributing them to the weight gain resulting from the reaction between the moisture contained in the hydrogen flow used in the experiments and the alkali species on the carbon surface. Under dry conditions, a hydrogen uptake of 2 wt.% was found instead on the same CNTs and under the same conditions, using a thermo-gravimetric analysis.
Contradictory values of hydrogen uptake in CNTs have been reported in the literature in recent years. Indeed, several studies have focused in particular on numerical simulations based on the GCMC method and the DFT, in order to evaluate the amount of hydrogen stored on CNTs with regard to geometric considerations. Among them, particular attention was paid to tube diameter, tube arrangement, inter-tube spacing of SWCNTs bundles, wall-to-wall distance of MWCNTs, and wall number. Hydrogen adsorption occurs on both the inner and outer surfaces of CNTs. Furthermore, a large contribution is given by the amount adsorbed in the interstitial space between different single tubes. Minami et al. [72] calculated a hydrogen uptake of 6 wt.% at 77 K and 1 MPa for bundles of CNTs forming a triangular lattice with an average inter-axis distance of 2.159 nm and an average diameter of 1.227 nm. Saito et al. [73] found that the ideal interlayer spacing between concentric tubes in a MWCNT structure is 0.34 nm. Ghosh et al. [74] found that hydrogen adsorption takes place especially in the interstitial spaces of CNTs bundles due to the deformation of the nanotubes caused by the presence of defects. From their molecular dynamic simulations, the same authors also obtained that the hydrogen storage capacity of CNTs bundles packed in a square array is higher than that obtained with a triangular configuration. Wen et al. [75] calculated a hydrogen uptake as high as 10.4 wt.% in a triplet form of (5,0) CNTs due to both chemisorption and physisorption.
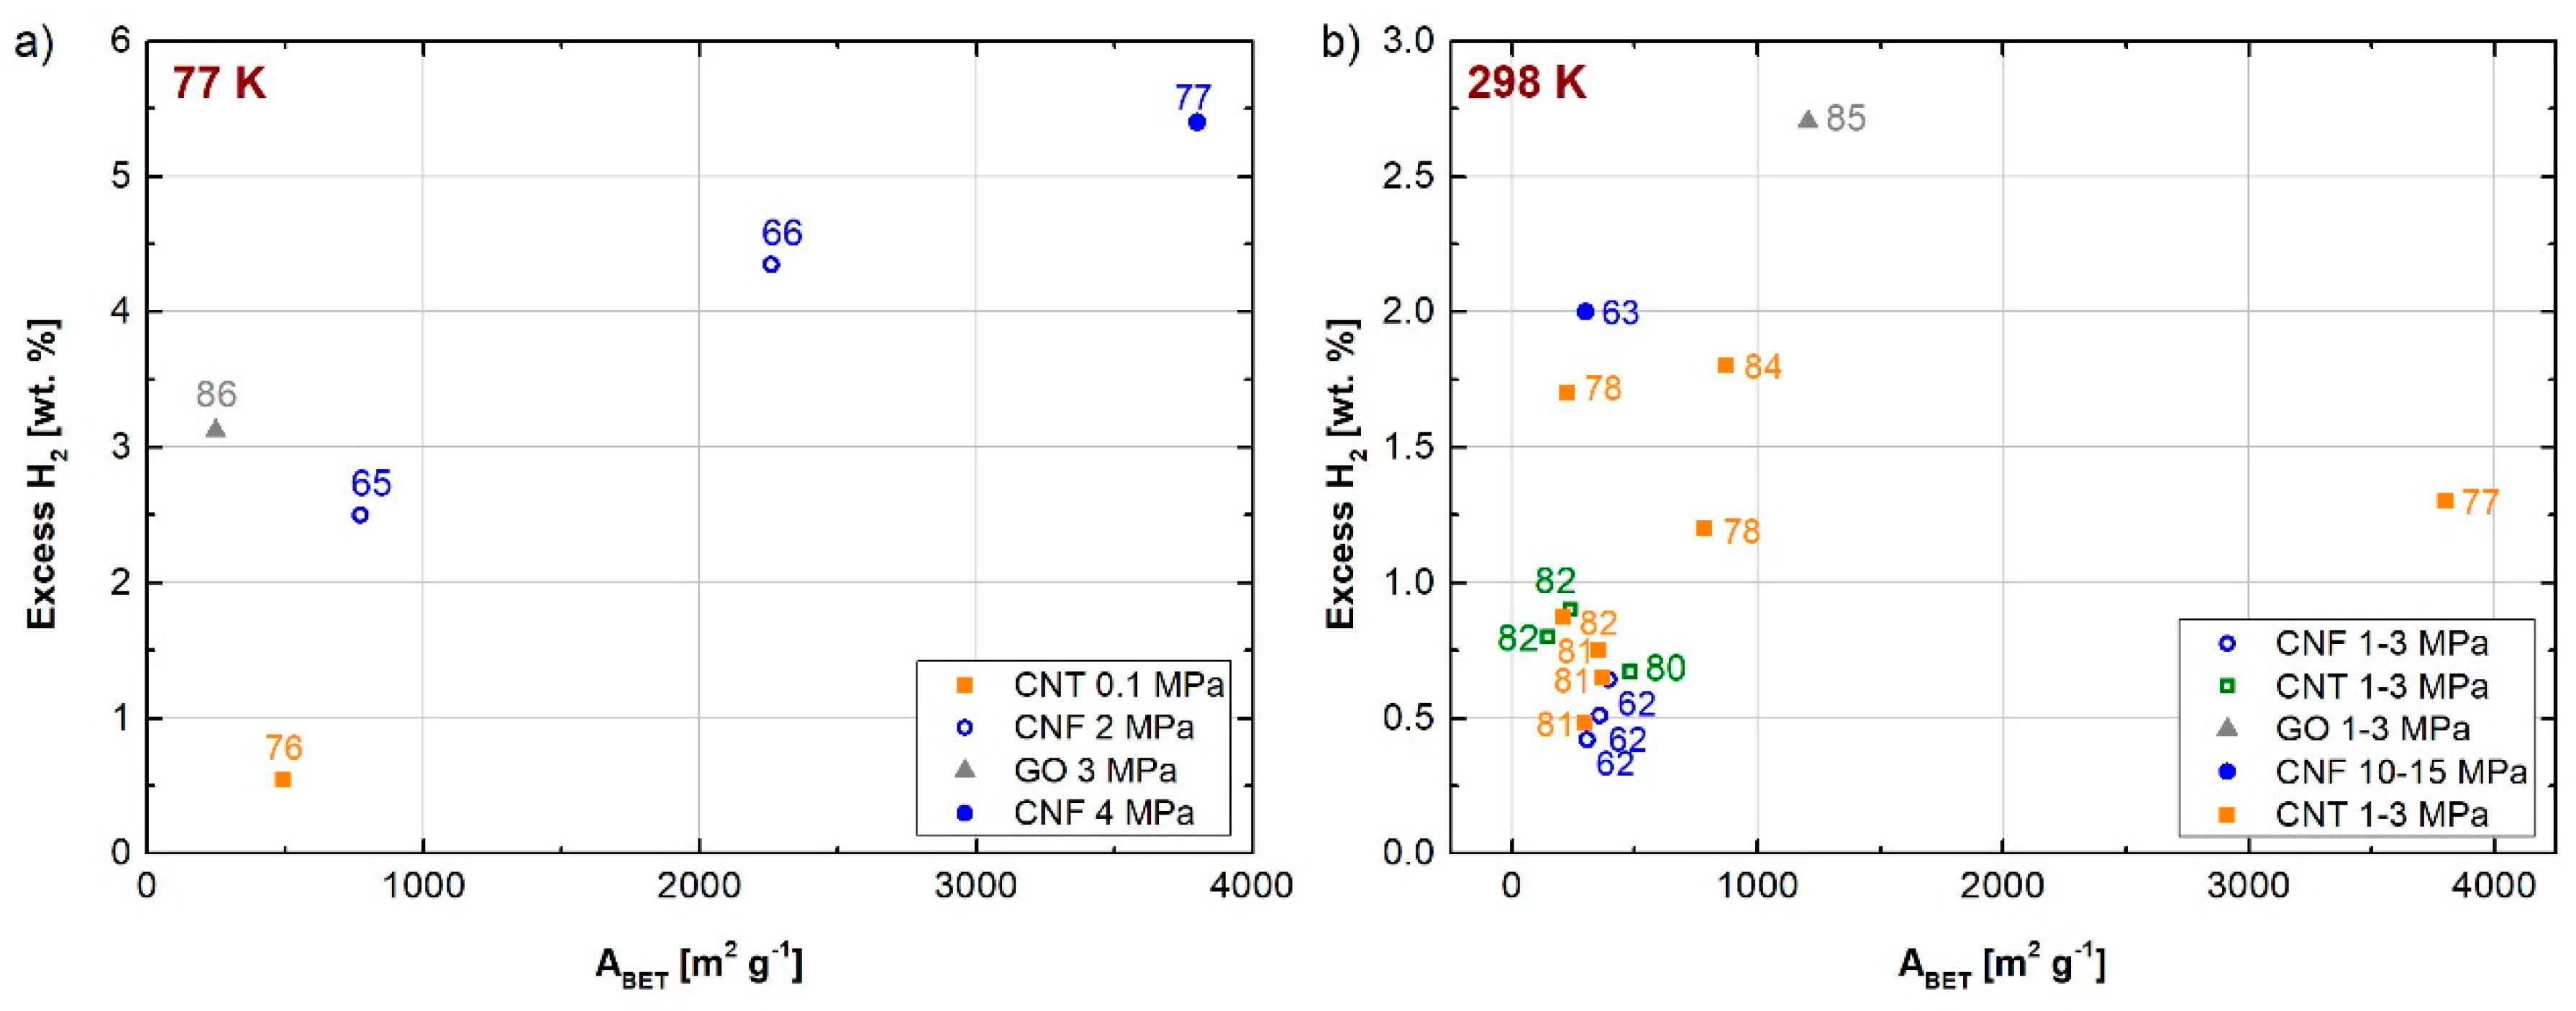
As a rule of thumb, the hydrogen uptake in CNTs, as well as in any carbon material, is proportional to the surface area, especially at cryogenic temperatures. Therefore, chemical activation was found to be an effective method to increase both the surface area and the pore volume of CNTs. Lee et al. [76] proved that heat treatment and chemical activation are beneficial for the hydrogen storage capacity. Indeed, they obtained the highest excess uptake, i.e., 0.54 wt.%, at 77 K and 0.1 MPa, with MWCNTs chemically activated at 1173 K, i.e., three times the value obtained for the pristine MWCNTs under the same conditions (0.18 wt.%). This enhancement was due to both the increase in ABET, from 327 to 495 m2 g−1, and to the narrower microporosity. Adeniran et al. [77] obtained a maximum of excess uptake, around 6 wt.% at 77 K and 4 MPa, using CNTs prepared from carbon tetrachloride as a carbon source and ferrocene/Ni as a substrate/catalyst. Activation by KOH allowed obtaining highly porous CNT structures with ABET of 1479–3802 m2 g−1 and pore volumes of 0.83–2.98 cm3 g−1. The same authors obtained an excess uptake of 1.3 wt.% at 298 K and 15 MPa for the same sample, which is one of the highest reported for any porous carbon material under those conditions. The total hydrogen uptake stored at room temperature reached an impressive 4.43 wt.% at 15 MPa, which is also a new record for carbon materials.
In addition to the aforementioned, abnormally high results, the hydrogen adsorption capacity of CNTs barely exceeds 1 wt.% at room temperature [67,78]. Indeed, the hydrogen uptake does not depend on the textural properties of CNTs as for temperatures close to 77 K. Thus, decorating CNTs with metal nanoparticles was found to be a good way of improving the hydrogen uptake due to the spillover phenomenon [79]. The most frequent doping with metal nanoparticles is based on Pd, Mg, Ni, Ti, Li, and Al [78] using different types of methods including impregnation, reduction in situ or sputtering [67]. In this sense, an essential requirement during the functionalization of CNTs is to prevent the obstruction of the available pores, which would decrease the surface area. Elyassi et al. [80] showed a drastic reduction in the ABET of the investigated MWCNTs after a functionalization process with H2SO4 and HNO3, from 481 to 23 m2 g−1, due to pore blocking. Lee et al. [81] showed that the ABET of Ni-decorated CNTs decreased from 370 to 300 m2 g−1 by increasing the Ni content from 1.2 wt.% to 4.1 wt.%. Nevertheless, they measured excess uptakes of 0.65, 0.75, and 0.5 wt.% for Ni contents of 1.2, 2.2, and 4.1 wt.%, respectively, at 298 K and 10 MPa. Thus, an optimum metal loading exists with respect to the hydrogen uptake. To facilitate efficient hydrogen uptake by the spillover mechanism, metallic nanoparticles need to be exposed to hydrogen molecules. This is only possible when these nanoparticles are on the external wall surface of MWCNTs. This feature was proved by the study of Rather et al. [82], who compared the hydrogen uptake obtained with MWCNTs produced from different functionalization methods, such as ball milling or sputtering. The authors obtained a higher excess uptake, i.e., 2 wt.% at room temperature and 1.6 MPa, with MWCNTs decorated with Ti nanoparticles by the sputtering method, compared to that obtained with MWCNTs decorated by ball milling. Sharma [83] proposed an efficient chemical process using hexachloroplatinic acid (H2PtCl6∙6H2O) as a precursors to decorate the surface of MWCNTs with Pt nanoparticles. Nevertheless, the Pt-decorated MWCNTs showed a lower thermal stability than the pristine MWCNTs, suggesting that Pt nanoparticles have a catalytic effect on carbon decomposition. Moreover, an excess uptake of only 0.014 wt.% was obtained at 298 K and 0.25 MPa. An alternative to metal nanoparticles for doping carbon materials can be with heteroatoms such as N, P, Si, and B [78]. Ariharan et al. [84] synthesized N-doped CNTs from polymeric precursors, such as polystyrene and polypyrrole, by poly-condensation followed by carbonization under an inert atmosphere. They obtained an excess uptake of hydrogen of 1.8 wt.% at 298 K and 10 MPa when carbonizing the CNTs thus produced at 1173 K, which allowed reaching an ABET of 870 m2 g−1.
Thermal exfoliation of graphene oxide (GO) was found to be an efficient method for producing graphene with high surface area and pore volume, thus enabling promising hydrogen uptakes. Indeed, exfoliation allows creating a distance between graphene layers such that efficient pathways for hydrogen diffusion between the graphene layers can be obtained, thus increasing the hydrogen uptake. Yuan et al. [85] obtained an absolute uptake of 2.7 wt.% at 298 K and 2.5 MPa, with a graphene-based adsorbent having an ABET of 1206 m2 g−1. Singh et al. [86] obtained an excess uptake of 3.12 wt.% at 77 K and 3 MPa with exfoliated GO having an ABET of 248 m2 g−1. In this study, the authors investigated the effect of the exfoliation temperature on the structural properties of the graphene layers. They found that the GO exfoliated at 573 K had the highest surface area, while a partial damage of layers was obtained at higher temperatures, such as 773 K.
Figure 9a,b shows the hydrogen uptakes (in excess) at 77 and 298 K, respectively, obtained on CNFs, CNTs, and GOs reported in recent years.
3.2. Activated Carbons
With an exceptionally large surface area, a microporous nature and the possibility of an economic and scalable production, ACs are excellent candidates in efficient hydrogen storage systems [58,87,88,89,90,91,92,93,94,95,96,97,98,99,100,101,102,103]. One of the most important advantages of ACs is that they can be produced from a wide variety of low-cost and renewable raw materials, such as agricultural waste or lignocellulosic materials in general, which is an important advantage compared to other carbon materials [104]. The synthesis of ACs consists in the carbonization of a precursor and the subsequent or simultaneous activation process, which can be either physical [105,106] or chemical [58,100,107,108]. Physical activation is based on the gasification at high temperature of the precursor in a stream of CO2 or H2O, whereas chemical activation consists of heating in air or under inert gas the precursor impregnated with a crosslinker/dehydrating agent (H3PO4) or mixed with an oxidizing agent (NaOH, KOH, etc.). Chemical activation with hydroxides is known to be more favorable than physical activation for producing ACs with a very high surface area and a narrow microporosity [100].
Fierro et al. [58] obtained a maximum excess hydrogen uptake of 6.0 wt.% at 77 K and 4 MPa using ACs prepared by chemical activation of anthracites with alkali hydroxides (NaOH and KOH). The ABET of the as-produced ACs was around 3220 m2 g−1. An absolute uptake, equal to 6.6 wt.% at 77 K and 4 MPa, was achieved by Zhao et al. [92] using ACs produced by chemical activation of bamboo-based precursors having an ABET of 3208 m2 g−1. Blankenship II et al. [99] obtained an excess of hydrogen uptake of 7.0 wt.% at 77 K and 2 MPa, which is one of the highest results ever reported for any carbon material. The AC used was prepared from cellulose acetate, and it had an ABET of around 3800 m2 g−1 and a pore volume of 1.8 cm3 g−1. Romanos et al. [103] obtained a maximum excess uptake of about 5 wt.% at 77 K and 4 MPa with boron-doped ACs, the ABET of which was equal to 3100 m2 g−1. However, the aforementioned results confirm the limits of the BET method: indeed, the maximum possible geometric area for a carbon material is estimated at 2630 m2 g−1 [109]. For this value of ABET, the theoretical upper limit of hydrogen storage on ACs is estimated at 6.8 wt.% [58].
As with any carbon material, the hydrogen storage on ACs at 298 K barely exceeds 1 wt.%. Rowlandson et al. [87] obtained an excess uptake of 1.8 wt.% at 298 K and 0.1 MPa with ACs derived from lignin having an ABET slightly higher than 1000 m2 g−1. Bader et al. [91] achieved an excess uptake of 1.22 wt.% at 298 K and 20 MPa with ACs produced from olive stones. Samantaray et al. [88] prepared ACs from Palmyra sprout by chemical activation. The as-produced ACs exhibited a high ABET of around 2090 m2 g−1 and a pore volume of 1.44 cm3 g−1, which allowed reaching an excess uptake of 1.06 wt.% at 298 K and 1.5 MPa. AC doping with heteroatoms such as nitrogen, or decoration with alkali or transition metals, proved to be an efficient way to enhance the hydrogen uptake at room temperature, due to the spillover phenomenon. Zhao et al. [89] investigated the use of Pt-N-doped ACs for hydrogen storage at both 77 and 298 K. The previous N doping was proved effective for achieving a better Pt dispersion and smaller Pt nanoparticles. The hydrogen uptake at 298 K was found to increase with the Pt loading. Indeed, it increased from 0.30 wt.% (for the pristine AC) to 0.58 wt.% at 4 MPa for a Pt loading of 2.87 wt.%, and it reached the maximum excess uptake of 0.75 wt.% at the highest Pt loading investigated, i.e., 6.73 wt.%. This enhancement was attributed to the spillover phenomenon. However, the hydrogen uptake at 77 K was found to decrease when the Pt loading increased, due to both the decrease of ABET (from 3155 to 2734 m2 g−1) and pore blocking. The same behavior was found by Zhao et al. [101] when decorating the surface of ACs with Pd nanoparticles. Wang et al. [90] obtained excess uptakes of 1.30 and 1.02 wt.% at 298 K and 10 MPa when decorating the surface of ACs with Ru and Ni, respectively. The hydrogen uptakes were higher than that obtained with the non-doped counterpart (0.6 wt.% under the same conditions).
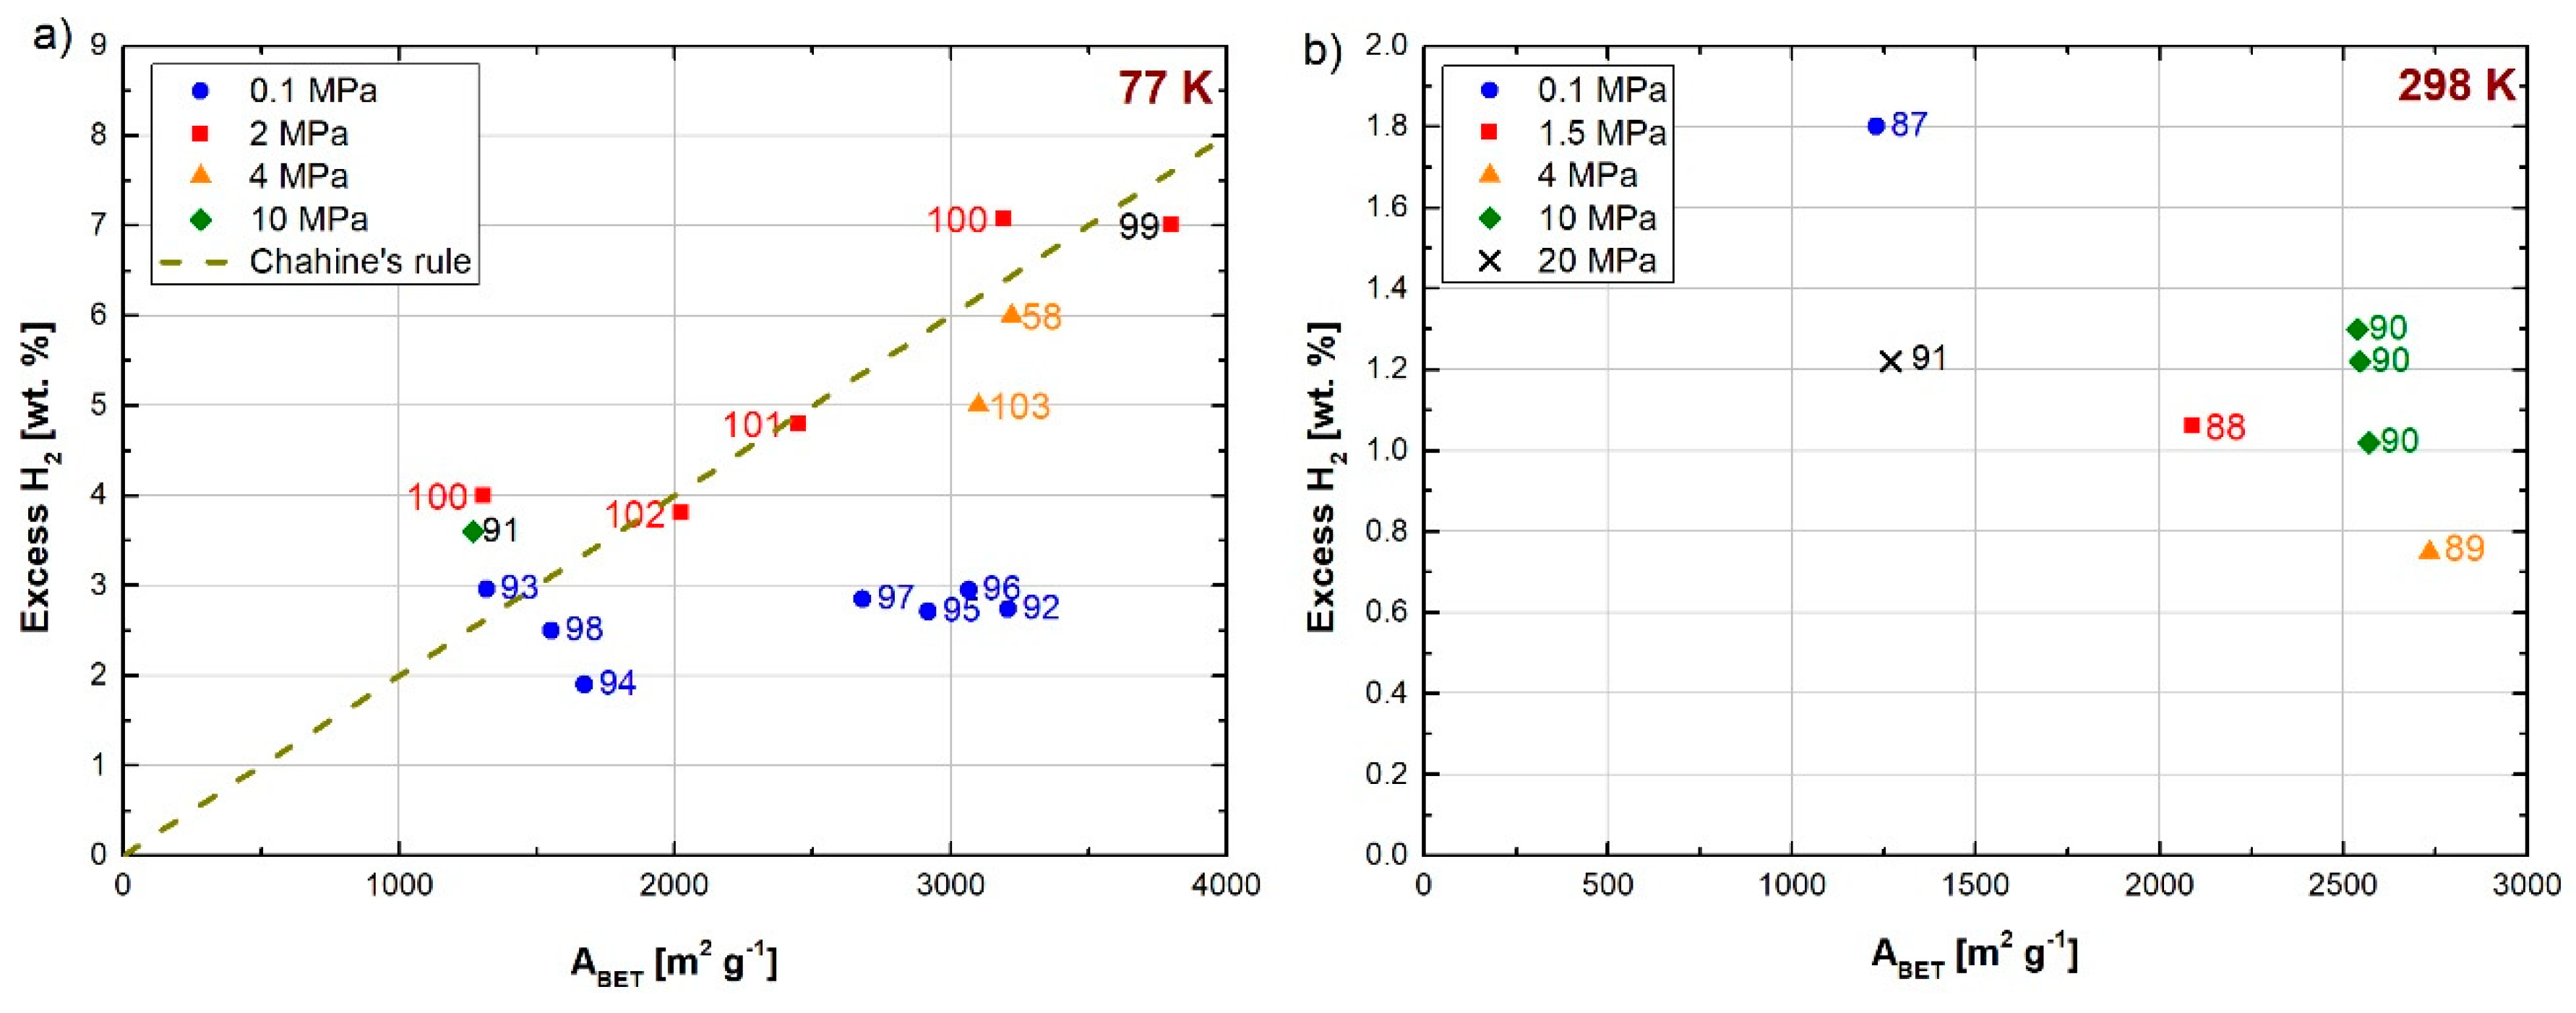
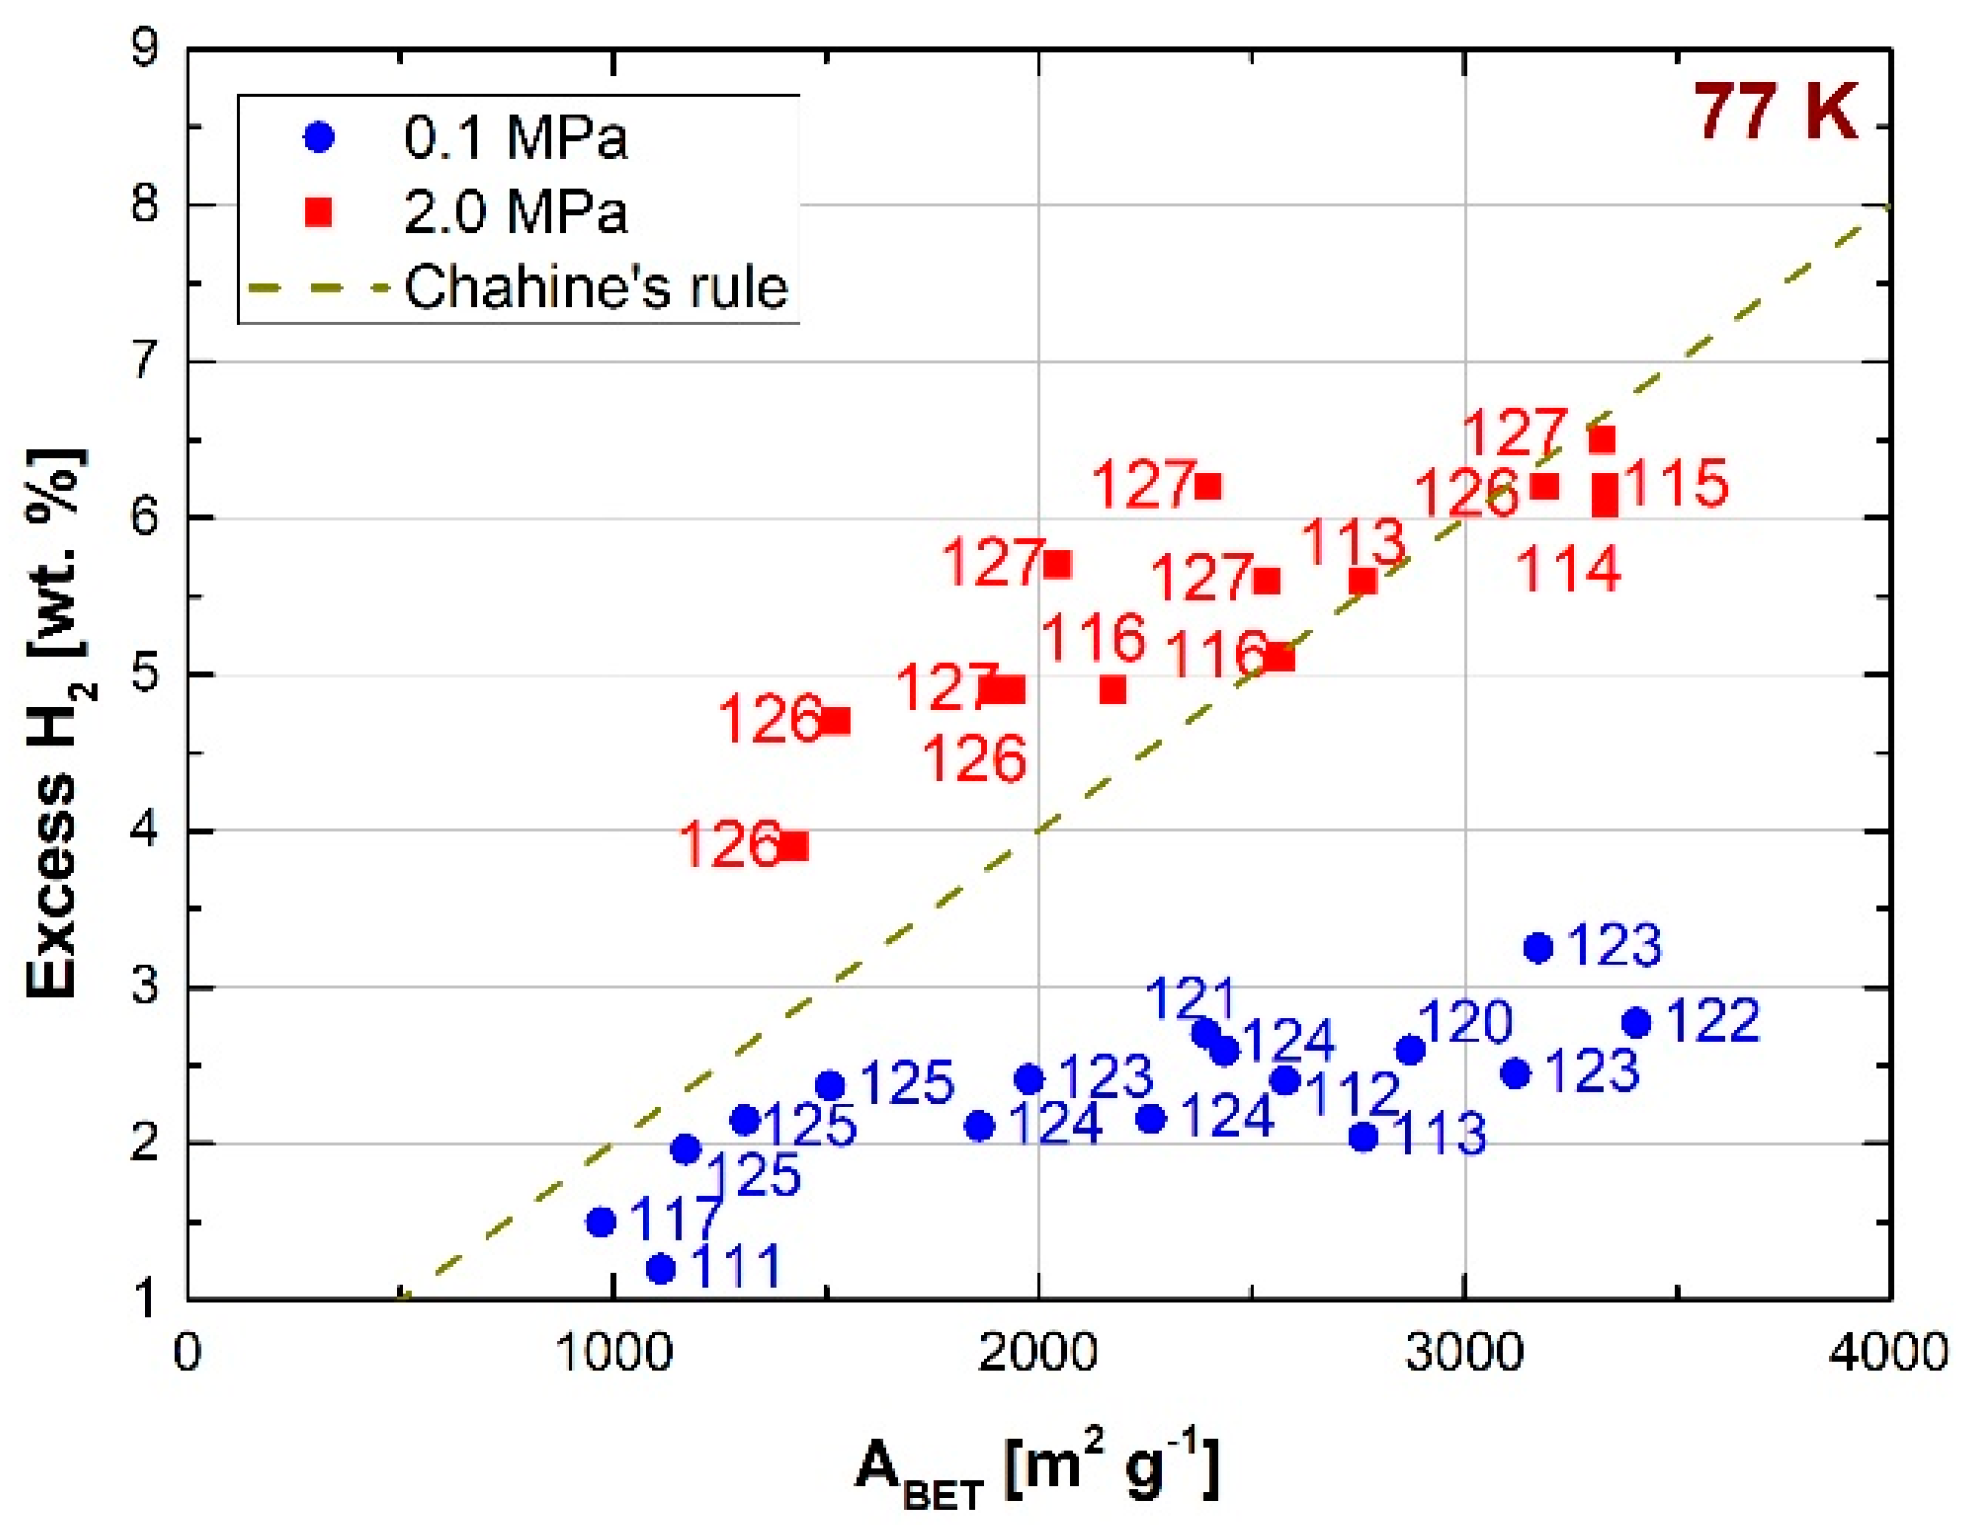
Figure 10a shows the hydrogen uptakes (in excess) obtained for ACs at 77 K reported in recent years. The hydrogen uptakes measured above 1 MPa follow the Chahine’s rule. The data measured at 0.1 MPa do not exceed 3 wt.% for ABET as high as 3000 m2 g−1. Figure 10b shows the hydrogen uptakes (also in excess) reported for ACs at 298 K. At this temperature, the averaged hydrogen uptake barely exceeds 1.2 wt.% for any value of ABET.
3.3. Templated Carbons
Carbon materials with a hierarchical pore structure and a relatively narrow pore size distribution can be produced by hard templating, also called nanocasting. This method consists in introducing an organic precursor into the pores of an inorganic template, for instance by impregnation, followed by carbonization and elimination of the template by leaching with strong acids [110]. The inorganic precursors commonly used are zeolites [111,112,113,114,115,116], silica [117,118,119], and MOFs [120,121,122,123,124,125,126,127].
Masika et al. [114] prepared porous carbons with ultrahigh surface areas from zeolite 13X using furfuryl alcohol as a carbon precursor. To better develop the porosity and reach an ABET of 3332 m2 g−1, the authors applied an additional CVD step using ethylene with the aim of better filling the zeolite. The excess hydrogen uptake obtained with the as-prepared sample was 6.2 wt.% at 77 K and 2 MPa, this value being among the highest ever achieved by a carbon material. Cai et al. [115] prepared a very ordered porous carbon using zeolite 10X as template. The as-produced carbon adsorbent had an ABET of 3331 m2 g−1 and a pore volume of 1.94 cm3 g−1. The absolute hydrogen uptake obtained with this sample at 77 K and 2 MPa was 6.09 wt.%. Musyoka et al. [111] investigated the possibility of producing zeolites from cheaper materials, such as fly ash, and used them as carbon templates. The carbons produced reached an excess uptake of 1.2 wt.% at 77 K and 0.1 MPa, which is lower than the value obtained with zeolite X under the same conditions (2.4 wt.%). The lower ABET, 1112 m2 g−1 compared to 2577 m2 g−1, may explain such differences.
Attia et al. [119] produced templated carbon from silica-based materials such as rice husks. The reported excess uptake of hydrogen was 2.41 wt.% at 77 K and 7 MPa. Carraro et al. [117] prepared ordered mesoporous carbon known as CMK-3 by a nanocasting method using SBA-15 silica as the template and sucrose as the carbon source. The measured ABET of this sample was 972 m2 g−1 and the total pore volume was 0.99 cm g1. The volume of mesopores was 43% of the total pore volume, whereas the micropores represented 16%. Thus, they obtained an excess uptake of 1.5 wt.% at 77 K and 0.1 MPa, which is lower than that commonly obtained with zeolites under the same conditions. Likewise, Juarez et al. [118] obtained an excess uptake of 2.2 wt.% at 77 K and 1 MPa using also CMK-3 synthesized by the nanocasting strategy. On average, it was found that silica-templated carbons are not relevant for hydrogen storage applications, as they exhibit high mesoporosity rather than microporosity [128,129,130].
MOFs have also been studied as templates for the synthesis of carbonaceous materials. Indeed, the organic bridges connecting the metallic inorganic nodes of the MOFs generally consist of aromatic rings, which allow reaching high carbon contents after the carbonization process [131]. This feature improves the hydrogen storage capacity of the templated carbons. MOFs based on organic bridges with a high carbon content generally lead to carbons with a low specific surface area, whereas high surface areas are produced from MOFs whose linkers present low carbon contents. Lim et al. [132] found that the surface area of MOF-derived carbons linearly increased with the Zn/C ratio of the precursors. They obtained ABET of 900 m2 g−1 for a Zn/C ratio equal to 0.07, whereas 1800 m2 g−1 was obtained when Zn/C was equal to 0.25. Indeed, the Zn metallic nodes can be easily removed during the carbonization process, without affecting the microporosity [120]. On the other hand, Segakweng et al. [121] found that carbons derived from Cr-MOFs displayed lower surface area and pore volume (ABET = 628 m2 g−1 and VT = 0.54 cm3 g−1, when carbonized at 1073 K) than the MOF precursor (ABET = 2619 m2 g−1 and VT = 1.36 cm3 g−1). This decrease was due to the blocking of pores by chromium carbides and oxides produced during carbonization. Exceptional hydrogen uptakes have been reached with MOF-derived carbons. Yang et al. [123] produced a templated carbon by direct pyrolysis at 1173 K of IRMOF-1 (IsoReticular Metal Organic Framework). An excess uptake as high as 3.25 wt.% was achieved at 77 K and 0.1 MPa using, exceeding the average values obtained with other reference materials. This templated carbon had an ABET of 3174 m2 g−1 and a total pore volume of 4.06 cm3 g−1, being one of the highest values ever reported for a carbon material. The same authors obtained an excess uptake of 2.45 wt.% at 77 K and 0.1 MPa using IRMOF-3 as a template and sucrose to impregnate it. The corresponding templated carbon had an ABET of 3120 m2 g−1 and a total pore volume of 1.96 cm3 g−1. Jiang et al. [122] reached 2.77 wt.% of hydrogen stored at 77 K and 0.1 MPa with a templated carbon synthesized using ZIF-8 (Zeolitic Imidazolate Framework) as a template, impregnated with furfuryl alcohol. An absolute uptake of 6.2 wt.% at 77 K and 2 MPa was achieved with the same sample but chemically activated with KOH [126]. Pachfule et al. [125] obtained excess uptakes of 2.37, 2.15, and 1.96 wt.% at 77 K and 0.1 MPa with nanoporous carbons derived from ZIF-70, ZIF-68 and ZIF-69, respectively, and using furfuryl alcohol to impregnate them.
Figure 11 shows the hydrogen uptakes (in excess) obtained at 77 K from templated carbons reported in recent years. The literature still lacks data on hydrogen uptake for the same materials at 298 K. The data measured at 2 MPa are on average higher than those predicted by Chahine’s rule. Furthermore, the increase in hydrogen uptake with ABET at 0.1 MPa is less than at 2 MPa.
3.4. Other Carbon Materials
Other carbon materials have been investigated as promising candidates for hydrogen storage. Among them, carbon nanospheres have received great attention due to their high surface-to-volume ratio and their large void space to encapsulate metal nanoparticles. Li et al. [133] obtained an absolute uptake of hydrogen of 6.4 wt.% at 77 K and 2 MPa with carbon spheres having an ABET of 3350 m2 g−1 and a total pore volume of 1.75 cm3 g−1. Baca et al. [134] showed that decorating hollow carbon spheres with metallic nanoparticles can be beneficial for hydrogen storage due to the spillover phenomenon. They obtained an excess uptake of 0.48 wt.% at 4.5 MPa and 313 K when decorating with Pt, whereas a significantly lower value of 0.13 wt.% was obtained under the same conditions when decorating with Pd.
Carbon aerogels also received special attention, because they ensure good hydrogen uptakes due to their developed textural properties, high ultra-microporosity among them. Singh et al. [135] obtained an excess uptake of 5.65 wt.% at 77 K and 2.2 MPa with carbon aerogels having an ABET of only 379 m2 g−1. These results confirm the limits of the BET method in the evaluation of the surface area of a porous material. Indeed, it is likely that such a material exhibits a high ultra-microporosity, which cannot be detected by N2 adsorption.
Carbons with developed textural properties have also been synthesized from hyper-crosslinked polymers (HCPs) by alkylation between an external crosslinker and several aromatic monomers. Zhang et al. [136] obtained nanoporous carbon materials by pyrolysis of an HCP having formaldehyde dimethyl acetal as crosslinker. The as-produced carbon had an ABET of 3101 m2 g−1 and a pore volume of 1.84 cm3 g−1. These features allowed reaching an excess uptake of 3.25 wt.% at 77 K and 0.1 MPa. This value is not too far from that obtained by Yang et al. [123] when using MOF-templated carbons. Lee et al. [137] obtained carbons with an exceptional ABET of 4334 m2 g−1 and total pore volume of 3.14 cm3 g−1 by carbonization of HCPs. They achieved an excess uptake of 3.6 wt.% at 77 K and 0.1 MPa, which is among the highest ever reached by carbon materials.
Recent numerical simulation by GCMC carried out by Qin et al. [138] have shown that it is possible to reach 4.5 wt.% of hydrogen uptake at 77 K and 2 MPa with a carbon nanomaterial having a honeycomb structure. Li et al. [139] obtained excess uptakes in the range 4.70-5.94 wt.% at 77 K and 2 MPa using polyacrylonitrile-based porous carbons with high ABET, between 2565 and 3049 m2 g−1.
4. Carbon Materials for Hydrogen Compression
An emerging technology for hydrogen compression is based on thermally driven, cyclic, adsorption–desorption on porous materials [140]. In addition to carbon materials [141], thoroughly reviewed in the present paper, other candidates for this purpose are: (i) MOFs, with their exceptional ABET sometimes higher than 6000 m2 g−1, thereby allowing excess uptakes of around 10 wt.% at 77 K and 6 MPa [142] (however, the main drawback of MOF for a wide application is their high price and the degradation of their properties with ageing [143]); (ii) organic polymers, which ensure hydrogen uptakes of about 4 wt.% at 77 K and approximately 1 MPa [144,145]; and (iii) silicas, aluminas, and zeolites, but giving amounts of adsorbed hydrogen lower than carbons of similar ABET [146].
An adsorption–desorption compressor is a non-mechanical compressor, which partly solves several shortcomings of mechanical compressors, such as the complex structure and the embrittlement phenomena resulting from the absorption of hydrogen by metals [147]. Moreover, the capital expenditure (CAPEX) and operational expenditure (OPEX) of a mechanical compressor can represent the largest contribution to the overall cost of hydrogen facilities such as the hydrogen refueling stations [148].
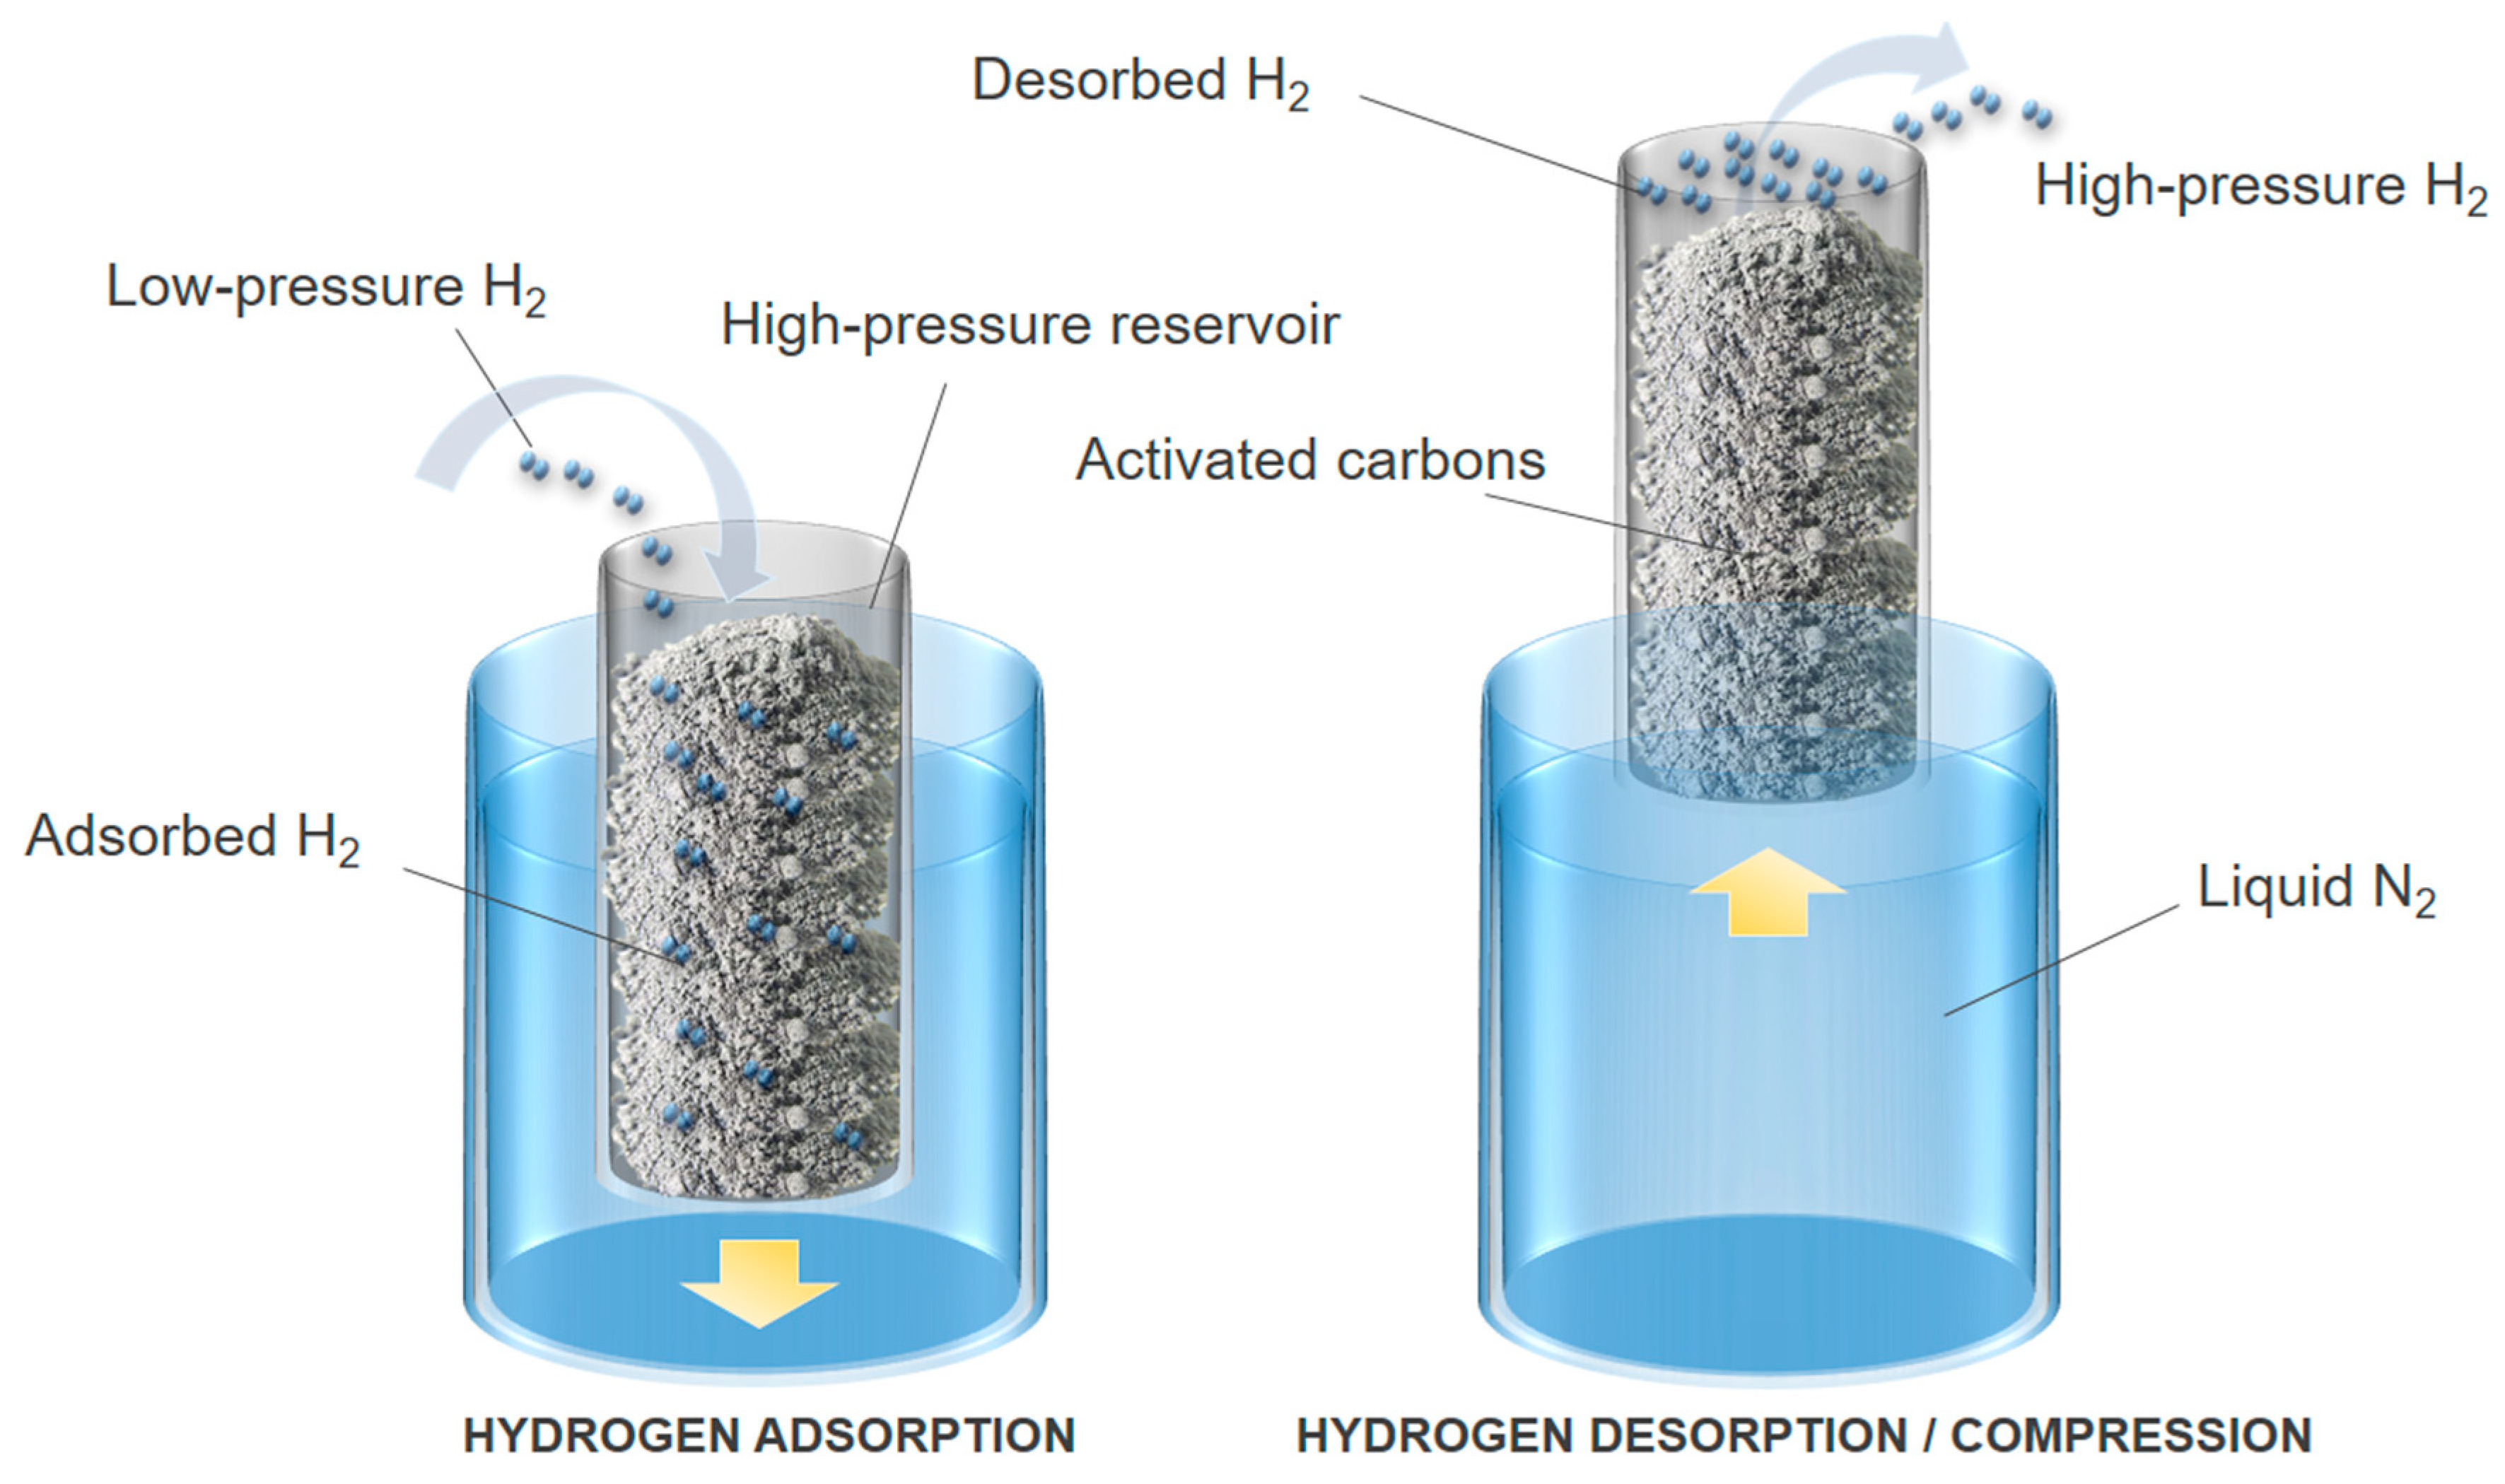
Figure 12 schematically shows the operating principle of a thermally driven adsorption–desorption compressor that can be described as a thermodynamic engine in which the compression is controlled by heat transfer between the compressor tank and the environment of the system. Hydrogen compression derives from the desorption of a pre-adsorbed amount of hydrogen on a porous material, as a consequence of the passage of hydrogen from the adsorbed phase, which is denser, to the bulk gas phase in a confined tank volume. Hydrogen desorption is obtained by increasing the temperature of the system [149]. The efficiency of an adsorption–desorption compressor is related to the hydrogen adsorption capacity of the porous material but also to the amount of material that can be introduced into the tank. Indeed, the higher is the amount of hydrogen adsorbed at low temperature, for instance at 77 K, the higher is the amount of high-pressure hydrogen discharged by the compressor.
According to the data reported in Section 3, carbon-based materials are good candidates for use in an adsorption–desorption compressor. In our previous study [150], we compressed hydrogen up to 70 MPa in a thermally driven adsorption–desorption device using the activated carbon MSC-30© (Kansai Coke & Chemicals, Hyogo, Japan). This AC has developed textural properties, such as an ABET of 3305 m2 g−1 and a total pore volume of 1.60 cm3 g−1. The microporosity contributes to 60% of the total pore volume, which allowed reaching an excess hydrogen uptake of 5.8 wt.% at 77 K and 4 MPa [27]. Hydrogen was introduced at 8 MPa into a 0.5 L prototype containing 0.135 kg of MSC-30, and then adsorption at 77 K was carried out. A high-pressure hydrogen flow, up to 28 NL h−1 at 70 MPa, was obtained in a single step when heating the compressor from 77 to 315 K. Nevertheless, and as mentioned above, the carbon materials must have an appropriate bulk density, with a high surface area and pore volume, in order to increase the performance of the thermally driven adsorption–desorption compressor, hence its efficiency [151].
5. Conclusions
Carbon materials are potentially suitable candidates for hydrogen storage. In recent years, several carbon materials have been studied for the storage of hydrogen, such as carbon nanotubes, carbon nanofibers, activated carbons, and carbons derived from zeolites and MOFs. The data reported in the open literature can be found in terms of: (i) excess uptake; (ii) absolute uptake; and (iii) total uptake, when the contribution of compressed hydrogen is added to that of adsorption. Thus, special care should be taken when comparing hydrogen adsorption data obtained with microporous carbon materials.
The hydrogen storage capacity depends on temperature and pressure coupled with textural details of the nanoporous carbon. While in the majority of works hydrogen storage is essentially solely correlated with the BET area (despite the significant limitations of the BET method for surface area assessment of microporous materials), details of the pore size distribution are crucial for optimizing nanoporous carbons for hydrogen storage application.
At pressures under 1 MPa and 77 K, both high surface area and narrow pores (<0.6 nm) are needed. High surface activated carbons present a wide pore size distribution and thus pressures above 3 MPa, necessary to fill larger micro- and mesopores, coupled with a large pore volume are desirable. Hence, a detailed, reliable physisorption characterization of nanoporous carbons is required and here major advances have been made during the last decade mainly due to: (i) advances in the development of methods based on statistical mechanics such as DFT based methods (e.g., NLDFT, 2-D NLDFT, and QSDFT) and molecular simulation; and (ii) development of high resolution experimental protocols including the combination of various adsorptives. While significant advances have been made in analytical tools for carbon characterization, the scientific literature still lacks information on the correspondence between the PSD of carbon materials and hydrogen storage capacity. In this paper, we show that the average density of the hydrogen adsorbed in very narrow pores (<0.6 nm) is six times that of the hydrogen in the bulk phase at 4 MPa. On the other hand, the density of adsorbed hydrogen in mesopores approaches that of the bulk phase. Understanding the evolution of hydrogen adsorption with pressure and taking into account the PSD is of primary importance for developing numerical models predicting the performance of hydrogen storage and compression systems. The empirical model proposed in Section 2.5 proved to be a better analytical tool than the use of ABET to predict the evolution of the absolute hydrogen adsorption with pressure.
Carbon materials have large surface areas and show high hydrogen storage capacities at 77 K. A maximum excess uptake of 7 wt.% at 77 K was achieved when using ACs or MOFs-derived carbons. Chemical activation was found to be essential for developing the microporosity of these materials. On the other hand, the data reported for carbon nanotubes and carbon nanofibers were so controversial that they were irreproducible in several cases. However, among the currently available candidates for hydrogen storage, none can meet the DOE targets for automotive applications (5.5 wt.% by 2025) by considering not only the weight of the adsorbent but that of the entire system. Indeed, the DOE targets are valid for ambient temperature, at which excess uptakes of only 1 wt.%, on average, were found at 298 K for the majority of the reported carbon adsorbents for a pressure range up to 20 MPa. Even though the use of metallic catalysts to promote the hydrogen spillover has been proposed as a mechanism to enhance hydrogen storage on nanostructured carbons at 298 K, it seems that hydrogen uptakes higher than 5 wt.% can be ensured quite exclusively at cryogenic temperatures. Under these conditions, the hydrogen adsorption strictly depends on textural properties, such as specific surface area and PSD.
In addition to their use in hydrogen storage applications, microporous carbon materials have recently been investigated as adsorbents in the context of adsorption–desorption compression technology. In such a system, compression of hydrogen derives from the desorption of a pre-adsorbed amount of hydrogen at 77 K triggered by the increase in the temperature of the system. A flow of high-pressure hydrogen at 70 MPa was obtained by using 0.135 kg of super-activated carbon (MSC-30, from Kansai Coke & Chemicals, with ABET = 3300 m2 g−1) in a reservoir of volume 0.5 L, when heating it from 77 to 315 K. This system could become a valid alternative to mechanical compressors from an industrial point of view.
Author Contributions
Writing—original draft preparation, G.S. and R.L.S.C.; Conceptualization, M.T. and V.F.; writing—review and editing, A.C., M.T. and V.F.; and funding acquisition, V.F. All authors have read and agreed to the published version of the manuscript.
Funding
This study was partly supported by the French PIA project “Lorraine Université d’Excellence”, reference ANR-15-IDEX-04-LUE, and TALiSMAN project, funded by FEDER (2019-000214).
Conflicts of Interest
The authors declare no conflict of interest.
References
- Züttel, A.; Sudan, P.; Mauron, P.H.; Kiyobayashi, T.; Emmenegger, C.H.; Schlapbach, L. Hydrogen storage in carbon nanostructures. Int. J. Hydrogen Energy 2002, 27, 203–212. [Google Scholar] [CrossRef]
- Kadono, K.; Kajiura, H.; Shiraishi, M. Dense hydrogen adsorption on carbon subnanopores at 77 K. Appl. Phys. Lett. 2003, 83, 3392–3394. [Google Scholar] [CrossRef]
- Poirier, E.; Dailly, A. On the nature of the adsorbed hydrogen phase in microporous metal−organic frameworks at supercritical temperatures. Langmuir 2009, 25, 12169–12176. [Google Scholar] [CrossRef] [PubMed] [Green Version]
- Dohnke, E. On the High Density Hydrogen Films Adsorbed in Carbon Nanospaces. Ph.D. Thesis, University of Missouri, Columbia, MO, USA, 2015. [Google Scholar]
- Fierro, V.; Zhao, W.; Izquierdo, M.T.; Aylon, E.; Celzard, A. Adsorption and compression contributions to hydrogen storage in activated anthracites. Int. J. Hydrogen Energy 2010, 35, 9038–9045. [Google Scholar] [CrossRef]
- De la Casa-Lillo, M.A.; Lamari-Darkrim, F.; Cazorla-Amorós, D.; Linares-Solano, A. Hydrogen storage in activated carbons and activated carbon fibers. J. Phys. Chem. B 2002, 106, 10930–10934. [Google Scholar] [CrossRef]
- Haul, R.S.J.; Gregg, K.S.W. Sing: Adsorption, surface area and porosity. Ber. Bunsenges. Phys. Chem. 1982, 86, 957. [Google Scholar] [CrossRef]
- Rouquerol, J.; Rouquerol, F.; Llewellyn, P.; Maurin, G.; Sing, K.S.W. Adsorption by Powders and Porous Solids: Principles, Methodology and Applications; Academic Press: Cambridge, MA, USA, 2013; ISBN 978-0-08-097036-3. [Google Scholar]
- Lowell, S.; Shields, J.E.; Thomas, M.A.; Thommes, M. Characterization of Porous Solids and Powders: Surface Area, Pore Size and Density; Particle Technology Series; Springer: Dordrecht, The Netherlands, 2004; ISBN 978-1-4020-2302-6. [Google Scholar]
- Thommes, M.; Kaneko, K.; Neimark, A.V.; Olivier, J.P.; Rodriguez-Reinoso, F.; Rouquerol, J.; Sing, K.S.W. Physisorption of gases, with special reference to the evaluation of surface area and pore size distribution (IUPAC Technical Report). Pure Appl. Chem. 2015, 87, 1051–1069. [Google Scholar] [CrossRef] [Green Version]
- Monson, P.A. Understanding adsorption/desorption hysteresis for fluids in mesoporous materials using simple molecular models and classical density functional theory. Microporous Mesoporous Mater. 2012, 160, 47–66. [Google Scholar] [CrossRef]
- Landers, J.; Gor, G.Y.; Neimark, A.V. Density functional theory methods for characterization of porous materials. Colloids Surf. Physicochem. Eng. Asp. 2013, 437, 3–32. [Google Scholar] [CrossRef]
- Cychosz, K.A.; Guillet-Nicolas, R.; García-Martínez, J.; Thommes, M. Recent advances in the textural characterization of hierarchically structured nanoporous materials. Chem. Soc. Rev. 2017, 46, 389–414. [Google Scholar] [CrossRef]
- Thommes, M.; Cychosz, K.A.; Neimark, A.V. Advanced physical adsorption characterization of nanoporous carbons. In Novel Carbon Adsorbent; Elsevier: Oxford, UK, 2012; pp. 107–145. [Google Scholar]
- Prehal, C.; Grätz, S.; Krüner, B.; Thommes, M.; Borchardt, L.; Presser, V.; Paris, O. Comparing pore structure models of nanoporous carbons obtained from small angle X-ray scattering and gas adsorption. Carbon 2019, 152, 416–423. [Google Scholar] [CrossRef]
- Garrido, J.; Linares-Solano, A.; Martin-Martinez, J.M.; Molina-Sabio, M.; Rodriguez-Reinoso, F.; Torregrosa, R. Use of nitrogen vs. carbon dioxide in the characterization of activated carbons. Langmuir 1987, 3, 76–81. [Google Scholar] [CrossRef]
- Zhang, X.; Liu, D.; Xu, D.; Asahina, S.; Cychosz, K.A.; Agrawal, K.V.; Wahedi, Y.A.; Bhan, A.; Hashimi, S.A.; Terasaki, O.; et al. Synthesis of self-pillared zeolite nanosheets by repetitive branching. Science 2012, 336, 1684–1687. [Google Scholar] [CrossRef] [PubMed] [Green Version]
- Jagiello, J.; Ania, C.; Parra, J.B.; Cook, C. Dual gas analysis of microporous carbons using 2D-NLDFT heterogeneous surface model and combined adsorption data of N2 and CO2. Carbon 2015, 91, 330–337. [Google Scholar] [CrossRef] [Green Version]
- Jagiello, J.; Kenvin, J.; Celzard, A.; Fierro, V. Enhanced resolution of ultra micropore size determination of biochars and activated carbons by dual gas analysis using N2 and CO2 with 2D-NLDFT adsorption models. Carbon 2019, 144, 206–215. [Google Scholar] [CrossRef] [Green Version]
- Dantas, S.; Struckhoff, K.C.; Thommes, M.; Neimark, A.V. Phase behavior and capillary condensation hysteresis of carbon dioxide in mesopores. Langmuir 2019, 35, 11291–11298. [Google Scholar] [CrossRef]
- Jagiello, J.; Ansón, A.; Martínez, M.T. DFT-based prediction of high-pressure H2 adsorption on porous carbons at ambient temperatures from low-pressure adsorption data measured at 77 K. J. Phys. Chem. B 2006, 110, 4531–4534. [Google Scholar] [CrossRef]
- Jagiello, J.; Thommes, M. Comparison of DFT characterization methods based on N2, Ar, CO2, and H2 adsorption applied to carbons with various pore size distributions. Carbon 2004, 42, 1227–1232. [Google Scholar] [CrossRef]
- Jagiello, J.; Kenvin, J.; Ania, C.O.; Parra, J.B.; Celzard, A.; Fierro, V. Exploiting the adsorption of simple gases O2 and H2 with minimal quadrupole moments for the dual gas characterization of nanoporous carbons using 2D-NLDFT models. Carbon 2020, 160, 164–175. [Google Scholar] [CrossRef]
- Kuwabara, H.; Suzuki, T.; Kaneko, K. Ultramicropores in microporous carbon fibres evidenced by helium adsorption at 4.2 K. J. Chem. Soc. Faraday Trans. 1991, 87, 1915–1916. [Google Scholar] [CrossRef]
- Suzuki, M. Fundamentals of Adsorption; Elsevier: Amsterdam, The Netherlands, 1993; ISBN 978-0-08-088772-2. [Google Scholar]
- Fierro, V.; Bosch, G.; Siperstein, F.R. Pore size distribution in microporous carbons obtained from molecular modeling and density functional theory. Stud. Surf. Sci. Catal. 2007, 519–526. [Google Scholar] [CrossRef]
- Sdanghi, G.; Schaefer, S.; Maranzana, G.; Celzard, A.; Fierro, V. Application of the modified Dubinin-Astakhov equation for a better understanding of high-pressure hydrogen adsorption on activated carbons. Int. J. Hydrogen Energy 2019. [Google Scholar] [CrossRef] [Green Version]
- Poirier, E.; Chahine, R.; Bose, T.K. Hydrogen adsorption in carbon nanostructures. Int. J. Hydrogen Energy 2001, 26, 831–835. [Google Scholar] [CrossRef]
- Rouquerol, J.; Llewellyn, P.; Rouquerol, F. Is the bet equation applicable to microporous adsorbents? In Studies in Surface Science and Catalysis; Llewellyn, P.L., Rodriquez-Reinoso, F., Rouqerol, J., Seaton, N., Eds.; Characterization of Porous Solids VII; Elsevier: Amsterdam, The Netherlands, 2007; Volume 160, pp. 49–56. [Google Scholar]
- Keii, T.; Takagi, T.; Kanetaka, S. A new plotting of the BET method. Anal. Chem. 1961, 33, 1965. [Google Scholar] [CrossRef]
- Kaneko, K.; Itoh, T.; Fujimori, T. Collective interactions of molecules with an interfacial solid. Chem. Lett. 2012, 41, 466–475. [Google Scholar] [CrossRef] [Green Version]
- Centeno, T.A.; Stoeckli, F. The assessment of surface areas in porous carbons by two model-independent techniques, the DR equation and DFT. Carbon 2010, 48, 2478–2486. [Google Scholar] [CrossRef] [Green Version]
- Horváth, G.; Kawazoe, K. Method for the calculation of effective pore size distribution in molecular sieve carbon. J. Chem. Eng. Jpn. 1983, 16, 470–475. [Google Scholar] [CrossRef] [Green Version]
- Tarazona, P. Solid-fluid transition and interfaces with density functional approaches. Surf. Sci. 1995, 331–333, 989–994. [Google Scholar] [CrossRef]
- Lastoskie, C.; Gubbins, K.E.; Quirke, N. Pore size distribution analysis of microporous carbons: A density functional theory approach. J. Phys. Chem. 1993, 97, 4786–4796. [Google Scholar] [CrossRef]
- Olivier, J.P.; Conklin, W.B.; Szombathely, M.V. Determination of pore size distribution from density functional theory: A comparison of nitrogen and argon results. In Studies in Surface Science and Catalysis; Rouquerol, J., Rodríguez-Reinoso, F., Sing, K.S.W., Unger, K.K., Eds.; Characterization of Porous Solids III; Elsevier: Amsterdam, The Netherlands, 1994; Volume 87, pp. 81–89. [Google Scholar]
- Neimark, A.V. The method of indeterminate Lagrange multipliers in nonlocal density functional theory. Langmuir 1995, 11, 4183–4184. [Google Scholar] [CrossRef]
- Olivier, J.P. Improving the models used for calculating the size distribution of micropore volume of activated carbons from adsorption data. Carbon 1998, 36, 1469–1472. [Google Scholar] [CrossRef]
- Bandosz, T.J.; Biggs, M.J.; Gubbins, K.E.; Hattori, Y.; Iiyama, T.; Kaneko, K.; Pikunic, J.; Thomson, K.T. Molecular models of porous carbons. Chem. Phys. Carbon 2003, 28, 41–228. [Google Scholar]
- Gor, G.Y.; Thommes, M.; Cychosz, K.A.; Neimark, A.V. Quenched solid density functional theory method for characterization of mesoporous carbons by nitrogen adsorption. Carbon 2012, 50, 1583–1590. [Google Scholar] [CrossRef]
- Cychosz, K.A.; Guo, X.; Fan, W.; Cimino, R.; Gor, G.Y.; Tsapatsis, M.; Neimark, A.V.; Thommes, M. Characterization of the pore structure of three-dimensionally ordered mesoporous carbons using high resolution gas sorption. Langmuir 2012, 28, 12647–12654. [Google Scholar] [CrossRef] [PubMed]
- Jagiello, J.; Olivier, J.P. A simple two-dimensional NLDFT model of gas adsorption in finite carbon pores. Application to pore structure analysis. J. Phys. Chem. C 2009, 113, 19382–19385. [Google Scholar] [CrossRef]
- Hu, X.; Radosz, M.; Cychosz, K.A.; Thommes, M. CO2-filling capacity and selectivity of carbon nanopores: Synthesis, texture, and pore-size distribution from Quenched-Solid Density Functional Theory (QSDFT). Environ. Sci. Technol. 2011, 45, 7068–7074. [Google Scholar] [CrossRef] [PubMed]
- Schaefer, S.; Fierro, V.; Izquierdo, M.T.; Celzard, A. Assessment of hydrogen storage in activated carbons produced from hydrothermally treated organic materials. Int. J. Hydrogen Energy 2016, 41, 12146–12156. [Google Scholar] [CrossRef] [Green Version]
- Rzepka, M.; Lamp, P.; de la Casa-Lillo, M.A. Physisorption of hydrogen on microporous carbon and carbon nanotubes. J. Phys. Chem. B 1998, 102, 10894–10898. [Google Scholar] [CrossRef] [Green Version]
- Cabria, I.; López, M.J.; Alonso, J.A. The optimum average nanopore size for hydrogen storage in carbon nanoporous materials. Carbon 2007, 45, 2649–2658. [Google Scholar] [CrossRef]
- Zhao, W.; Fierro, V.; Zlotea, C.; Aylon, E.; Izquierdo, M.T.; Latroche, M.; Celzard, A. Activated carbons with appropriate micropore size distribution for hydrogen adsorption. Int. J. Hydrogen Energy 2011, 36, 5431–5434. [Google Scholar] [CrossRef]
- Jhung, S.H.; Kim, H.-K.; Yoon, J.W.; Chang, J.-S. Low-temperature adsorption of hydrogen on nanoporous Aluminophosphates: Effect of pore size. J. Phys. Chem. B 2006, 110, 9371–9374. [Google Scholar] [CrossRef] [PubMed]
- Tellez-Juárez, M.C.; Fierro, V.; Zhao, W.; Fernández-Huerta, N.; Izquierdo, M.T.; Reguera, E.; Celzard, A. Hydrogen storage in activated carbons produced from coals of different ranks: Effect of oxygen content. Int. J. Hydrogen Energy 2014, 39, 4996–5002. [Google Scholar] [CrossRef]
- Kostoglou, N.; Koczwara, C.; Prehal, C.; Terziyska, V.; Babic, B.; Matovic, B.; Constantinides, G.; Tampaxis, C.; Charalambopoulou, G.; Steriotis, T.; et al. Nanoporous activated carbon cloth as a versatile material for hydrogen adsorption, selective gas separation and electrochemical energy storage. Nano Energy 2017, 40, 49–64. [Google Scholar] [CrossRef]
- Kostoglou, N.; Tarat, A.; Walters, I.; Ryzhkov, V.; Tampaxis, C.; Charalambopoulou, G.; Steriotis, T.; Mitterer, C.; Rebholz, C. Few-layer graphene-like flakes derived by plasma treatment: A potential material for hydrogen adsorption and storage. Microporous Mesoporous Mater. 2016, 225, 482–487. [Google Scholar] [CrossRef]
- Zhao, W.; Fierro, V.; Zlotea, C.; Aylon, E.; Izquierdo, M.T.; Latroche, M.; Celzard, A. Optimization of activated carbons for hydrogen storage. Int. J. Hydrogen Energy 2011, 36, 11746–11751. [Google Scholar] [CrossRef]
- Nelder, J.A.; Mead, R. A simplex method for function minimization. Comput. J. 1964, 7, 308–313. [Google Scholar] [CrossRef]
- Patchkovskii, S.; Tse, J.S.; Yurchenko, S.N.; Zhechkov, L.; Heine, T.; Seifert, G. Graphene nanostructures as tunable storage media for molecular hydrogen. Proc. Natl. Acad. Sci. USA 2005, 102, 10439–10444. [Google Scholar] [CrossRef] [Green Version]
- Georgiev, P.A.; Ross, D.K.; Albers, P.; Ramirez-Cuesta, A.J. The rotational and translational dynamics of molecular hydrogen physisorbed in activated carbon: A direct probe of microporosity and hydrogen storage performance. Carbon 2006, 44, 2724–2738. [Google Scholar] [CrossRef]
- Celzard, A.; Fierro, V.; Marêché, J.F.; Furdin, G. Advanced preparative strategies for activated carbons designed for the adsorptive storage of hydrogen. Adsorpt. Sci. Technol. 2007, 25, 129–142. [Google Scholar] [CrossRef]
- Gogotsi, Y.; Portet, C.; Osswald, S.; Simmons, J.M.; Yildirim, T.; Laudisio, G.; Fischer, J.E. Importance of pore size in high-pressure hydrogen storage by porous carbons. Int. J. Hydrogen Energy 2009, 34, 6314–6319. [Google Scholar] [CrossRef]
- Fierro, V.; Szczurek, A.; Zlotea, C.; Marêché, J.F.; Izquierdo, M.T.; Albiniak, A.; Latroche, M.; Furdin, G.; Celzard, A. Experimental evidence of an upper limit for hydrogen storage at 77 K on activated carbons. Carbon 2010, 48, 1902–1911. [Google Scholar] [CrossRef]
- Sdanghi, G.; Maranzana, G.; Celzard, A.; Fierro, V. Hydrogen adsorption on nanotextured carbon materials. In Hyrdogen Storage Technologies; Wiley: Hoboken, NJ, USA, 2018; pp. 263–297. ISBN 978-1-119-46057-2. [Google Scholar]
- Chambers, A.; Park, C.; Baker, R.T.K.; Rodriguez, N.M. Hydrogen storage in graphite nanofibers. J. Phys. Chem. B 1998, 102, 4253–4256. [Google Scholar] [CrossRef]
- Rzepka, M.; Bauer, E.; Reichenauer, G.; Schliermann, T.; Bernhardt, B.; Bohmhammel, K.; Henneberg, E.; Knoll, U.; Maneck, H.E.; Braue, W. Hydrogen storage capacity of catalytically grown carbon nanofibers. J. Phys. Chem. B 2005, 109, 14979–14989. [Google Scholar] [CrossRef]
- Jaybhaye, S.; Sharon, M.; Sharon, M.; Sathiyamoorthy, D.; Dasgupta, K. Semiconducting carbon nanofibers and hydrogen storage. Synth. React. Inorg. Met. Org. Nano-Met. Chem. 2007, 37, 473–476. [Google Scholar] [CrossRef]
- Kim, B.-J.; Park, S.-J. Preparation of nanoporous carbons from graphite nanofibres. Nanotechnology 2006, 17, 4395–4398. [Google Scholar] [CrossRef]
- Kim, B.-J.; Lee, Y.-S.; Park, S.-J. A study on the hydrogen storage capacity of Ni-plated porous carbon nanofibers. Int. J. Hydrogen Energy 2008, 33, 4112–4115. [Google Scholar] [CrossRef]
- Yadav, A.; Faisal, M.; Subramaniam, A.; Verma, N. Nickel nanoparticle-doped and steam-modified multiscale structure of carbon micro-nanofibers for hydrogen storage: Effects of metal, surface texture and operating conditions. Int. J. Hydrogen Energy 2017, 42, 6104–6117. [Google Scholar] [CrossRef]
- Hwang, S.-H.; Choi, W.M.; Lim, S.K. Hydrogen storage characteristics of carbon fibers derived from rice straw and paper mulberry. Mater. Lett. 2016, 167, 18–21. [Google Scholar] [CrossRef]
- Ullah Rather, S. Preparation, characterization and hydrogen storage studies of carbon nanotubes and their composites: A review. Int. J. Hydrogen Energy 2020, 45, 4653–4672. [Google Scholar] [CrossRef]
- Darkrim, F.L.; Malbrunot, P.; Tartaglia, G.P. Review of hydrogen storage by adsorption in carbon nanotubes. Int. J. Hydrogen Energy 2002, 27, 193–202. [Google Scholar] [CrossRef]
- Dillon, A.C.; Jones, K.M.; Bekkedahl, T.A.; Kiang, C.H.; Bethune, D.S.; Heben, M.J. Storage of hydrogen in single-walled carbon nanotubes. Nature 1997, 386, 377–379. [Google Scholar] [CrossRef]
- Chen, P.; Wu, X.; Lin, J.; Tan, K.L. High H2 uptake by alkali-doped carbon nanotubes under ambient pressure and moderate temperatures. Science 1999, 285, 91–93. [Google Scholar] [CrossRef] [PubMed]
- Yang, R.T. Hydrogen storage by alkali-doped carbon nanotubes-revisited. Carbon 2000, 38, 623–626. [Google Scholar] [CrossRef]
- Minami, D.; Ohkubo, T.; Kuroda, Y.; Sakai, K.; Sakai, H.; Abe, M. Structural optimization of arranged carbon nanotubes for hydrogen storage by grand canonical Monte Carlo simulation. Int. J. Hydrogen Energy 2010, 35, 12398–12404. [Google Scholar] [CrossRef]
- Saito, Y.; Yoshikawa, T.; Bandow, S.; Tomita, M.; Hayashi, T. Interlayer spacings in carbon nanotubes. Phys. Rev. B 1993, 48, 1907–1909. [Google Scholar] [CrossRef] [PubMed]
- Ghosh, S.; Padmanabhan, V. Hydrogen storage capacity of bundles of single-walled carbon nanotubes with defects. Int. J. Energy Res. 2017, 41, 1108–1117. [Google Scholar] [CrossRef]
- Wen, Y.W.; Liu, H.J.; Pan, L.; Tan, X.J.; Lv, H.Y.; Shi, J.; Tang, X.F. A triplet form of (5,0) carbon nanotube with higher hydrogen storage capacity. J. Phys. Chem. C 2011, 115, 9227–9231. [Google Scholar] [CrossRef]
- Lee, S.-Y.; Park, S.-J. Influence of the pore size in multi-walled carbon nanotubes on the hydrogen storage behaviors. J. Solid State Chem. 2012, 194, 307–312. [Google Scholar] [CrossRef]
- Adeniran, B.; Mokaya, R. Low temperature synthesized carbon nanotube superstructures with superior CO2 and hydrogen storage capacity. J. Mater. Chem. A 2015, 3, 5148–5161. [Google Scholar] [CrossRef] [Green Version]
- Lyu, J.; Kudiiarov, V.; Lider, A. An overview of the recent progress in modifications of carbon nanotubes for hydrogen adsorption. Nanomaterials 2020, 10, 255. [Google Scholar] [CrossRef] [Green Version]
- Guo, J.-H.; Li, S.-J.; Su, Y.; Chen, G. Theoretical study of hydrogen storage by spillover on porous carbon materials. Int. J. Hydrogen Energy 2020. [Google Scholar] [CrossRef]
- Elyassi, M.; Rashidi, A.; Hantehzadeh, M.R.; Elahi, S.M. Hydrogen storage behaviors by adsorption on multi-walled carbon nanotubes. J. Inorg. Organomet. Polym. Mater. 2017, 27, 285–295. [Google Scholar] [CrossRef]
- Lee, S.Y.; Soo, J.P. Hydrogen storage behaviors of Ni-loaded activated carbon nanotubes. Adv. Mater. Res. 2010, 123–125, 695–698. [Google Scholar] [CrossRef]
- Rather, S.U.; Hwang, S.-W. Comparative hydrogen uptake study on titanium-MWCNTs composite prepared by two different methods. Int. J. Hydrogen Energy 2016, 41, 18114–18120. [Google Scholar] [CrossRef]
- Sharma, A. Investigation on platinum loaded multi-walled carbon nanotubes for hydrogen storage applications. Int. J. Hydrogen Energy 2020, 45, 2967–2974. [Google Scholar] [CrossRef]
- Ariharan, A.; Viswanathan, B.; Nandhakumar, V. Nitrogen-incorporated carbon nanotube derived from polystyrene and polypyrrole as hydrogen storage material. Int. J. Hydrogen Energy 2018, 43, 5077–5088. [Google Scholar] [CrossRef]
- Yuan, W.; Li, B.; Li, L. A green synthetic approach to graphene nanosheets for hydrogen adsorption. Appl. Surf. Sci. 2011, 257, 10183–10187. [Google Scholar] [CrossRef]
- Singh, S.B.; De, M. Thermally exfoliated graphene oxide for hydrogen storage. Mater. Chem. Phys. 2020, 239, 122102. [Google Scholar] [CrossRef]
- Rowlandson, J.L.; Edler, K.J.; Tian, M.; Ting, V.P. Toward process-resilient lignin-derived activated carbons for hydrogen storage applications. ACS Sustain. Chem. Eng. 2020, 8, 2186–2195. [Google Scholar] [CrossRef]
- Samantaray, S.S.; Mangisetti, S.R.; Ramaprabhu, S. Investigation of room temperature hydrogen storage in biomass derived activated carbon. J. Alloys Compd. 2019, 789, 800–804. [Google Scholar] [CrossRef]
- Zhao, W.; Luo, L.; Chen, T.; Li, Z.; Zhang, Z.; Wang, H.; Rao, J.; Feo, L.; Fan, M. Synthesis and characterization of Pt-N-doped activated biocarbon composites for hydrogen storage. Compos. Part B Eng. 2019, 161, 464–472. [Google Scholar] [CrossRef]
- Wang, L.; Yang, R.T. Hydrogen storage properties of carbons doped with ruthenium, platinum, and nickel nanoparticles. J. Phys. Chem. C 2008, 112, 12486–12494. [Google Scholar] [CrossRef]
- Bader, N.; Ouederni, A. Optimization of biomass-based carbon materials for hydrogen storage. J. Energy Storage 2016, 5, 77–84. [Google Scholar] [CrossRef]
- Zhao, W.; Luo, L.; Wang, H.; Fan, M. Synthesis of bamboo-based activated carbons with super-high specific surface area for hydrogen storage. BioResources 2017, 12, 1246–1262. [Google Scholar] [CrossRef] [Green Version]
- Sethia, G.; Sayari, A. Activated carbon with optimum pore size distribution for hydrogen storage. Carbon 2016, 99, 289–294. [Google Scholar] [CrossRef]
- Zhao, W.; Luo, L.; Fan, M. Preparation and characterization of nitrogen-containing cellular activated carbon for CO2 and H2 adsorption. Nano 2017, 12, 1750007. [Google Scholar] [CrossRef] [Green Version]
- Wang, Z.; Sun, L.; Xu, F.; Zhou, H.; Peng, X.; Sun, D.; Wang, J.; Du, Y. Nitrogen-doped porous carbons with high performance for hydrogen storage. Int. J. Hydrogen Energy 2016, 41, 8489–8497. [Google Scholar] [CrossRef]
- Wróbel-Iwaniec, I.; Díez, N.; Gryglewicz, G. Chitosan-based highly activated carbons for hydrogen storage. Int. J. Hydrogen Energy 2015, 40, 5788–5796. [Google Scholar] [CrossRef]
- Heo, Y.-J.; Park, S.-J. Synthesis of activated carbon derived from rice husks for improving hydrogen storage capacity. J. Ind. Eng. Chem. 2015, 31, 330–334. [Google Scholar] [CrossRef]
- Choi, Y.-K.; Park, S.-J. Preparation and characterization of sucrose-based microporous carbons for increasing hydrogen storage. J. Ind. Eng. Chem. 2015, 28, 32–36. [Google Scholar] [CrossRef]
- Blankenship, T.S., II; Balahmar, N.; Mokaya, R. Oxygen-rich microporous carbons with exceptional hydrogen storage capacity. Nat. Commun. 2017, 8, 1–12. [Google Scholar] [CrossRef] [PubMed] [Green Version]
- Wang, H.; Gao, Q.; Hu, J. High hydrogen storage capacity of porous carbons prepared by using activated carbon. J. Am. Chem. Soc. 2009, 131, 7016–7022. [Google Scholar] [CrossRef]
- Zhao, W.; Fierro, V.; Zlotea, C.; Izquierdo, M.T.; Chevalier-César, C.; Latroche, M.; Celzard, A. Activated carbons doped with Pd nanoparticles for hydrogen storage. Int. J. Hydrogen Energy 2012, 37, 5072–5080. [Google Scholar] [CrossRef]
- Zhao, W.; Fierro, V.; Fernández-Huerta, N.; Izquierdo, M.T.; Celzard, A. Hydrogen uptake of high surface area-activated carbons doped with nitrogen. Int. J. Hydrogen Energy 2013, 38, 10453–10460. [Google Scholar] [CrossRef] [Green Version]
- Romanos, J.; Beckner, M.; Prosniewski, M.; Rash, T.; Lee, M.; Robertson, J.D.; Firlej, L.; Kuchta, B.; Pfeifer, P. Boron-neutron capture on activated carbon for hydrogen storage. Sci. Rep. 2019, 9, 1–8. [Google Scholar] [CrossRef] [PubMed]
- Yahya, M.A.; Al-Qodah, Z.; Ngah, C.W.Z. Agricultural bio-waste materials as potential sustainable precursors used for activated carbon production: A review. Renew. Sustain. Energy Rev. 2015, 46, 218–235. [Google Scholar] [CrossRef]
- Demiral, H.; Demiral, İ.; Karabacakoğlu, B.; Tümsek, F. Production of activated carbon from olive bagasse by physical activation. Chem. Eng. Res. Des. 2011, 89, 206–213. [Google Scholar] [CrossRef]
- Loloie, Z.; Mozaffarian, M.; Soleimani, M.; Asassian, N. Carbonization and CO2 activation of scrap tires: Optimization of specific surface area by the Taguchi method. Korean J. Chem. Eng. 2016, 2, 366–375. [Google Scholar] [CrossRef]
- Melouki, R.; Llewellyn, P.L.; Tazibet, S.; Boucheffa, Y. Hydrogen adsorption on activated carbons prepared from olive waste: Effect of activation conditions on uptakes and adsorption energies. J. Porous Mater. 2017, 24, 1–11. [Google Scholar] [CrossRef]
- Bader, N.; Zacharia, R.; Abdelmottaleb, O.; Cossement, D. How the activation process modifies the hydrogen storage behavior of biomass-derived activated carbons. J. Porous Mater. 2018, 25, 221–234. [Google Scholar] [CrossRef]
- Schlapbach, L.; Züttel, A. Hydrogen-storage materials for mobile applications. Nature 2001, 414, 353–358. [Google Scholar] [CrossRef] [PubMed]
- He, X.; Nesterenko, E.P.; Nesterenko, P.N.; Brabazon, D.; Zhou, L.; Glennon, J.D.; Luong, J.H.T.; Paull, B. Fabrication and characterization of nanotemplated carbon monolithic material. ACS Appl. Mater. Interfaces 2013, 5, 8572–8580. [Google Scholar] [CrossRef] [PubMed] [Green Version]
- Musyoka, N.M.; Ren, J.; Langmi, H.W.; North, B.C.; Mathe, M. A comparison of hydrogen storage capacity of commercial and fly ash-derived zeolite X together with their respective templated carbon derivatives. Int. J. Hydrogen Energy 2015, 40, 12705–12712. [Google Scholar] [CrossRef]
- Yang, Z.; Xia, Y.; Mokaya, R. Enhanced hydrogen storage capacity of high surface area zeolite-like carbon materials. J. Am. Chem. Soc. 2007, 129, 1673–1679. [Google Scholar] [CrossRef] [PubMed]
- Xia, Y.; Yang, Z.; Gou, X.; Zhu, Y. A simple method for the production of highly ordered porous carbon materials with increased hydrogen uptake capacities. Int. J. Hydrogen Energy 2013, 38, 5039–5052. [Google Scholar] [CrossRef]
- Masika, E.; Mokaya, R. Preparation of ultrahigh surface area porous carbons templated using zeolite 13X for enhanced hydrogen storage. Prog. Nat. Sci. Mater. Int. 2013, 23, 308–316. [Google Scholar] [CrossRef] [Green Version]
- Cai, J.; Li, L.; Lv, X.; Yang, C.; Zhao, X. Large surface area ordered porous carbons via nanocasting zeolite 10X and high performance for hydrogen storage application. ACS Appl. Mater. Interfaces 2014, 6, 167–175. [Google Scholar] [CrossRef]
- Yang, Z.; Xiong, W.; Wang, J.; Zhu, Y.; Xia, Y. A systematic study on the preparation and hydrogen storage of zeolite 13X-templated microporous carbons. Eur. J. Inorg. Chem. 2016, 2152–2158. [Google Scholar] [CrossRef] [Green Version]
- Carraro, P.M.; García Blanco, A.A.; Lener, G.; Barrera, D.; Amaya-Roncancio, S.; Chanquía, C.; Troiani, H.; Oliva, M.I.; Eimer, G.A. Nanostructured carbons modified with nickel as potential novel reversible hydrogen storage materials: Effects of nickel particle size. Microporous Mesoporous Mater. 2019, 273, 50–59. [Google Scholar] [CrossRef]
- Juárez, J.M.; Costa, M.G.; Anunziata, O.A. Direct synthesis of ordered mesoporous carbon applied in hydrogen storage. J. Porous Mater. 2018, 25, 1359–1363. [Google Scholar] [CrossRef]
- Attia, N.F.; Lee, S.M.; Kim, H.J.; Geckeler, K.E. Nanoporous carbon-templated silica nanoparticles: Preparation, effect of different carbon precursors, and their hydrogen storage adsorption. Microporous Mesoporous Mater. 2013, 173, 139–146. [Google Scholar] [CrossRef]
- Liu, B.; Shioyama, H.; Akita, T.; Xu, Q. Metal-organic framework as a template for porous carbon synthesis. J. Am. Chem. Soc. 2008, 130, 5390–5391. [Google Scholar] [CrossRef]
- Segakweng, T.; Musyoka, N.M.; Ren, J.; Crouse, P.; Langmi, H.W. Comparison of MOF-5-and Cr-MOF-derived carbons for hydrogen storage application. Res. Chem. Intermed. 2016, 42, 4951–4961. [Google Scholar] [CrossRef] [Green Version]
- Jiang, H.-L.; Liu, B.; Lan, Y.-Q.; Kuratani, K.; Akita, T.; Shioyama, H.; Zong, F.; Xu, Q. From metal–organic framework to nanoporous carbon: Toward a very high surface area and hydrogen uptake. J. Am. Chem. Soc. 2011, 133, 11854–11857. [Google Scholar] [CrossRef] [PubMed]
- Yang, S.J.; Kim, T.; Im, J.H.; Kim, Y.S.; Lee, K.; Jung, H.; Park, C.R. MOF-derived hierarchically porous carbon with exceptional porosity and hydrogen storage capacity. Chem. Mater. 2012, 24, 464–470. [Google Scholar] [CrossRef]
- Wang, Q.; Xia, W.; Guo, W.; An, L.; Xia, D.; Zou, R. Functional zeolitic-Imidazolate-framework-templated porous carbon materials for CO2 capture and enhanced capacitors. Chem. Asian J. 2013, 8, 1879–1885. [Google Scholar] [CrossRef]
- Pachfule, P.; Biswal, B.P.; Banerjee, R. Control of porosity by using Isoreticular Zeolitic Imidazolate Frameworks (IRZIFs) as a template for porous carbon synthesis. Chem. Eur. J. 2012, 18, 11399–11408. [Google Scholar] [CrossRef]
- Almasoudi, A.; Mokaya, R. Preparation and hydrogen storage capacity of templated and activated carbons nanocast from commercially available zeolitic Imidazolate framework. J. Mater. Chem. 2011, 22, 146–152. [Google Scholar] [CrossRef]
- Almasoudi, A.; Mokaya, R. Porosity modulation of activated ZIF-templated carbons via compaction for hydrogen and CO2 storage applications. J. Mater. Chem. A 2014, 2, 10960–10968. [Google Scholar] [CrossRef]
- Shi, J.; Li, W.; Li, D. Synthesis, nickel decoration, and hydrogen adsorption of silica-templated mesoporous carbon material with high surface area. J. Phys. Chem. C 2015, 119, 23430–23435. [Google Scholar] [CrossRef]
- Konwar, R.J.; De, M. Synthesis of high surface area silica gel templated carbon for hydrogen storage application. J. Anal. Appl. Pyrolysis 2014, 107, 224–232. [Google Scholar] [CrossRef]
- Kruk, M.; Jaroniec, M.; Ryoo, R.; Joo, S.H. Characterization of ordered mesoporous carbons synthesized using MCM-48 Silicas as templates. J. Phys. Chem. B 2000, 104, 7960–7968. [Google Scholar] [CrossRef]
- Kaneti, Y.V.; Tang, J.; Salunkhe, R.R.; Jiang, X.; Yu, A.; Wu, K.C.-W.; Yamauchi, Y. Nanoarchitectured design of porous materials and nanocomposites from metal-organic frameworks. Adv. Mater. 2017, 29, 1604898. [Google Scholar] [CrossRef] [PubMed]
- Lim, S.; Suh, K.; Kim, Y.; Yoon, M.; Park, H.; Dybtsev, D.N.; Kim, K. Porous carbon materials with a controllable surface area synthesized from metal-organic frameworks. Chem. Commun. 2012, 48, 7447–7449. [Google Scholar] [CrossRef] [Green Version]
- Li, Y.; Li, D.; Rao, Y.; Zhao, X.; Wu, M. Superior CO2, CH4, and H2 uptakes over ultrahigh-surface-area carbon spheres prepared from sustainable biomass-derived char by CO2 activation. Carbon 2016, 105, 454–462. [Google Scholar] [CrossRef]
- Baca, M.; Cendrowski, K.; Kukulka, W.; Bazarko, G.; Moszyński, D.; Michalkiewicz, B.; Kalenczuk, R.J.; Zielinska, B. A comparison of hydrogen storage in Pt, Pd and Pt/Pd alloys loaded disordered mesoporous hollow carbon spheres. Nanomaterials 2018, 8, 639. [Google Scholar] [CrossRef] [PubMed] [Green Version]
- Singh, S.; Bhatnagar, A.; Dixit, V.; Shukla, V.; Shaz, M.A.; Sinha, A.S.K.; Srivastava, O.N.; Sekkar, V. Synthesis, characterization and hydrogen storage characteristics of ambient pressure dried carbon aerogel. Int. J. Hydrogen Energy 2016, 41, 3561–3570. [Google Scholar] [CrossRef]
- Zhang, C.; Kong, R.; Wang, X.; Xu, Y.; Wang, F.; Ren, W.; Wang, Y.; Su, F.; Jiang, J.-X. Porous carbons derived from hypercrosslinked porous polymers for gas adsorption and energy storage. Carbon 2017, 114, 608–618. [Google Scholar] [CrossRef]
- Lee, J.-S.M.; Briggs, M.E.; Hasell, T.; Cooper, A.I. Hyperporous carbons from hypercrosslinked polymers. Adv. Mater. 2016, 28, 9804–9810. [Google Scholar] [CrossRef]
- Qin, Q.; Sun, T.; Wang, H.; Brault, P.; An, H.; Xie, L.; Peng, Q. Adsorption and diffusion of hydrogen in carbon honeycomb. Nanomaterials 2020, 10, 344. [Google Scholar] [CrossRef] [Green Version]
- Li, Y.; Xiao, Y.; Dong, H.; Zheng, M.; Liu, Y. Polyacrylonitrile-based highly porous carbon materials for exceptional hydrogen storage. Int. J. Hydrogen Energy 2019, 44, 23210–23215. [Google Scholar] [CrossRef]
- Sdanghi, G.; Maranzana, G.; Celzard, A.; Fierro, V. Towards non-mechanical hybrid hydrogen compression for decentralized hydrogen facilities. Energies 2020, 13, 3145. [Google Scholar] [CrossRef]
- Panella, B.; Hirscher, M.; Siegmar, R. Hydrogen adsorption in different carbon nanostructures. Carbon 2005, 43, 2209–2214. [Google Scholar] [CrossRef]
- Suh, M.P.; Park, H.J.; Prasad, T.K.; Lim, D.-W. Hydrogen storage in metal-organic frameworks. Chem. Rev. 2012, 112, 782–835. [Google Scholar] [CrossRef] [PubMed]
- DeSantis, D.; Mason, J.A.; James, B.D.; Houchins, C.; Long, J.R.; Veenstra, M. Techno-economic analysis of metal–organic frameworks for hydrogen and natural gas storage. Energy Fuels 2017, 31, 2024–2032. [Google Scholar] [CrossRef]
- Ghanem, B.S.; Msayib, K.J.; McKeown, N.B.; Harris, K.D.; Pan, Z.; Budd, P.M.; Butler, A.; Selbie, J.; Book, D.; Walton, A. A triptycene-based polymer of intrinsic microposity that displays enhanced surface area and hydrogen adsorption. Chem. Commun. 2007, 67–69. [Google Scholar] [CrossRef] [PubMed]
- Makhseed, S.; Samuel, J. Hydrogen adsorption in microporous organic framework polymer. Chem. Commun. 2008, 4342–4344. [Google Scholar] [CrossRef]
- Thomas, K.M. Hydrogen adsorption and storage on porous materials. Catal. Today 2007, 120, 389–398. [Google Scholar] [CrossRef]
- Dwivedi, S.N. Design considerations for high-pressure reciprocating compressors for refinery services. In Proceedings of the International Compressor Engineering Conference 1990, West Lafayette, IN, USA, 17–20 July 1990. [Google Scholar]
- Parks, G.; Boyd, R.; Cornish, J.; Remick, R. Hydrogen Station Compression, Storage, and Dispensing Technical Status and Costs; National Renewable Energy Lab: Golden, CO, USA, 2014.
- Sdanghi, G.; Maranzana, G.; Celzard, A.; Fierro, V. Review of the current technologies and performances of hydrogen compression for stationary and automotive applications. Renew. Sustain. Energy Rev. 2019, 102, 150–170. [Google Scholar] [CrossRef]
- Sdanghi, G.; Nicolas, V.; Mozet, K.; Schaefer, S.; Maranzana, G.; Celzard, A.; Fierro, V. A 70 MPa hydrogen thermally driven compressor based on cyclic adsorption-desorption on activated carbon. Carbon 2020, 161, 466–478. [Google Scholar] [CrossRef]
- Sdanghi, G.; Nicolas, V.; Mozet, K.; Maranzana, G.; Celzard, A.; Fierro, V. Modelling of a hydrogen thermally driven compressor based on cyclic adsorption-desorption on activated carbon. Int. J. Hydrogen Energy 2019, 44, 16811–16823. [Google Scholar] [CrossRef]
Figure 1.
(a) N2 at 77 K, Ar at 87 K and CO2 at 273 K physisorption isotherms on nanoporous carbon obtained by activation of graphene (CO2 at 273 K isotherm is shown in inset). (b) NLDFT pore size/volume distribution over the range of micro- and mesopores. Reproduced with permission from [13]. Copyright© The Royal Society of Chemistry, 2017.

Figure 2.
High-resolution N2 isotherms of activated carbons for gas (CO2) storage shown on: (a) linear scale; and (b) semi-logarithmic scale. (c) The corresponding QSDFT pore size distribution. Reproduced with permission from [43]. Copyright© American Chemical Society, 2011.
Figure 2.
High-resolution N2 isotherms of activated carbons for gas (CO2) storage shown on: (a) linear scale; and (b) semi-logarithmic scale. (c) The corresponding QSDFT pore size distribution. Reproduced with permission from [43]. Copyright© American Chemical Society, 2011.

Figure 3.
Absolute H2 uptake at 77 K and 4 MPa as a function of: (a) ABET; and (b) SNLDFT.

Figure 4.
(a) Pore size distribution calculated by 2D-NLDFT method; (b) cumulated pore volume; (c) absolute hydrogen isotherm; and (d) apparent density of the adsorbed phase for three selected ACs and H2 bulk density as a function of pressure at 77 K.
Figure 4.
(a) Pore size distribution calculated by 2D-NLDFT method; (b) cumulated pore volume; (c) absolute hydrogen isotherm; and (d) apparent density of the adsorbed phase for three selected ACs and H2 bulk density as a function of pressure at 77 K.

Figure 5.
Contribution of each range of pore size to hydrogen adsorption at: (a) 0.1 MPa; and (b) 4.0 MPa.
Figure 5.
Contribution of each range of pore size to hydrogen adsorption at: (a) 0.1 MPa; and (b) 4.0 MPa.

Figure 6.
(a) Evolution of the adsorbed density factor and H2 bulk density with pressure; and (b) correlation between experimental and predicted H2 uptakes when using the polynomial expression (Equation (1)).
Figure 6.
(a) Evolution of the adsorbed density factor and H2 bulk density with pressure; and (b) correlation between experimental and predicted H2 uptakes when using the polynomial expression (Equation (1)).

Figure 7.
(a) Pore size distribution calculated by 2D-NLDFT method; (b) cumulated pore volume; (c) absolute hydrogen isotherm; and (d) correlation between experimental and predicted H2 for five ACs selected for the validation of the polynomial expression.
Figure 7.
(a) Pore size distribution calculated by 2D-NLDFT method; (b) cumulated pore volume; (c) absolute hydrogen isotherm; and (d) correlation between experimental and predicted H2 for five ACs selected for the validation of the polynomial expression.

Figure 8.
(a) Pressure required for each range of pore size to reach 95% of the maximum adsorption density; and (b) absolute H2 uptake as function of pore volume at 77 K and 4.0 MPa.
Figure 8.
(a) Pressure required for each range of pore size to reach 95% of the maximum adsorption density; and (b) absolute H2 uptake as function of pore volume at 77 K and 4.0 MPa.

Figure 9.
Excess hydrogen uptakes on CNFs, CNTs and GOs reported by recent works at: (a) 77 K; and (b) 298 K. The labels indicate the corresponding references.
Figure 9.
Excess hydrogen uptakes on CNFs, CNTs and GOs reported by recent works at: (a) 77 K; and (b) 298 K. The labels indicate the corresponding references.

Figure 10.
Excess hydrogen uptakes on ACs reported by recent works at: (a) 77 K; and (b) 298 K. The labels indicate the corresponding references.
Figure 10.
Excess hydrogen uptakes on ACs reported by recent works at: (a) 77 K; and (b) 298 K. The labels indicate the corresponding references.

Figure 11.
Excess hydrogen uptakes on ACs reported by recent works at 77 K. The labels indicate the corresponding references.
Figure 11.
Excess hydrogen uptakes on ACs reported by recent works at 77 K. The labels indicate the corresponding references.

Figure 12.
Operating principles of an adsorption/desorption compressor.

© 2020 by the authors. Licensee MDPI, Basel, Switzerland. This article is an open access article distributed under the terms and conditions of the Creative Commons Attribution (CC BY) license (http://creativecommons.org/licenses/by/4.0/).
Share and Cite
MDPI and ACS Style
Sdanghi, G.; Canevesi, R.L.S.; Celzard, A.; Thommes, M.; Fierro, V. Characterization of Carbon Materials for Hydrogen Storage and Compression. C 2020, 6, 46. https://0-doi-org.brum.beds.ac.uk/10.3390/c6030046
AMA Style
Sdanghi G, Canevesi RLS, Celzard A, Thommes M, Fierro V. Characterization of Carbon Materials for Hydrogen Storage and Compression. C. 2020; 6(3):46. https://0-doi-org.brum.beds.ac.uk/10.3390/c6030046
Chicago/Turabian StyleSdanghi, Giuseppe, Rafael L. S. Canevesi, Alain Celzard, Matthias Thommes, and Vanessa Fierro. 2020. "Characterization of Carbon Materials for Hydrogen Storage and Compression" C 6, no. 3: 46. https://0-doi-org.brum.beds.ac.uk/10.3390/c6030046
Note that from the first issue of 2016, this journal uses article numbers instead of page numbers. See further details here.