Nitrogen-Doped Arginine Carbon Dots and Its Metal Nanoparticle Composites as Antibacterial Agent
by
 and
and
Selin S. Suner
1, 
Mehtap Sahiner
2,
Ramesh S. Ayyala
3,
Venkat R. Bhethanabotla
4 and
Nurettin Sahiner
1,3,4,* 1
Department of Chemistry, Faculty of Sciences & Arts, and Nanoscience and Technology Research and Application Center (NANORAC), Canakkale Onsekiz Mart University Terzioglu Campus, Canakkale 17100, Turkey
2
Department of Fashion Design, Faculty of Canakkale School of Applied Science, Canakkale Onsekiz Mart University Terzioglu Campus, Canakkale 17100, Turkey
3
Department of Ophalmology, College of Medicine, University of South Florida, Tampa, FL 33620, USA
4
Department of Chemical & Biomedical Engineering, and Materials Science and Engineering Program, University of South Florida, Tampa, FL 33620, USA
*
Author to whom correspondence should be addressed.
C 2020, 6(3), 58; https://0-doi-org.brum.beds.ac.uk/10.3390/c6030058
Submission received: 31 August 2020
/
Revised: 12 September 2020
/
Accepted: 17 September 2020
/
Published: 21 September 2020
(This article belongs to the Special Issue Graphene and Carbon Quantum Dots, and Related 2D Quantum Dots)
Abstract
:Nitrogen (N)-doped arginine carbon dots (Arg CD) were successfully synthesized using arginine as the amine source and citric acid as the carbon source via a one-pot green synthesis microwave-assisted technique in 2 min. Ag and Cu nanoparticles (NP) were generated within N-doped Arg CDs as composite Arg-Ag CDs and Arg-Cu CDs to render enhanced antibacterial properties. TEM analysis revealed that Arg CDs are in graphitic structures with d spacing ranging from 0.5 nm to 10 nm. The minimum inhibition concentration (MIC) values of Arg CDs with 6.250 mg/mL were decreased by about 100-fold for Arg-Ag CDs and ten-fold for Arg-Cu CDs with 0.062 and 0.625 mg/mL MIC values against Staphylococcus aureus (S. aureus). The highest antibacterial susceptibility was observed for the Arg-Ag CD composite with 0.125 and 0.312 mg/mL minimum bactericidal concentration (MBC) values against Gram negative S. aureus and Gram positive Escherichia coli (E. coli) bacteria strains, respectively. It was found that the metal NPs within Arg CDs significantly increased the antibacterial properties of CDs making them available in the treatment of infections caused by different bacterial species. Furthermore, Arg-Ag CD and Arg-Cu CD composites were tested for Acetylcholinesterase (AChE, E.C. 3.1.1.7) that break down acetylcholine (ACh) into choline and acetic acid leading to the loss of ACh which plays an essential role as neurotransmitter in Alzheimer disease. It was found that Arg-Cu CDs inhibited 74.9 ± 0.8% and Arg-Ag CDs inhibited 52.1 ± 3.8% of AChE at a 1.82 mg/mL concentration versus no inhibition for Arg-CD. Moreover, the chelating activity of Arg-Cu CDs and Arg-Ag CDs were tested for Fe(II) and it was found that almost 100% chelating was attained at 116 μg composites versus no measurable chelation for bare Arg CDs, suggesting the potential neurodegenerative disease treatment properties of these composite CDs in the brain.

1. Introduction
Carbon dots (CDs) are newly developed and fascinating types of carbon-based fluorescent nanomaterials that are smaller than 20 nm. Because of the excellent properties of CDs such as broadband optical absorption, bright emission, chemical and photo stability, and high-water solubility, they have been extensively investigated for different applications [1]. Researchers have recently focused on CD preparation from various natural sources such as milk [2], mushroom, and plants parts such as beans [3], fruit [4], vegetables [5], and so on, and directly from natural molecules including carbohydrates, amino acids, and proteins to obtain green fluorescence materials [6,7]. These nanomaterials have been replaced toxic organic dyes and metal-based quantum dots due to their environmentally friendly, biocompatible, and non-toxic nature. These features point to a wide range of usages e.g., sensing, light-emitting diodes, optoelectronics, photocatalysis [8], fluorescent labeling, bioimaging, drug delivery [9], cancer treatment, disease diagnosis, biomedicine, nanotheranostics [10], and even nanoprobes for the “off–on” sensing of biomolecules [11].
Top-down methods are fragmentation of large carbon materials by chemical oxidation, arc discharge, laser erosion, electrochemical, hydrothermal exfoliation processes, whereas the carbonization of molecular precursor materials by hydrothermal/solvothermal, pyrolysis and microwave treatments are called bottom-up methods which have been used in the synthesis of CDs [12,13]. Among these synthesis processes, microwave-assisted synthesis is a rapid, ecofriendly, low cost, and a tunable technique because of its one pot nature and quick synthesis and is an inexpensive process in comparison to the other methods [14].
To improve the physical and chemical properties as well as biological effects, CDs have been doped with nitrogen (N), sulfur (S), boron (B), and phosphate (P) elements during preparation to obtain N-, S-, B-, and P-doped CDs [8]. Among these efforts, N-doping seems to have more advantages as the chemical and biological activity can be effectively improved as well as catalytic activity [15], surface reactivity, and antimicrobial activity [16,17]. Especially, amino acids are encouraging precursor materials in the synthesis of N-doped CDs because of their non-toxic, biocompatible, and ecofriendly nature and also can give improved optical and chemical properties to the CDs. In the literature, many N-doped CD derivates from amino acids including arginine, lysine, cysteine, histidine, methionine, tyrosine as green natural sources have been reported [14,18,19,20,21,22,23]. Some of these studies reported that amino acid-based CDs possess encouraging antimicrobial properties [14,22].
Microorganisms can develop resistance to the existing antiviral, antifungal, and antibacterial drugs because of excessive use. These drug resistant new types of microorganism can threaten human health causing serious illness. For many years, metal NPs (MNPs) have been the most preferred antibacterial nanomaterials against pathogens for the treatment of infections. Furthermore, MNPs have been also employed in a wide range of applications including textile products and surface coating of goods, doors and windows, hospital, and consumables goods and so on [23,24]. CDs have attracted a great deal of attention as antimicrobial materials due to their nanometer size, fluorescence ability, facile preparation, perfect biocompatibility, and low toxic effect on human cells and so on [25]. Herein, we report the preparation and use of metal NP containing N-doped CD composites as potent antibacterial nanomaterials. The N-doped CDs were prepared from natural sources, arginine (Arg) that is an amino acid as nitrogen provider and citric acid as a carbon source through a low-cost and rapid microwave-assisted technique. Moreover, the N-doped Arg CD was used as a template for the in-situ preparation of Ag and Cu NPs to combine the extraordinary properties of N-doped CDs and metal NPs. The CDs were characterized with high resolution-transmission electron microscopy (HR-TEM), dynamic light scattering (DLS) and zeta potential measurements, FT-IR spectroscopy, X-ray diffraction (XRD), UV-Vis and fluorescence spectroscopies. Furthermore, the antibacterial properties of Arg CDs, Arg-Ag CDs, and Arg-Cu CDs were investigated against Gram positive S. aureus and Gram negative E. coli bacterial strains employing disc diffusion and microtiter broth dilution test methods. Acetylcholinesterase (AChE, E.C. 3.1.1.7) is one of two cholinesterase enzymes that exist in many signal and/or current conducting tissues such as nerves, muscle, central and peripheral tissues, motor and sensory fibers, and cholinergic and noncholinergic fibers. The inhibition of AChE enzyme prevents the cholinesterase enzyme from breaking down acetylcholine (ACh), increasing both the level and duration of the neurotransmitter action in Alzheimer’s disease, a progressive neurological disorder, and a common form of dementia. The disease is characterized by memory loss and loss of other intellectual abilities. This disease is associated with loss of cholinergic neurons in the brain and a decreased level of ACh. The major therapeutic target in Alzheimer’s treatment approaches is the inhibition of brain AChE [26,27,28]. Additionally, in Alzheimer’s and other neurologic diseases, the high level of dyshomeostatis of metal ions, especially iron ions, seriously affects brain function. Oxidative stress and neurodegeneration can cause metal extremism. Therefore, chelating agents that can bind with the excess metal ions are also recommended as one of the therapeutic treatments for Alzheimer’s disease. However, the blood–brain barrier and toxicity of common chelators restrain their usability. Therefore, it is stated that nanoparticles which possess chelating capability with iron ions can be adsorbed in apolipoprotein and apolipoprotein A-I, and incubated in human plasma that would facilitate transport into and out of the brain via mechanisms used for transporting low-density lipoprotein [29]. So, the accumulation of Fe(II) due to Alzheimer’s or other neurologic diseases in the brain necessitates its removal with the ability to overcome the blood–brain barrier. Consequently, the utilization of nanoparticles to transport chelators and chelator–metal complexes in both directions across the blood–brain barrier could be safer and be more effective for chelation treatment in Alzheimer’s disease and other neurodegenerative diseases [29]. For these reasons, the chelating capability of the prepared Arg CDs, Arg-Ag CDs, and Arg-Cu CDs were measured for Fe(II) ions.
2. Materials and Methods
2.1. Materials
L-Arginine (Arg, >98%, Alfa Aesar, Ward Hill, MA, USA), citric acid monohydrate (CA, >99%, Fisher, Hampton, NH, USA), silver nitrate (AgNO3, >99%, Sigma Aldrich, St. Louis, MO, USA), copper (II) sulfate pentahydrate (CuSO4·5H2O, >98%, ACS reagent, Sigma Aldrich), sodium borohydride (NaBH4, 99%, VenPureTM SF granules, Acros Organics, Fair Lawn, NJ, USA), gentamicin sulfate (Acros Organics, Fair Lawn, NJ, USA), acetylcholinesterase (AChE from electric eel Electrophorus electricus, Type VI-S, 200–1000 units/mg protein, Sigma Aldrich), bovine serum albumin (BSA, Fisher Scientific) 5,5-dithiobis(2-nitrobenzoic acid) (DTNB, 98+%, TCI America, Portland, OR, USA), acetylthiocholine iodide 98+%, TCI America), 5,6-diphenyl-3-(2-pyridyl)-1,2,4-triazine-4,4′-disulfonic acid disodium salt hydrate (ferrozine, 98%, Alfa Aesor), iron(II)sulfate heptahydrate (99%, ACS reagent, Acros Organics) and Tris(hydroxymethyl)aminomethane hydrochloride or Trizma® hydrochloride (Tris-HCI, Sigma, USA) were used in buffer solution preparations. Magnesium chloride hexahydrate (MgCl2·6H2O, Fisher Scientific, USA), and Sodium Chloride (NaCl, Fisher Scientific, USA) were used in the preparation of the corresponding solutions. Nutrient agar and nutrient broth were also obtained from Fisher Scientific. Escherichia coli ATCC 8739 (KWIK-STIKTM) and Staphylococcus aureus ATCC 6538 strains (KWIK-STIKTM) were purchased from Microbiologics. All solvents: acetone and ethanol were of analytical grade, which were obtained from Fisher Scientific. The ultrapure water, distilled water (DI) nearly 18.2 M.Ω.cm which was used in the preparation of all aqueous solutions was prepared using a Millipore-Direct Q UV3 system in our laboratory.
2.2. Synthesis of Arg CDs
The Arg CDs was synthesized by the microwave technique using citric acid as a carbon source and arginine as a N source in accord with the previous report with some modifications [14]. First, 0.6 g citric acid was dissolved in 3 mL of DI water and 0.3 g Arg was added into this solution. This solution was mixed at 500 rpm for 30 min, then the solution was put in a microwave operating at 1000 W for 2 min. The prepared solid Arg CDs were re-suspended in 10 mL DI water and sonicated for a few seconds. This solution was filtered through a 0.22 µm-pore filter and purified using a dialysis membrane against excess amounts of DI water to remove unreacted chemicals. The Arg CDs were collected by precipitation in an excess amount of acetone and using a centrifuge at 10,000 rpm for 10 min, and washed with acetone at least three times by centrifugation at 1000 rpm for 10 min. Finally, the obtained Arg CDs were dried in an oven at 50 °C and placed into a closed container for further use.
2.3. Preparation of Composite Arg-Ag CDs and Arg-Cu CDs
To prepare metal nanoparticles such as Ag and Cu containing Arg CDs, 0.5 g of CDs were suspended in 10 mL of 1000 ppm silver nitrate or copper sulfate solutions to load the corresponding metal ions into the CDs. Then, these metal ion adsorbed CDs were washed with water by centrifugation (10,000 rpm) for 10 min and then treated with 20 mL 0.05 M NaBH4 solution for 2 h to reduce adsorbed metal ions to their nanoparticle forms. This mixture was precipitated in an excess amount of ethanol and washed with acetone twice by means of a centrifuge at 10,000 rpm for 10 min. Next, the Ag and Cu NPs containing Arg-Ag CD and Arg-Cu CD composites were dried in an oven at 50 °C and stored in closed-tubes for further use.
2.4. Characterization of Arg Based CDs
Morphological size and crystal structure of Arg based CDs were determined using a transmission electron microscope (TEM, Tecnai TF-20) at 200 kV. Lacey carbon support film on 200–300 mesh copper TEM grid was used in the sample preparation. The particle size of Arg CDs was analyzed by dynamic light scattering (DLS, Nanobrook Omni, Brookhaven Instrument (BI), Holtsville, NY, USA). The DLS measurements were carried out for 10 mg of Arg CD suspended into 10 mL of 10 mmol KNO3 in DI water after sonicating for a few seconds. Zeta potential measurements of Arg CDs from pH 2 to pH 10 were performed using a BI-ZTU automatic titrator attached to the Nanobrook Omni Brookhaven Instrument. The isoelectronic point (IP) of the Arg CDs was determined from the zeta potential versus pH graphs. The functional group of Arg CDs was confirmed by FT-IR spectra (Nicolet iS50, Thermo Scientific, Waltham, MA, USA) in a 500 to 4000 cm−1 wavelength range using the attenuated total reflection (ATR) technique. Photoluminescence spectra of Arg CDs was measured using a Lumina Fluorescence Spectrometer (Thermo Scientific) instrument in the range of 350–600 nm wavelength at a 345 nm excitation wavelength. The intensity of absorption peaks of Arg based CDs was recorded by a UV-Vis spectrophotometer (T80+UV/Vis spectrometer, PG Instrument Ltd. England, Lutterworth, UK) from 270 to 800 nm. X-ray diffraction (XRD) analysis of the Arg based CDs was performed via a Bruker D8 Advance diffractometer in the scanning range of 5°–80° (2θ) using a Cu Kα X-ray source (40 kV, 40 mA) at a 1.5418 Å wavelength.
2.5. Antibacterial Properties of Arg Based CDs
The antimicrobial activity of Arg based CDs was investigated using disc diffusion and microtiter broth dilution methods against S. aureus ATCC 6538 and E. coli ATCC 8739.
2.5.1. Disc Diffusion Assay
Bacteria stock suspension was adjusted according to the McFarland 0.5 standard at 0.5 × 10⁸ CFU/mL. Then, 0.1 μL of this bacteria suspension was inoculated on an agar plate and then, 10 × 10 mm sterile discs were placed on the plate and immediately a 50 μL of 200 mg/mL concentration of Arg CD suspension in phosphate buffer solution (PBS) was dropped onto the discs. As a control, 20 μL of 50 mg/mL of gentamicin sulfate solution in PBS was used. The plate was incubated at 35 °C for 18–24 h and the clear zone around the disc was measured and expressed as mm of inhibition zone.
2.5.2. Microtiter Broth Dilution Assay
Different concentrations of Arg CDs were suspended in liquid growth media as nutrient broth (NB) between 0.0625 and 50 mg/mL and 100 μL of this suspension was placed in a sterile 96 well plate. As a positive and negative control, NB solution without the sample and gentamicin (as control) dissolved in NB was placed into the same 96 well plate. Bacteria stock suspension was adjusted according to the McFarland 0.5 standard at nearly 0.5 × 10⁸ CFU/mL, and 5 μL of this bacteria suspension was added to each well. This plate was incubated at 35 °C for 18–24 h, and the absorbance values of the plate before and after incubation were measured at 600 nm using a microplate reader (Multiskan Sky) to evaluate the inhibition % of bacteria growing. Minimum inhibition concentration (MIC) value of Arg CDs was determined as the lowest concentration for no visible growing. Then, 100 μL of each suspension was inoculated on solid agar plates and incubated in the same conditions. After 18–24 h, the minimum bactericidal concentration (MBC) value was determined as the lowest concentration of the samples that totally kills the bacteria.
2.6. Acetylcholinesterase (AChE) Inhibitor Assay
AChE (EC 3.1.1.7) inhibition was calculated based on Ellman’s method with some modification [30]. Arg CD, Arg-Ag CD, and Arg-Cu CD solution at 20 mg/mL concentration was prepared at pH 8 in Tris -HCI buffer and diluted at 10,000, 5000, 2500, and 1250 µg/mL concentrations. Then, 140 µL Tris-HCI buffer, 50 mM at pH 8, 20 µL of 3 mM 5,5-dithiobis (2-nitrobenzoic acid) (DTNB) in 50 mM Tris-HCI buffer containing 0.02 M MgCl2, and 0.1 M NaCl solution, and 20 µL enzyme AChE (total enzyme 0.022 unit/mL) in 0.1% BSA solution were added to the 96-well plate. Then, 20 µL of the sample solution at different concentrations was added to the enzyme mixture. After 10 min, the plate was measured at 405 nm using a microplate reader (Multiskan Sky). Next, 20 µL of 7.5 mM acetylthiocholine iodide as substrate was added to the each well and the measurement of the plate was done at 405 nm again after 20 min. Tris buffer without the sample was used as a blank and each experiment was done in triplicate. Inhibition% of AChE enzyme was calculated using Equation (1).
2.7. Fe Chelating Activity
Fe(II) chelating activity was determined according to the literature [31,32]. An Arg based CD particle suspension at 2000 µg/mL stock solution was prepared and diluted to 666, 333, 166.5, 83.3 µg/mL with DI. From these solutions, 140 µL was put into the well plate. Next, 20 µL of 1 mM Fe(II) solution was added to each one these wells and the absorbance values were measured at 562 nm. Following the addition of 40 µL ferrozine of 2 mM, the total solution volumes were completed to 200 µL and the final concentration of CD materials were 1400, 466, 233,116.5, 58.3, 29.1 µg/mL. The plate was measured at 562 nm using a microplate reader (Multiskan Sky). Then, 40 µL of 2.5 mM ferrozine aqueous solution was added to each well. After 4 min, this plate was measured at 562 nm again using a microplate reader. DI water without the sample was used as a blank. Each experiment was done in triplicate. The results were given as µmol Fe(II) chelating activity% and calculated using Equation (2).
3. Results
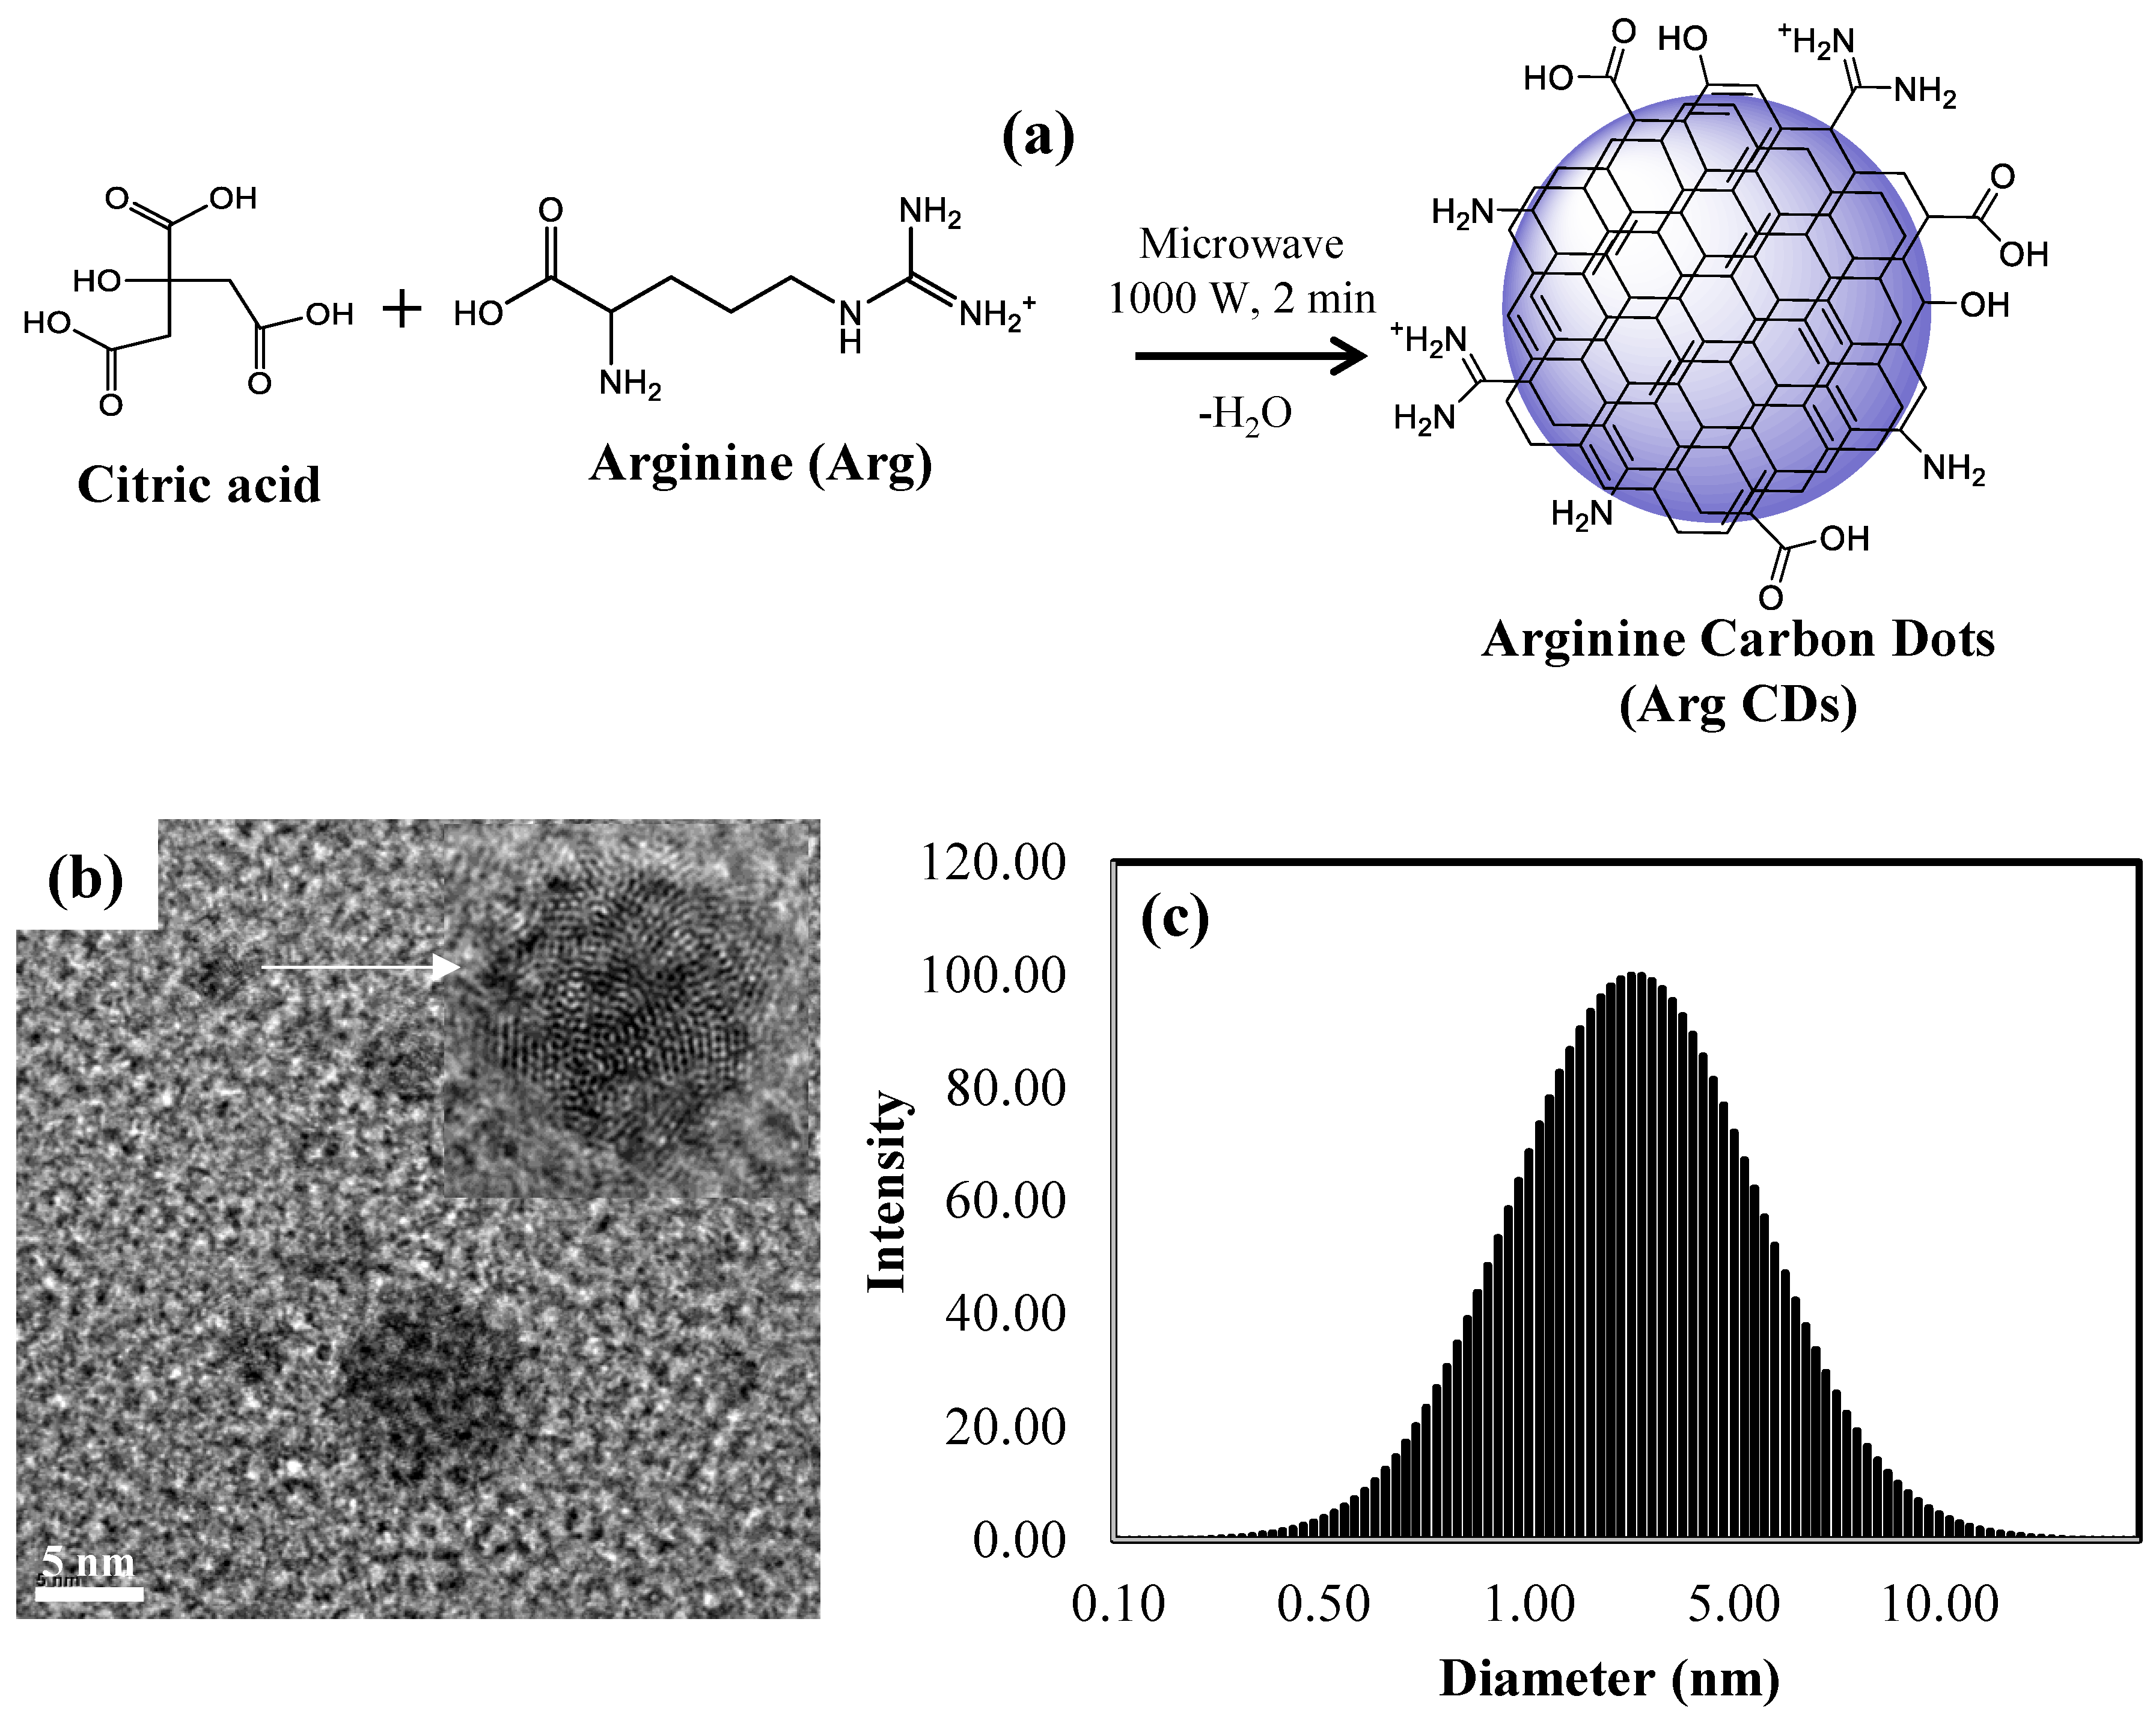
The Arg CDs were readily prepared through single-step microwave synthesis using citric acid and Arg aqueous solution. During the synthesis of Arg CDs, citric acid as a carbon source was reacted with the amine and/or carboxylic acid groups of Arg amino acid as a nitrogen (N) source under microwave irradiation at 1000 W, and the corresponding synthesis scheme is shown in Figure 1a.
These N-doped Arg CDs were produced in a short reaction time within 2 min via microwave treatment. It was confirmed with the literature that N-doped CD derivates from citric acid and amino acid precursors are a graphitic crystalline structure [18]. The TEM image verified that Arg CDs are in spherical shape with sizes ranging from 1 to 10 nm as shown in Figure 1b. In addition, the high resolution HR-TEM image revealed that the lattice spacing of the Arg CD is about 0.28 nm referring to the (002) facet of graphite that states that Arg CDs are graphitic carbon nano materials. The size distribution of Arg CDs was also measured by DLS. As shown in Figure 1c, this distribution of Arg CDs in aqueous solution is in agreement with the TEM images as the particle sizes are in the 0.5–10 nm range with an average size of 2.8 ± 0.85 nm. The small size of Arg CDs up to 1 nm was not very clearly visualized by TEM images because of the smaller number of particles at these sizes.
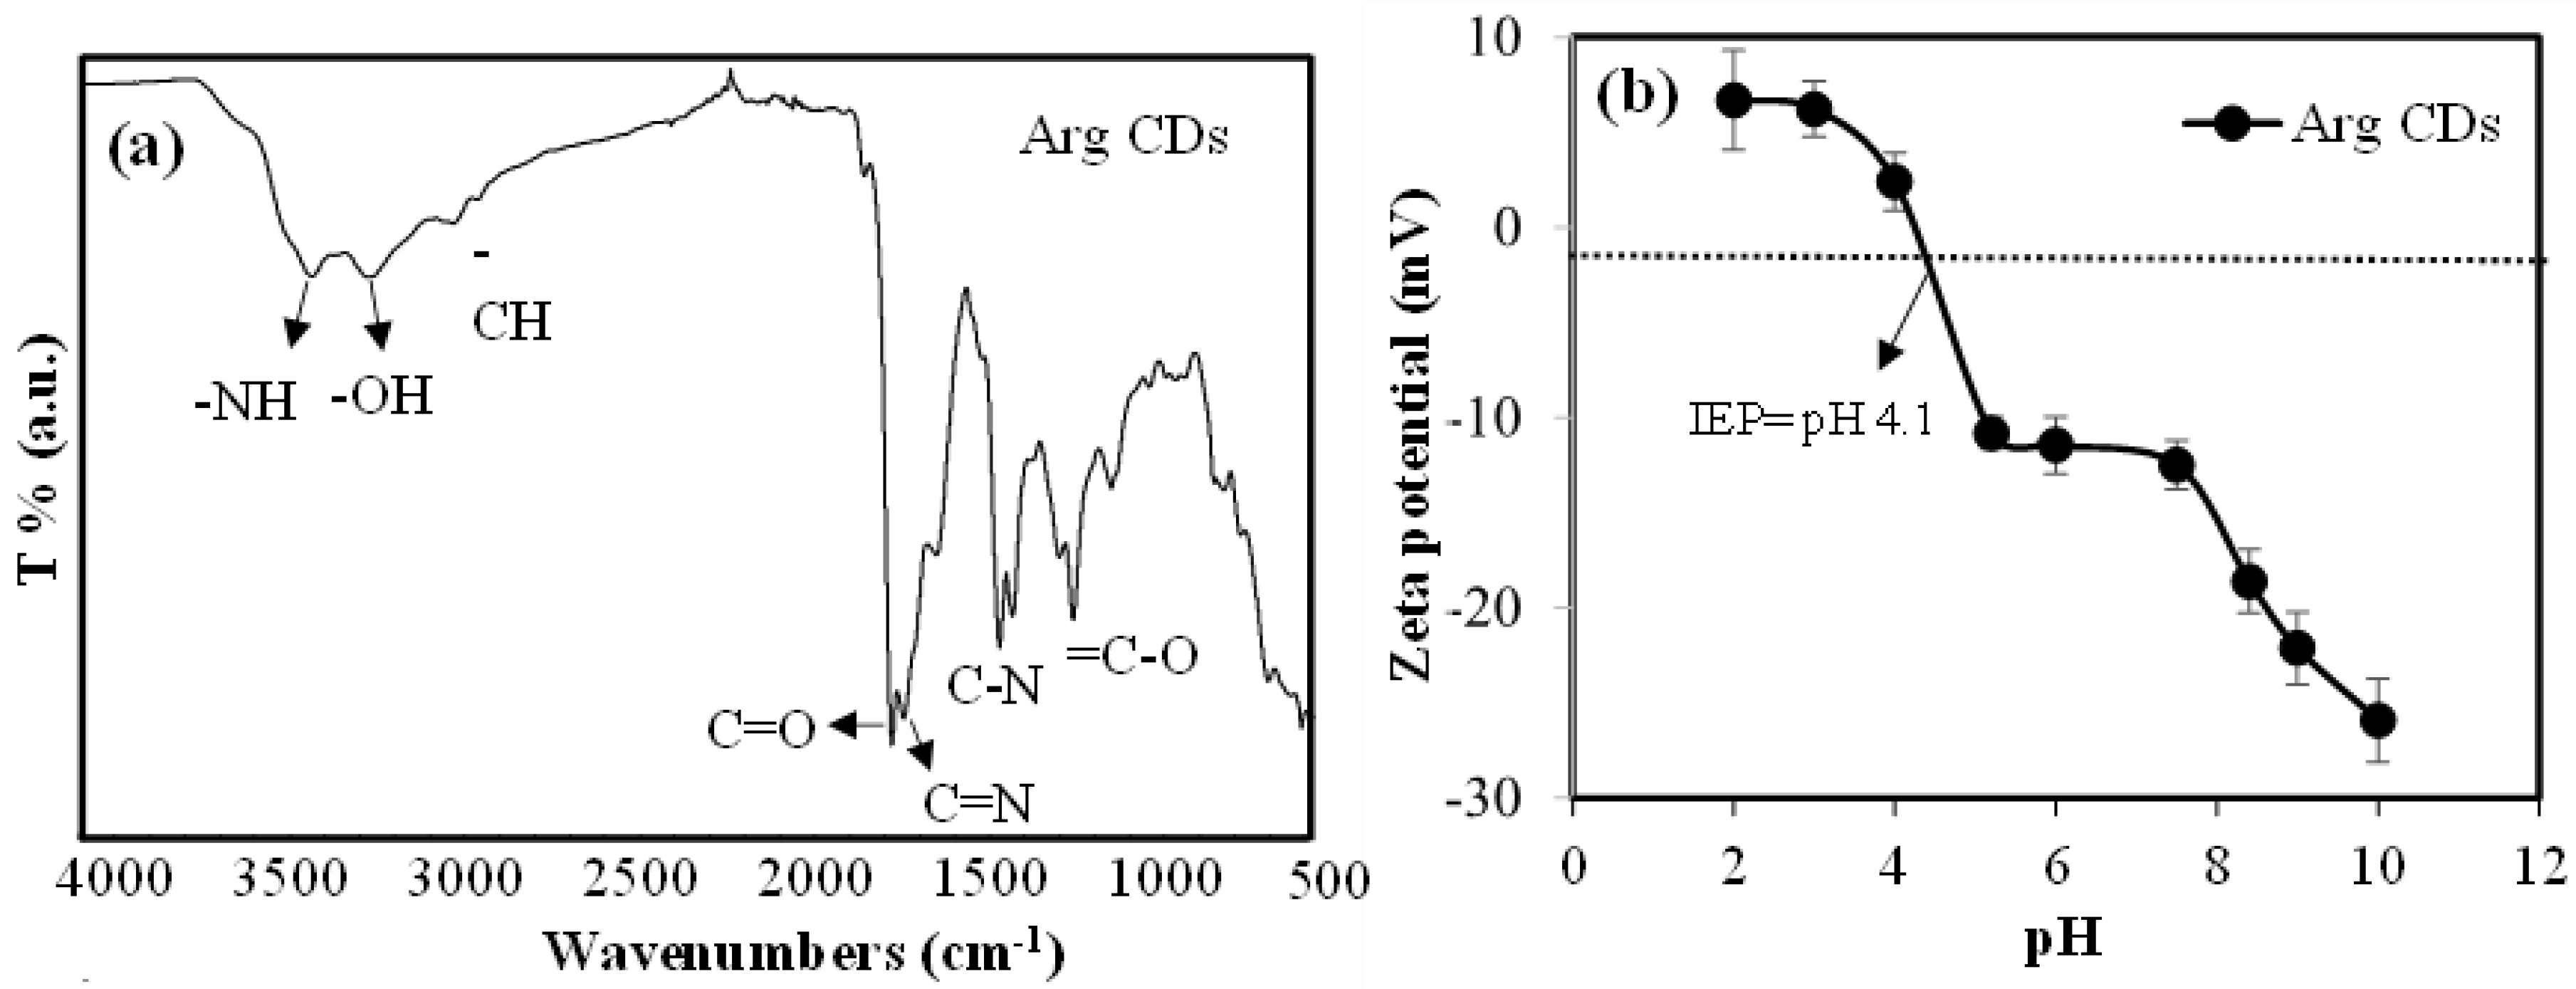
Surface functionality of Arg CDs was determined by FT-IR spectroscopy and zeta potential measurements at different pH conditions as illustrated in Figure 2a,b, respectively.
The FT-IR spectrum of Arg CDs revealed that the surface of the CD contains various types of functional groups. For example, the broad peaks at 3350 and 3190 cm−1 correspond to N-H and O-H stretching coming from the hydroxyl, carboxylic acid, and amine groups. The specific peaks at 1696 and 1665 cm−1 belong to C=O stretching vibration and a C=N stretching pattern attributed to the presence of carboxylic acid and cationic amine groups of arginine. In addition, the peaks at 1395 and 1357 cm−1 can be assigned to C-N stretching vibration, and peaks at 1226 and 1188 cm−1 can be assigned to =C-O stretching vibration in the molecular structure. All these peaks showed that N doped-Arg CDs have many functional groups including -OH, -NH2, and -COOH corresponding to the schematic representation of Arg CDs in Figure 1a.
The surface properties of Arg CDs were also determined by zeta potential measurements at different pH conditions from pH 2 to 10 as illustrated in Figure 2b. As can be seen, Arg CDs are positively charged up to pH 4, and then the zeta potential gradually decreases to negative values between pH 5 and 10. Accordingly, the isoelectric point (IEP) of Arg CDs was found to be pH 4.1 where the zeta potential value of zero is at this pH. The isoelectric point of Arg amino acid was reported as about pH 10.8 because of the existence of basic amine groups in the structure [33]. The IEP of Arg decreasing to pH 4.1 suggests that the amine groups of Arg reacted with carboxylic acid groups of citric acid during the graphitic Arg CD formation.
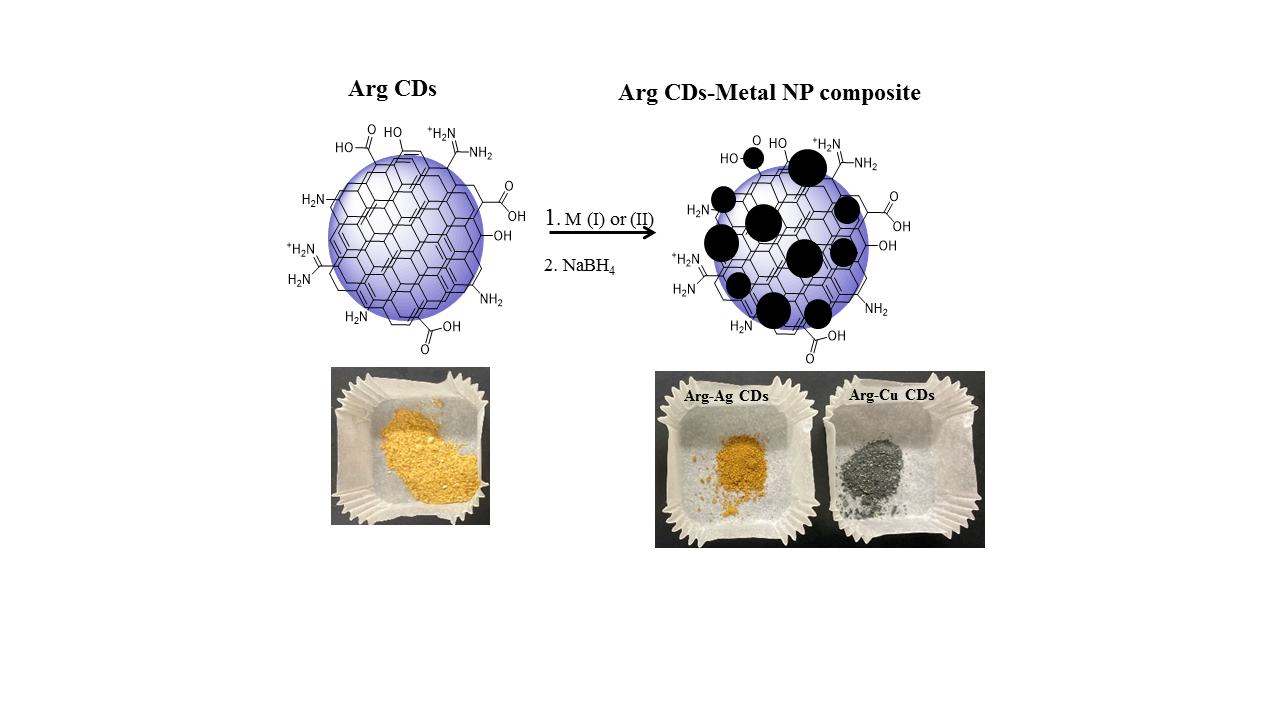
To impart additional functionality such as improved antibacterial capability, Arg CDs, metal nanoparticle containing forms of CDs such as composite Arg-Ag CDs and Arg-Cu CDs were prepared using Ag(I) and Cu(II) ions via the preparation scheme illustrated in Figure 3a. Because of the various surface groups, Arg CDs have strong affinity for metal ions, i.e., Ag(I) and Cu(II). These metal ions can be readily adsorbed onto the Arg CD network via electrostatic interaction in an aqueous solution and then can be reduced by employing a well-known reducing agent, NaBH4 to the corresponding zero valent metal NP forms, i.e., Ag NPs and Cu NPs. The digital camera images of Arg CDs and the corresponding MN composites are shown in Figure 3a.
As can be seen in the images, the yellow color of bare Arg CDs turned to tawny-brown and grey colors upon MNP attachment for the composite Arg-Ag CDs and Arg-Cu CDs, respectively. These color changes indicate the presence of metal NPs into the CD structure. The morphology, size distribution, and d spacing of Arg CDs and its Ag and Cu NP containing composites were visualized through TEM images and are shown in Figure 3b. As can be seen in the images, bare Arg CDs are of a spherical shape with sizes ranging between 1 and 10 nm. As indicated in the HR-TEM images, the Arg CDs have 0.28 nm d spacing due to the (002) facet of graphite [34]. In addition, composite Arg-Ag CDs and Arg-Cu CDs have a maximum CD network of 10 nm embedding about 5 nm Ag NPs or Cu NPs which is visualized in the TEM images. It is apparent that Ag NPs and Cu NPs have lattice spacing of 0.23 nm and 0.20 nm, respectively, referring to (111) planes for both Ag NPs and Cu NPs [34].
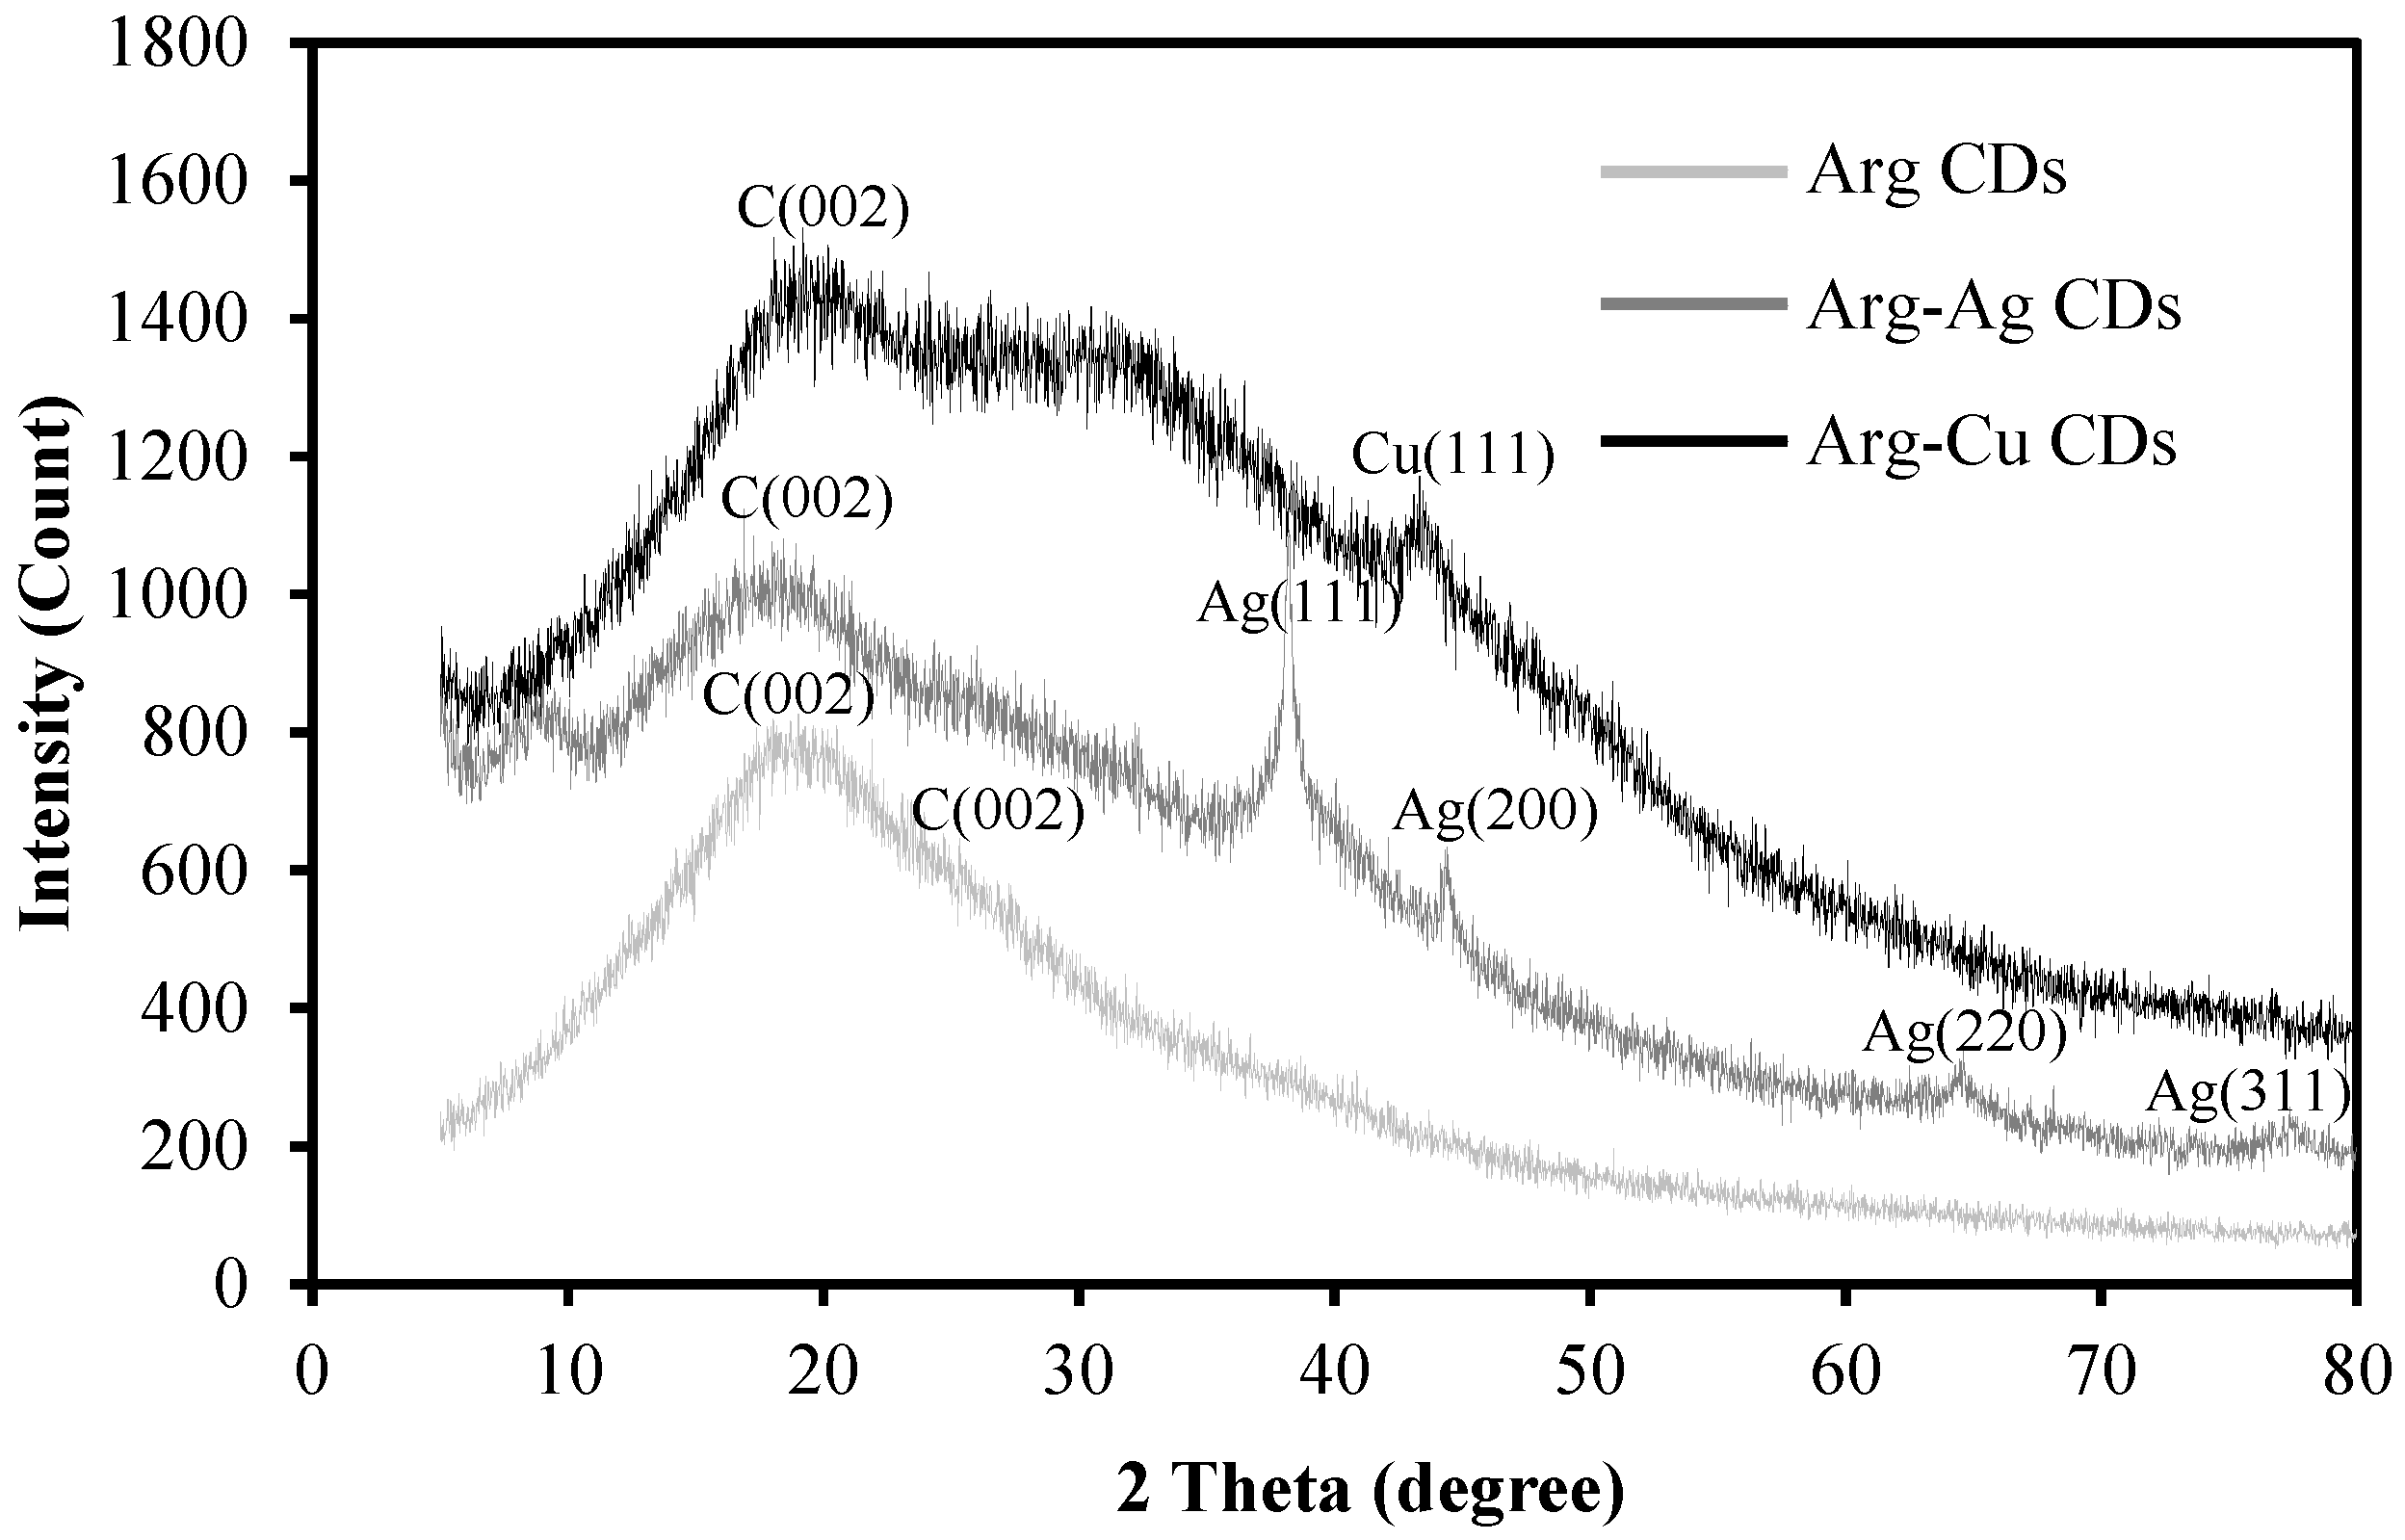
XRD patterns of the Arg CD and its Ag and Cu NP containing composite are shown in Figure 4.
The broad diffraction peak in the 10–40° region shows the absence of long-range crystallinity and a disordered carbon structure. The maxima at nearly 19.3° and the slight shoulder peak at 26.2° are attributed to a nanocrystalline graphite d(002) plane at 0.34 nm interplanar spacing [18]. Four different characteristic diffraction peaks of Arg-Ag CDs were observed at 38.1°, 44.5°, 64.5°, and 77.3° with d(111), (200), (220), and (311) planes at 0.235, 0.205, 0.145, and 0.123 nm interlayer spacing, respectively, corresponding to Ag NPs in the structure [35], whereas one peak at 43.4° with a d(111) plane at 0.208 nm interlayer spacing was obtained for Arg-Cu CDs similar to the Cu NPs [36].
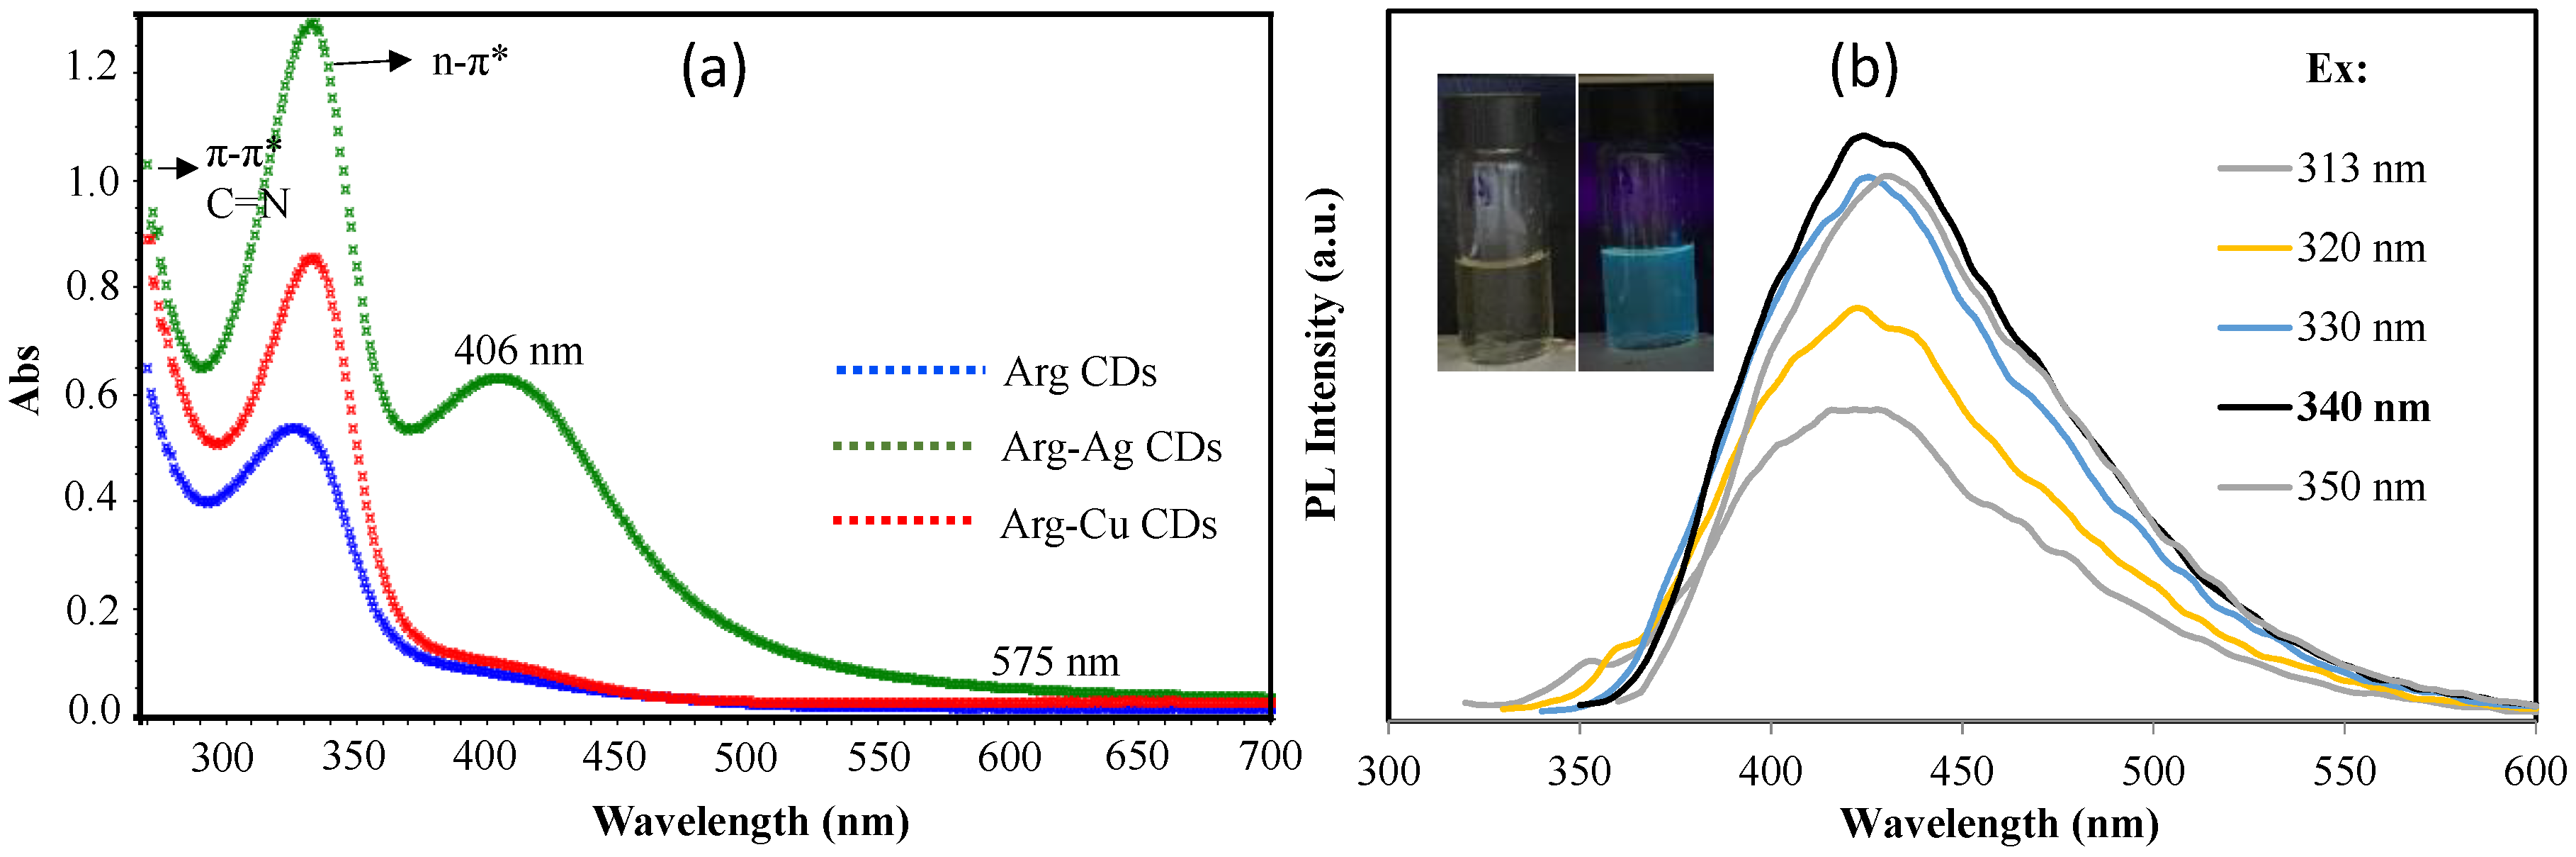
The UV-Vis spectrum of Arg based CDs in aqueous solution was measured, and the absorption spectra in the range of 270–800 nm wavelength are presented in Figure 5a.
The peaks at λmax 270 nm are attributed to π-π* transition of the surface state containing C=N groups of Arg CDs, which were observed for all samples. In addition, the broad absorption band between 300–370 nm was obtained also for all types of Arg CDs corresponding to the n-π* transition of surface functional groups [8]. Some studies reported that this broad absorption band shows the strong fluorescence properties of the materials, and results from the trapping of excited state energy by the surface state [14] and nitrogen-rich material surface [18]. Arg-Ag CD composites have an additional strong absorption peak at a 406 nm wavelength which is a typical absorption peak of Ag NPs [35]. Similarly, a slight shoulder peak at 575 nm for Arg-Cu CDs is a result of the localized surface plasmon resonance absorption band of the Cu nanoparticles [37].
The optical properties of Arg CDs were also determined by fluorescence spectroscopy and digital camera images of the Arg CD suspension in water under day light and UV light as shown in Figure 5b. It is clear that the Arg CD suspension displays slight yellow-colored solution under day light but a blue fluorescence emission under a 254 nm UV excitation. The Arg CDs exhibit strong blue fluorescence at 425 nm maximum wavelength with the variation of the excitation between 310 and 350 nm and the highest photoluminescence (PL) intensity was obtained at a 340 nm excitation wavelength.
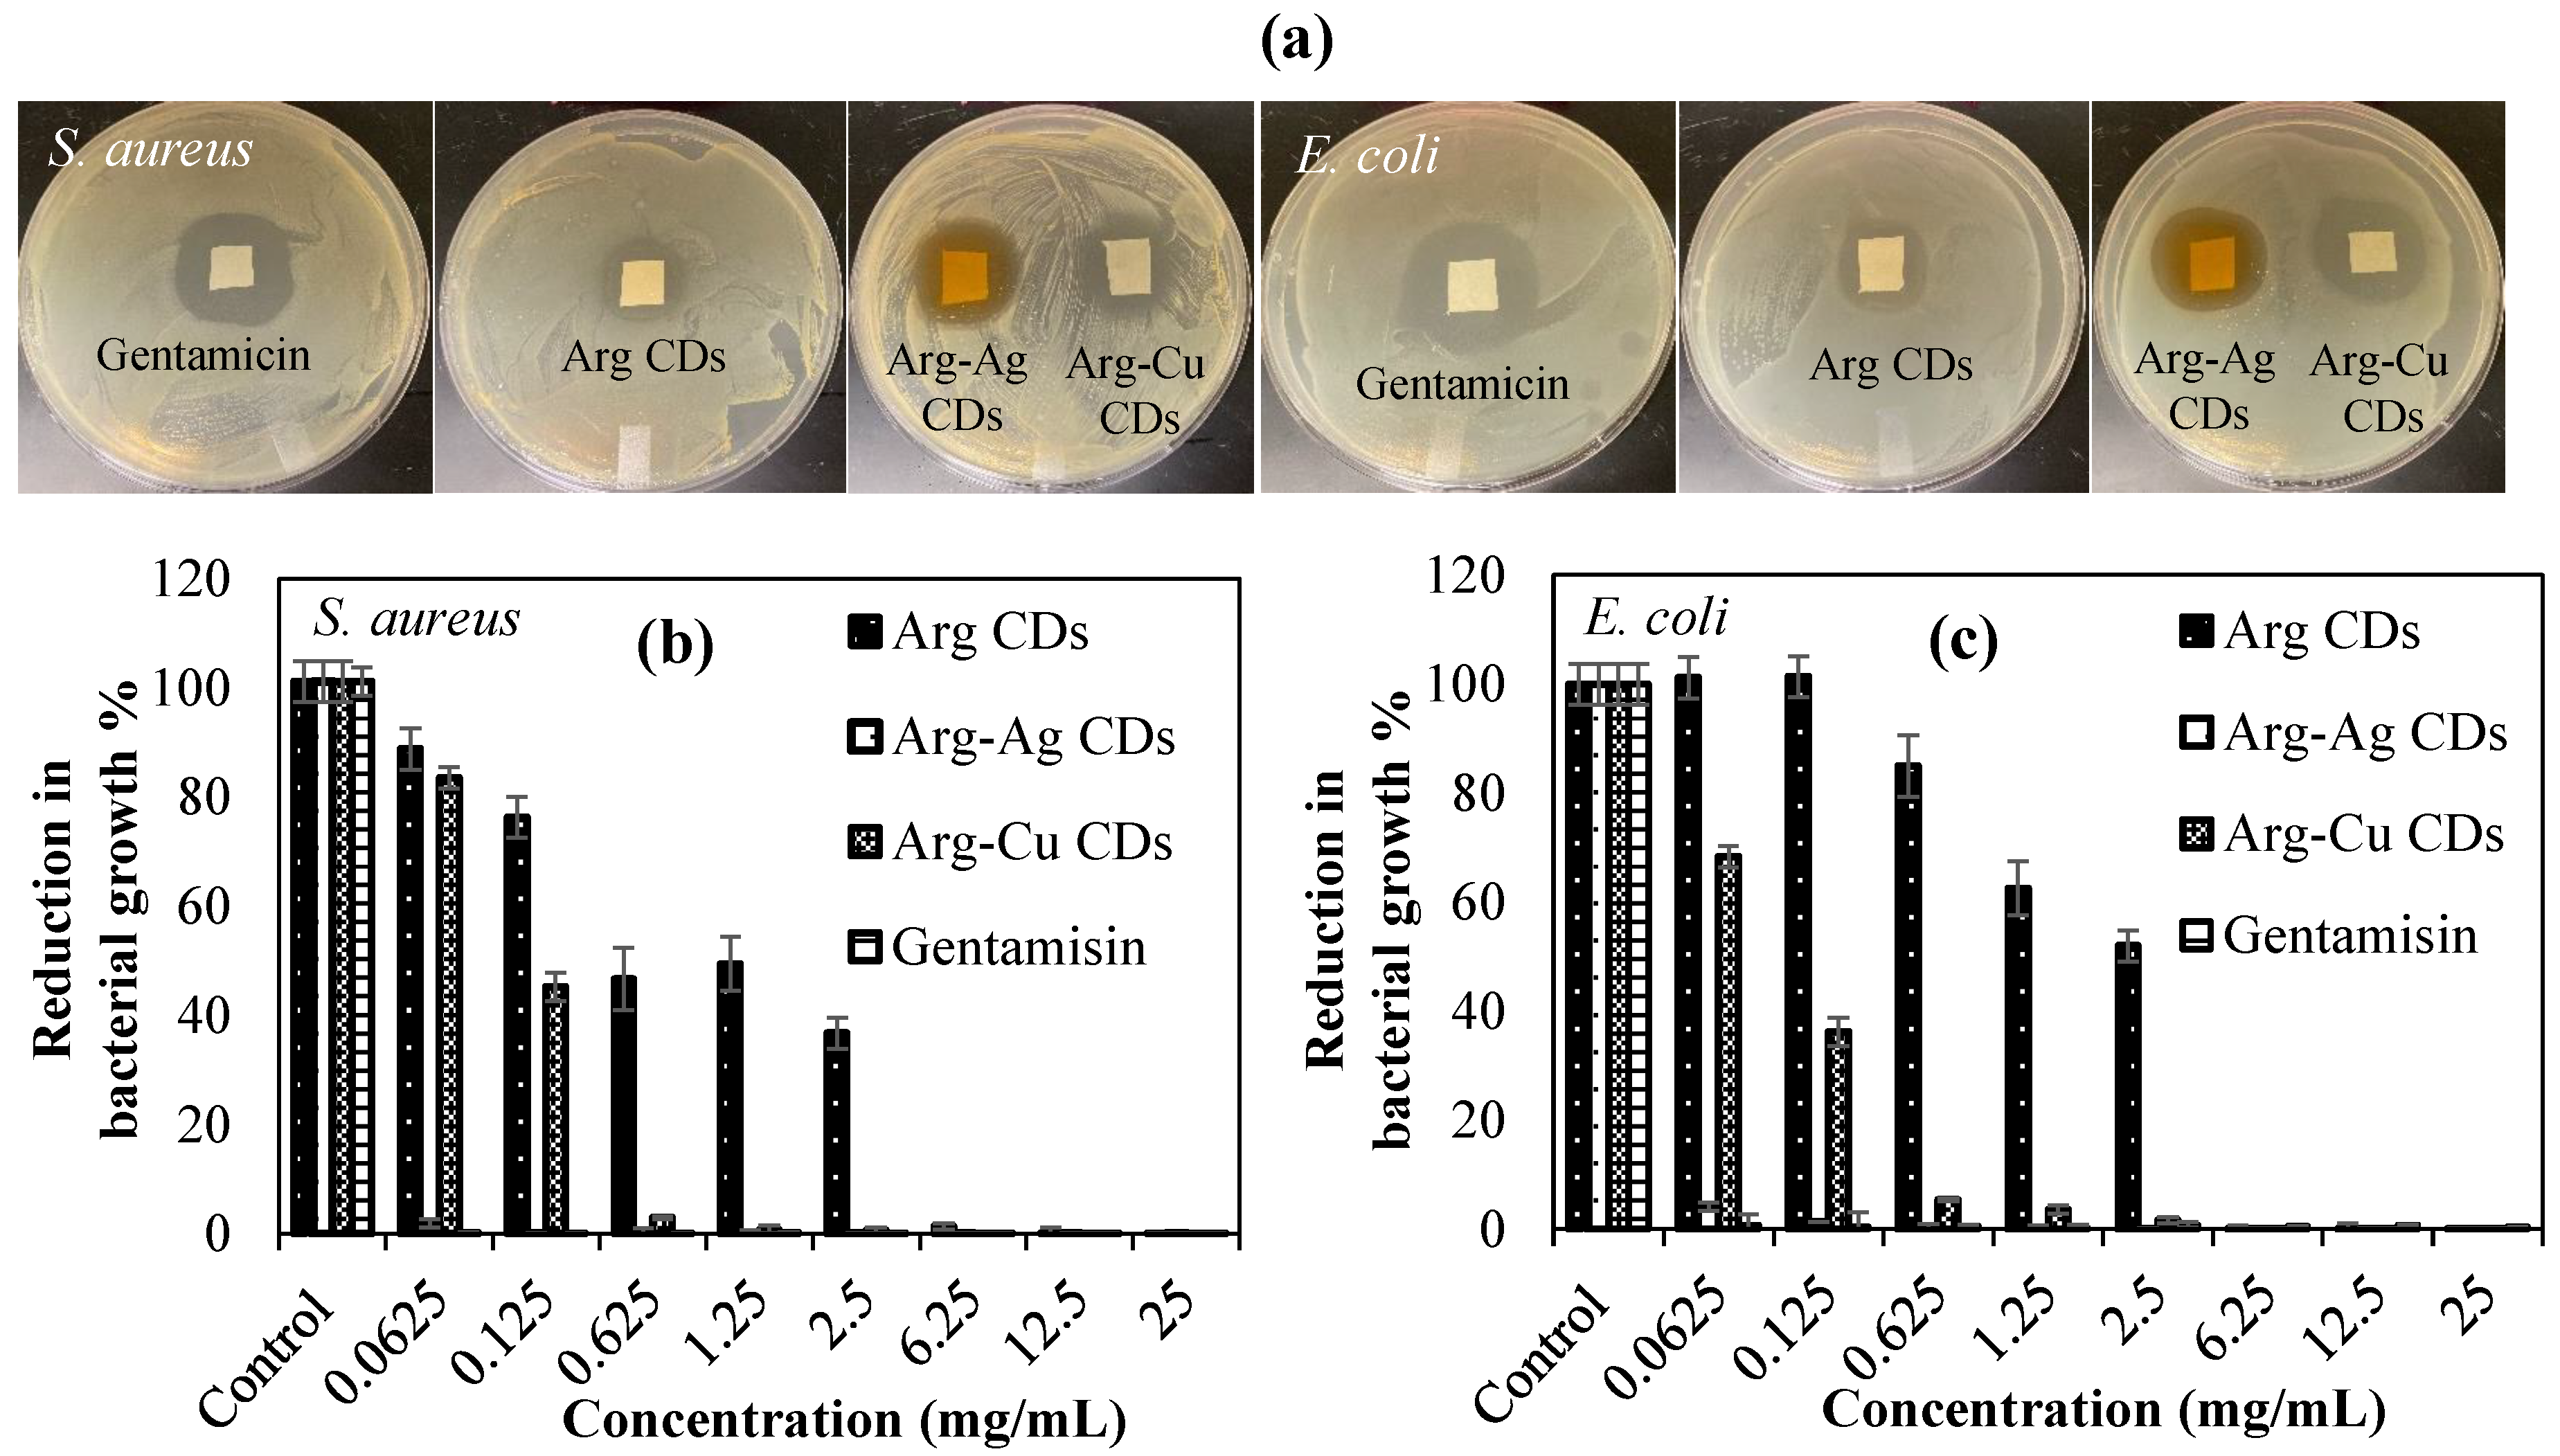
Antibacterial susceptibility of Arg CDs and their metal NP containing composite forms were investigated using disc diffusion and microtiter broth dilution tests against Gram positive S. aureus ATCC 6538 and Gram negative E. coli ATCC 8739 bacteria strains. Results are given in Figure 6 and summarized in Table 1.
According to the disc diffusion method, Arg CDs have an effective inhibition for S. aureus and E. coli species with 16 ± 1 and 21 ± 2 mm inhibition zone diameters, respectively. It is clear that positively charged Arg CDs were found to be more effective against Gram negative E. coli, which can be attributed to the strong interaction towards the Gram negative bacteria membrane. In addition, inhibition zones for Arg-Ag CDs and Arg-Cu CDs were significantly increased to 24 ± 1 and 22 ± 1 mm against S. aureus, and 25 ± 1 mm for both against E. coli. These results clearly show that 10 mg Arg based CDs possess about the same antibacterial effects of 1 mg gentamicin (antibiotic) indicative of their potential biomedical use as antibacterial material. Results of the other antimicrobial test, microtiter broth dilution, the inhibition of bacteria growth% of Arg based CDs against S. aureus and E. coli are presented in Figure 6b,c, and the minimum inhibition concentration (MIC) and minimum bactericidal concentration (MBC) values are listed in Table 1.
It was found that Arg CDs inhibited S. aureus growth between 0.0625 and 2.5 mg/mL concentrations from values of 88% to 36% and totally killed at a 6.25 mg/mL concentration which is the MIC value and 12.5 mg/mL which is the MBC value. Almost the same inhibition effects were determined against Gram positive E. coli with 6.25 mg/mL MIC and 12.5 mg/mL MBC values for Arg CDs. Arg-Ag CD composites on the hand showed significantly enhanced antibacterial activity with 0.062 mg/mL MIC and 0.125 mg/mL MBC values against S. aureus, and 0.125 mg/mL MIC and 0.312 mg/mL MBC values against E. coli. Betancourt-Galindo et al. reported that Cu NPs can totally inhibit the bacterial growth of S. aureus at a 3.2 mg/mL concentration [36]. The antimicrobial activity of Arg-Cu CDs composites was significantly improved when compared with only Cu NPs. These results clearly demonstrate that the antibacterial susceptibility Arg CDs was considerably increased upon MNP embedding. The antibacterial potency of Arg-Cu CDs was less with lower MIC and MBC values than those of the Arg-Ag CD composite, but much more than that of bare Arg CD.
Alzheimer’s and neurotic disease are affecting elderly people, and the current medications approved by regulatory agencies such as the U.S. Food and Drug Administration (FDA) and the European Medicines Agency (EMA) are donepezil, rivastigmine and galantamine as reversible AChE inhibitors, and memantine as an N-methyl-D-aspartate (NMDA) receptor antagonist, Tacrine, which was the first of the AChE inhibitors approved in 1993. However, its use has been abandoned because of a high incidence of side effects including hepatotoxicity [27]. Consequently, the inhibition of AChE to treat the cognitive manifestations of Alzheimer’s disease to improve quality of life of the patients is of paramount significance. Therefore, assays for the inhibition of AChE enzyme activity% by Arg CDs, Arg-Ag CDs, and Arg-Cu CDs were carried out and the corresponding results are shown in Figure 7.
Conversely, Arg-Ag CDs and Arg-Cu CDs can inhibit the enzyme in a concentration dependent manner in which the inhibition activity of enzyme increases linearly with increase of both composite Arg CD concentrations. At an 18.2 mg/mL concentration of Arg-Ag CDs, 52.13% inhibition of AChE was measured whereas at the same concentration of Arg Cu CDs, 74.98% inhibition of AChE was attained. As a result, metal nanoparticles such as Ag and Cu within Arg CDs show the ability to inhibit AChE enzyme activity. These results are in good agreement with the literature, which show that Al and Cu nanoparticles inhibit the AChE enzyme [38]. Therefore, considering the smaller sizes of Arg CDs, this is an advantage to pass through the blood–brain barrier to open up opportunities for the treatment of neurodegenerative diseases such Alzheimer’s.
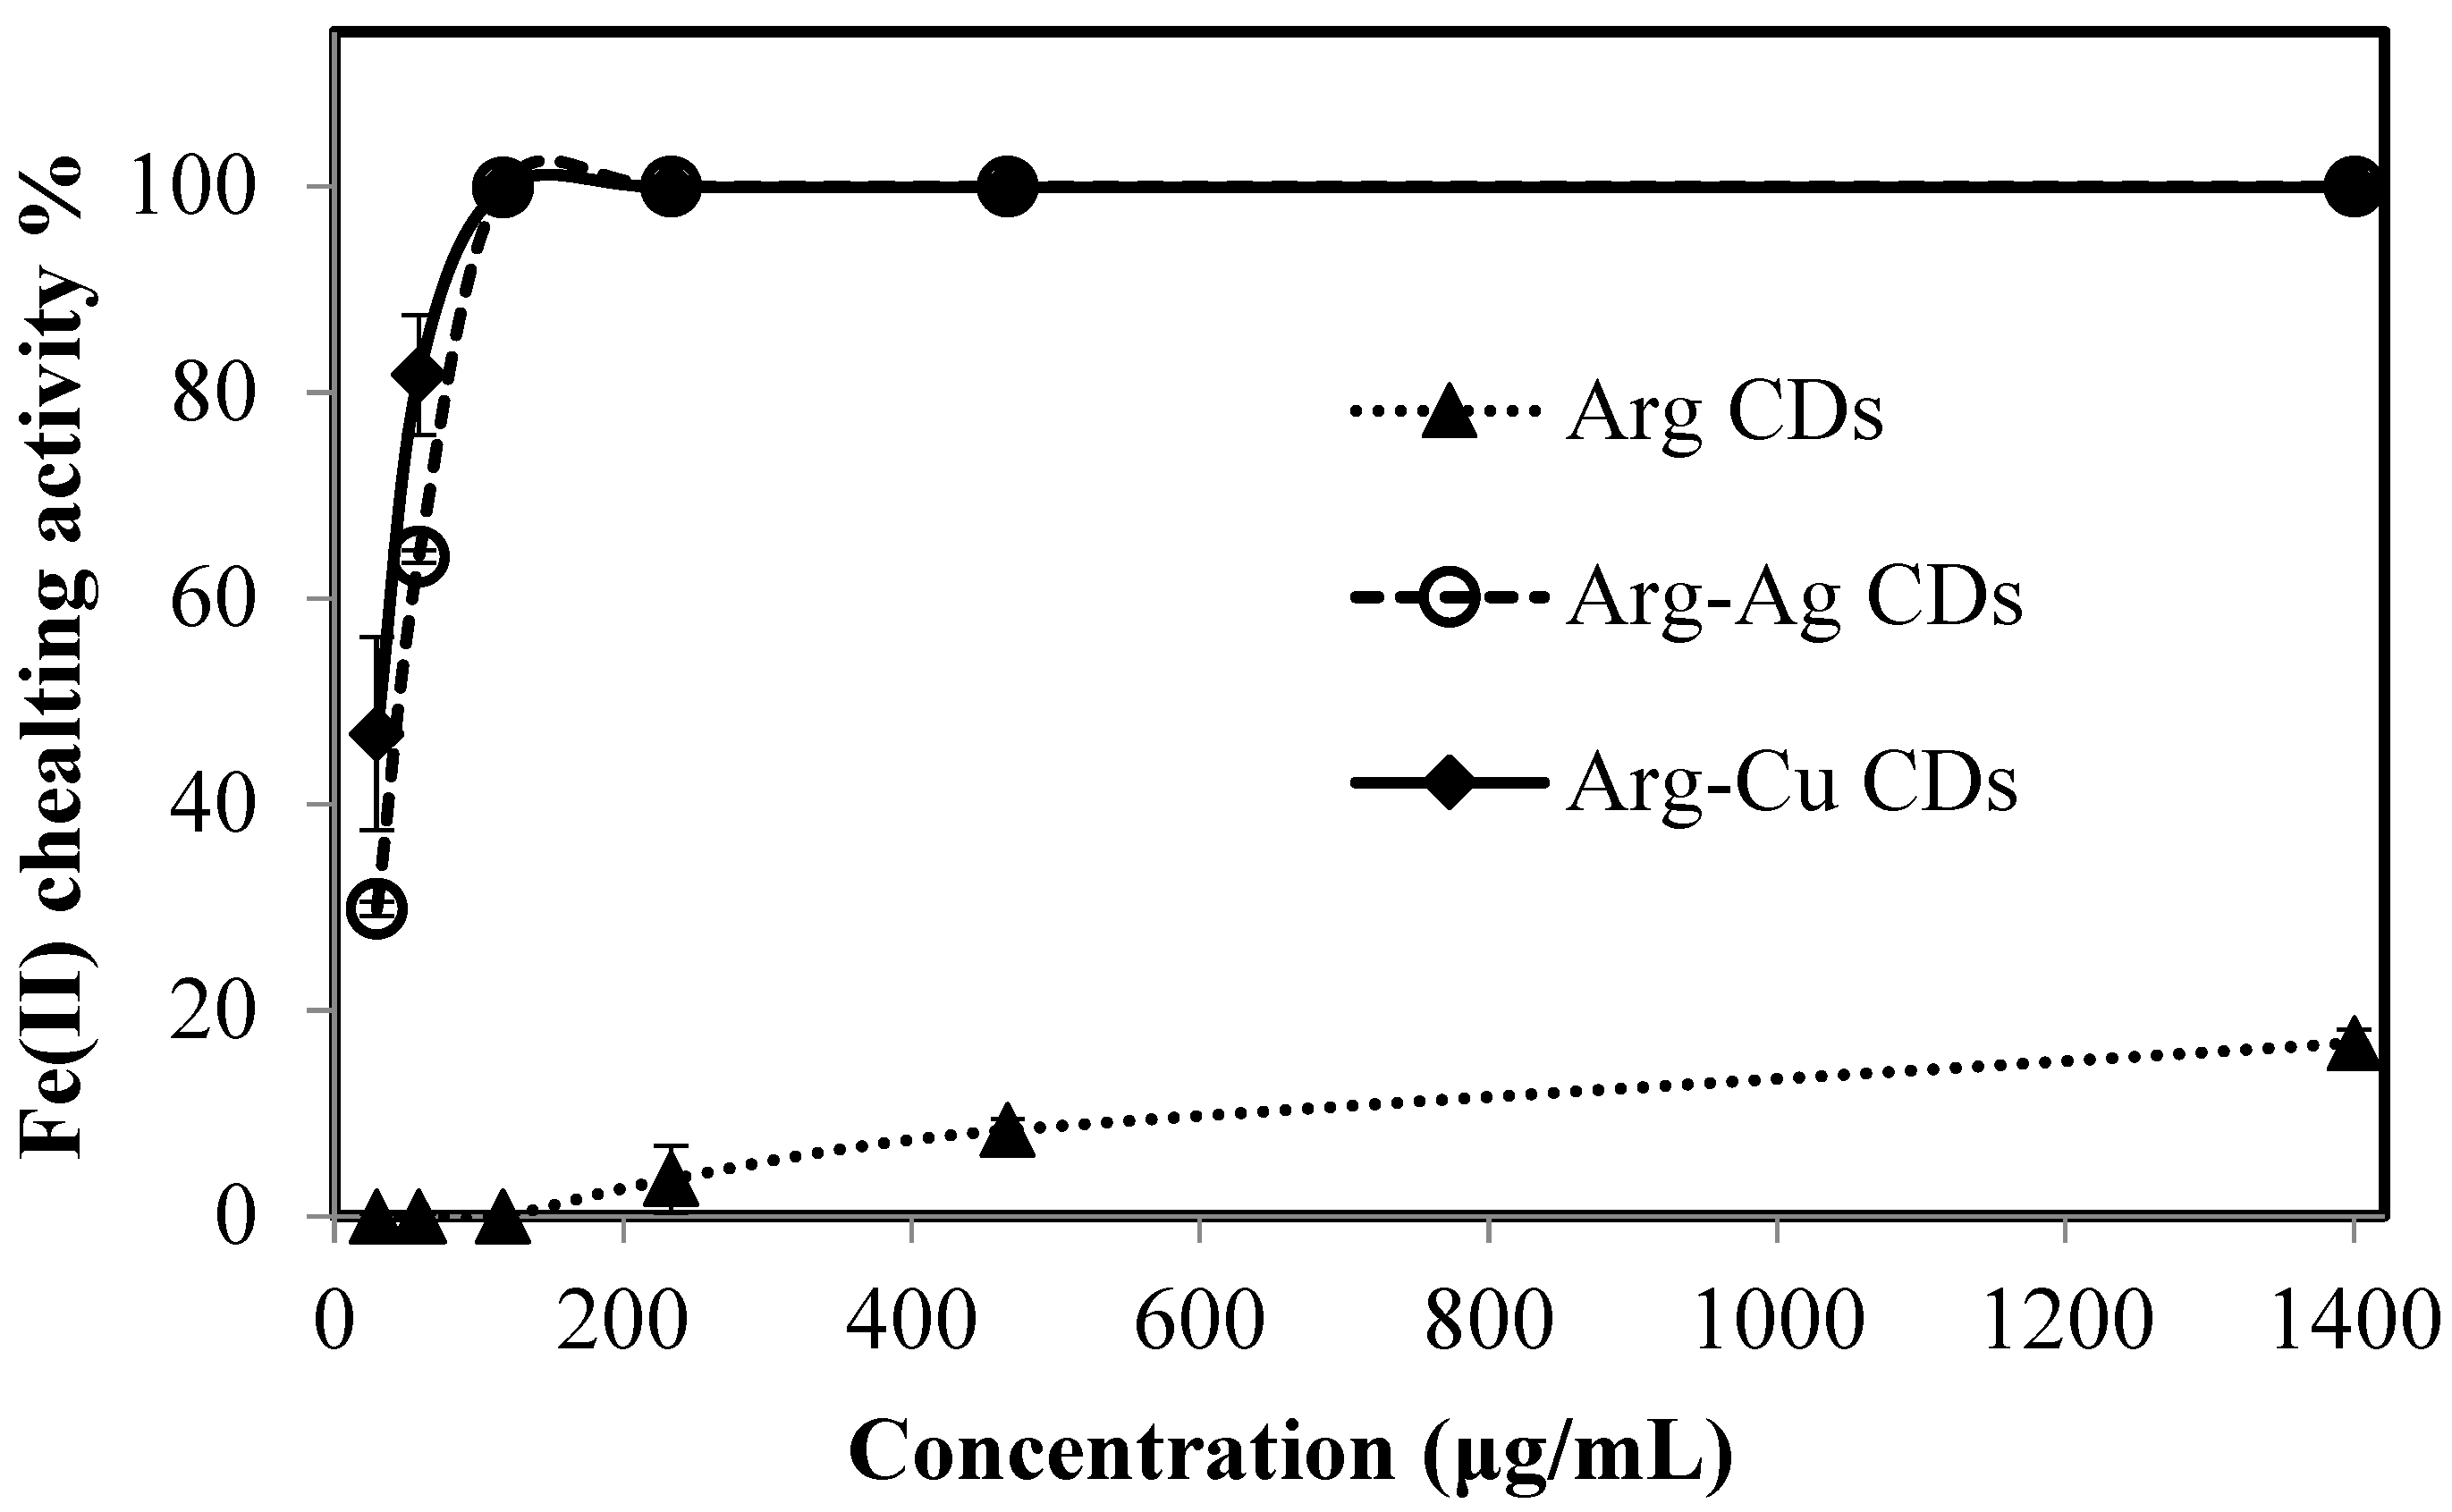
As mentioned earlier, the removal of Fe(II) from the brain is very important. Fe(II) leads to metal extremism that can be caused by many factors including oxidative stress and neurodegeneration. Therefore, the Fe(II) chelating capability of Arg CDs, Arg-Ag CDs, and Arg-Cu CDs were also investigated and the results are shown in Figure 8.
It is apparent that Arg CDs do not strongly chelate with Fe(II) ions in low concentrations e.g., at 29, 58, 116 µg/mL and chelating capability seems to increase quite slowly. This could be due to multilayer coverage of Arg CDs due to the elevated concentration of Fe(II) ions at about >200 µg/mL, as even at 1400 µg/mL, only 16.8% Fe(II) cheating ability is observed. On the other hand, Arg-Ag CDs and Arg-Cu CDs show nearly 100% chelating activity at a 116 µg/mL Fe(II) concentration. This result further confirmed a the reason for Ag and Cu MNPs being explored as AChE inhibitors in the literature [38,39].
4. Discussion
N-doped CDs were successfully synthesized using nitrogen rich arginine (Arg) amino acid that was reacted with a carbon rich citric acid as precursors via a microwave assisted technique within 2 min in a one-pot synthesis method. The green and natural precursor molecules and facile synthesis via the microwave process provide great advantages for large-scale application of Arg CDs. Furthermore, the environmentally friendly, biocompatible, and non-toxic nature of these materials in combination with the simple, rapid, and low-cost synthesis procedure allows them to be a viable alternative to the other more expensive and tedious synthesis procedures from toxic precursors for biological applications. According to HR-TEM images, N doped Arg CDs are graphitic crystalline in structure, with about 0.28 nm lattice spacing [18] with a size distribution in the 0.5–10 nm range. FT-IR spectrum and zeta potential measurements in a wide range of pH conditions corroborate the amine and carboxylic acid functionality of Arg CDs. It is clear that Arg CDs have different functional groups such as -OH, -NH2, and -COOH that generate positive surface charge up to pH 4 due the protonation of amine groups and negative surface charge due the deprotonation of -COOH groups at pH >5 conditions. It has been reported that many amino acid-based CD derivatives from arginine, lysine, cysteine, histidine, tyrosine, and methionine were prepared and investigated for different types of applications including in catalysis, sensors, bioimaging, and clinical applications because of their environmental friendly nature, small size distribution, low cost, good water dispersity, biocompatibility, excellent photoluminescence ability, and effective antibacterial abilities [18,19,20,21,22]. In this study, an Arg CD was used as a template for in situ preparation of MNPs such as Ag NP and Cu NP to enhance the antimicrobial and potential antiaging activity of Arg CDs. These metal NPs were successfully synthesized within Arg CDs as verified by TEM, XRD, and UV-Vis analysis. XRD patterns revealed that the Arg CD has a nanocrystalline graphite structure with a d(002) plane at 0.34 nm interplanar spacing [18] and the characteristic diffraction peaks for both Ag and Cu NPs in Arg-Ag CDs and Arg-Cu CD composites. HR-TEM images further validated the XRD results with 0.28 nm lattice spacing of Arg CDs attributed to graphite structure, 0.23 nm lattice spacing for Arg-Ag CDs due to existence of Ag NPs, and also 0.2 nm lattice spacing for Arg-Cu CDs because of the presence of Cu NPs [34]. Furthermore, Arg CDs show UV absorption at 330 nm and strong blue emission at 420 nm wavelengths due to nitrogen doping in the carbonous structure in the network coming from the amino acid precursors [18]. Li et al. reported that lysine and arginine CDs exhibit distinctive antibacterial activity against drug resistance Gram negative and Gram positive bacteria strains depending on their cationic structure and the ability to destroy the reactive oxygen species (ROS) and inhibit the effects of superoxide dismutase (SOD) and the catalase activity of bacteria [22]. They argued that amino acid based positively charged CDs are capable of binding to the bacterial cell membrane by means of electrostatic interaction and destroying the cell walls. Moreover, the biofilm layer of drug resistance pathogenic bacteria could be potentially disrupted by Arg CDs through their smaller sizes and the ability to destroy ROS. Additionally, metal NPs such as Ag and Cu are the most preferred antimicrobial materials in the field of medicine, dental materials, textile fabrics, and water treatment because of their wide spectrum of antimicrobial activities [35,36]. In this work, it is shown that the antimicrobial capacity of Arg CDs is improved by combining NPs i.e., Ag NP and Cu NP within Arg CDs. Antibacterial studies showed that the killing capacity of Arg CDs is notably increased, almost 10-fold against Gram negative E. coli and 100-fold against Gram positive S. aureus bacteria because of the synergistic effects of Arg CD with NPs.
In the brains of Alzheimer’s patients, the metal ion levels are 3–5-fold higher than in normal people. The iron accumulation in the brain can result from many sources such as redox-generated free radicals [40]. Metal chelation capability of the compounds for Fe(II), Cu(II), Al(III), Zn(II) ions would be an extra advantage in the treatment of Alzheimer Disease [41,42]. The synthesized Arg-Ag and Arg-Cu CDs have shown promising results for inhibition of AChE enzyme activity, and Fe(II) chelating capability showing potential therapeutic utilization as reversible inhibitors and chelators in Alzheimer’s and other neuro degenerative diseases. These promising materials can suggest new methods to be used in a wide range of applications including healthcare and personal care products, sensors, optical devices, food safety, air and water treatment, and textile industries.
Author Contributions
Conceptualization, N.S., and R.S.A.; methodology, S.S.S., and M.S.; validation, S.S.S., and M.S.; formal analysis, V.R.B., and N.S.; investigation, S.S.S., and M.S.; resources, N.S., R.S.A. and V.R.B.; writing—original draft preparation, S.S.S., and M.S.; writing—review and editing, N.S. and V.R.B.; visualization, N.S.; supervision, N.S.; project administration, N.S. and V.R.B.; funding acquisition, N.S., R.S.A. and V.R.B.; All authors have read and agreed to the published version of the manuscript.
Funding
This research was funded by Department of Ophthalmology, College of Medicine, University of South Florida.
Conflicts of Interest
The authors declare no conflict of interest.
References
- Barman, M.K.; Patra, A. Current status and prospects on chemical structure driven photoluminescence behaviour of carbon dots. J. Photochem. Photobiol. C Photochem. Rev. 2018, 37, 1–22. [Google Scholar] [CrossRef]
- Wang, L.; Zhou, H.S. Green synthesis of luminescent nitrogen-doped carbon dots from milk and its imaging application. Anal. Chem. 2014, 86, 8902–8905. [Google Scholar] [CrossRef] [PubMed]
- Zulfajri, M.; Gedda, G.; Chang, C.-J.; Chang, Y.-P.; Huang, G.G. Cranberry beans derived carbon dots as a potential fluorescence sensor for selective detection of Fe3+ ions in aqueous solution. ACS Omega 2019, 4, 15382–15392. [Google Scholar] [CrossRef] [PubMed] [Green Version]
- Zulfajri, M.; Dayalan, S.; Li, W.-Y.; Huang, G.G.; Chang, C.-J.; Chang, Y.-P. Nitrogen-doped carbon dots from averrhoa carambola fruit extract as a fluorescent probe for methyl orange. Sensors 2019, 19, 5008. [Google Scholar] [CrossRef] [PubMed] [Green Version]
- Dias, C.; Vasimalai, N.; Passos, M.; Pinheiro, I.; Vilas-Boas, V.; Peixoto, J.; Espiña, B. Biocompatibility and bioimaging potential of fruit-based carbon dots. Nanomaterials 2019, 9, 199. [Google Scholar] [CrossRef] [Green Version]
- Zulfajri, M.; Abdelhamid, H.N.; Sudewi, S.; Dayalan, S.; Rasool, A.; Habib, A.; Huang, G.G. Plant part-derived carbon dats for biosensing. Biosensors 2020, 10, 68. [Google Scholar] [CrossRef]
- Sharma, V.; Tiwari, P.; Mobin, S.M. Sustainable carbon-dots: Recent advances in green carbon dots for sensing and bioimaging. J. Mater. Chem. B 2017, 5, 8904–8924. [Google Scholar] [CrossRef]
- Zhang, Z.; Yi, G.; Li, P.; Zhang, X.; Fan, H.; Zhang, Y.; Wang, X.; Zhang, C. A mini review on doped carbon dots for photocatalytic and electrocatalytic applications. Nanoscale 2020, 12, 13899. [Google Scholar] [CrossRef]
- Feng, T.; Ai, X.; An, G.; Yang, P.; Zhao, Y. Charge-Convertible Carbon Dots for Imaging Guided Drug Delivery with Enhanced in Vivo Cancer Therapeutic Efficiency. ACS Nano 2016, 10, 4410–4420. [Google Scholar] [CrossRef]
- Chung, Y.J.; Kim, J.; Park, C.B. Photonic carbon dots as an emerging nano agent for biomedical and healtcare applications. ACS Nano 2020, 14, 6470–6497. [Google Scholar] [CrossRef]
- Liu, S.; Zhao, N.; Cheng, Z.; Liu, H. Amino-functionalized green fluorescent carbon dots as surface energy transfer biosensors for hyaluronidase. Nanoscale 2015, 7, 6836. [Google Scholar] [CrossRef]
- Ehtesabi, H.; Amirfazli, M.; Messah, F.; Bagheri, Z. Application of functionalized carbon dots in detection, diagnostic, disease treatment, and desalination: A review. Adv. Nat. Sci. Nanosci. Nanotechnol. 2020, 11, 025017. [Google Scholar] [CrossRef]
- Sagbas, S.; Sahiner, N. Chapter 22: Carbon dots: Preparation, Properties and Application. In Nanocarbon and Its Composites, 1st ed.; Khan, A., Jawaid, M., Inamuddin, D.R., Asiri, A.M., Eds.; Elsevier, Woodhead: Cambridge, UK, 2019; pp. 651–676. [Google Scholar]
- Sahiner, N.; Suner, S.S.; Sahiner, M.; Silan, C. Nitrogen and sulfur doped carbon dots from amino acids for potential biomedical applications. J. Fluoresc. 2020, 29, 1191–1200. [Google Scholar] [CrossRef] [PubMed]
- Niu, W.-J.; Zhu, R.-H.; Hua, Y.; Zeng, H.-B.; Cosnier, S.; Zhang, X.-J.; Shan, D. One-pot synthesis of nitrogen-rich carbon dots decorated graphene oxide as metal-free electrocatalyst for oxygen reduction reaction. Carbon 2016, 109, 402–410. [Google Scholar] [CrossRef]
- Nie, X.; Jiang, C.; Wu, S.; Chen, W.; Lv, P.; Wang, Q.; Liu, J.; Narh, C.; Cao, X.; Ghiladi, R.A.; et al. Carbon quantum dots: A bright future as photosensitizers fir in vivo antibacterial photodynamic inactivation. J. Photochem. Photobiol. B Biol. 2020, 206, 111864. [Google Scholar] [CrossRef]
- Zhao, C.; Wu, L.; Wang, X.; Weng, S.; Ruan, Z.; Liu, Q.; Lin, L.; Lin, X. Quaternary ammonium carbon quantum dots as an antimicrobial agent against gram-positive bacteria for the treatment of MRSA-infected pneumonia in mice. Carbon 2020, 163, 70–84. [Google Scholar] [CrossRef]
- Hu, R.; Li, L.; Jin, W.J. Controlling speciation of nitrogen in nitrogen-doped carbon dots by ferric ion catalysis for enhancing fluorescence. Carbon 2017, 111, 133–141. [Google Scholar] [CrossRef]
- Hua, J.; Mu, Z.; Hua, P.; Wang, M.; Qin, K. Ratiometric fluorescence nanoprobe for monitoring of intracellular temperature and tyrosine based on a dual emissive carbon dots/gold nanohybrid. Talanta 2020, 219, 121279. [Google Scholar] [CrossRef]
- Yoshinaga, T.; Akiu, M.; Iso, Y.; Isobe, T. Photoluminescence properties of L-cysteine-derived carbon dots prepared in non-aqueous and aqueous solvents. J. Lumin. 2020, 224, 117260. [Google Scholar] [CrossRef]
- Jin, L.; Zhang, L.; Yang, L.; Wu, X.; Zhang, C.; Wei, K.; He, L.; Han, X.; Qiao, H.; Asiri, A.M.; et al. Orange-red, green, and blue fluorescence carbon dots for white light emitting diodes. J. Mater. Sci. Technol. 2020, 50, 184–191. [Google Scholar] [CrossRef]
- Li, P.; Hanb, F.; Caoa, W.; Zhanga, G.; Li, J.; Zhoua, J.; Gonga, X.; Turnbull, G.; Shud, W.; Xia, L.; et al. Carbon quantum dots derived from lysine and arginine simultaneously scavenge bacteria and promote tissue repair. Appl. Mater. Today 2020, 19, 100601. [Google Scholar]
- Fu, Y.; Zheng, G.; Lai, C.; Huang, D.; Qin, L.; Yi, H.; Liu, X.; Zhang, M.; Li, B.; Liu, S.; et al. Hybrid architechures based on noble metals and carbon-based dots nanomaterials: A review of recent progress in synthesis and applications. Chem. Eng. J. 2020, 399, 125743. [Google Scholar] [CrossRef]
- Baranwal, A.; Srivastava, A.; Kumar, P.; Bajpai, V.K.; Maurya, P.K.; Chandra, P. Prospects of nanostructure materials and their composites as antimicrobial agents. Front. Microbiol. 2018, 9, 422. [Google Scholar] [CrossRef] [Green Version]
- Dong, X.; Liang, W.; Meziani, M.J.; Sun, Y.-P.; Yang, L. Carbon dots as potent antimicrobial agents. Theranostics 2020, 10, 671–686. [Google Scholar] [CrossRef] [PubMed]
- Strelnik, A.D.; Petukhov, A.S.; Zueva, I.V.; Zobov, V.V.; Petrov, K.A.; Nikolsky, E.E.; Balakin, K.V.; Bachurin, S.O.; Shtyrlin, Y.G. Novel potent pyridoxine-based inhibitors of AChE and BChE, structural analogs of pyridostigmine, with improved in vivo safety profile. Bioorg. Med. Chem. Lett. 2016, 26, 4092–4094. [Google Scholar] [CrossRef]
- Colovic, M.B.; Krstic, D.Z.; Lazarevic-Pasti, T.D.; Bondzic, A.M.; Vasic, V.M. Acetylcholinesterase Inhibitors: Pharmacology and Toxicology. Curr. Neuropharmacol. 2013, 11, 315–335. [Google Scholar] [CrossRef] [Green Version]
- Rhee, I.K.; Van De Meent, M.; Ingkaninan, K.; Verpoorte, R. Screening for acetylcholinesterase inhibitors from amaryllidaceae using silica gel thin-layer chromatography in combination with bioactivity staining. J. Chromatogr. A 2001, 915, 217–223. [Google Scholar] [CrossRef]
- Liu, G.; Men, P.; Harris, P.L.R.; Rolston, R.K.; Perry, G.; Smith, M.A. Nanoparticle iron chelators: A new therapeutic approach in Alzheimer disease and other neurologic disorders associated with trace metal imbalance. Neurosci. Lett. 2006, 406, 189–193. [Google Scholar] [CrossRef]
- Ferreres, F.; Taveira, M.; Pereira, D.M.; Valentão, P.; Andrade, P.B. Tomato (Lycopersicon esculentum) seeds: New flavonols and cytotoxic effect. J. Agric. Food Chem. 2010, 58, 2854–2861. [Google Scholar] [CrossRef]
- Van Acker, S.A.B.E.; Van Den Berg, D.J.; Tromp, M.N.J.L.; Griffioen, D.H.; Van Bennekom, W.P.; Van Der Vijgh, W.J.F.; Bast, A. Structural aspects of antioxidant activity of flavonoids. Free Radic. Biol. Med. 1996, 20, 331–342. [Google Scholar] [CrossRef]
- Sudan, R.; Bhagat, M.; Gupta, S.; Singh, J.; Koul, A. Iron (FeII) chelation, ferric reducing antioxidant power, and immune modulating potential of arisaema jacquemontii (himalayan cobra lily). BioMed Res. Int. 2014, 2014, 179865. [Google Scholar] [CrossRef] [PubMed] [Green Version]
- Wang, Y.; Zhao, J.; Zhang, W.; Liu, C.; Jauregi, P.; Huang, M. Modification of heat-induced whey protein gels by basic amino acids. Food Hydrocoll. 2020, 100, 105397. [Google Scholar] [CrossRef]
- Hanawalt, J.D.; Rinn, H.W.; Frevel, L.K. Chemical analysis by X-Ray diffraction. Anal. Chem. 1938, 10, 475. [Google Scholar] [CrossRef]
- Jyoti, K.; Baunthiyal, M.; Singh, A. Characterization of silver nanoparticles synthesized using Urtica dioica Linn. Leaves and their synergistic effects with antibiotics. J. Radiat. Res. Appl. Sci. 2016, 9, 217–227. [Google Scholar] [CrossRef] [Green Version]
- Betancourt-Galindo, R.; Reyes-Rodriguez, P.Y.; Puente-Urbina, B.A.; Avila-Orta, C.A.; Rodríguez-Fernández, O.S.; Cadenas-Pliego, G.; Lira-Saldivar, R.H.; García-Cerda, L.A. Synthesis of Copper Nanoparticles by Thermal Decomposition and Their Antimicrobial Properties. J. Nanomater. 2013, 980545. [Google Scholar] [CrossRef] [Green Version]
- Das, B.; Dadhich, P.; Pal, P.; Thakur, S.; Neogi, S.; Dhara, S. Carbon nano dot decorates copper nanowires for SERS-Fluorescence dual-mode imaging/anti-microbial activity and enhanced antiogenic activity. Spectrochim. Acta A 2020, 227, 117669. [Google Scholar] [CrossRef]
- Wang, Z.; Zhao, J.; Li, F.; Gao, D.; Xing, B. Adsorption and inhibition of acetylcholinesterase by different nanoparticles. Chemosphere 2009, 77, 67–73. [Google Scholar] [CrossRef]
- Katuli, K.K.; Massarsky, A.; Hadadi, A.; Pourmehran, Z. Silver nanoparticles inhibit the gill Na+/K+-ATPase and erythrocyte AChE activities and induce the stress response in adult zebrafish (Danio rerio). Ecotoxicol. Environ. Saf. 2014, 106, 173–180. [Google Scholar] [CrossRef]
- Zheng, H.; Youdim, M.B.H.; Fridkin, M. Selective acetylcholinesterase inhibitor activated by acetylcholinesterase releases an active chelator with neurorescuing and anti-amyloid activities. ACS Chem. Neurosci. 2010, 1, 737–746. [Google Scholar] [CrossRef] [Green Version]
- Cai, R.; Wang, L.N.; Fan, J.J.; Geng, S.Q.; Liu, Y.M. New 4-N-phenylaminoquino derivatives as antioxidant, metal chelating and cholinesterase inhibitors for Alzheimer’s disease. Bioorg. Chem. 2019, 93, 103328. [Google Scholar] [CrossRef]
- Wichur, T.; Więckowska, A.; Więckowski, K.; Godyń, J.; Jończyk, J.; Valdivieso, Á.D.R.; Panek, D.; Pasieka, A.; Sabaté, R.; Knez, D.; et al. 1-Benzylpyrrolidine-3-amine-based BuChE inhibitors with anti-aggregating, antioxidant and metal-chelating properties as multifunctional agents against Alzheimer’s disease. Eur. J. Med. Chem. 2020, 187, 111916. [Google Scholar] [CrossRef] [PubMed]
Figure 1.
(a) Schematic representation of the preparation of graphitic arginine carbon dots (Arg CDs) by a microwave technique (b) its TEM image and (c) particle size distribution by dynamic light scattering (DLS).
Figure 1.
(a) Schematic representation of the preparation of graphitic arginine carbon dots (Arg CDs) by a microwave technique (b) its TEM image and (c) particle size distribution by dynamic light scattering (DLS).

Figure 2.
(a) FT-IR spectrum of Arg CDs. (b) Zeta potential values of Arg CDs at different pH conditions from 2 to 10 and its isoelectronic points.
Figure 2.
(a) FT-IR spectrum of Arg CDs. (b) Zeta potential values of Arg CDs at different pH conditions from 2 to 10 and its isoelectronic points.

Figure 3.
(a) Schematic representation of preparation process of composite metal nanoparticle (NP) containing Arg-Ag and Arg-Cu CDs (b) their high resolution (HR)-TEM images and crystal structure.
Figure 3.
(a) Schematic representation of preparation process of composite metal nanoparticle (NP) containing Arg-Ag and Arg-Cu CDs (b) their high resolution (HR)-TEM images and crystal structure.
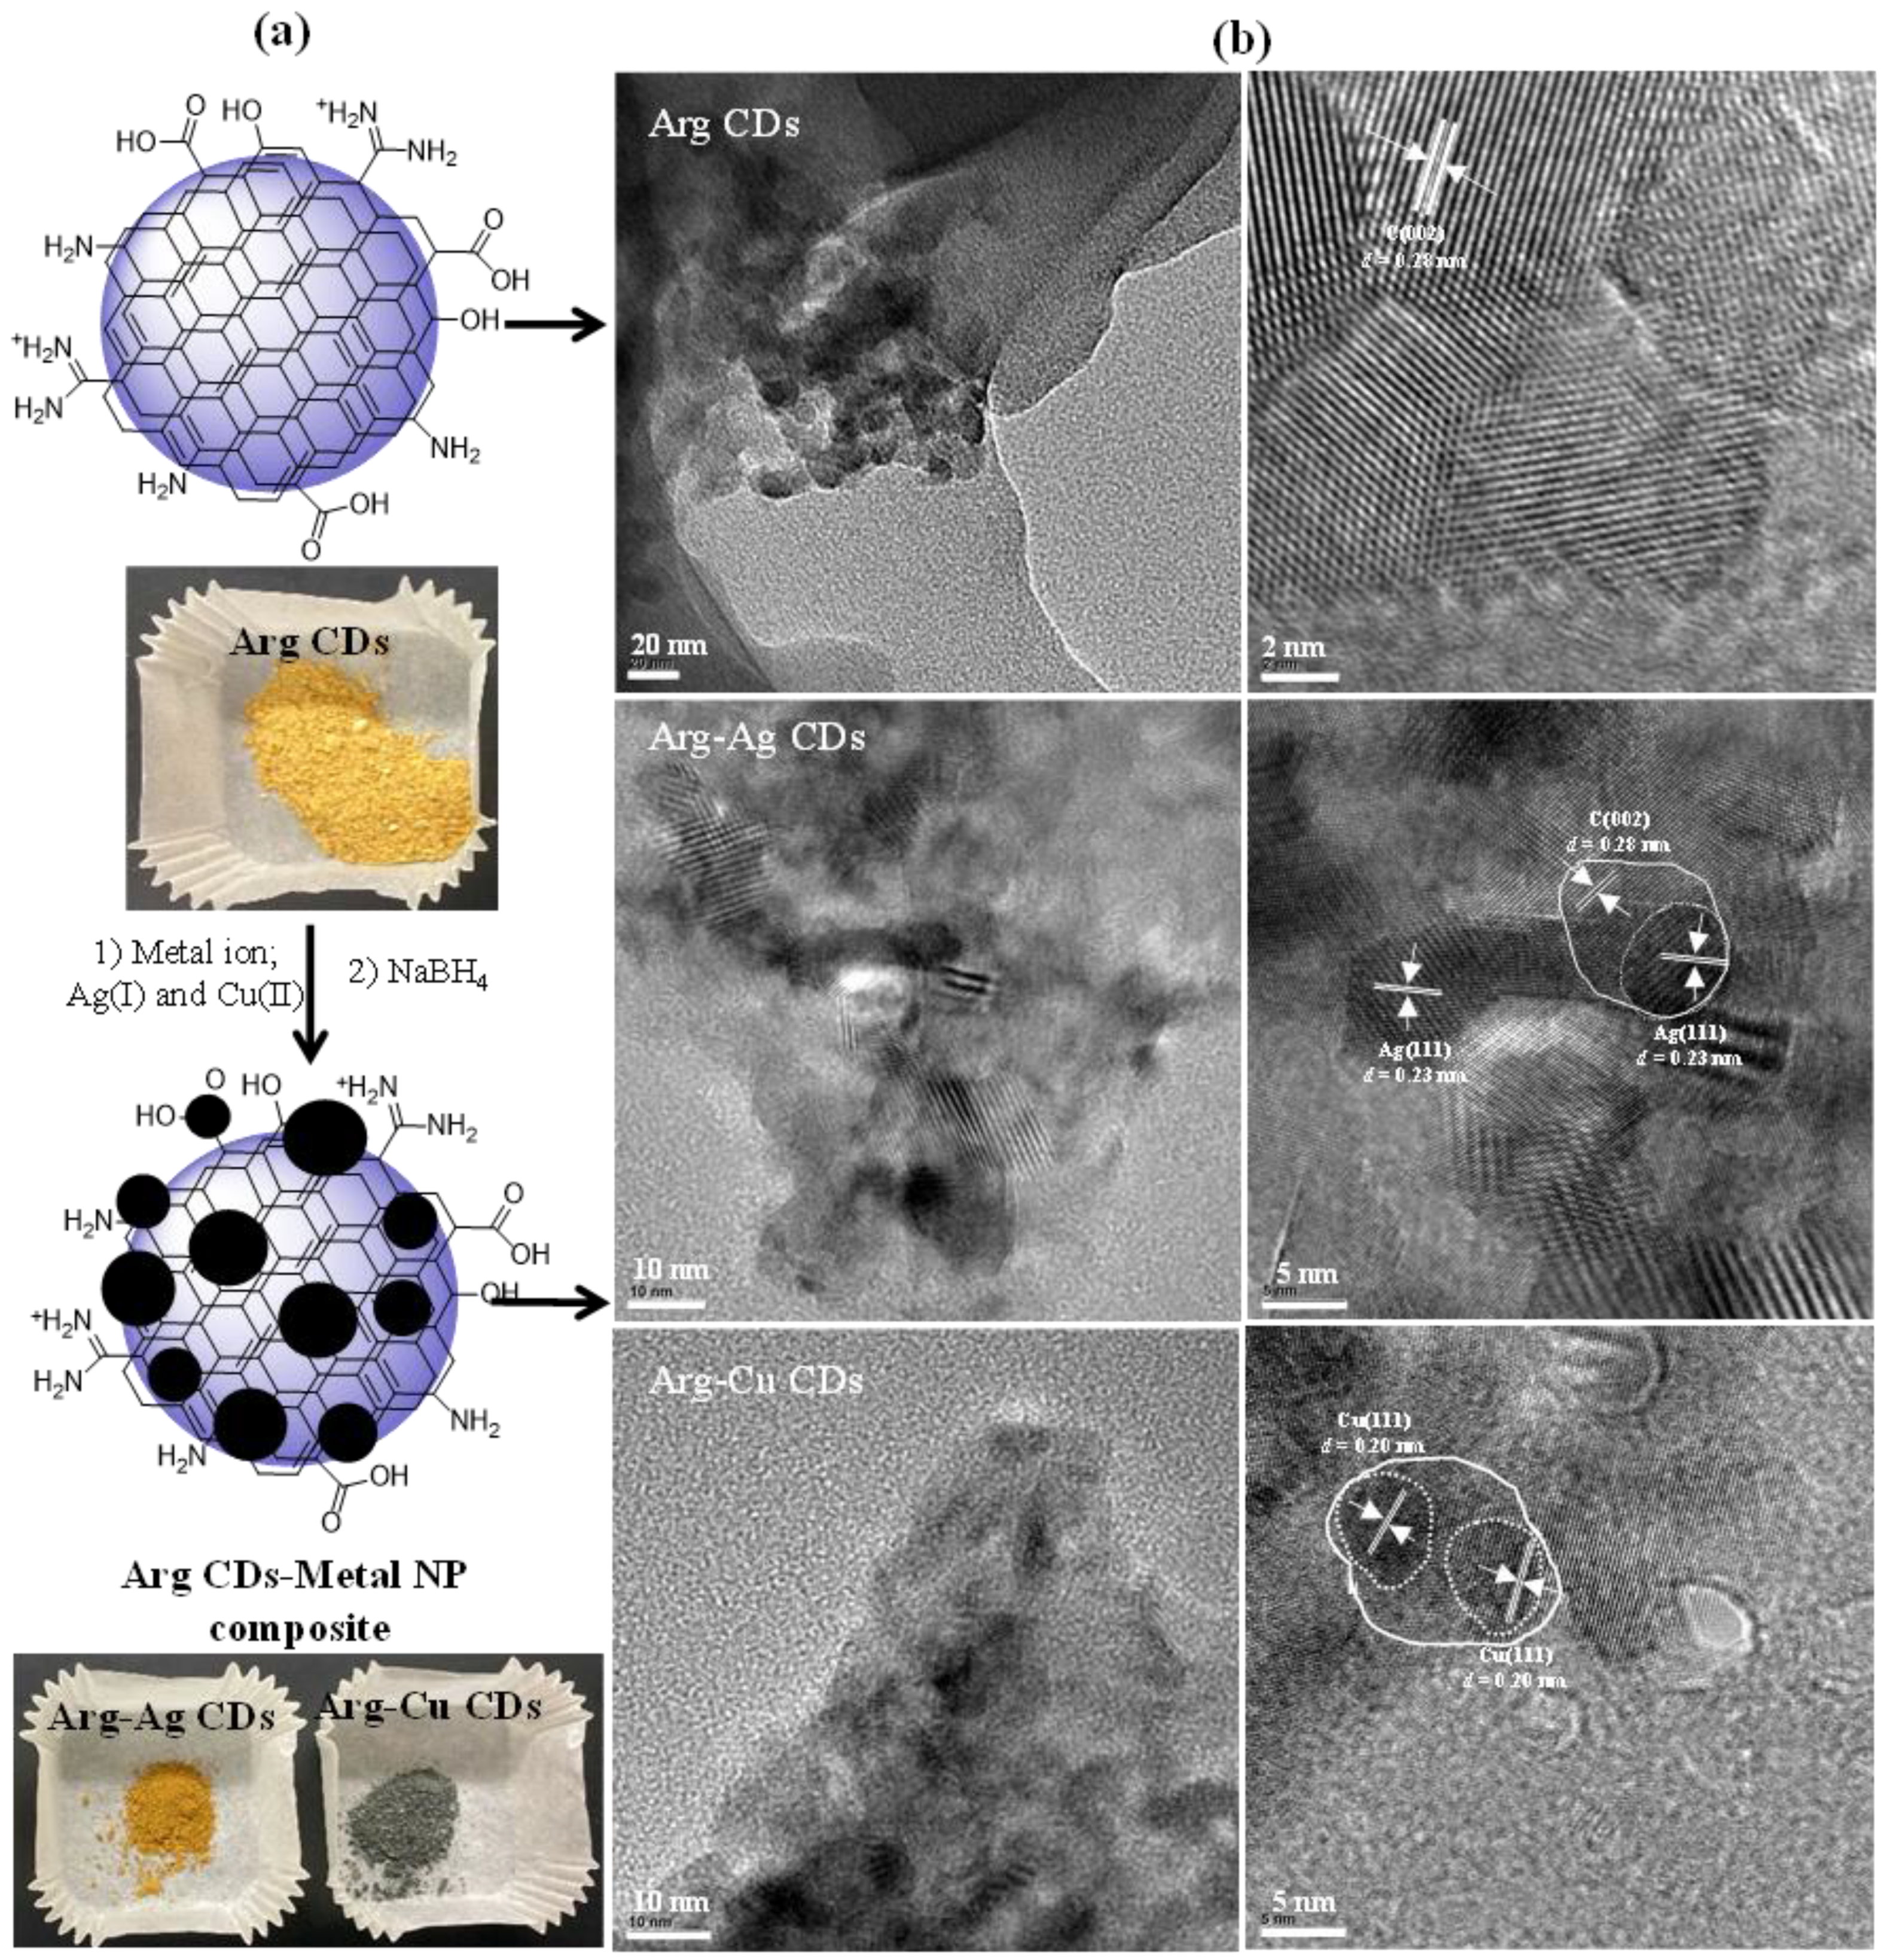
Figure 4.
XRD patterns of Arg CDs, Arg-Ag CDs, and Arg-Cu CDs.

Figure 5.
(a) UV-Vis absorption spectrum of Arg CD, Arg-Ag CD, and Arg-Cu CD solutions and (b) Digital camera images of the Arg CD solution under ambient light and ultraviolet light at 254 nm and its fluorescence spectra at different excitation wavelengths.
Figure 5.
(a) UV-Vis absorption spectrum of Arg CD, Arg-Ag CD, and Arg-Cu CD solutions and (b) Digital camera images of the Arg CD solution under ambient light and ultraviolet light at 254 nm and its fluorescence spectra at different excitation wavelengths.

Figure 6.
(a) Inhibition zones of 10 mg Arg CDs, Arg-Ag CDs, and Arg-Cu CDs suspended in 50 μL phosphate buffer solution (PBS) and 1 mg gentamicin in 20 μL PBS against S. aureus and E. coli using the disc diffusion test, (b,c) the bacterial inhibition % of Arg CDs, Arg-Ag CDs, and Arg-Cu CDs at different concentrations for S. aureus and E. coli using the microdilution test. (Gentamicin was used as the control).

Figure 7.
The inhibition of AChE enzyme activity % of Arg CDs, Arg-Ag CDs, and Arg-Cu CDs.
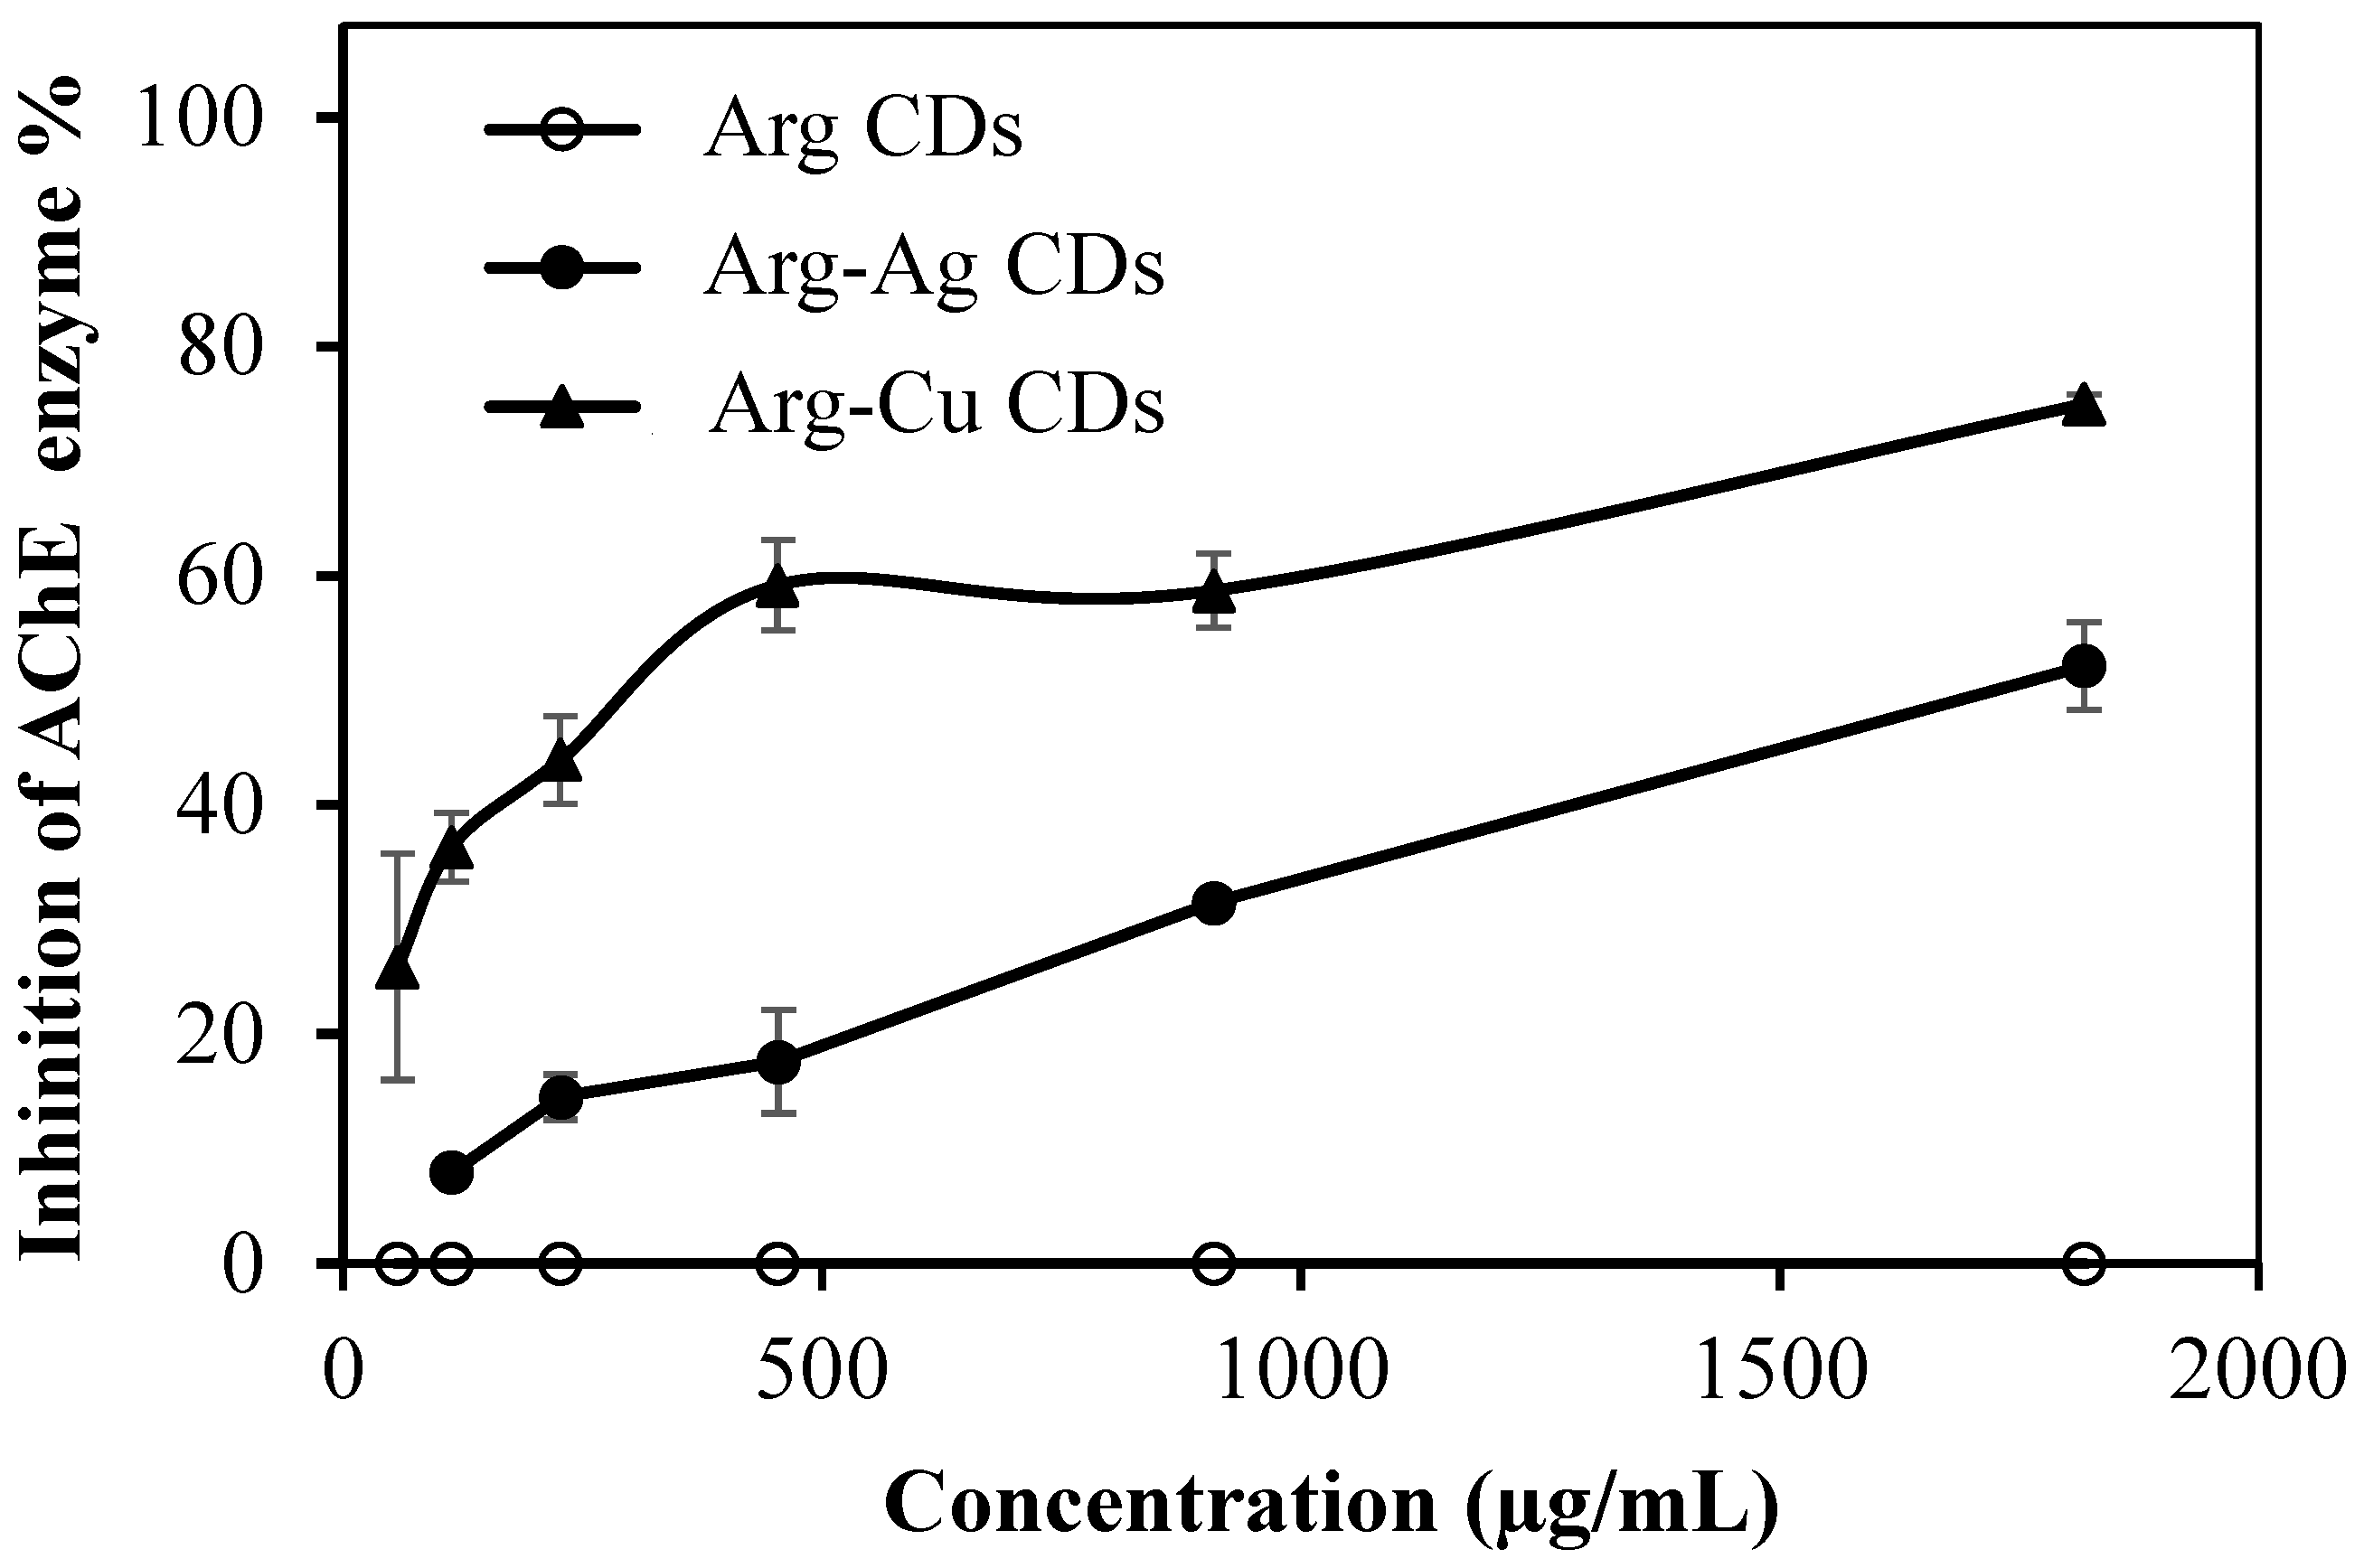
Figure 8.
Fe(II) chelating activity % of Arg CDs, Arg-Ag CDs, and Arg-Cu CDs.

Table 1.
Inhibition zone (mm) of 10 mg Arg CDs, Arg-Ag CDs, and Arg-Cu CDs suspended in 50 μL PBS and 1 mg gentamicin in 20 μL PBS against S. aureus and E. coli using the disc diffusion test and minimum inhibition concentration (MIC) and minimum bactericidal concentration (MBC) values of Arg CDs, Arg-Ag CDs, and Arg-Cu CDs against S. aureus and E. coli using the microdilution test.
| Materials | Inhibition Zone (mm) | |||
|---|---|---|---|---|
| S. aureus (Gram +) | E. coli (Gram -) | |||
| Arg CDs | 16 ± 1 | 21 ± 2 | ||
| Arg-Ag CDs | 24 ± 1 | 25 ± 1 | ||
| Arg-Cu CDs | 22 ± 1 | 25 ± 1 | ||
| Gentamicin | 26 ± 1 | 29 ± 1 | ||
| Materials | MIC (mg/mL) | MBC (mg/mL) | ||
| S. aureus (Gram +) | E. coli (Gram -) | S. aureus (Gram +) | E. coli (Gram -) | |
| Arg CDs | 6.250 | 6.250 | 12.500 | 12.500 |
| Arg-Ag CDs | 0.062 | 0.125 | 0.125 | 0.312 |
| Arg-Cu CDs | 0.625 | 1.250 | 3.125 | 6.250 |
© 2020 by the authors. Licensee MDPI, Basel, Switzerland. This article is an open access article distributed under the terms and conditions of the Creative Commons Attribution (CC BY) license (http://creativecommons.org/licenses/by/4.0/).
Share and Cite
MDPI and ACS Style
Suner, S.S.; Sahiner, M.; Ayyala, R.S.; Bhethanabotla, V.R.; Sahiner, N. Nitrogen-Doped Arginine Carbon Dots and Its Metal Nanoparticle Composites as Antibacterial Agent. C 2020, 6, 58. https://0-doi-org.brum.beds.ac.uk/10.3390/c6030058
AMA Style
Suner SS, Sahiner M, Ayyala RS, Bhethanabotla VR, Sahiner N. Nitrogen-Doped Arginine Carbon Dots and Its Metal Nanoparticle Composites as Antibacterial Agent. C. 2020; 6(3):58. https://0-doi-org.brum.beds.ac.uk/10.3390/c6030058
Chicago/Turabian StyleSuner, Selin S., Mehtap Sahiner, Ramesh S. Ayyala, Venkat R. Bhethanabotla, and Nurettin Sahiner. 2020. "Nitrogen-Doped Arginine Carbon Dots and Its Metal Nanoparticle Composites as Antibacterial Agent" C 6, no. 3: 58. https://0-doi-org.brum.beds.ac.uk/10.3390/c6030058
Note that from the first issue of 2016, this journal uses article numbers instead of page numbers. See further details here.