Improving the Activity of Fe/C/N ORR Electrocatalyst Using Double Ammonia Promoted CO2 Laser Pyrolysis
by
 , ,
, ,
Henri Perez
1,*, 
Mathieu Frégnaux
2,
Emeline Charon
1,
Arnaud Etcheberry
2 and
Olivier Sublemontier
1 1
NIMBE UMR 3685, CEA, CNRS, Université Paris-Saclay, CEA Saclay, 91191 CEDEX Gif-sur-Yvette, France
2
UVSQ, CNRS, UMR 8180, ILV, F-78035 Versailles, France
*
Author to whom correspondence should be addressed.
C 2020, 6(4), 63; https://0-doi-org.brum.beds.ac.uk/10.3390/c6040063
Submission received: 3 September 2020
/
Revised: 7 October 2020
/
Accepted: 11 October 2020
/
Published: 14 October 2020
(This article belongs to the Collection Feature Papers in the Science and Engineering of Carbons)
Abstract
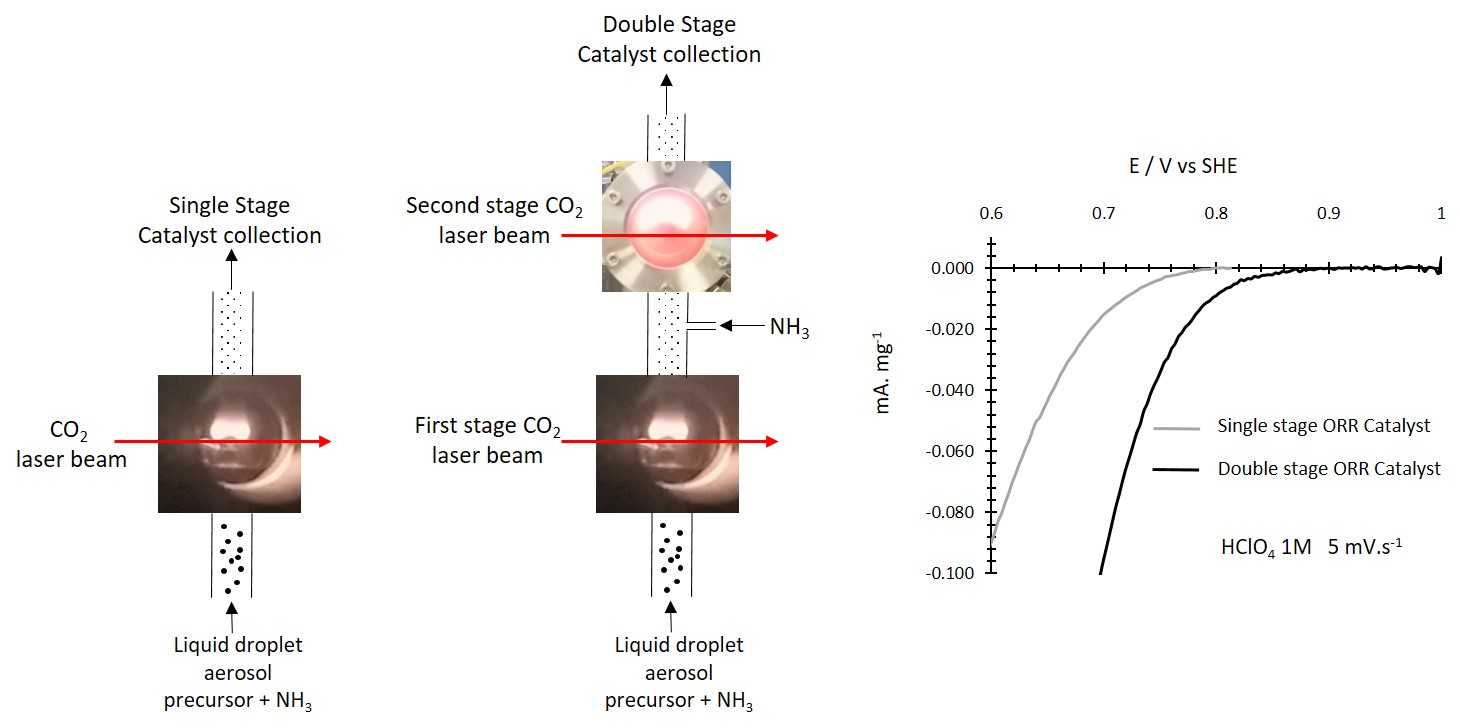
:Recently, we reported the use of CO2 laser pyrolysis for the synthesis of promising Fe/C/N electrocatalysts for Oxygen Reduction Reaction (ORR) in fuel cells. The set-up used single laser pyrolysis of an aerosolized solution of iron acetylacetonate in toluene with ammonia, both as laser energy transfer agent and nitrogen source. In the present paper, we investigate the effect of a second ammonia promoted CO2 laser pyrolysis on the feature and ORR activity of Fe/C/N electrocatalysts. Indeed, compared to single pyrolysis, the second ammonia promoted CO2 laser pyrolysis could be an interesting way to synthesize in one-step performing ORR electrocatalysts on a large scale. For this comparison, a two-stage reactor was built, allowing both single ammonia-induced CO2 laser pyrolysis as reported previously or double ammonia-induced CO2 laser pyrolysis. In the latter configuration, the catalyst nanopowder flow is formed at the first stage of the reactor, then mixed with a second ammonia flow and allowed to cross a second CO2 laser beam, thus undergoing a second ammonia-induced CO2 laser pyrolysis before being collected on filters. It is found that the second ammonia-induced CO2 laser pyrolysis significantly improves the ORR performances of the materials prepared by single CO2 laser pyrolysis. The effect is demonstrated for three different catalysts for which the onset potentials for the ORR from single-stage to double-stage configuration increase from 625 mV to 845 mV, 790 mV to 860 mV, and 800 mV to 885 mV, respectively. The selectivity of the ORR was determined at 600 mV/SHE and lie between 3.41 and 3.72. These promising performances suggesting potentialities for the one-step formation of highly active Fe/C/N ORR electrocatalysts are discussed, based on results of surface analysis by XPS, specific surface area measurements, and Raman spectroscopy.

1. Introduction
In the frame of developing the hydrogen pathway, the non-noble metal Oxygen Reduction Reaction (ORR) electrocatalysts synthesis is a challenging issue. Currently, several research groups are addressing this subject worldwide, and the so-called Fe/C/N catalysts are among the most-studied material for the ORR in acid or basic media [1,2,3,4,5,6,7,8,9], due to promising performances obtained using various preparation methods. Most of the preparation procedures providing highly performing catalysts consist of several steps, time-consuming syntheses, which include intimate mixing of precursors, ball milling, and one or several thermal treatments under ammonia and/or Argon [1,2,3,4,5]. Besides, chemical approaches involving the synthesis of tailored precursors such as zeolitic imidazolate framework provide highly performing ORR catalysts with an appreciable reduced number of synthesis steps [6,7]. Recently, we reported, for the first time, an original one-step synthesis approach involving ammonia-induced CO2 laser pyrolysis of aerosolized liquid precursor media, such as pyridine or toluene, in which an iron precursor (iron acetylacetonate) was dissolved [10,11]. This method gave as-formed catalysts with significant ORR performances in acidic media, interestingly much higher than those recently reported elsewhere for Fe/C/N catalysts prepared by the aerosol-based flame spray pyrolysis method [12]. Another work by us [11] mentioned the formation of highly active Fe/C/N ORR electrocatalyst prepared by a two steps synthesis involving CO2 laser pyrolysis. It consisted of the formation of a catalyst by ammonia-induced laser pyrolysis of an aerosolized solution of iron acetylacetonate solution in toluene, followed by a thermal treatment under ammonia in a tubular oven during 20 min at 1100 °C. The strong improvement of the ORR performances recorded by this two-step synthesis led us to consider an attempt to put the same laser pyrolysis reactor into the two-step synthesis, by involving a two-stage ammonia-induced CO2 laser pyrolysis reactor. The latter also allows single-stage ammonia-induced laser pyrolysis. The results we present here compare electrocatalysts prepared by single ammonia CO2 laser pyrolysis with those prepared in the same reactor, by double ammonia-induced CO2 laser, in terms of features and electrochemical performances for ORR.
2. Materials and Methods
2.1. Synthesis of the Fe/C/N Electrocatalysts
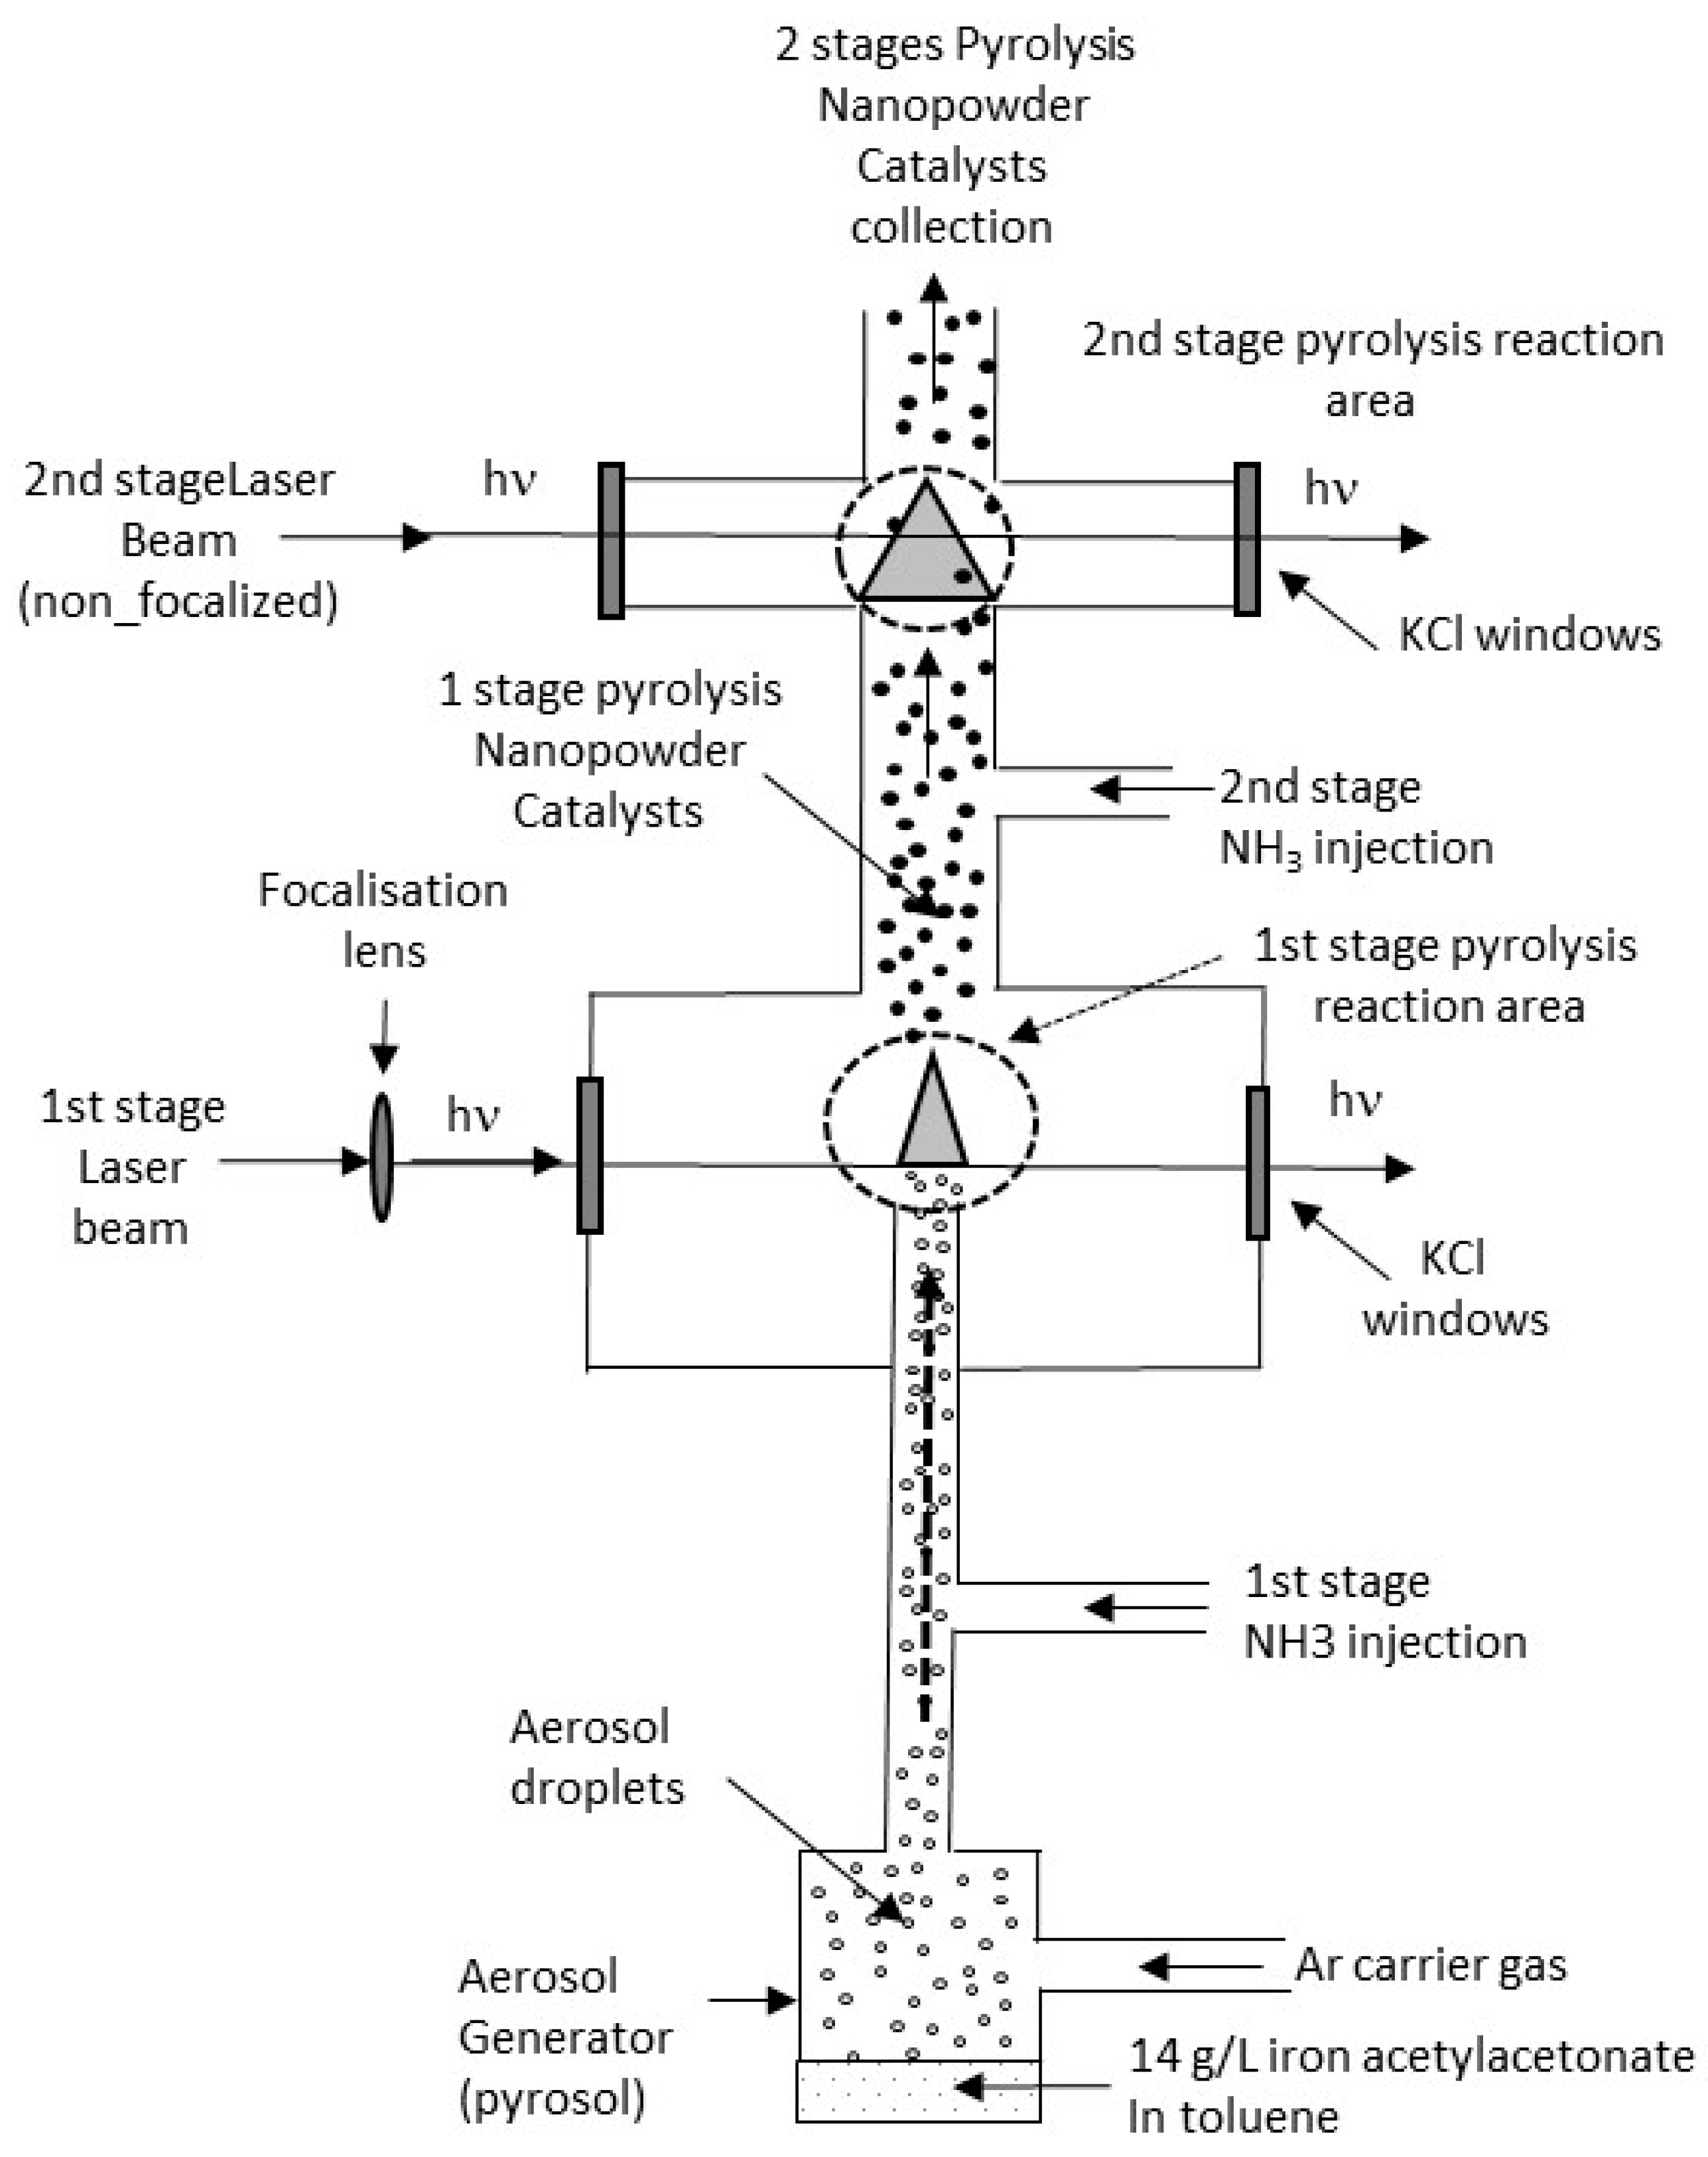
Toluene and iron III acetylacetonate Fe(C5H7O2)3 referred as Fe(acac)3 were purchased from Sigma Aldrich (St.Louis, MO, USA) and used as received. The liquid precursor media was a solution of Fe(acac)3 in toluene set at a concentration of 14 g/L. The CO2 laser pyrolysis was conducted in a reactor allowing a simple or double ammonia-induced pyrolysis. A liquid droplet aerosol was produced using a Pyrosol® 7901 type piezoelectric aerosol generator from RBI (Melan, France). For single CO2 laser pyrolysis, the aerosol was driven using an argon flow mixed with an ammonia flow just before crossing the CO2 laser beam. As in previous work [10,11], the flows of argon and ammonia define the so-called R parameter as the flow volume fraction of ammonia in argon. For the experiments carried out in this study, the R parameter was set at different values: 0.22, 0.40, and 0.48. For double ammonia-induced CO2 laser pyrolysis, the powder flow formed at the first stage of the reactor was mixed with a second ammonia flow and was allowed to cross a second CO2 laser before being collected on the filtering barriers. The first-stage CO2 laser was a PRC2200 (PRC, Ladson, SC, USA) set at 95% of its maximum power and the second-stage CO2 laser was a PRC 2800 set at 80% of its maximum power. The materials were collected on filtering barriers and washed with acetone using a Soxhlet extractor.
2.2. Characterization of the Fe/C/N Electrocatalysts
Thermogravimetric analysis was conducted in order to determine the iron content in the catalysts after Soxhlet washing. For this, samples were heated at 800 °C under air for 20 min. The iron residue is a typical Fe2O3 structure, and its weight was used to calculate the iron content in the powder.
Specific surface areas were determined by gas adsorption using the single point BET approach and a Micromeritics FlowSorb II 2300 instrument (Micromeretics, Mérignac, France), with a gas mixture of 30 vol% N2 in He. The sample were outgassed at 250 °C or 300 °C for at least two hours before measurement.
Raman spectra were acquired in ambient conditions using a Horiba XPLORA PLUS spectrometer (Horiba, Longjumeau, France) at an excitation wavelength of 532 nm in the range of 100–4000 cm−1. Relevant quantitative Raman parameters were obtained from the deconvolution of Raman spectra by conventional fitting procedures, after using a linear baseline and Voigt functions (a combination of Gaussian and Lorentzian functions, the proportion of which is adjusted to each spectrum) using Horiba Labspec 6 software. Output parameters include the position, intensity, full-width at half maximum (FWHM) and integrated area of all the bands (D, D′, D3, D4, and G) as proposed by Sadezky et al. [13].
Scanning Electron microscopy (Zeiss, Marly le Roi, France) was recorded using a Zeiss 1525 Microscope provided with a Gemini field effect gun column.
For selectivity measurements, a JASCO-570 UV-Visible spectrophotometer (JASCO, Lisses, France) was used.
Finally, XPS analysis was performed with a Thermo NEXSA spectrometer (Thermo Electron, Waltham, MA, USA) to obtain the particle surface composition and the feature of the N1s core level. The X-ray excitation was the K-alpha aluminum line at 1486.7 eV. A constant analyzer energy (CAE) mode was used for the electron detection (20 eV pass energy value was chosen). The detection of the photoelectrons was perpendicular to the sample surface. This latter consists in porous electrodes formed by filtration of a catalyst’s dispersion on carbon felts on which a 30 nm gold layer was previously deposited by vacuum evaporation. This gold deposit prevents the potential collection of carbon and nitrogen photoelectrons from the carbon felt. Generally, before XPS analysis, the electrode was submitted to the electrochemical conditioning step described hereafter.
2.3. Electrode Preparation and Electrochemical Measurement
Perchloric acid 70%, Hydrogen peroxide 30% by wt., Horseradish peroxidase (HRP) 25 K, and 2,2′-azino-bis(3-ethylbenzothiazoline-6-sulfonate (ABTS) were obtained from Merck (Darmstadt, Germany). Cyclic Voltammetry (CV) was recorded using a Bio-Logic VMP3 potentiostat (BioLogic, Seyssinet-Pariset, France). As described in detail in previous papers [10,11,14,15,16,17], CVs were recorded on porous electrodes prepared by filtration on a carbon felt H2415 I2C3, from Freudenberg (Weinheim, Germany), of liquid dispersions obtained by sonication of catalysts powders in acetone or isopropanol. The amount of catalyst on each electrode was obtained by weighting the carbon felt before and after catalyst deposition. The catalysts loading in the electrodes was between 2.2 mg and 3.4 mg and the macroscopic surface area of the deposit was 1.76 cm2 or 0.78 cm2. Before ORR CV recording, the porous electrodes were submitted to an impregnation procedure aiming at flooding the porous electrode by the electrolyte. The electrodes were then submitted to an extended scan (200 to 250 scans) at 100 mV·s−1 from 1 V vs. SHE to 40 mV vs. SHE. Also described in previous works [10,11,14], since the catalysts were not acid leached before electrode preparation, this conditioning cycling step gives rise to more or less iron removal into the electrolyte. The complete iron removal is shown by the vanishing of iron related redox peaks, providing a stable voltammogram [14]. After a 20-min delay in order to reload the electrode porosity with O2 saturated electrolyte, the electrodes were finally polarized at 1 V vs. ENH for 4 min and the ORR CV was recorded at 5 mV·s−1. The same measurements were performed under argon in order to correct the ORR CV obtained in O2 conditions. In this work, all the potentials were measured using a Sodium-Satured Calomel Electrode (SSCE), (Radiometer analytical, Villeurbanne, France). On the CVs presented in the paper, potentials were reported versus the Standard Hydrogen Electrode (SHE, −0.236 V vs. SSCE). The ORR performance of the catalyst was evaluated by its onset potential. The determination of the latter was performed on the CV_O2-Ar obtained by the difference between the CV recorded under oxygen (CV_O2) and the CV recorded under argon (CV_Ar). On CV_O2-Ar the onset potential is the higher potential just before which the ORR current shows an exponential variation. Appendix A gives detailed examples of CV_O2, CV_Ar and CV_O2-Ar and show how the ORR onset potential is determined.
The selectivity of the ORR was measured on porous electrodes at 600 mV vs. SHE, in a 25 mL HClO4 0.1 M electrolyte solution. It was performed using an original approach initially reported in detail in [18] and since exploited in several reports by us [11,14,17]. It consists of an accurate and very sensitive assaying of the hydrogen peroxide possibly formed into the electrolyte during the ORR. The assay exploits the complete consumption of H2O2 by the peroxyase HRP enzyme in the presence of the ABTS dye. The ABTS regenerates peroxidase that previously consumes H2O2, producing a radical cation (ABTS+) with an absorption at 414 nm, the intensity of which is proportional to the amount of H2O2 initially present in the sample. From this HRP-ABTS system and using solutions of H2O2 of known concentration in perchloric acid, a calibration curve reporting the absorption at 414 nm as a function of H2O2 concentration was built (see Appendix B). Then, the ORR was recorded during the chronoamperometric experiment performed under stirring, at a given potential (600 mV vs. SHE here). At a given time of the chronoamperometry, a sample of the electrolyte was collected, in which the H2O2 was assayed by spectrophotometry. For that, both spectrophotometer cuvettes, sample and reference, are previously filled with 3 mL of a phosphate buffer solution with HRP (≈0.020 g/L) and ABTS (≈0.040 g/L). The electrolyte sample (generally 200 µL) is injected in the sample cuvette of the spectrophotometer while the same volume of HCLO4 was injected in the reference cuvette. The absorbance was then measured at 414 nm and the H2O2 concentration in the cuvette was calculated from the slope of the calibration curve. If detected, the total amount of H2O2 produced in the 25 mL of HClO4 0.1 in the cell measurement is compared to the charge involved in the ORR at the same given time, which allows for the selectivity of the ORR to be calculated [18]. The electrodes on which the selectivity was measured at similar total catalyst loading were in the range of 3.2 mg to 3.7 mg.
3. Results
3.1. Synthesis
The configuration for double CO2 laser pyrolysis is schematized in Figure 1. For the synthesis of simple-stage ammonia-induced CO2 laser pyrolysis catalyst, the same experimental setup was used without the second-stage CO2 laser beam and ammonia injection. Catalysts formed by Single Stage (SSCat) or Double Stage (DSCat) CO2 laser pyrolysis are named, respectively, SSCat-XX and DSCat-XX, where XX is the value of the R parameter.
Three catalysts SSCat were prepared with R = 0.22, 0.40, and 0.48, and three corresponding DSCat were synthesized using the same conditions at the first stage and with a constant ammonia flow of 1500 standard cubic centimeters per minute (sccm) injected at the second stage while the second CO2 laser was on. Two different chemical yields (Table 1) were calculated for each synthesis by dividing the weight of material collected by the weight of liquid precursor consumed during the synthesis. Chemical yield for as formed materials ranged from 28.0% to 10.9%. The as-formed materials were washed with acetone using a soxhlet extractor in order to get rid of molecular impurities formed during the synthesis. Then, a second chemical yield after acetone washing was calculated. It is seen that the chemical yields drop when the R parameter increases. This trend is similar to those obtained when pyridine was employed as liquid precursor in previous studies [10].
For a given R, a comparison of the data related to SSCat on one hand and DSCat on another hand (Table 1) shows that the chemical yields are higher for SSCat than for DSCat, although the difference is lower after chemical washing. This suggests that DSCat contain fewer molecular side products than SSCat.
Table 1 also contains the production rate for as-formed material and the production rate corrected by the weight loss occurring during the acetone washing. It is seen that all the catalysts are produced at a significant rate of few g·h−1.
3.2. Characterization of the Catalysts
3.2.1. Specific Surface Area, Iron Content, and Morphology
Table 2 reports iron content and specific surface area of the catalysts SSCat and DSCat synthesized with R = 0.22, 0.40, and 0.48 at the first stage.
The data show that the iron content and the specific surface areas lies in the same ranges for both SSCat and DSCat for a given value of R. The iron content increases with R parameter, which was observed in previous work involving pyridine as a liquid precursor [10]. Conversely, and for unclear reasons at this time, the specific surface area is here found to increase moderately with the R parameter set at the first stage of CO2 laser pyrolysis reactor.
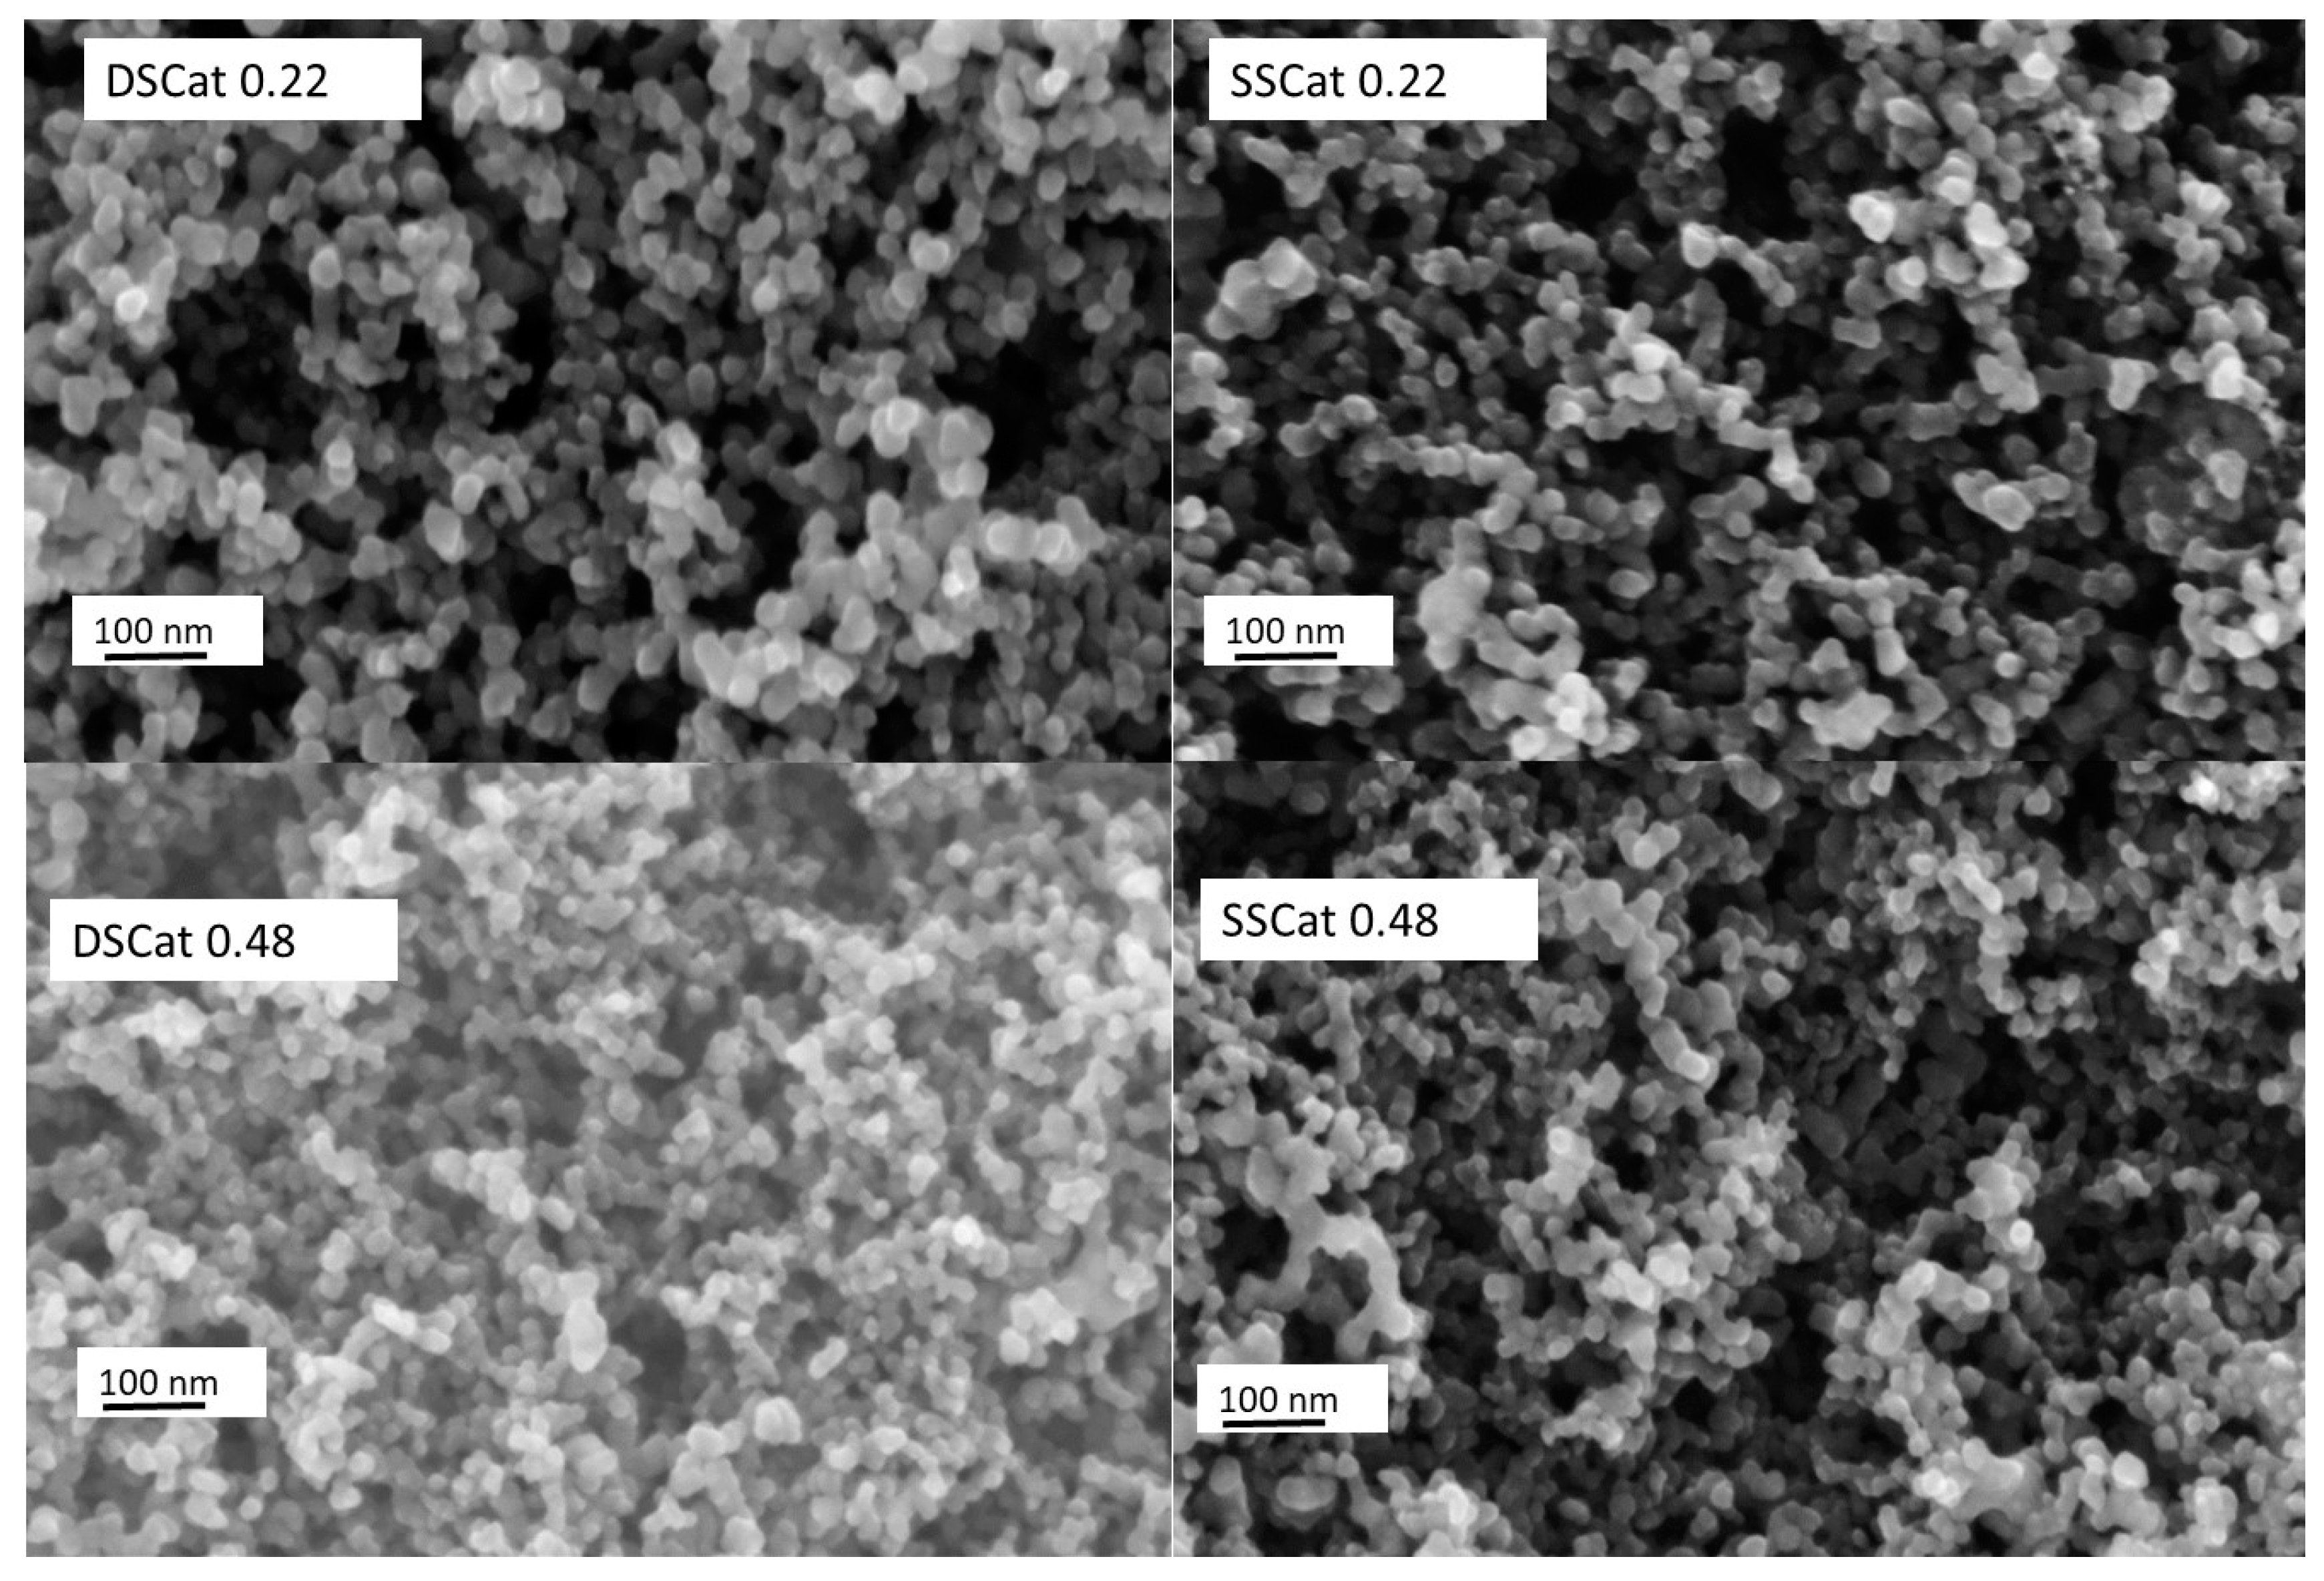
SEM typical micrographs of the synthesized materials (Figure 2, representative micrographs recorded for DSCat-0.22, SSCat-0.22, DS-Cat-0.48, and SScat-0.48) show that catalysts consist of spherical constituent particles strongly aggregated according a chain-like organization. The single particles have diameters comprised between ≈15 nm and ≈35 nm. The DSCat-0.48 sample seems to contain a larger number of smaller particles, which could be related to its higher specific surface area.
The SEM analysis did not reveal significant structural differences between the catalysts. Additional analysis by X-ray powder diffraction revealed amorphous pattern without diffraction peak a broad peak related to amorphous carbon.
3.2.2. XPS Analysis
The catalysts were characterized by X-ray Photoelectron Spectroscopy in order to determine the surface composition and to analyze the N1s core level feature.
Table 3 reports the surface composition of the catalysts obtained by XPS. Carbon is the main constituent for all materials. The nitrogen content increases with the R parameter value for SSCat, consistently with results from previous work [10]. For DSCat catalysts, the same trend is observed, but it is notably found that the nitrogen content for a given R is very close to that of the corresponding SSCat catalyst, which can be seen by similar values found for the nitrogen to carbon ratios (Table 3). Regarding iron, it was either not detected at all or found at trace level (0.1% At.). Therefore, N1s core level related to so-called FeNx sites considered elsewhere [19,20,21] were not considered below for N1s core level fitting. The latter was performed using an imposed peak full width at a half maximum set at 1.5 eV, i.e., the same conditions as those used in our previous papers dealing with Fe/C/N ORR electrocatalysts synthesized by CO2 laser pyrolysis. Such fitting conditions for N1s core level were adopted from a reference nitrogen containing polymer with two different well-defined nitrogen atoms [10].
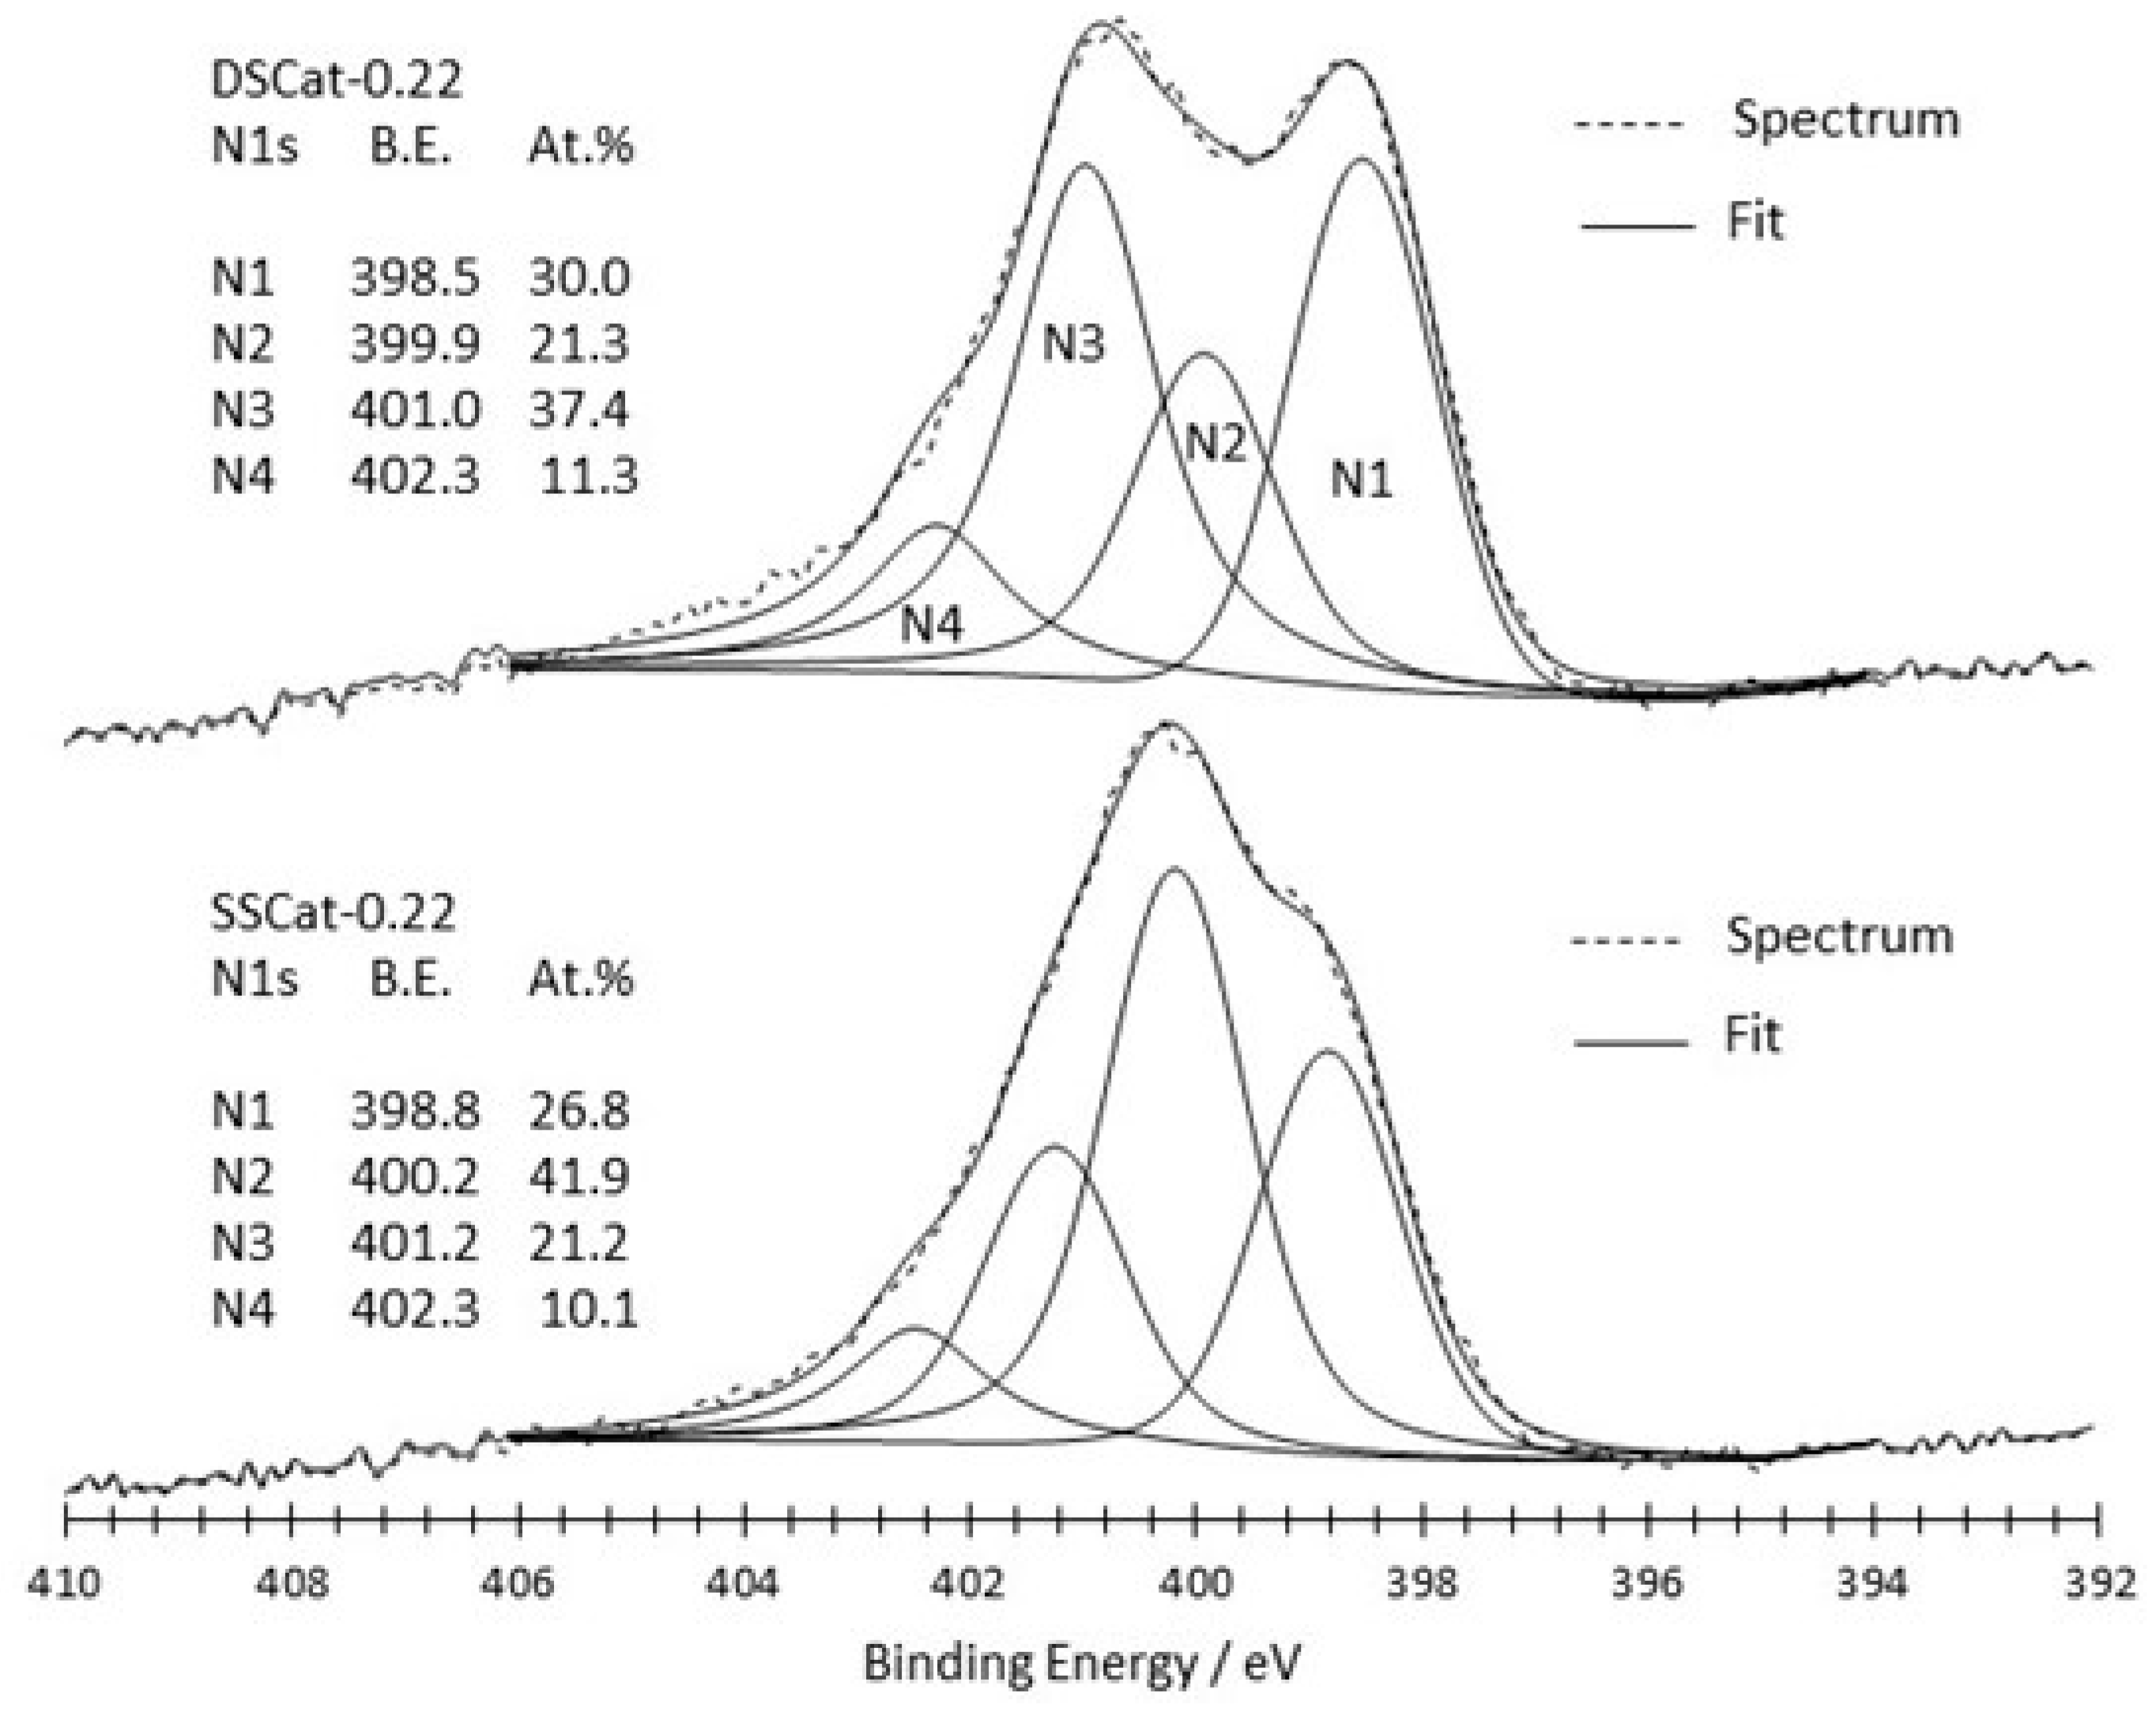
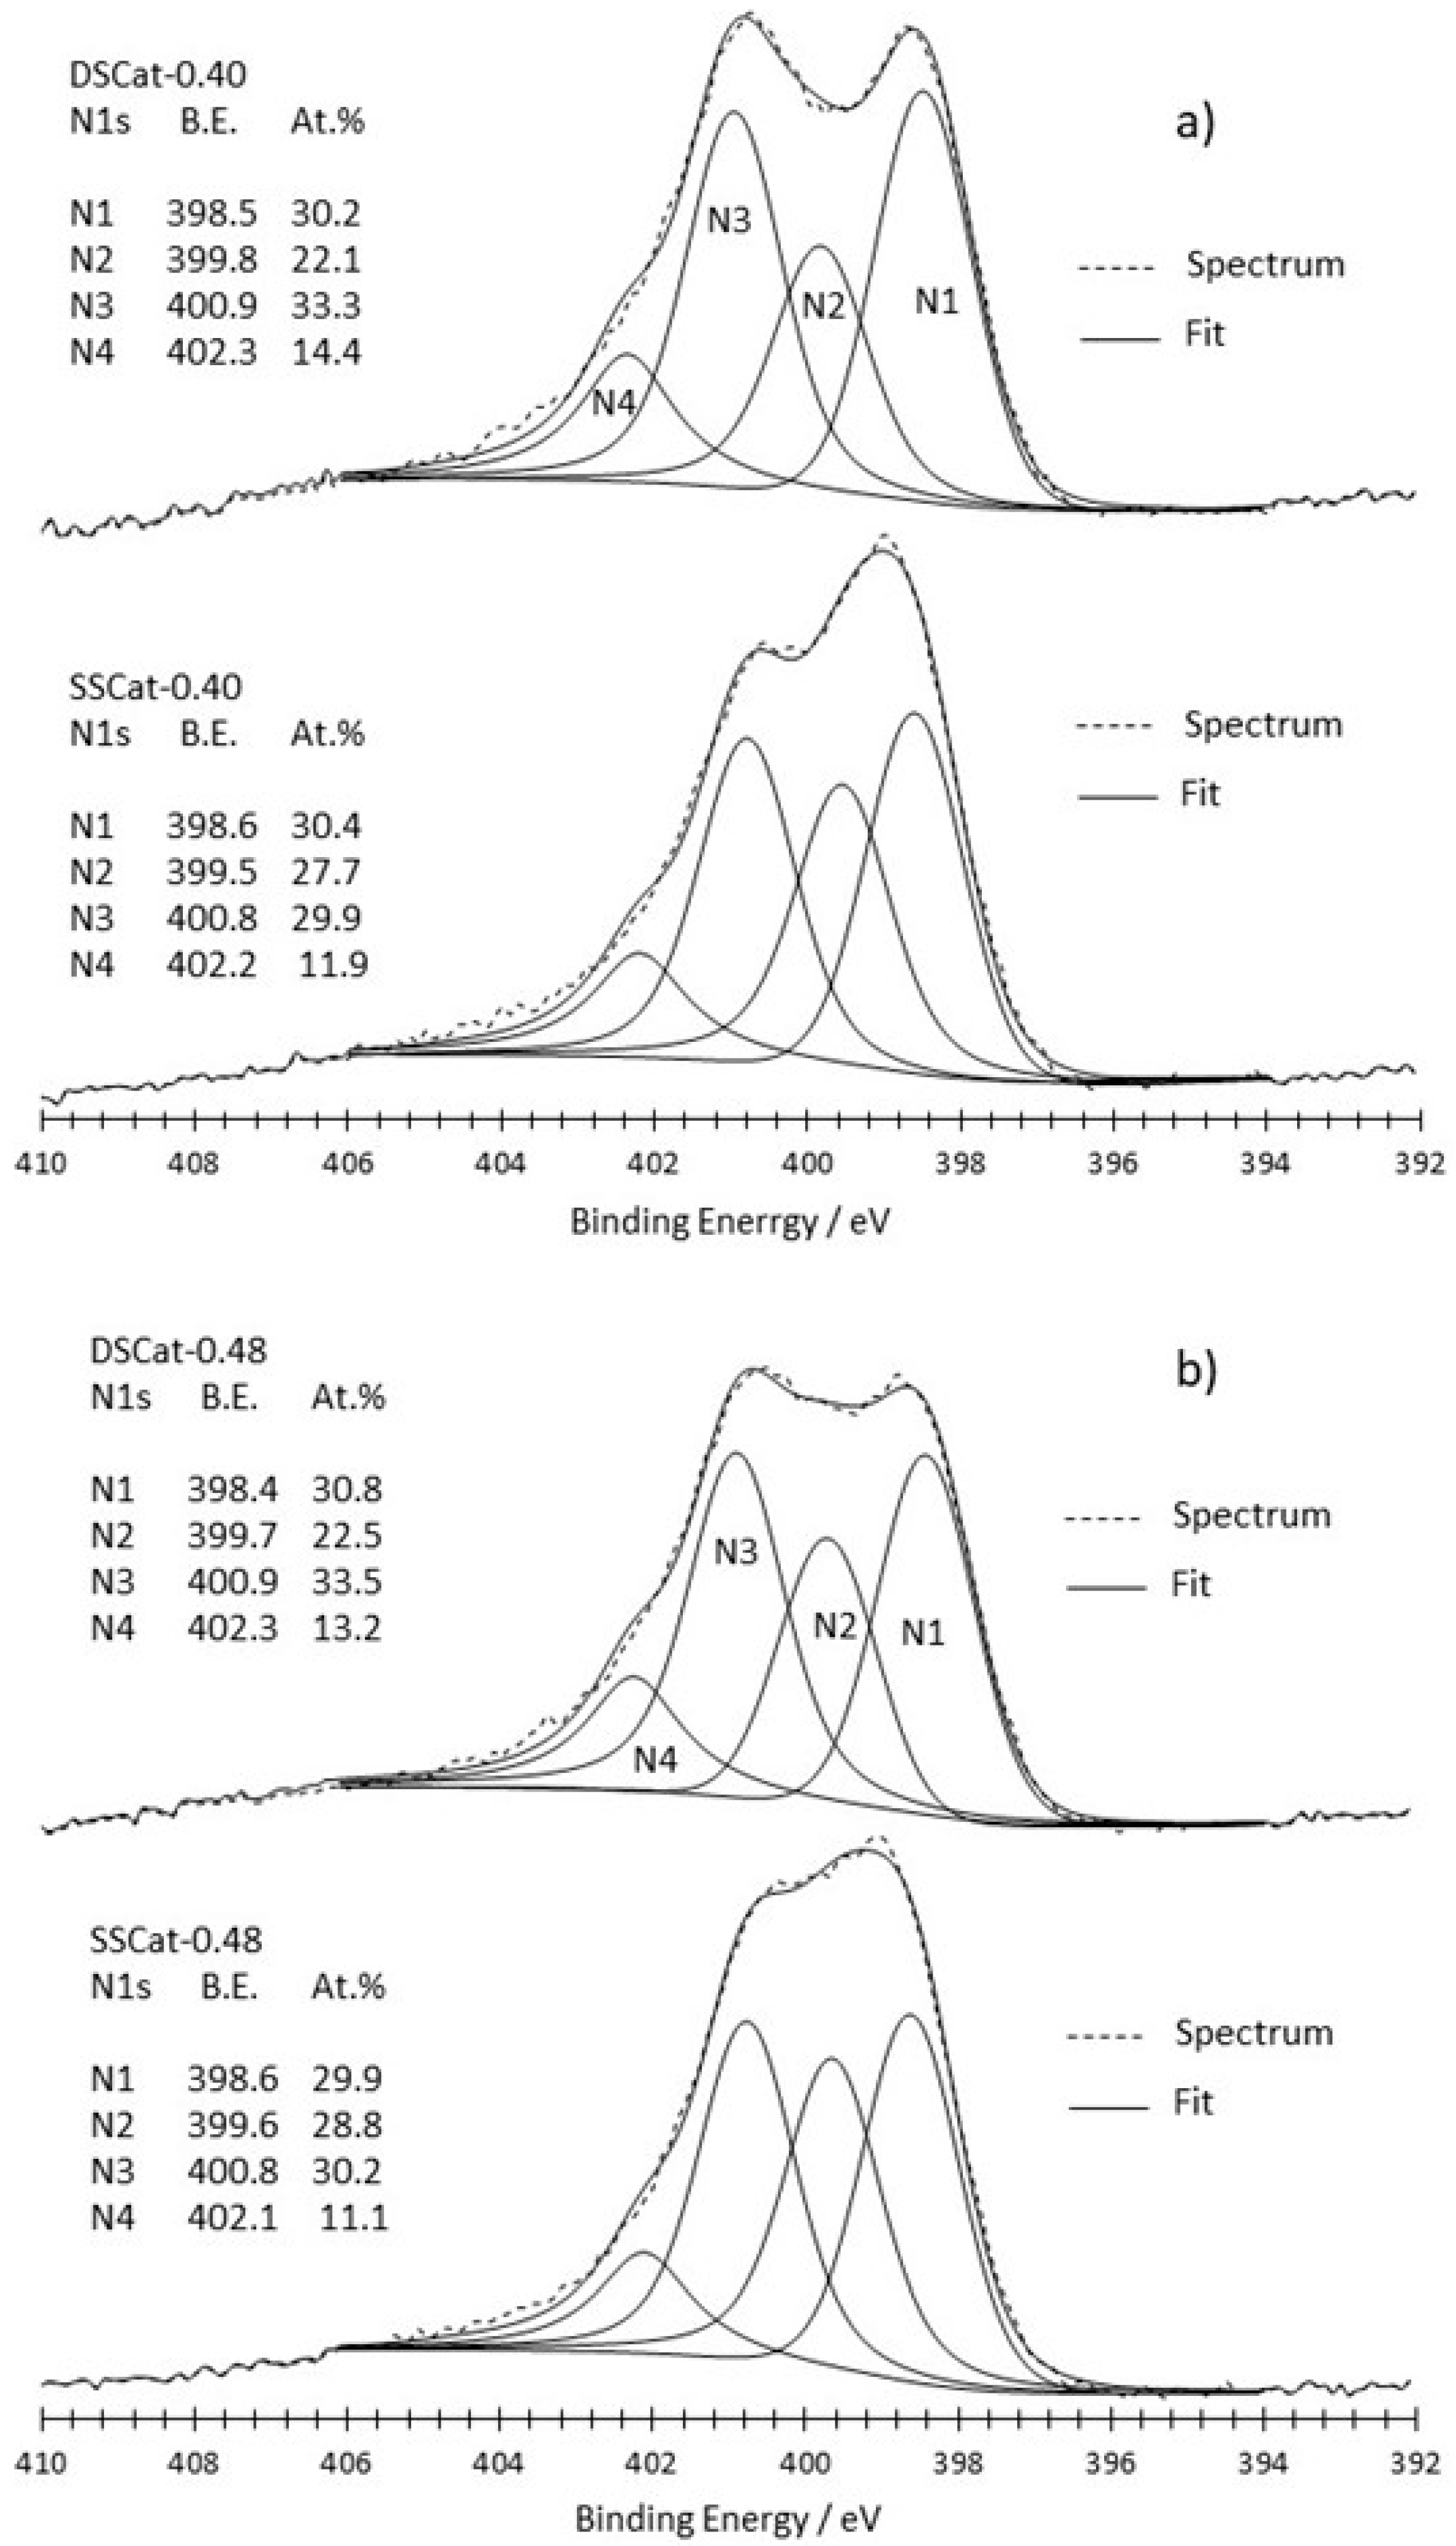
Figure 3 and Figure 4 show the N1s peak fitting comparison of SSCat and DSCat for R = 0.22 (Figure 3), and R = 0.40 and 0.48 (Figure 4a,b), respectively. It led each of the six materials to four N1s contributions, referred to as N1, N2, N3, N4, from lower to higher binding energy. The attribution of N1 to N4 nitrogen to a given nitrogen functionality is complicated by the numerous chemical environments in which nitrogen can be involved and by the fact that corresponding binding energies often overlap. Therefore, the assignment of a given binding energy to a given functional group remains a controversial topic. However, two different kinds of nitrogen functionalities can be considered, those which are present at the edge of graphite network (amine, imine, amide, and nitrile ones), and those which are embedded in the graphene planes (pyridine, pyrrole, graphite-like). While the first kind of nitrogen functionality is ORR inactive, the second kind is considered as responsible for the ORR activity of Fe/C/N electrocatalysts.
Figure 3 compares SSCat-0.22 and DSCat-0.22 on which the binding energies of N1–N4 contributions and weights are also reported. Binding energies shown in Figure 3 for both catalysts are overall close to each other, suggesting similar nitrogen species in both materials. The major difference between both materials is actually the weight of the N2 contribution, which is two times higher in the material prepared by single-stage CO2 laser pyrolysis i.e., SSCat-0.22. The N2 contribution in the latter is slightly shifted towards high binding energy by 0.3 eV compared to DSCat-0.22.
Figure 4 reports the N1s core level fitting for SSCat and DSCat for R = 0.40 (Figure 4a) and R = 0.48 (Figure 4b).
The two spectra corresponding to single-stage CO2 laser pyrolysis (SSCat-0.40 and 0.48) are quite different from the one recorded for SSCat-0.22 shown in Figure 3. Indeed, compared to the latter, SSCat-0.40 and SSCat-0.48 show lower N2 binding energy (399.5 eV and 399.6 eV compared to 400.2 eV) and the N2 weight is much lower than in SSCat-0.22. Besides, and consistently, the spectrum of SSCat-0.40 (Figure 4a) is similar to the one reported in previous work [11] for a single-stage synthesis performed with the same precursor liquid media and at R = 0.40 in a single-stage CO2 laser pyrolysis reactor. Actually, the SSCat-0.48 catalyst N1s spectra looks like the SSCat-0.40 one, which can be explained by the quite close ammonia flows involved at the first-stage pyrolysis: 1100 sccm and 800 sccm, respectively, compared to the one involved for SSCat-0.22, which is considerably lower (340 sccm). In the two first materials, the weight of N1 and N3 nitrogen species dominates and represents more than 60% of the total nitrogen content, while it is only 48% for SSCat-0.22.
Finally, the comparison of N1 to N4 weights from SSCat to DSCat (Figure 4) for rather high R values of 0.40 and 0.48 reveals that N1 weight is quite unchanged, N2 drops significantly, while N3 and N4 slightly increase.
3.2.3. Raman Spectroscopy
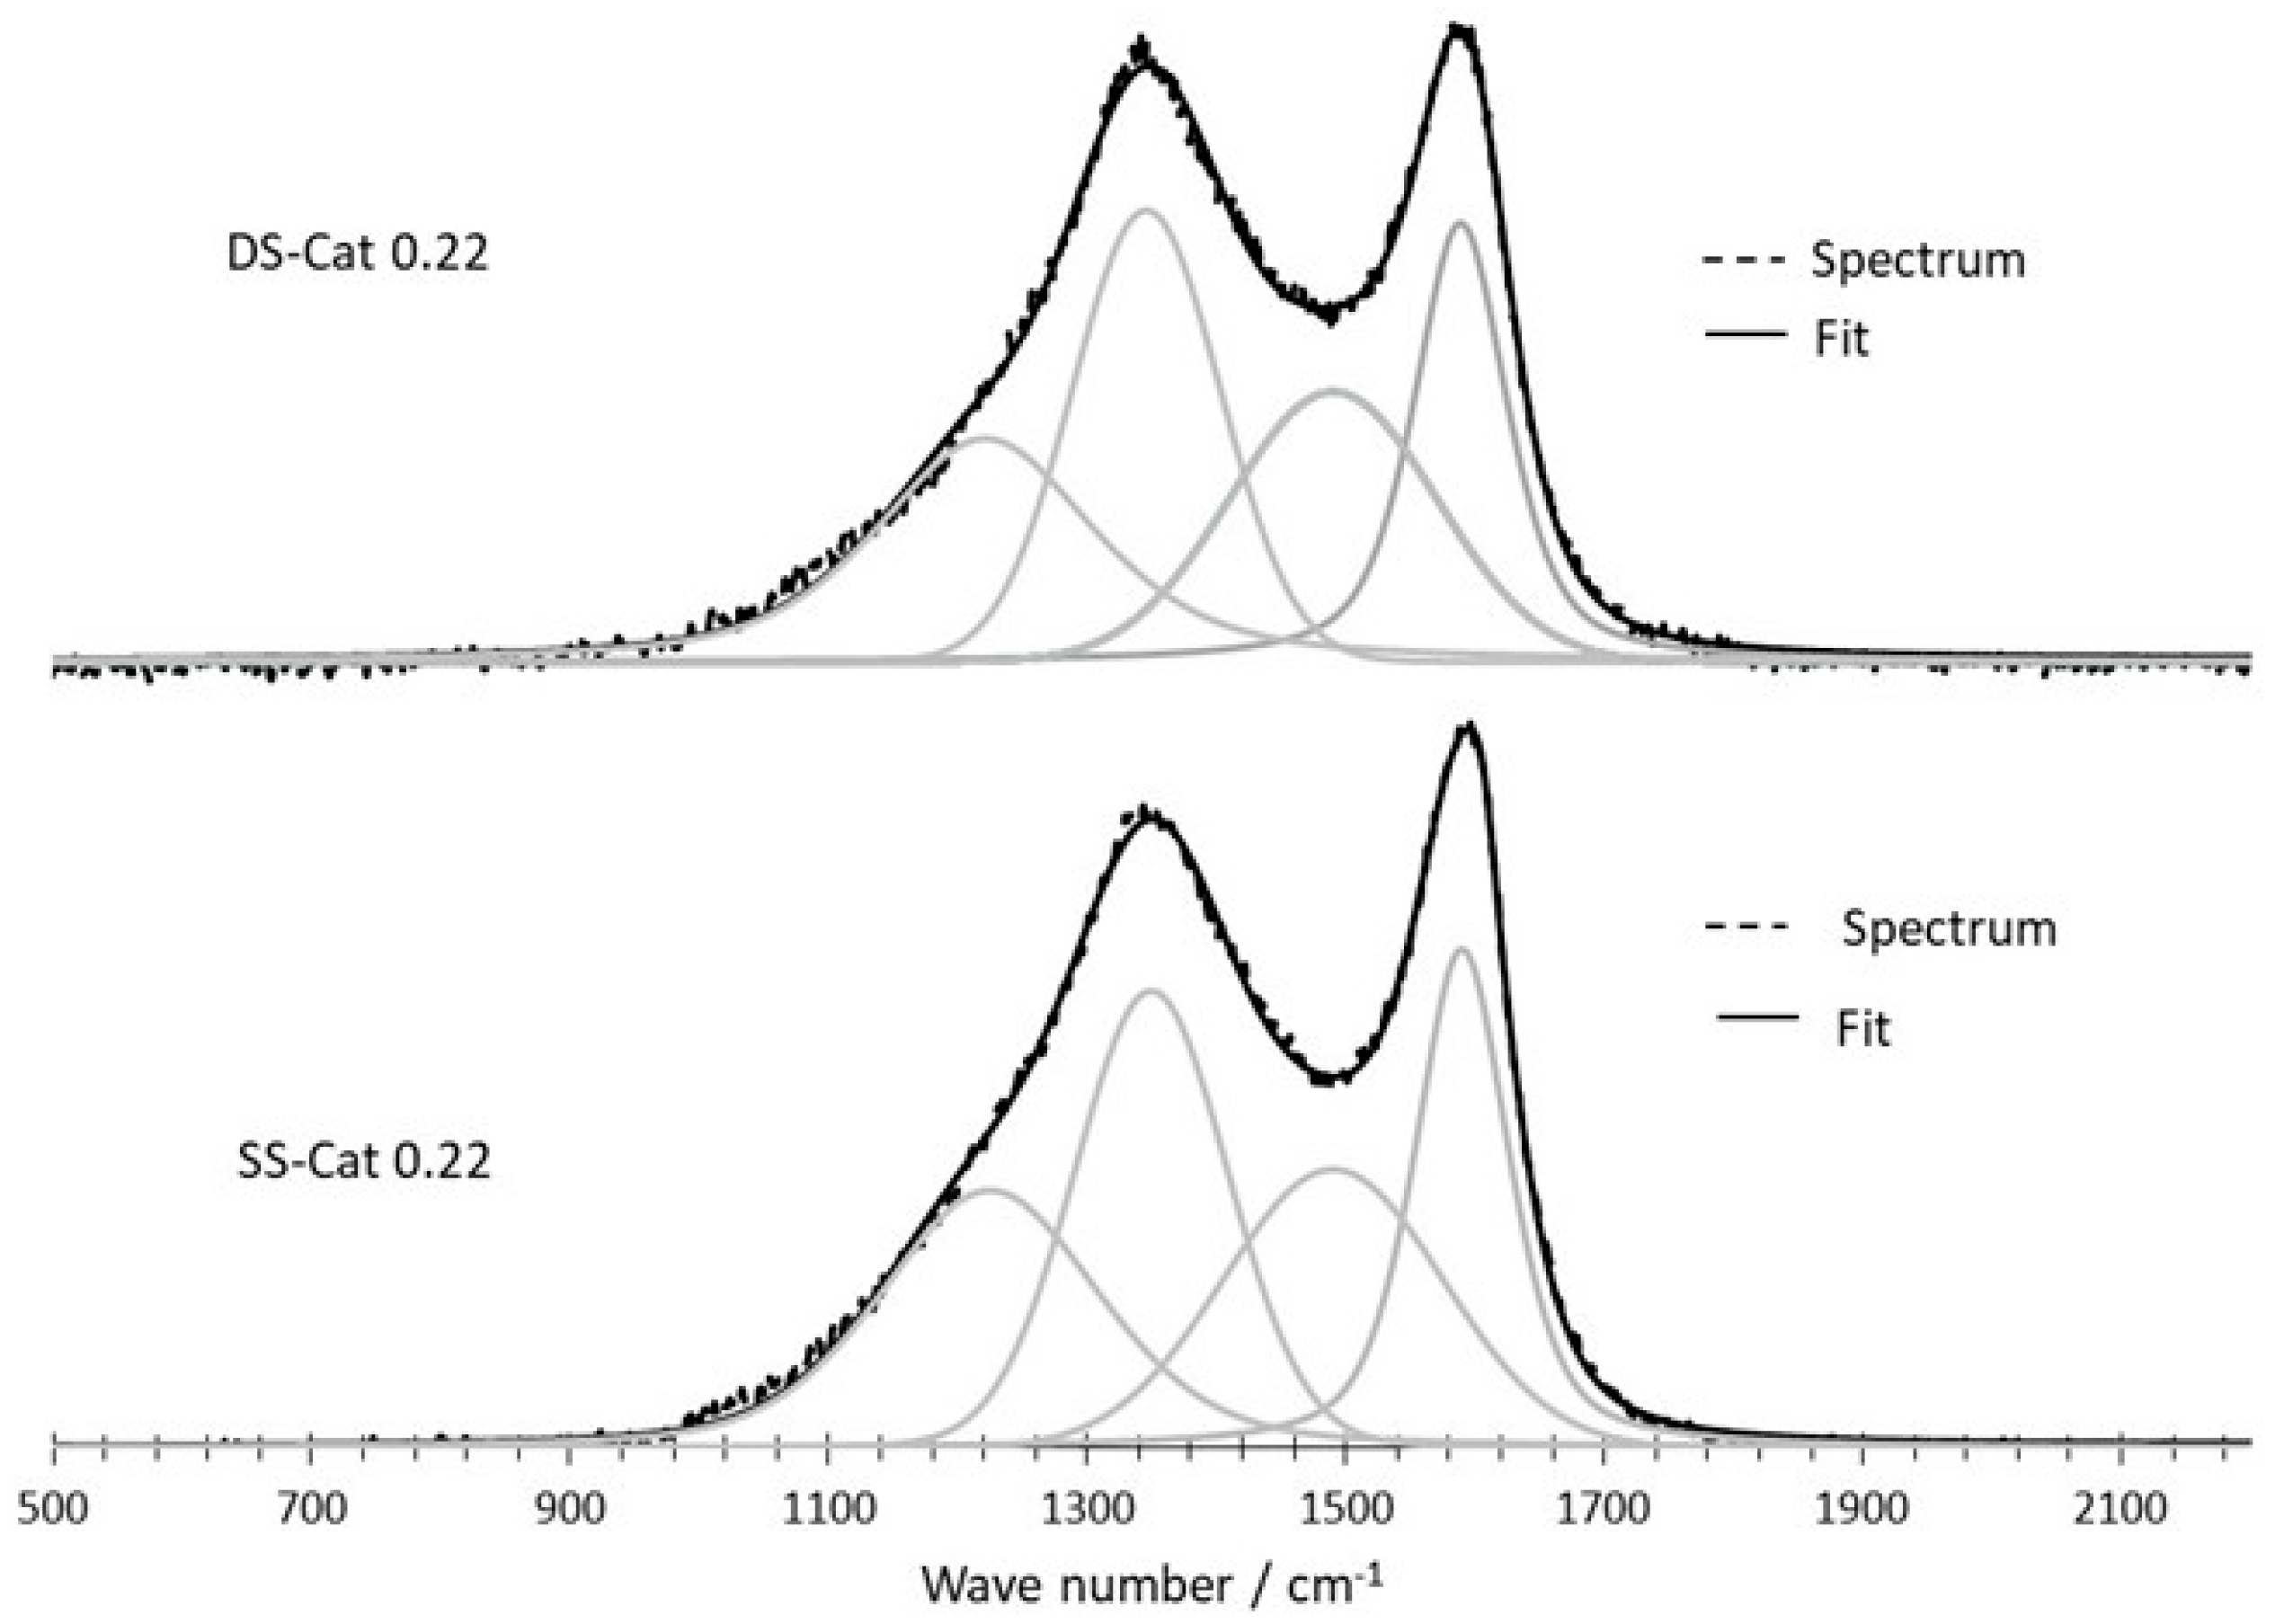
Raman spectroscopy is used to evaluate the organization of carbon-based materials at the structural (atomic) scale, and especially the degree of order. Single-crystal graphite is characterized by a single band at 1581 cm−1 (referred to as the “G band”) in the first order region of the spectrum (1000–2000 cm−1), attributed to the E2g mode. The D band at 1350 cm−1 as well as the D′ (or D2) band at 1620 cm−1 are related to the presence of defects in the graphitic structure [13]. The D3 and T (or D4) bands correspond respectively to the disordered carbon formed by sp2 [11] and sp3 bonds [22].
The characteristic Raman peak intensity ratio ID/IG is a commonly used and useful qualitative and quantitative way of evaluating the structural defects to graphitization or crystallinity ratio in carbon material; the degree of order increases when the ID/IG ratio decreases (ID/IG ratio of graphite = 0) [23].
Figure 5 displays the spectra and corresponding fitting for SSCat-0.22 and DSCat-0.48 showing the most significant differences among all the spectra recorded.
Table 4 reports the ID/IG ratios for the whole set of catalysts. The data are an average of five to six6 measurements recorded on each material from which a standard deviation was determined.
The results obtained for the ID/IG values are quite close each other, and taking into account the standard deviations, the effect of the second-stage CO2 laser pyrolysis seems more pronounced for the catalysts prepared at R = 0.22.
3.2.4. ORR Measurements
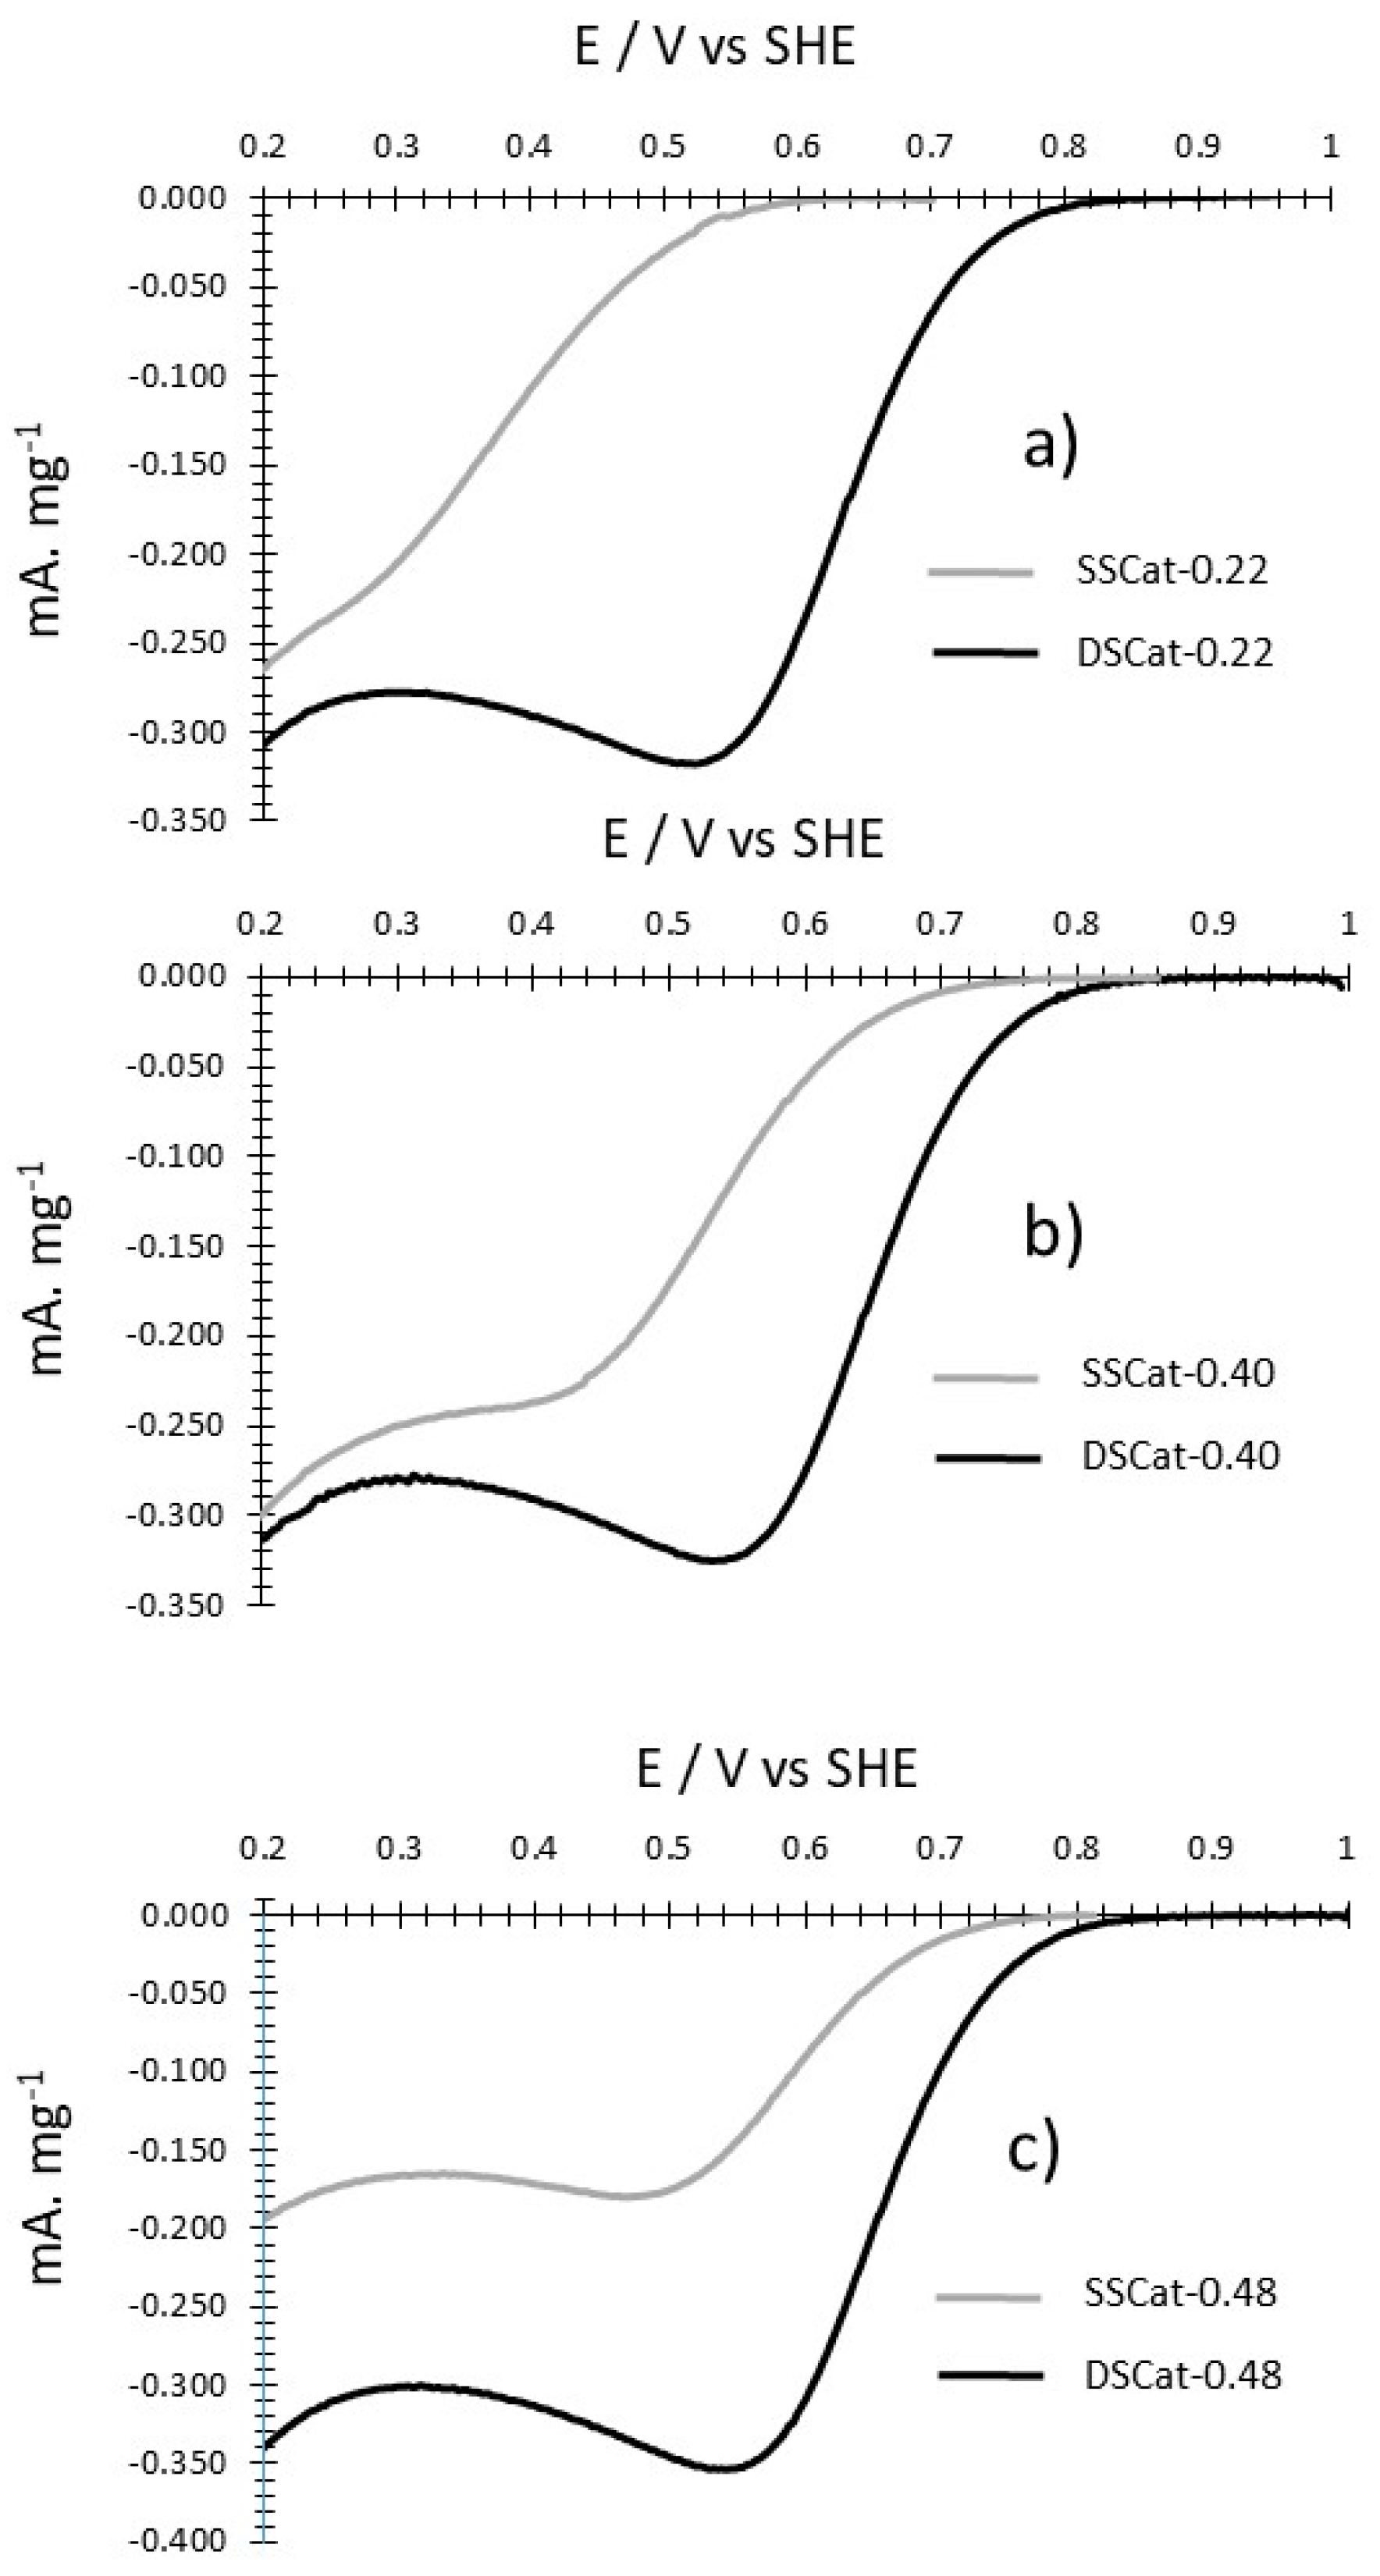
The oxygen reduction was recorded on porous electrodes in HClO4 1 M at 5 mV·s−1 as detailed in the experimental section. Figure 6a–c compares the representative background corrected oxygen reduction CVs for each R value, for SSCat and the corresponding DSCat. The currents thus obtained have been divided by the weight of catalyst deposited on the carbon felt (see Section 2.3).
The effect of the second ammonia-induced CO2 laser pyrolysis is clearly illustrated by these data since the DSCat exhibit systematically higher performances than SSCat. From R = 0.22 to 0.40 and 0.48 the onset potential for the ORR is improved respectively by ~200 mV, ~70 mV, and ~85 mV for DSCat compared to corresponding SSCat. Concerning the DScat performances between them, the results suggest that changing the R value at the first-stage pyrolysis has little influence, since DSCat have slightly improved ORR performances with the onset potentials at ≈845 mV for DSCat-0.22, ≈860 mV for DSCat-0.40, ≈885 mV for DSCat-0.48. Finally, the highest ORR potential obtained here approaches the best ones reported in the literature, which lie between 880 mVSHE and 930 mV/SHE [8,20,24,25].
3.2.5. ORR Selectivity Measurement
The ORR in acidic medium may occur through the so-called four electrons pathway producing H2O according to Equation (1) or through the two electrons pathway, thus producing H2O2 (2).
O2 + 4H+ + 4e− → 2 H2O
O2 + 2H+ + 2e− → H2O2
When both pathways occur, the average number of electron n, exchanged per reduced oxygen molecule can be measured. In this work, the selectivity of the three DSCats and their corresponding three SSCats catalysts was investigated by assaying the H2O2 produced by the ORR, during a chronoamperometry recorded under at 600 mV vs. SHE and under stirring. Such a potential was chosen because the CVs (Figure 6) indicates that the ORR current is high in this potential region. Figure 7 reports the ORR chronoamperometry recorded for the catalysts over 30 min. For each of the six catalyst, the ORR chronoamperometry electrolyte samples (200 µL) were collected after 10, 20, and 30 min and the H2O2 was assayed.
From each assaying, the total number of moles of H2O2 and n_H2O2 produced in the cell was calculated (see Section 2.3). From n_H2O2 the number of electrons involved in the two-electron pathway ORR reduction, Ne−_H2O2, is calculated using (3):
Ne−_H2O2 = 2 × n_H2O2
The charge Q indicated by the chronoamperometry allows the total number of electrons involved in the ORR, N Total e−_ORR, to be calculated from (4) where F is the Faraday constant (96,485 C):
N Total e−_ORR = Q/F
The number of electrons produced by the four-electron ORR pathway (1) thus producing H2O (Ne−_H2O) is given by (5):
Ne−_H2O = N Total e−_ORR–Ne−_H2O2
Finally, the averaged selectivity of the ORR n is given by (6):
n = (2 × Ne−_H2O2 + 4 × Ne−_H2O)/(NTotal e−_ORR)
The selectivity can also be expressed through the percentage of H2O (H2O2%) produced per oxygen molecule reduced, which can be calculated using (7):
H2O2% = Ne−_H2O2/(NTotal e−_ORR × 100)
Table 5 reports the selectivity and the corresponding H2O2%. The data reported are an average of the measures recorded and 10, 20, and 30 min. Each of the three measurements for a given sample was quite close from each other as reported in Appendix B.
For SSCats, a strong effect of the R parameter on the selectivity measured at 0.6 mV/SHE is observed. Indeed, the fraction of hydrogen peroxide produced during the ORR decreases by 43% from SSCat-0.22 to SScat-0.48. The data for DSCats as a function of R show that the second laser pyrolysis has a marked effect for each R value. From SSCat to DSCat, drops for oxygen peroxide production are 22.4%, 38.3%, and 17.2% for 0.22, 0.40, and 0.48, respectively. Globally, these results show that at 600 mV/SHE, the catalysts reduce O2 in majority through the four electrons pathway and that DS-Cat_0.40 and 0.48 catalysts are, with that respect and as for the ORR onset potential, the best-performing catalysts.
4. Discussion
In previous work [11], we reported the effect of ammonia and argon thermal post-treatment conducted at 1100 °C for 20 min on a catalyst powder synthesized by single stage CO2 laser pyrolysis. This work was performed using the same liquid precursor media as the one involved here. For ammonia, this treatment resulted in the formation of a high specific surface area (≈1130 m2·g−1) ORR catalysts with an ORR onset potential recorded at ≈910 mV vs. SHE. In the present work, the thermal treatment performed under ammonia was conducted in the reactor using a second ammonia feeding and a second CO2 laser (see Figure 1). The synthesis conditions between the two-step synthesis reported earlier (simple-stage laser pyrolysis followed by annealing of the catalyst at 1100 °C for 20 min) and the single-step synthesis involving double ammonia-induced CO2 laser pyrolysis are quite different from each other. In particular, the duration of the interaction between ammonia and the catalysts under treatment is much higher in the two-step synthesis. This point would explain the much lower specific surface areas recorded for the DSCat catalysts in the present work compared to the highly active 1130 m2·g−1 catalyst reported earlier [11]. Since for a given R, the specific surface areas of SSCat and DSCat are in the same range, it is likely that carbon corrosion by ammonia, which promotes high specific area formation by formation of HCN and H2, did not occur to the same extent during the double-stage laser pyrolysis.
The electrochemical measurements show that for SSCat materials, the performance increases with the R value consistently, like it was reported earlier [10]. The SSCat-0.22 shows by far the lowest performance among the SScat, probably due to the lower ammonia feeding and/or lower temperature of the pyrolysis flame in these conditions, thus influencing both the nitrogen content and the kind of nitrogen site formed. Since this material shows the highest contribution for N2 nitrogen type (Figure 3), one may assume that for SSCat-0.22 this binding energy region possibly covers some nitrogen inactive sites such as amino, amine, and nitrile, whose N1s binding energies are compatible with N2 binding energy [26].
For DSCat, the ORR performance is slightly influenced by R, and the weight of N1 to N4 species is essentially the same in all the catalysts, except for the N3 component, which is slightly higher in DSCat-0.22. The quite high ORR activities recorded on these DSCat materials suggest that additional nitrogen active sites towards the ORR are present compared to those existing after the first-stage pyrolysis. The nitrogen species incorporated in the carbon network are described from lower to higher binding energies as pyridinic, pyrrolic, and graphitic nitrogens. Our fitting procedure led for all the catalysts to N1 component between 398.4–398.8 eV, which is compatible with pyridinic nitrogen. For N2 between 399.5 and 399.9 eV (except notably for SSCat-0.22 where it is found at 400.2 eV) this is compatible with pyrrolic nitrogen. For N3 binding energy situated between 401.2 and 400.8 eV, these values fall in the range of graphitic nitrogen. In previous work [11], the N4 nitrogen between 402.1 and 402.3 eV is a region attributed to graphitic nitrogen. This binding energy is compatible with graphitic nitrogen [27] but is also in the range of the 402–405 eV related to so-called oxidized nitrogen [28].
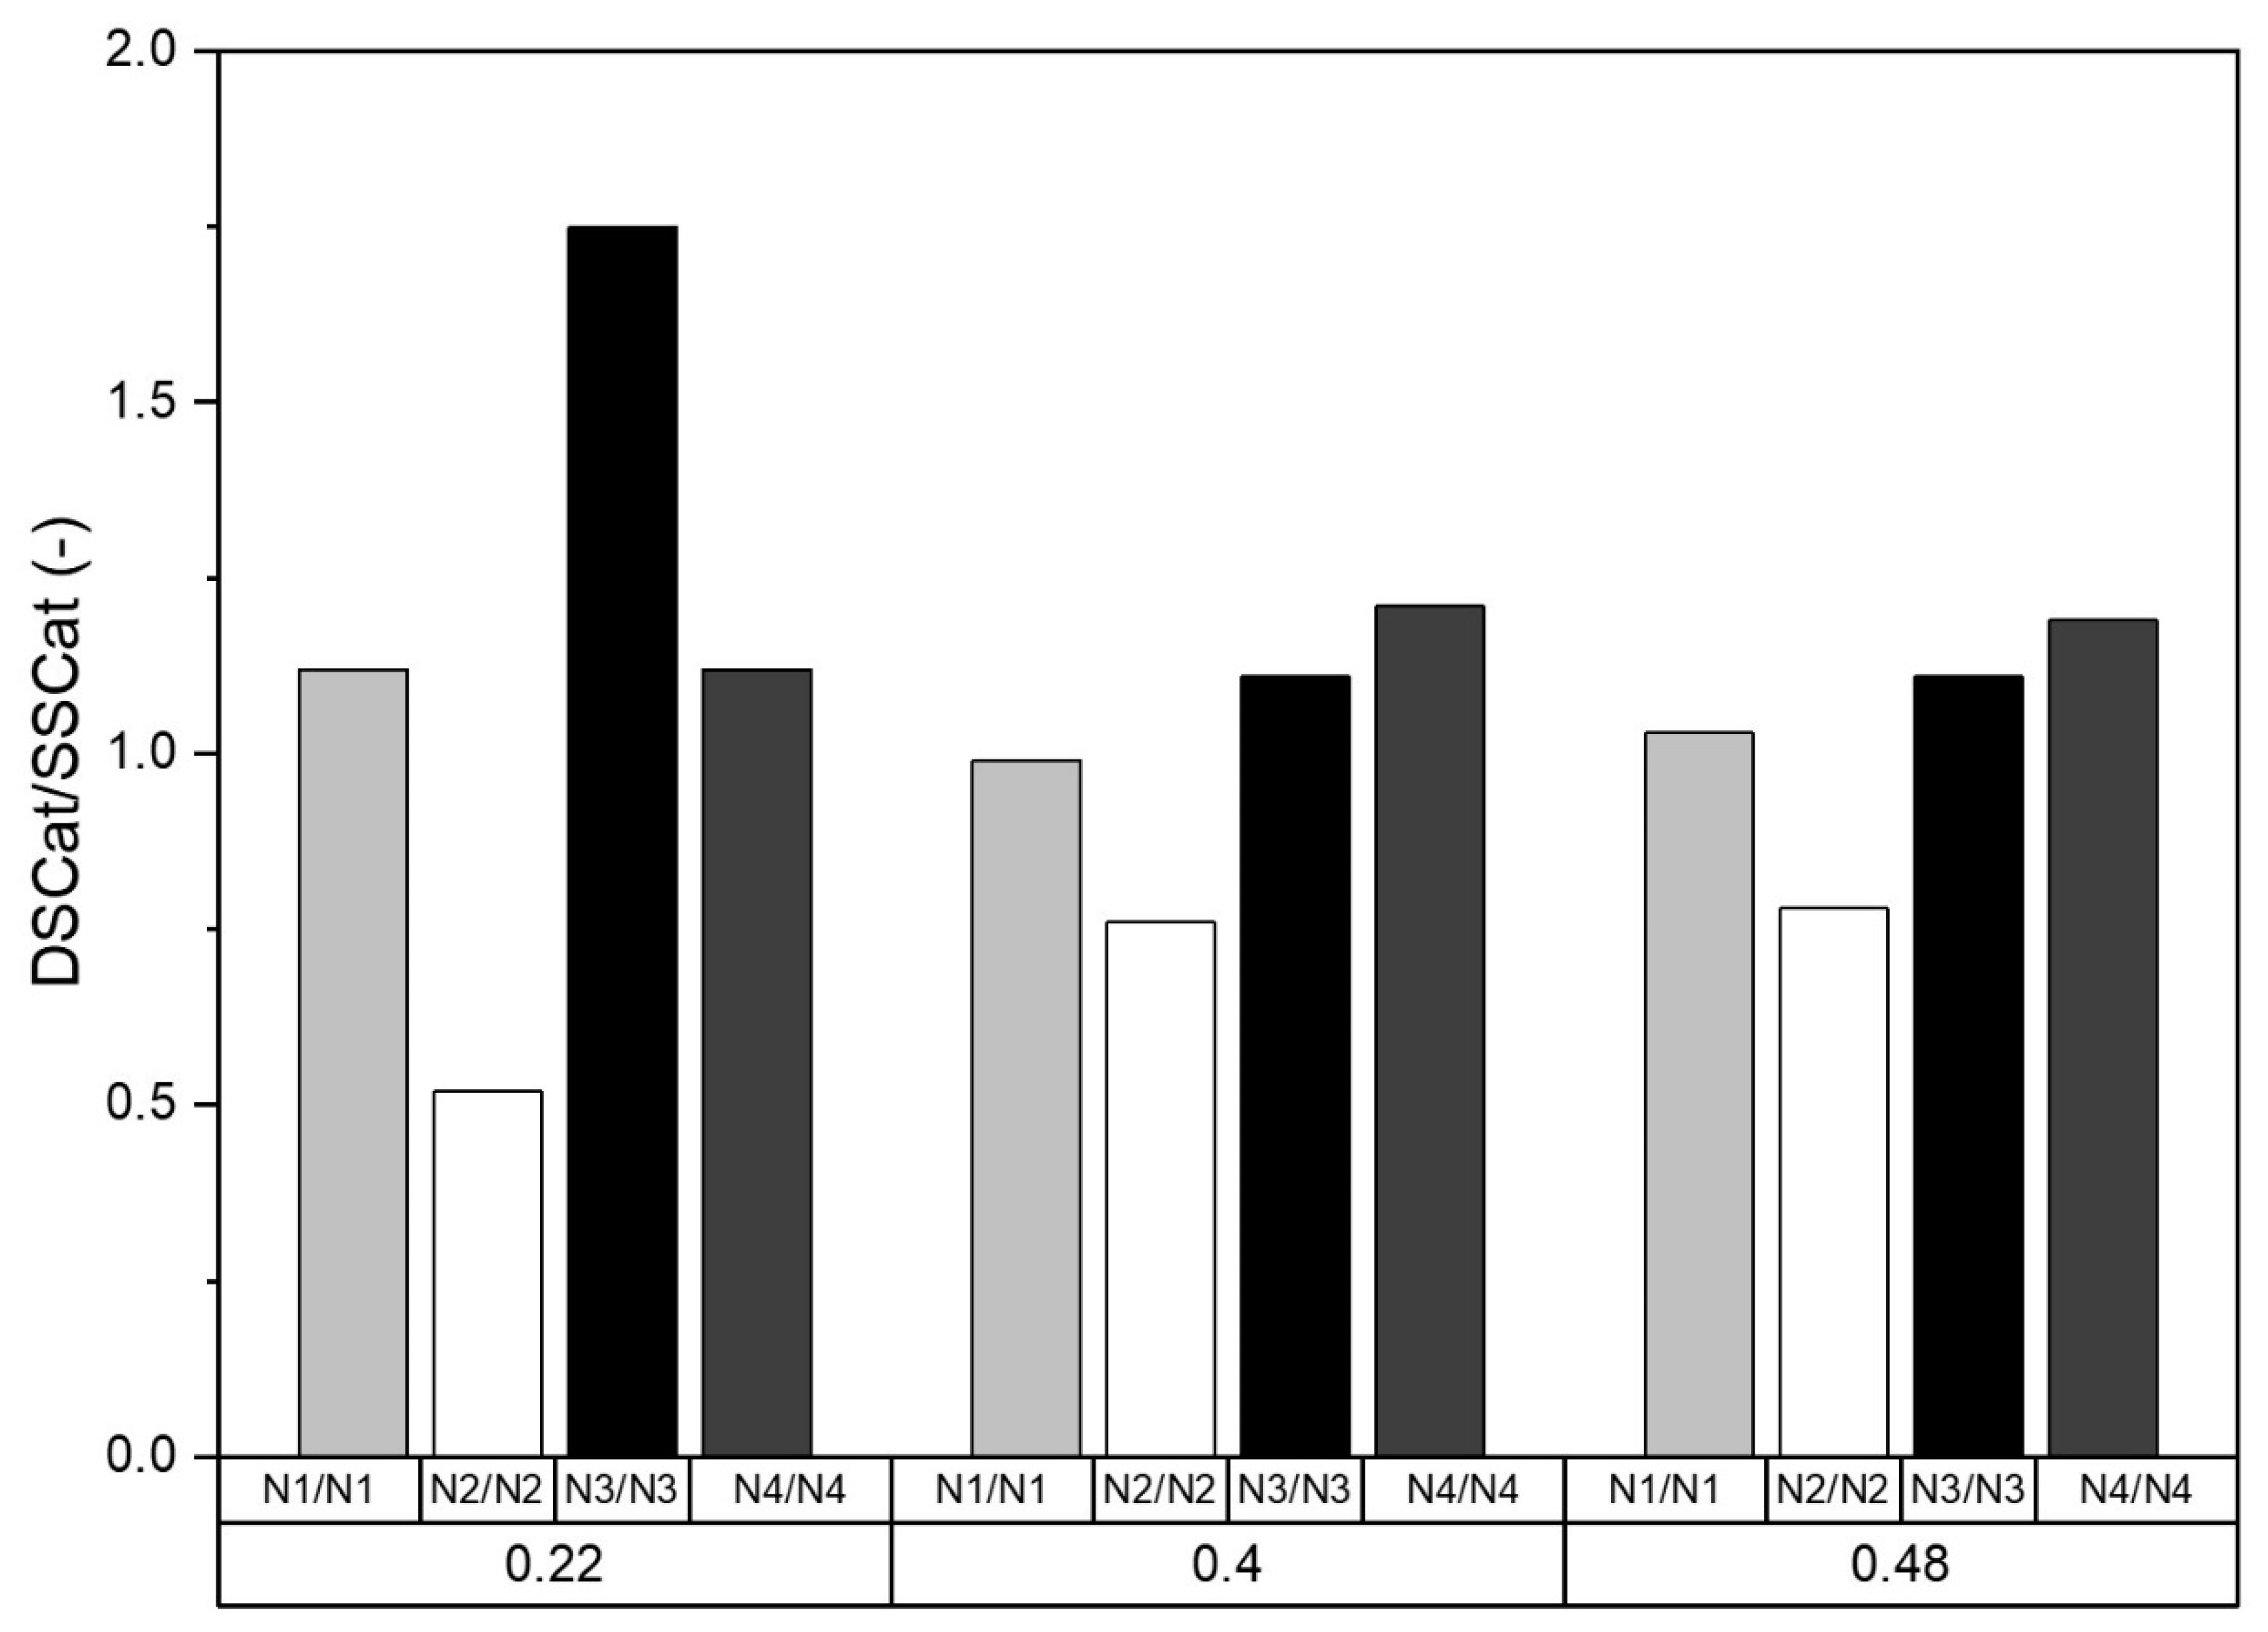
Finally, considering the catalysts from SSCat to DSCat reveals that the major effects of the second ammonia-induced CO2 laser pyrolysis is the strong improvement of the ORR and significant modifications in the relative weight of so-called N1 to N4 nitrogen species. The latter are pictured in Figure 8, which summarizes these modifications reporting the Nx DSCat/Nx SSCat calculated using the fitting of the XPS spectra, for N1 to N4 nitrogen and for each value of R involved in this work. The most striking feature is first the significant drop of the N2 component, that reaches a factor of two for R = 0.22, but in this case, it is possible that some ORR inactive sites elimination occurs in DSCat-0.22 compared to SSCat-0.22, due to the second pyrolysis. A second point here is the strong increase of the N3 (graphitic nitrogen). For R = 0.40 and 0.48, the modifications are similar but less marked. Taking into account the fact that for a given R, the total nitrogen content does not change drastically from SSCat to DSCat, one can assume transformation/decomposition of sites as described in the literature [29,30]. For example, pyrrolic nitrogen N2 is reported to evolve into pyridinic nitrogen (N1), which further decomposes or evolves into graphitic nitrogen (N3 and/or N4). This scenario could explain the trends observed in Figure 8.
Interestingly the singularity observed for R = 0.22 also appears in the Raman characterization. It is seen that the ID/IG rises significantly from SSCat-0.22 to DSCat-0.22 while for the other R values, it is relatively constant. We noticed a possible significant content of inactive ORR sites in SSCat-0.22 in the N2 region, corresponding to nitrogen function located at the edges of graphitized region that could explain its low ORR activity. The formation of nitrogen sites embedded in the carbon network for DSCat-0.22 compared to SScat-0.22 could explain the higher disorder recorded in the former.
Finally, in this work, although the effect of the second CO2 laser pyrolysis on the ORR performances is clearly demonstrated by the results, some points remain unclear. For example, it is seen that the second pyrolysis does not result in a significant increase of the specific surface area of the catalyst nor in a significant increase of the nitrogen content. This suggests that the second pyrolysis act more through a thermal effect than a chemical effect related to ammonia. However, this possibly conflicts with our previous report on the effect of thermal treatment performed under argon, in an oven at 1100 °C for 20 min [11]. Indeed, in this case, the ORR onset was improved by 60 mV compared to the as-formed material, but the onset potential was only ≈820 mV vs. SHE, which is much lower than the one recorded for DSCat studied in this paper. A second point concerns the fact that DSCat materials show quite similar ORR performances and XPS feature. This may suggest that the nitrogen content in the materials has a relatively low effect on the onset potential since from DSCat-0.22 to DScat-0.48 the C/N ratio (0.021 and 0.034, respectively) increases by a factor of 1.6 and the onset potential increases from 845 mV to 885 mV, which corresponds to ≈11% decrease in terms of ORR overpotential. Additional work is required to shed light on these points.
5. Conclusions
In this work, we have shown for the first time how the ammonia-induced CO2 laser pyrolysis conducted in a double-stage configuration can significantly improve the ORR performances compared to catalysts synthesized using one-stage CO2 laser pyrolysis. It is found that the second pyrolysis practically weakens the strong effect of the R parameter related to NH3 flow rate ratio on the ORR performance, which we previously observed in a single-stage CO2 laser pyrolysis configuration. Due to the quite similar specific surface area recorded for SSCat and DSCat for a given R, it is assumed that the second ammonia-induced CO2 laser pyrolysis does not significantly corrode carbon in the catalyst formed at the first-stage pyrolysis. Combined with the fact that the nitrogen content is also constant from SScat to DSCat for a given R, we suggest that the improvement of the ORR performances is more related to a thermal effect than a chemical effect induced by ammonia. Finally, additional work is required to get deeper insigtht on the way the second pyrolysis promotes the improvement of the ORR. The present results may open the way to the single step synthesis of performing Fe/C/N ORR catalysts, at a significant production rate and with significant chemical yields.
Author Contributions
H.P. and O.S. proposed and guided this research and performed the CO2 laser pyrolysis syntheses. H.P. wrote the paper, recorded electrochemistry and the characterization by BET and TGA. M.F. and A.E. carried out the XPS experiments, spectra fitting and aided the spectra interpretation. E.C. recorded the Raman spectra and performaed fitting. All authors have read and agreed to the published version of the manuscript.
Funding
This research received no external funding.
Acknowledgments
The authors acknowledge Florian Cauchetier and Vincent Mertens for support in Raman and Electron Scanning Microscopy respectively. The authors acknowledge the “Materials and processes program” of CEA for financial support. The authors acknowledge Claire Dazon for help in manuscript correction.
Conflicts of Interest
The authors declare no conflict of interest.
Appendix A
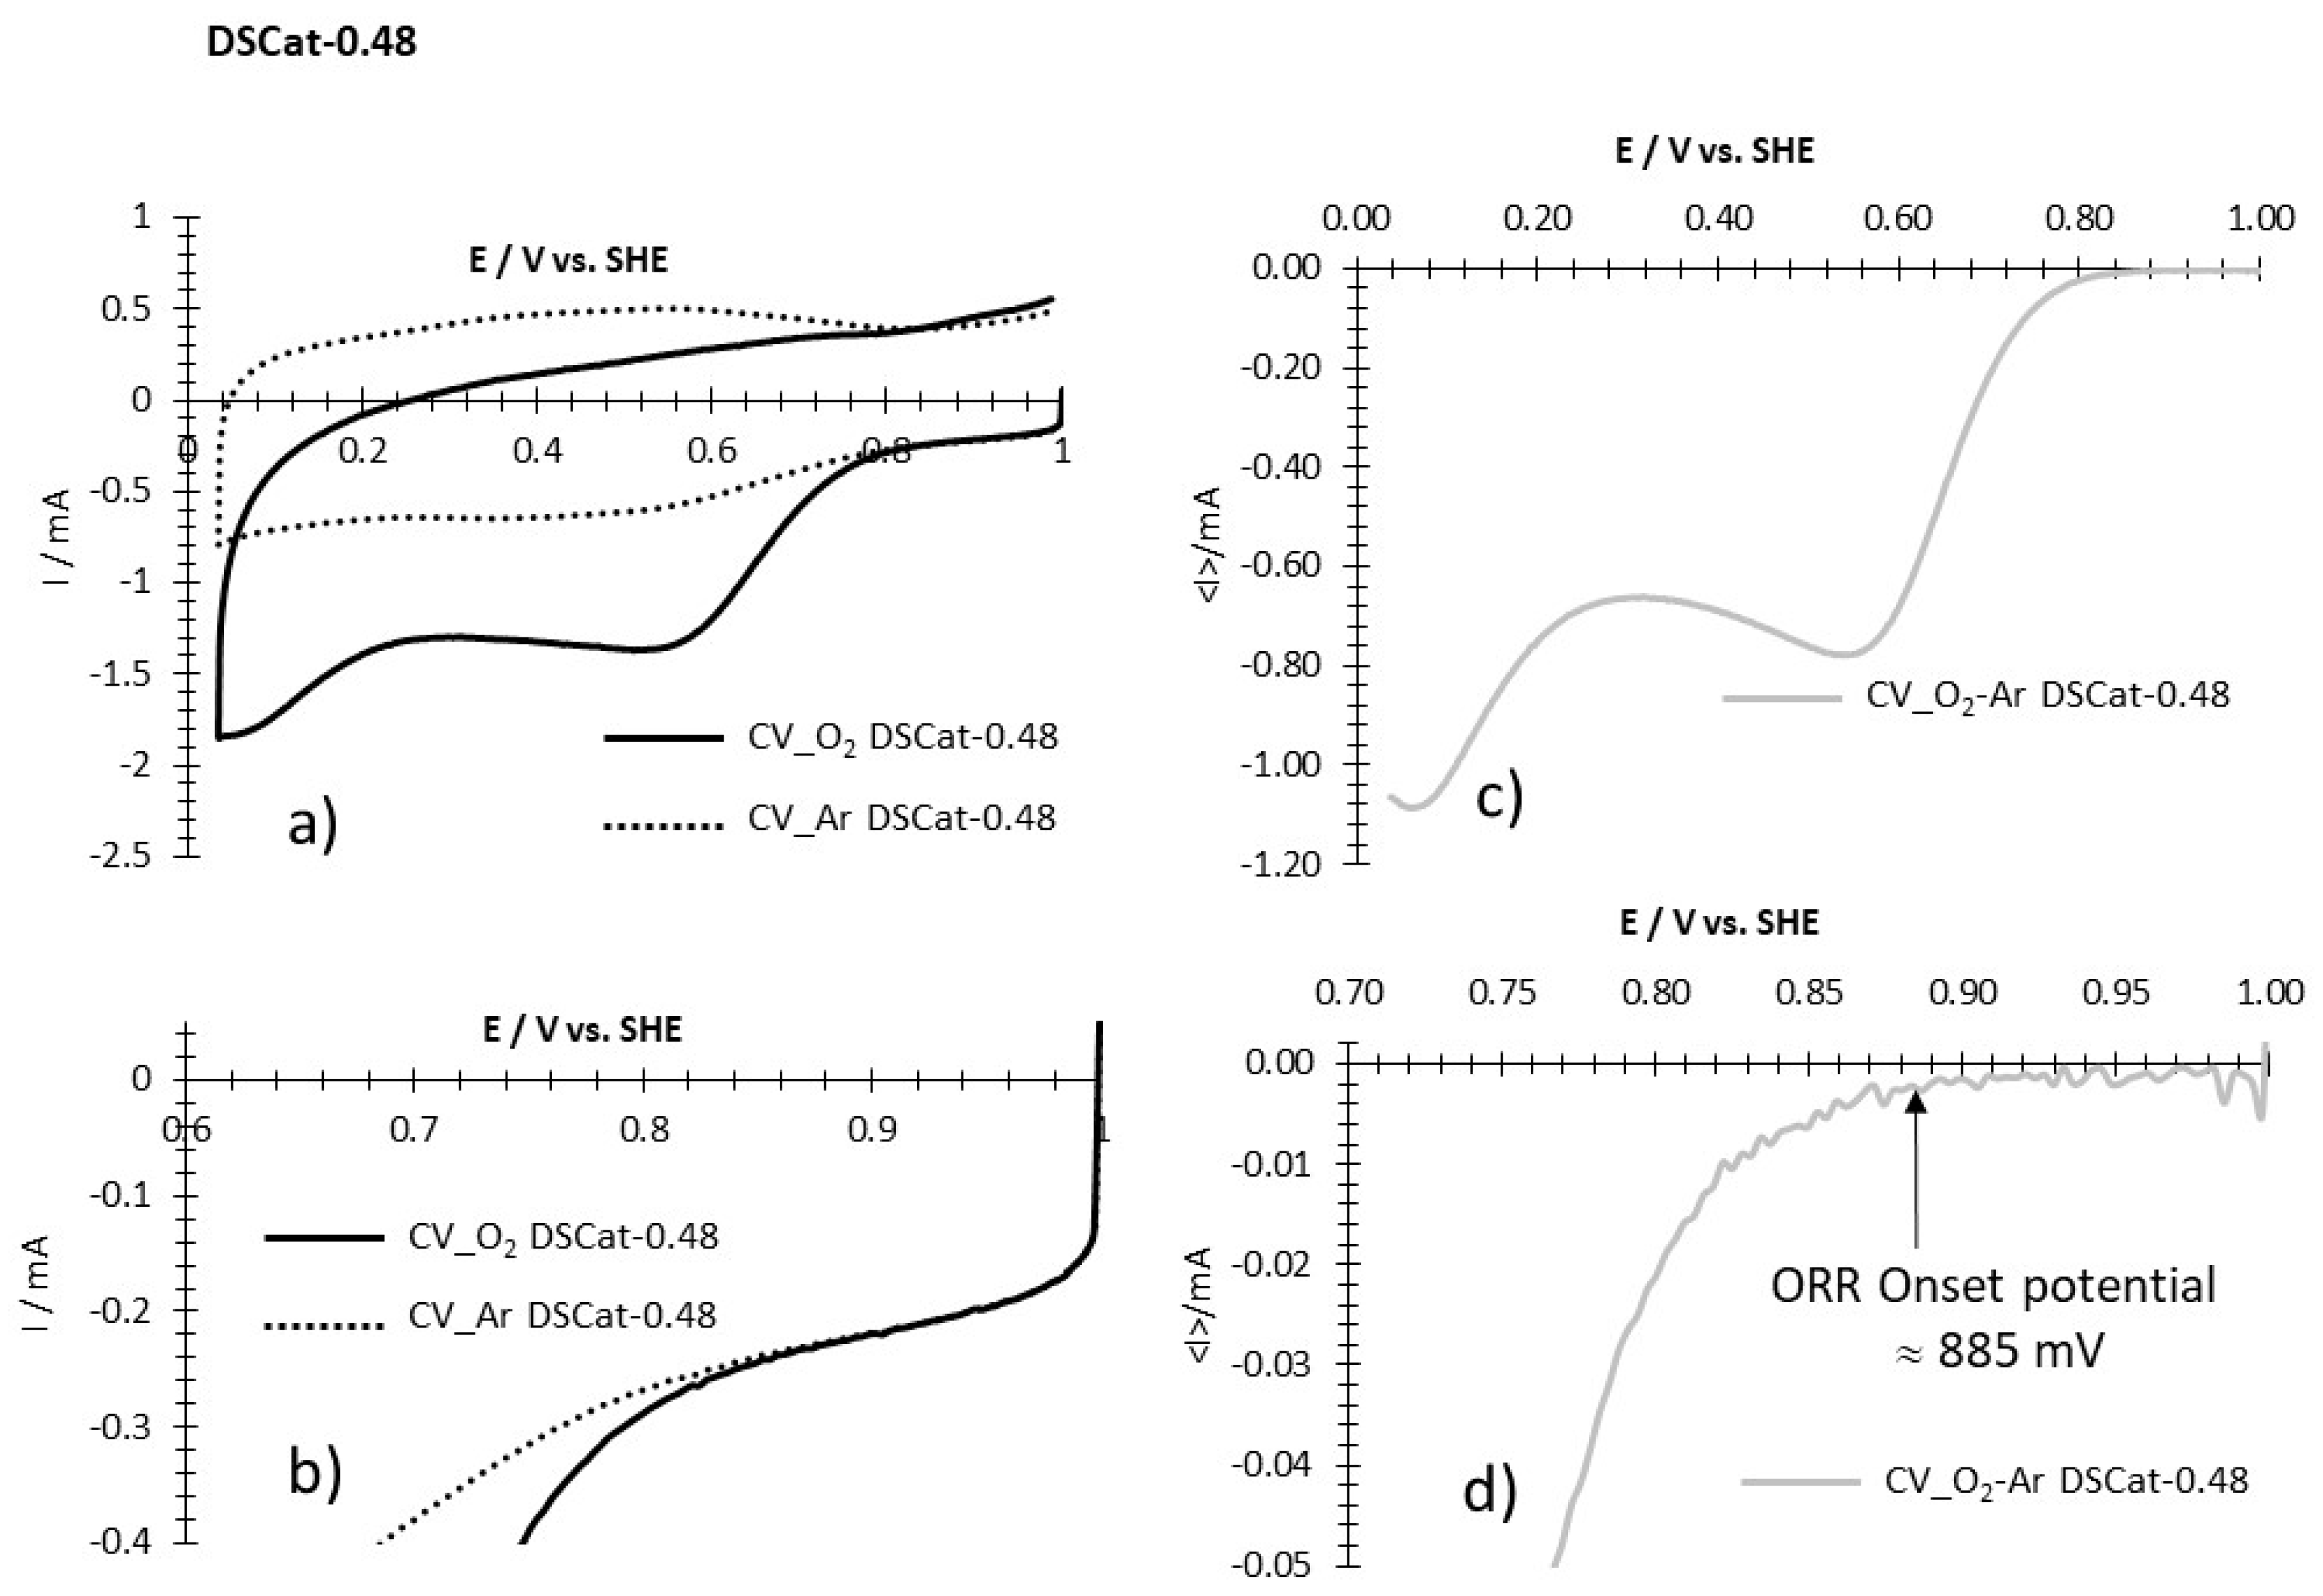
Determination of the ORR onset potential. The data show CVs recorded at 5 mV·s−1 under O2 (CV_O2) and under Argon (CV_Ar) as well as the resulting difference CV O2-Ar, this for three catalysts, DSCat-0.48, DSCat-0.22, and SSCat-0.22. Note that in the figures below, (b) is an enlargement of (a) and (d) is an enlargement of (c). These examples illustrate different situations regarding the behavior of the current between 1.0 V/SHE and the ORR onset potential.
For example, for DSCat-0.48 (Figure A1a–d), the current of the CV_O2-Ar between 1V/SHE and the onset potential (Figure A1d) is low and shows slight variation around a low averaged constant value. When the ORR starts, the current shows an exponential variation. The onset potential indicated by the arrow on the figure is the potential at which the transition between steady-state current and exponential variation occurs.
Figure A1.
Example of determination of ORR onset potential for DSCat-0.48. (a) CVs recorded at 5 mV·s−1 in O2 saturated HClO4 1M (CV_O2 DSCat-0.48) and in Argon saturated HClO4 1M (CV_Ar DSCat-0.48). (b) Enlargement of (a) in the potential region of the ORR onset potential. (c) CV resulting from the difference between CV_O2 DSCat-0.48 and CV_Ar DSCat-0.48. (d) Enlargement of (c) in the potential region of the ORR onset potential showing its determination (vertical arrow).

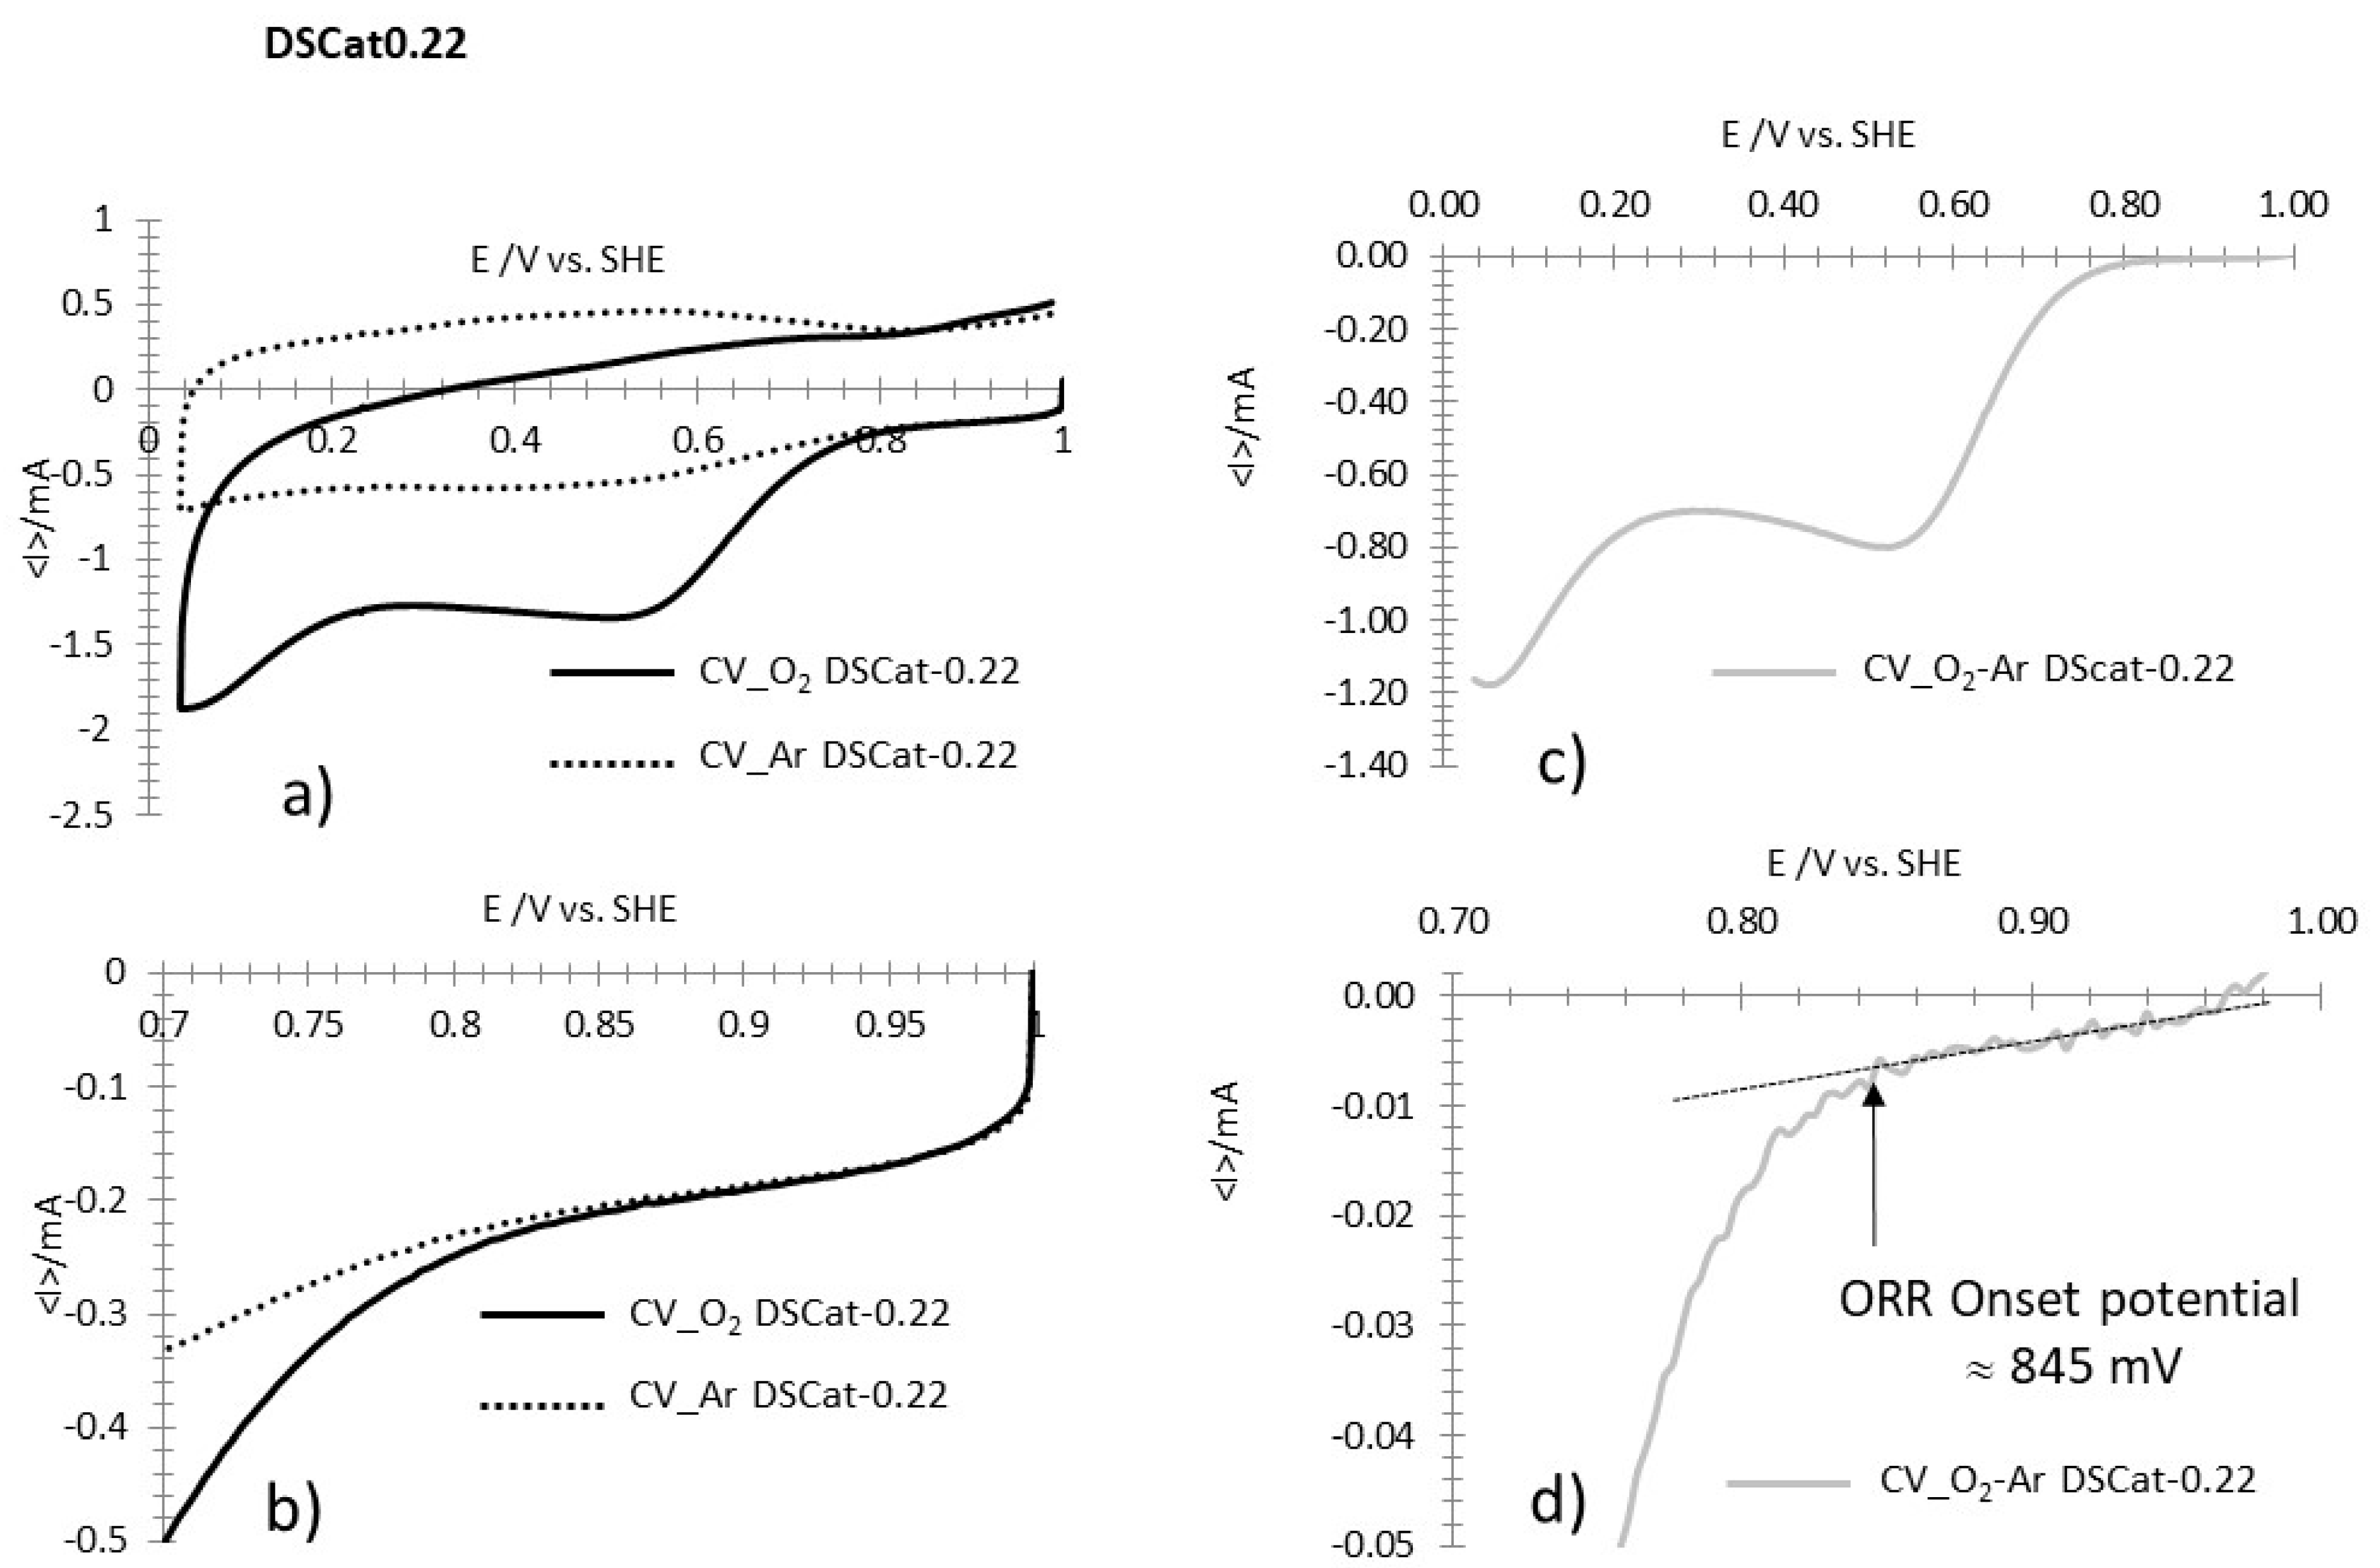
The data for DScat-0.22 (Figure A2a–d) show a similar situation as for DSCat-0.48 except that between 1.0 V/SHE and the ORR onset potential, the current is not as stable but rapidly shows after 1.0 V/SHE an averaged linear variation, with a low-level current (Figure A2d). In such a case, drawing the linear variation of the current allows the transition to exponential current variation to be easily detected and therefore the ORR onset potential to be easily determined.
Figure A2.
Example of determination of ORR onset potential for DSCat-0.22. (a) CVs recorded at 5 mV·s−1 in O2 saturated HClO4 1M (CV_O2 DSCat-0.22) and in Argon saturated HClO4 1M (CV_Ar DSCat-0.22). (b) Enlargement of a) in the potential region of the ORR onset potential. (c) CV resulting from the difference between CV_O2 DSCat-0.22 and CV_Ar DSCat-0.22. (d) Enlargement of (c) in the potential region of the ORR onset potential, showing its determination (vertical arrow).

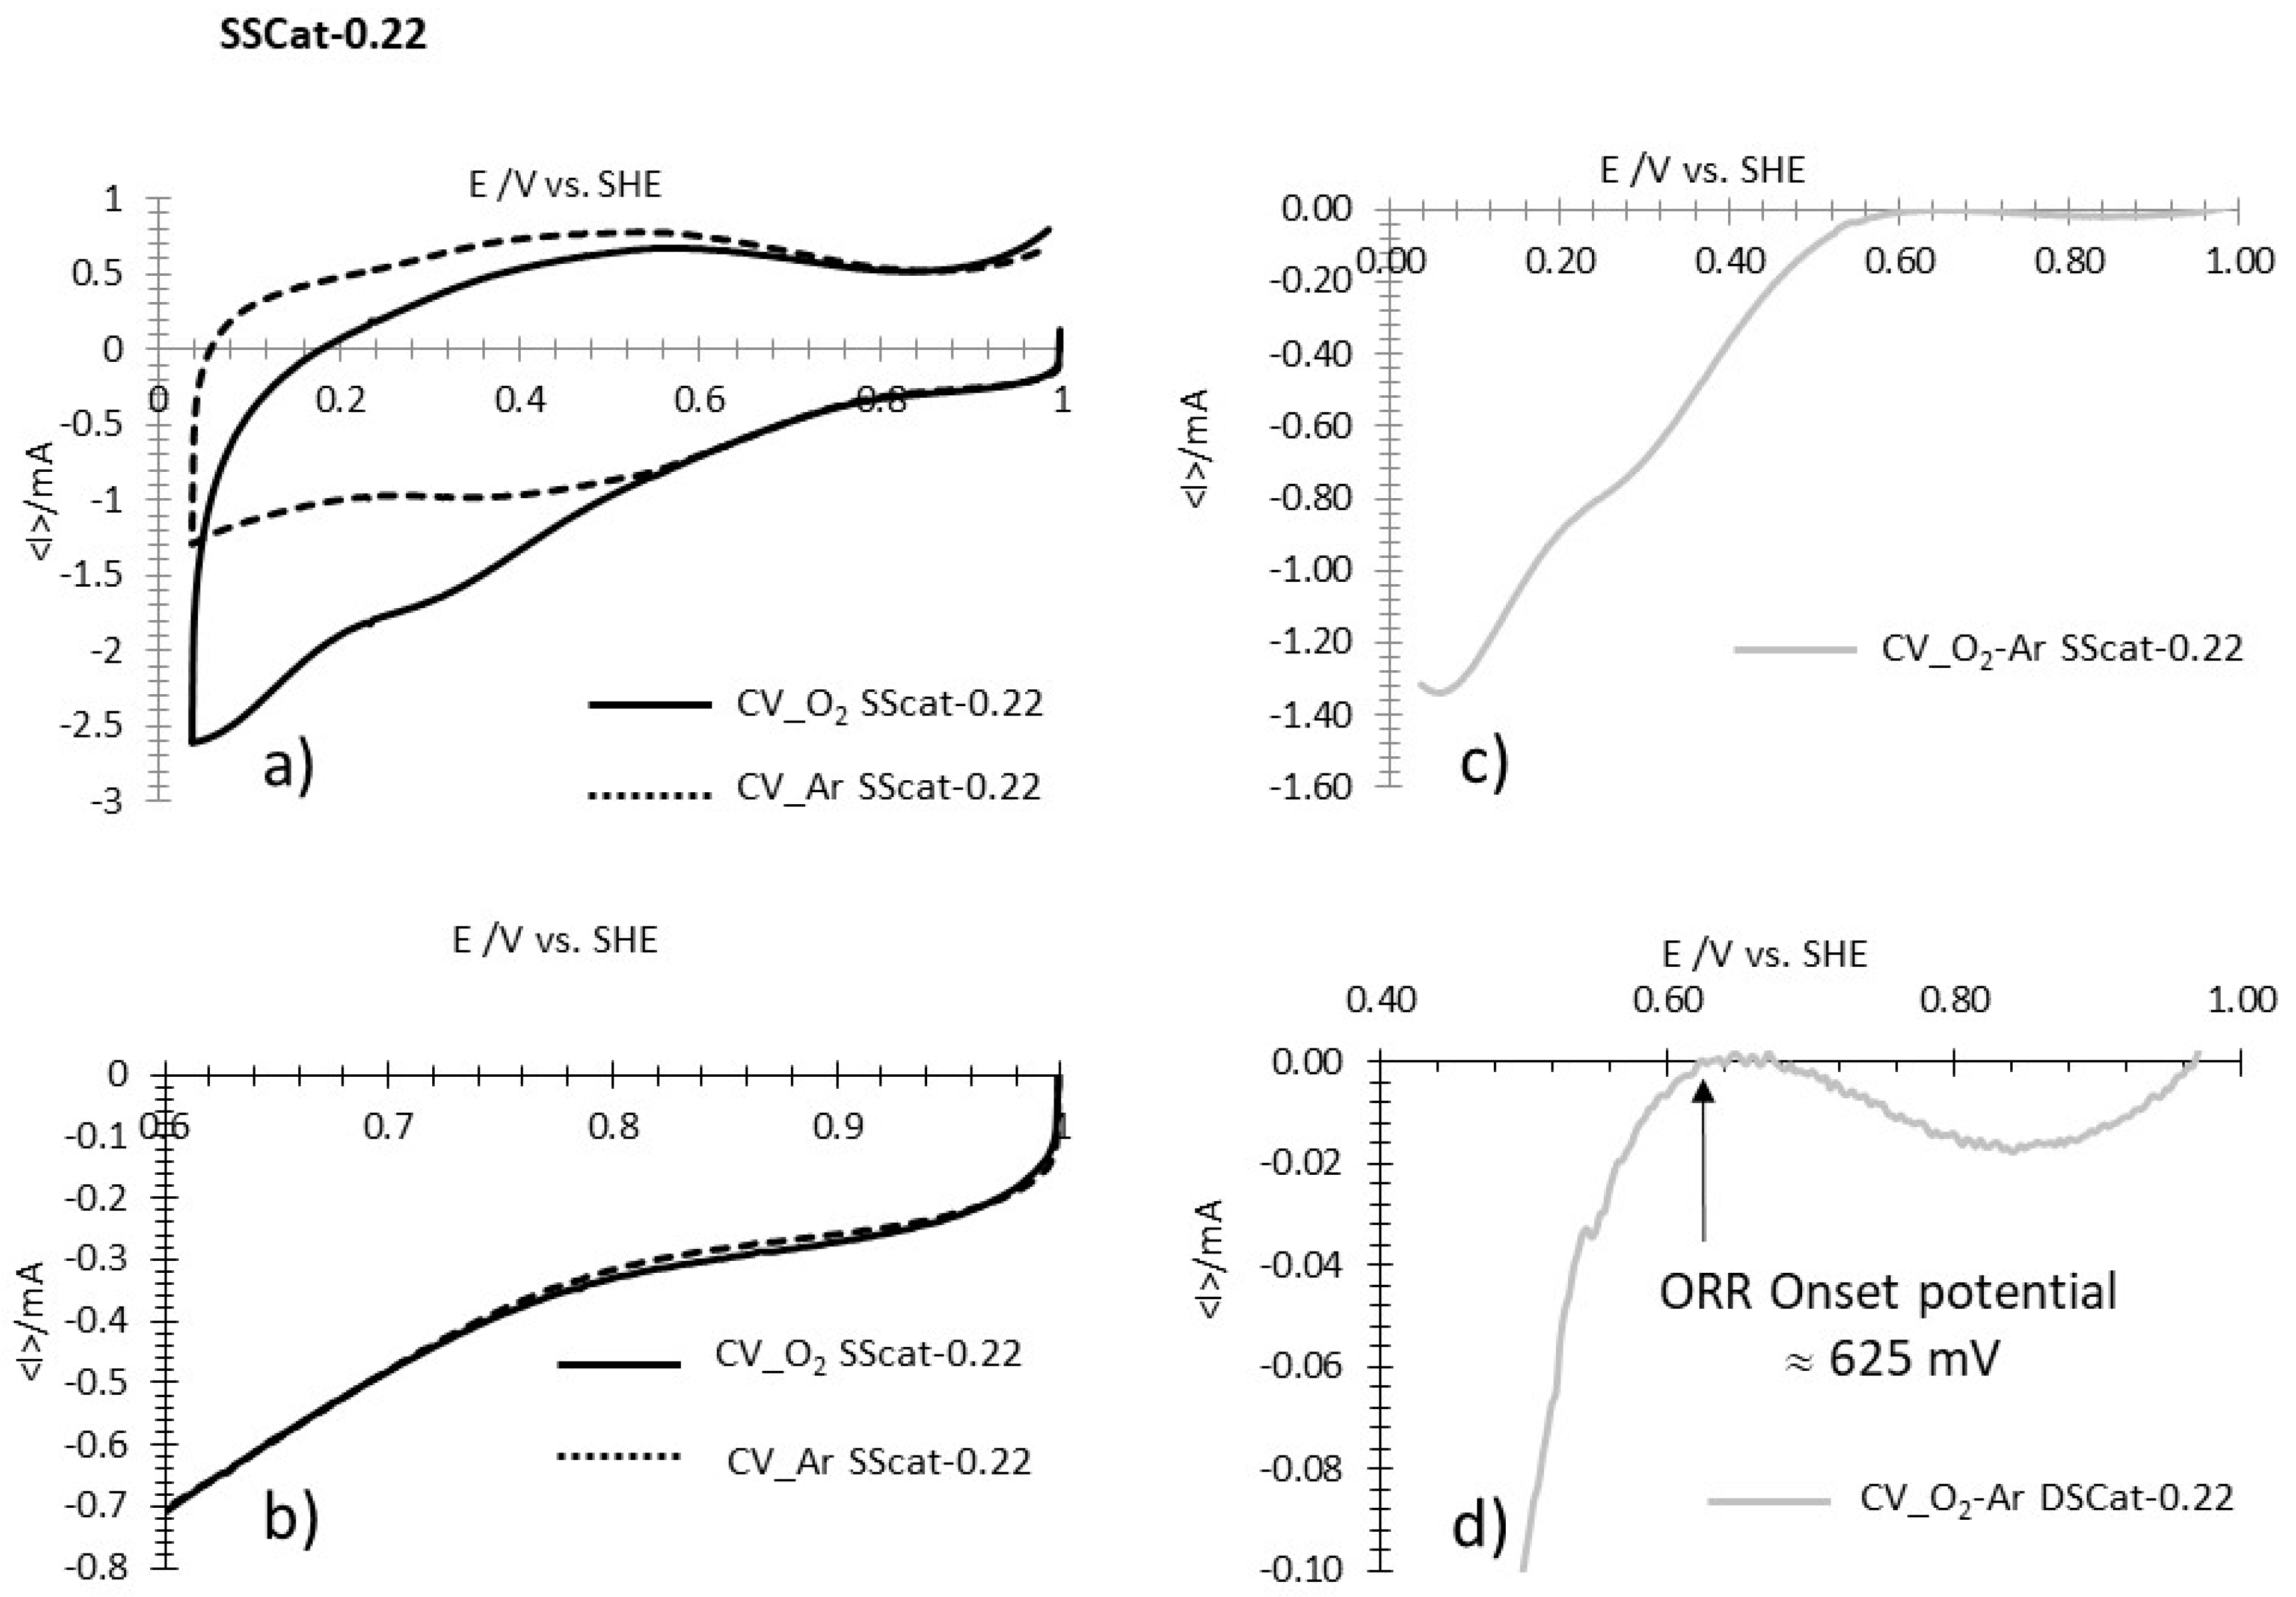
Finally, a third situation is illustrated by data recorded from SSCat-0.22 (Figure A3a–d). In this case, starting from 1.0 V/SHE, the current shows a progressive drop of about 20 µA (Figure A3d) and then increases by about the same value, to stabilize at 0. This behavior is generally found for poorly active catalysts and is not clearly understood. Again, the onset potential is determined by the transition between the stable zero current and the exponential variation of the current due to the ORR.
Figure A3.
Example of determination of ORR onset potential for SSCat-0.22. (a) CVs recorded at 5mV·s−1 in O2 saturated HClO4 1M (CV_O2 SSCat-0.22) and in Argon saturated HClO4 1M (CV_Ar SSCat-0.22). (b) Enlargement of a) in the potential region of the ORR onset potential. (c) CV resulting from the difference between CV_O2 SSCat-0.22 and CV_Ar SSCat-0.22. (d) Enlargement of (c) in the potential region of the ORR onset potential, showing its determination (vertical arrow).

Appendix B
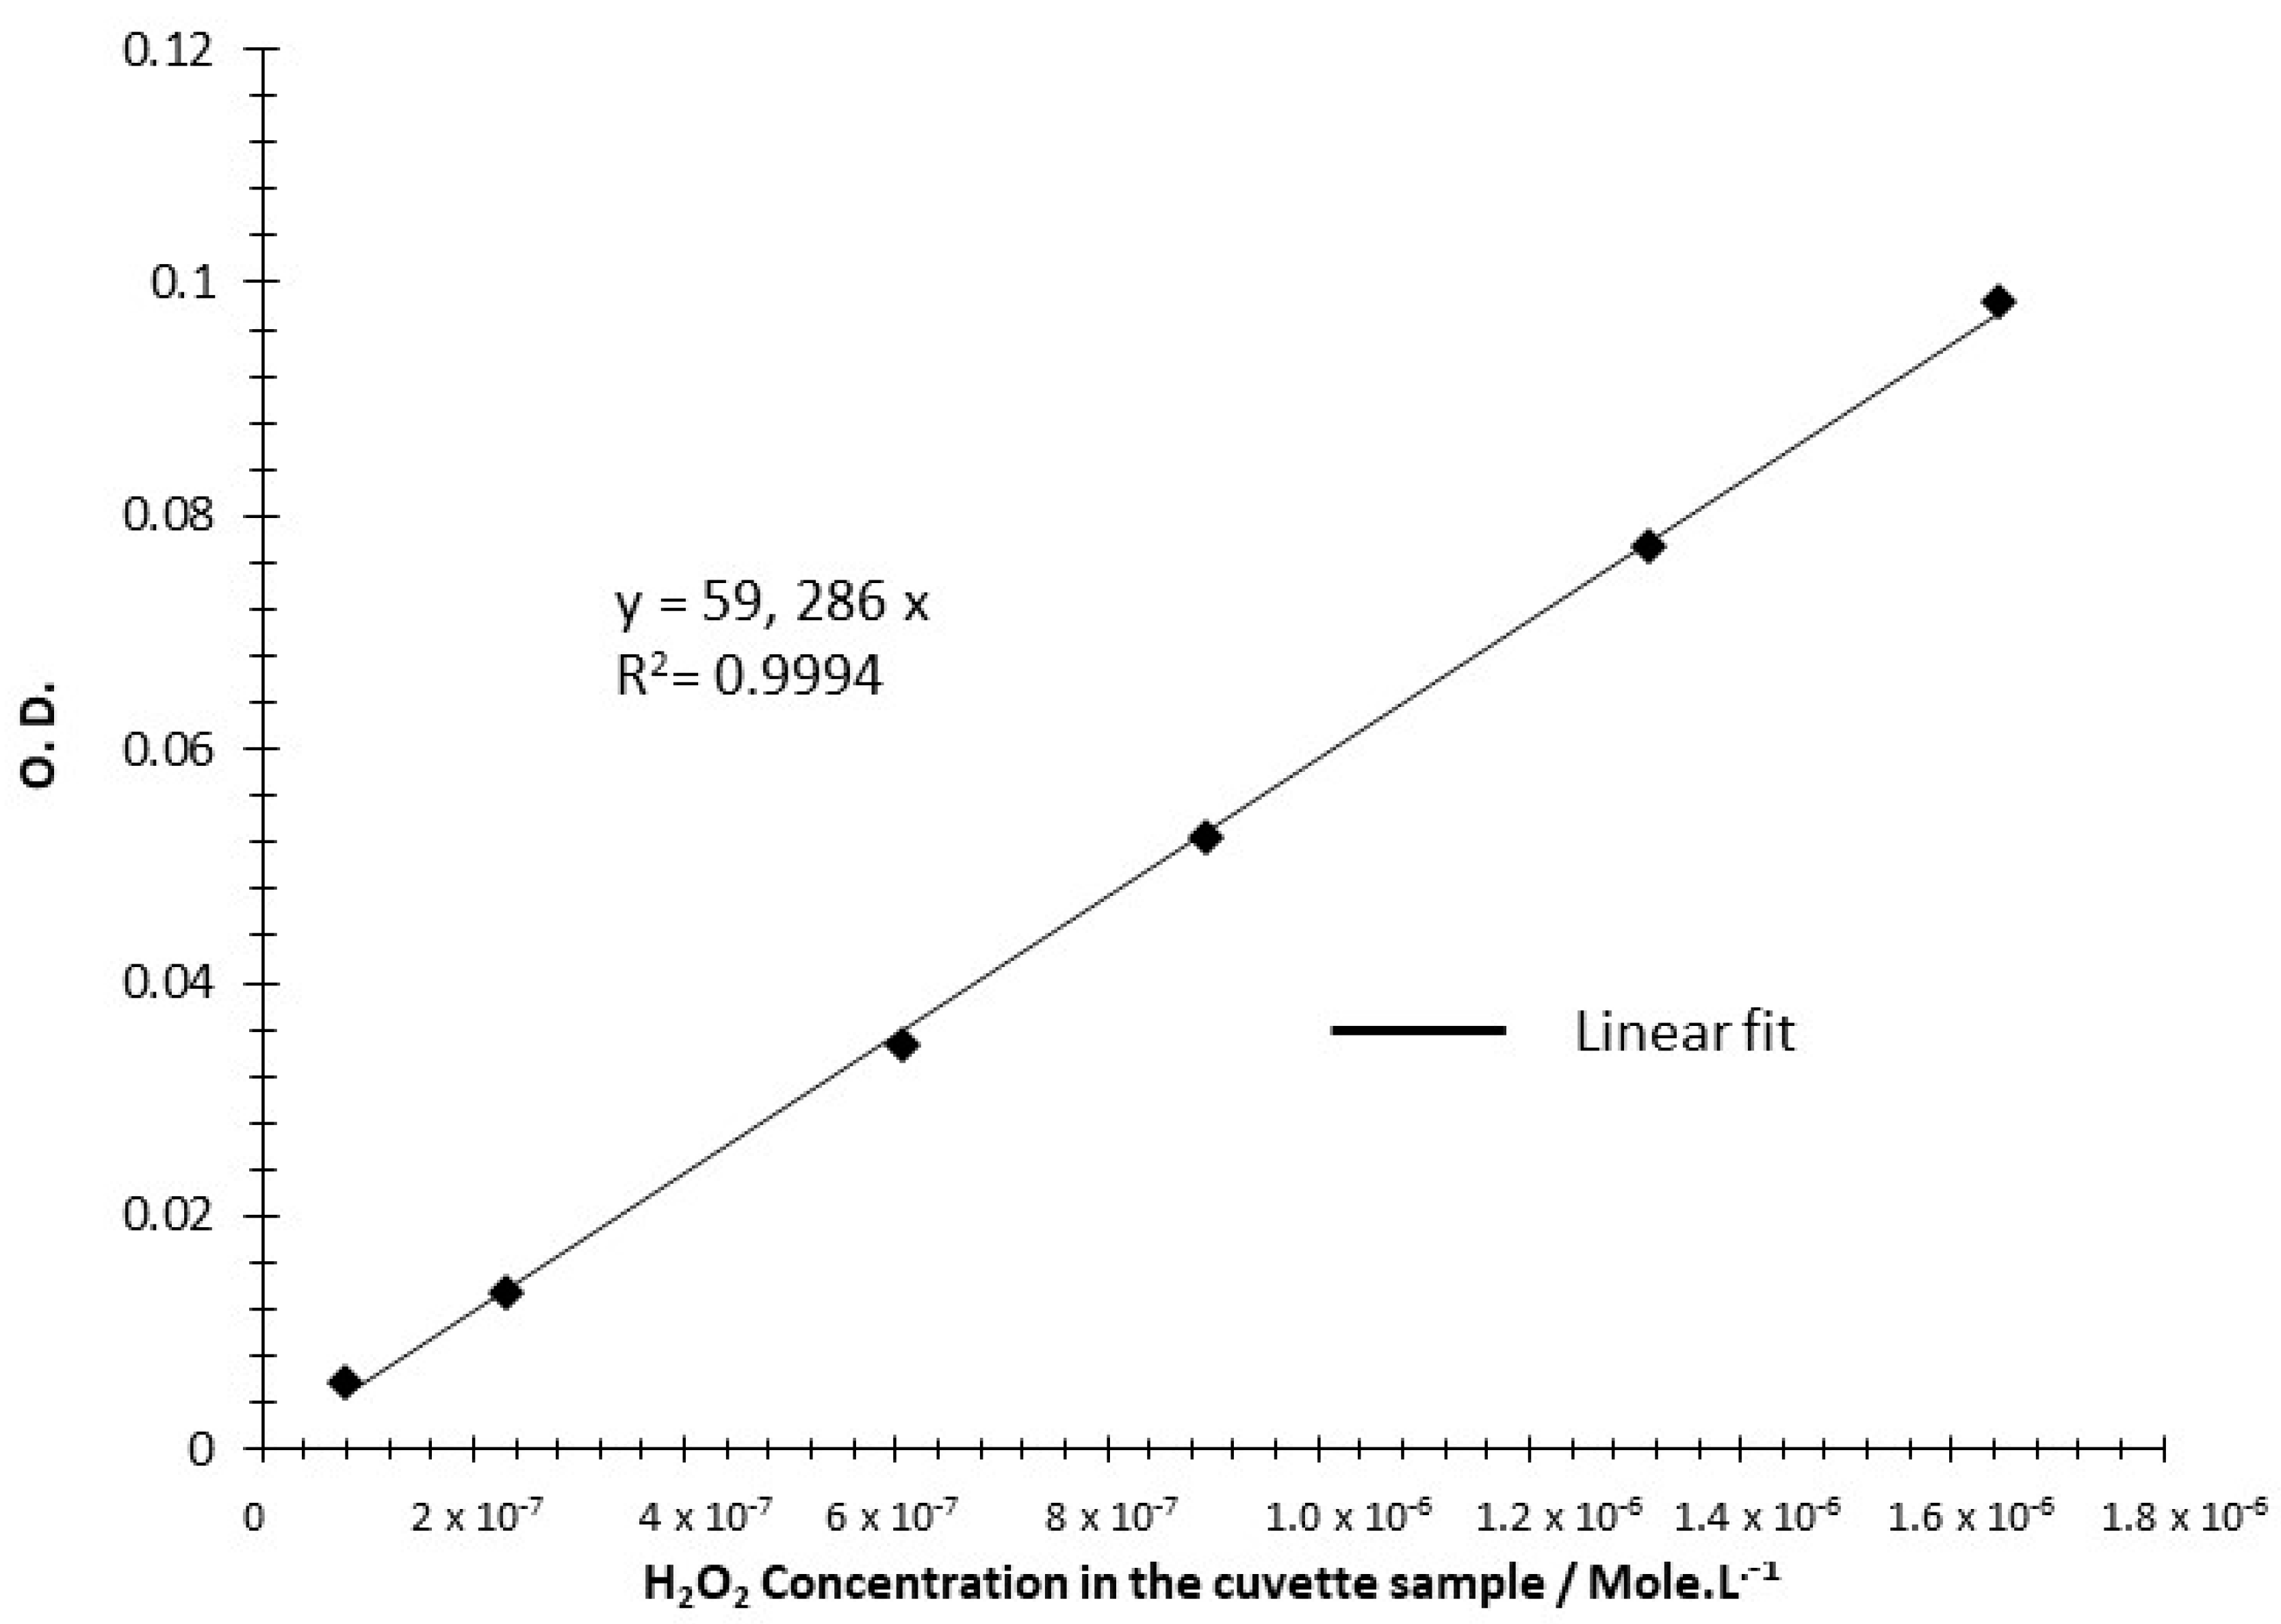
Supporting information for selectivity. The graph below shows the calibration curve establishing the absorption of ABTS+ at 414 nm as a function of H2O2 concentration in the spectrophotometer sample cuvette. This calibration curve (similar to the one reported in reference [18]) has been used for assaying the hydrogen peroxide produced during the chronoamperometric measurement shown in the Figure 7 of the paper.
Figure A4.
Calibration curve established by spectrophotometry using solution of H2O2 of known concentration in HCLO4 0.1 M (see reference [18] and Section 2.3 of the paper for details).
Figure A4.
Calibration curve established by spectrophotometry using solution of H2O2 of known concentration in HCLO4 0.1 M (see reference [18] and Section 2.3 of the paper for details).

The selectivity and H2O2% were measured at three different times of the chronoamperometry recorded at 600 mV vs. SHE. The data show the quite low variation observed between the different time measurements for all the catalysts and therefore the robustness of the method.

Table A1.
Data showing the three selectivity measurements and related H2O2% deduced from H2O2 assaying in the electrolyte after 10, 20 and 30 min of the ORR chronoamperometry at 600 mV vs SHE (see Figure 7 of the paper). The data concern the six catalysts studied in this work. From these data at 10, 20 and 30 min averaged selectivity and H2O2% is calculated for each catalyst (see Table 5 of the paper).
| SS-Catalysts/Assaying Time | H2O2% | Selectivity | DS-Catalysts/Assaying Time | H2O2% | Selectivity |
|---|---|---|---|---|---|
| SSCat-0.22/10′ | 31.6 | 3.37 | DSCat-0.22/10′ | 24.6 | 3.50 |
| SSCat-0.22/20′ | 29.6 | 3.41 | DSCat-0.22 20′ | 23.0 | 3.54 |
| SSCat-0.22/30′ | 27.3 | 3.45 | DSCat-0.22 20′ | 21.2 | 3.57 |
| SSCat-0.40/10′ | 23.9 | 3.52 | DSCat-0.40/10′ | 14.3 | 3.72 |
| SSCat-0.40/20′ | 22.9 | 3.54 | DSCat-0.40/20′ | 15.1 | 3.70 |
| SSCat-0.40/30′ | 22.2 | 3.56 | DSCat-0.40/30′ | 13.3 | 3.73 |
| SSCat-0.48/10′ | 16.1 | 3.68 | DSCat-0.48/10′ | 12.8 | 3.74 |
| SSCat-0.48/20′ | 16.7 | 3.67 | DSCat-0.48/20′ | 13.7 | 3.72 |
| SSCat-0.48/30′ | 18.0 | 3.64 | DSCat-0.48/30′ | 15.5 | 3.69 |
References
- Osmieri, L. Transition Metal–Nitrogen–Carbon (M–N–C) Catalysts for Oxygen Reduction Reaction. Insights on Synthesis and Performance in Polymer Electrolyte Fuel Cells. Chem. Eng. 2019, 3, 16. [Google Scholar] [CrossRef] [Green Version]
- Ünsala, S.; Yağcı, M.B.; Bozbağa, S.E.; Deljooc, B.; Aindow, M.; Erkeya, C. Supercritical Deposition Coupled with Ammonia Treatment: A New Route to Co Promoted N-doped Carbon Aerogels with High ORR Activity. Energy Technol. 2019, 7, 1900450. [Google Scholar] [CrossRef]
- Shao, M.; Chang, Q.; Dodelet, J.-P.; Chenitz, R. Recent advances in electrocatalysts for oxygen reduction. Chem. Rev. 2016, 116, 3594–3657. [Google Scholar] [CrossRef] [Green Version]
- Banham, D.; Kishimoto, T.; Zhou, Y.; Sato, T.; Bai, K.; Ozaki, J.I.; Imashiro, Y.; Ye, S. Critical advancements in achieving high power and stable non precious metal catalyst-based MEAs for real world proton exchange membrane fuel cell application. Sci. Adv. 2018, 4, eaar7180. [Google Scholar] [CrossRef] [Green Version]
- Proietti, E.; Jaouen, F.; Lefevre, M.; Larouche, N.; Tian, J.; Herranz, J.; Dodelet, J.-P. Iron-based cathode catalyst with enhanced power density in polymer electrolyte membrane fuel cell. Nat. Commun. 2011, 2, 416. [Google Scholar] [CrossRef]
- Goenaga, G.A.; Ma, S.; Yuan, S.; Liu, D.-J. New approaches to Non-PGM electrocatalysts using porous framework materials. ECS Trans. 2010, 33, 579–586. [Google Scholar] [CrossRef]
- Liu, Q.; Liu, X.; Zheng, L.; Shui, J. The Solid-Phase Synthesis of an Fe-N-C Electrocatalyst for High-Power Proton-Exchange Membrane Fuel Cells. Angew. Chem. Int. Ed. 2018, 57, 1204–1208. [Google Scholar] [CrossRef]
- Shen, H.; Gracia-Espino, E.; Ma, J.; Zang, K.; Luo, J.; Wang, L.; Gao, S.; Mamat, X.; Hu, G.; Wagberg, T.; et al. Synergistic Effects between Atomically Dispersed Fe–N–C and C–S–C for the Oxygen Reduction Reaction in Acidic Media. Angew. Chem. Int. Ed. 2017, 56, 13800–13804. [Google Scholar] [CrossRef]
- Longhi, M.; Cova, C.; Pargoletti, E.; Coduri, M.; Santangelo, S.; Patanè, S.; Ditaranto, N.; Cioffi, N.; Facibeni, A.; Scavini, M. Synergistic Effects of Active Sites’ Nature and Hydrophilicity on the Oxygen Reduction Reaction Activity of Pt-Free Catalysts. Nanomaterials 2018, 8, 643. [Google Scholar] [CrossRef] [Green Version]
- Perez, H.; Jorda, V.; Bonville, P.; Vigneron, J.; Frégnaux, M.; Etcheberry, A.; Quinsac, A.; Habert, A.; Leconte, Y. Synthesis and Characterization of Carbon/Nitrogen/Iron Based Nanoparticles by Laser Pyrolysis as Non-Noble Metal Electrocatalysts for Oxygen Reduction. C J. Carbon Res. 2018, 4, 43. [Google Scholar] [CrossRef] [Green Version]
- Perez, H.; Jorda, V.; Vigneron, J.; Frégnaux, M.; Etcheberry, A.; Quinsac, A.; Leconte, Y.; Sublemontier, O. Highly Active, High Specific Surface Area Fe/C/N ORR Electrocatalyst from Liquid Precursors by Combination of CO2 Laser Pyrolysis and Single NH3 Thermal Post-Treatment. C J. Carbon Res. 2019, 5, 26. [Google Scholar] [CrossRef] [Green Version]
- Poozhikunnath, A. Characterization and Optimization of Carbon Based Electrocatalysts and Supports for Fuel Cell Applications. Ph.D. Thesis, University of Connecticut, Storrs, CT, USA, 2019. [Google Scholar]
- Sadezky, A.; Muckenhuber, H.; Grothe, H.; Niessner, R.; Pöschl, U. Raman microspectroscopy of soot and related carbonaceous materials: Spectral analysis and structural information. Carbon 2005, 43, 1731–1742. [Google Scholar] [CrossRef]
- Cheng, X.; Than, X.-T.; Pinault, M.; Mayne, M.; Reynaud, C.; Vigneron, J.; Etcheberry, A.; Perez, H. Determination of selectivity and specific area related to oxygen reduction reaction as a function of catalyst loading on non-noble metal based electrocatalyst porous electrodes: An example on nitrogen doped carbon nanotube. Electrochim. Acta 2014, 135, 293–300. [Google Scholar] [CrossRef]
- Baret, B.; Aubert, P.-H.; Mayne-L’Hermite, M.; Pinault, M.; Reynaud, C.; Etcheberry, A.; Perez, H. Nanocomposite electrodes based on pre-synthesized organically capped platinum nanoparticles and carbon nanotubes part I: Tuneable low platinum loadings, specific H upd feature and evidence for oxygen reduction. Electrochim. Acta 2009, 54, 5421–5430. [Google Scholar] [CrossRef]
- March, G.; Volatron, F.; Lachaud, F.; Cheng, X.; Baret, B.; Pinault, M.; Etcheberry, A.; Perez, H. Nanocomposite electrodes based on pre-synthesized organically capped platinum nanoparticles and carbon nanotubes. Part II: Determination of diffusion area for oxygen reduction reflects platinum accessibility. Electrochim. Acta 2011, 56, 5151–5157. [Google Scholar] [CrossRef]
- Cheng, X.; Volatron, F.; Pardieu, E.; Borta, A.; Carrot, G.; Reynaud, C.; Mayne, M.; Pinault, M.; Etcheberry, A.; Perez, H. Nanocomposite electrodes based on pre-synthesized organically grafted platinum nanoparticles and carbon nanotubes III. Determination of oxygen reduction reaction selectivity and specific area of porous electrode related to the oxygen reduction reaction ranging from 2 m2 gPt−1 to 310 m2 gPt−1. Electrochim. Acta 2013, 89, 1–12. [Google Scholar] [CrossRef]
- Cheng, X.; Challier, L.; Etcheberry, A.; Noël, V.; Perez, H. The ABTS-HRP system as an alternative method to RRDE for the determination of the selectivity of the oxygen reduction reaction. Int. J. Electrochem. Sci. 2012, 7, 6247–6264. [Google Scholar]
- Artyushkova, K.; Serov, A.; Rojas-Carbonell, S.; Atanassov, P. Chemistry of Multitudinous Active Sites for Oxygen Reduction Reaction in Transition Metal−Nitrogen−Carbon. J. Phys. Chem. C 2015, 119, 25917–25928. [Google Scholar] [CrossRef]
- Primbs, M.; Sun, Y.; Roy, A.; Malko, D.; Mehmood, A.; Sougrati, M.-T.; Blanchard, P.-Y.; Granozzi, G.; Kosmala, T.; Daniel, G.; et al. Establishing reactivity descriptors for platinum group metal (PGM)-free Fe–N–C catalysts for PEM fuel cells. Energy Environ. Sci. 2020. [Google Scholar] [CrossRef]
- Kramm, U.I.; Herranz, J.; Larouche, N.; Arruda, T.M.; Lefevre, M.; Jaouen, F.; Bogdanoff, P.; Fiechter, S.; Abs-Wurmbach, I.; Mukerjee, S.; et al. Structure of the catalytic sites in Fe/N/C-catalysts for O2-reduction in PEM fuel cell. Phys. Chem. Chem. Phys. 2012, 14, 11673–11688. [Google Scholar] [CrossRef]
- Chen, Z.Y.; Zhao, J.P.; Yano, T.; Ooie, T.; Yoneda, M.; Sakakibara, J. Observation of sp3 bonding in tetrahedral amorphous carbon using visible Raman spectroscopy. J. Appl. Phys. 2000, 88, 2305–2308. [Google Scholar] [CrossRef]
- Charon, E.; Rouzaud, J.N.; Aléon, J. Graphitization at low temperatures (600–1200 °C) in the presence of iron implications in planetology. Carbon 2014, 66, 178–190. [Google Scholar] [CrossRef]
- Luo, E.; Wang, C.; Li, Y.; Wang, X.; Gong, L.; Zhao, T.; Jin, Z.; Ge, J.; Liu, C.; Xing, W. Accelerated oxygen reduction on Fe/N/C catalysts derived from precisely-designed ZIF precursors. Nano Res. 2020, 13, 2420–2426. [Google Scholar] [CrossRef]
- Lo Vecchio, C.; Arico, A.S.; Monforte, G.; Baglio, V. EDTA-derived CoeNeC and FeeNeC electro-catalysts for the oxygen reduction reaction in acid environment. Renew. Energy 2018, 120, 342–349. [Google Scholar] [CrossRef]
- Jimenez-Mateos, J.M.; Fiero, J.L.G. X-ray Photoelectron Spectroscopic Study of Petroleum Fuel Cokes. Surf. Interface Anal. 1996, 24, 223–226. [Google Scholar] [CrossRef]
- Casanovas, J.; Ricart, J.M.; Rubio, J.; Illas, F.; Jimenez-Mateos, J.M. Origin of the Large N 1s Binding Energy in X-ray Photoelectron Spectra of Calcined Carbonaceous Materials. J. Am. Chem. Soc. 1996, 118, 8071–8076. [Google Scholar] [CrossRef]
- Ding, W.; Wei, Z.; Chen, S.; Qi, X.; Yang, T.; Hu, J.; Wang, D.; Wan, L.-J.; Fatima Alvi, S.F.; Li, L. Nitrogen Space-Confinement-Induced Synthesis of Pyridinic- and Pyrrolic Nitrogen-Doped Graphene for the Catalysis of Oxygen Reduction. Angew. Chem. Int. Ed. 2013, 52, 11755–11759. [Google Scholar] [CrossRef]
- Pels, J.R.; Kapteijn, F.; Moulijn, J.A.; Zhu, Q.; Thomas, K.M. Evolution of nitrogen functionalities in carbonaceous materials during pyrolysis. Carbon 1995, 33, 1641–1653. [Google Scholar] [CrossRef]
- Arrigo, R.; Hävecker, M.; Schlög, R.; Sheng Su, D. Dynamic surface rearrangement and thermal stability of nitrogen functional groups on carbon nanotubes. Chem. Commun. 2008, 40, 4891–4893. [Google Scholar] [CrossRef] [Green Version]
Publisher’s Note: MDPI stays neutral with regard to jurisdictional claims in published maps and institutional affiliations. |
Figure 1.
Scheme of the experimental set-up for two-stage ammonia-induced CO2 laser pyrolysis.

Figure 2.
Scanning electron micrographs recorded for DSCat 0.22 and DSCat-0.48 catalysts.

Figure 3.
Comparison of N1s peak fitting for SSCat-0.22 and DSCat-0.22 catalysts.

Figure 4.
Comparison of N1s peak fitting for SSCat and DSCat catalysts synthesized with (a) R = 0.40 and (b) R = 0.48.
Figure 4.
Comparison of N1s peak fitting for SSCat and DSCat catalysts synthesized with (a) R = 0.40 and (b) R = 0.48.

Figure 5.
Comparison of Raman spectra and corresponding fitting for SSCat-0.22 and DS-Cat 0.22.

Figure 6.
Comparison of SSCat and DSCat background corrected oxygen reduction Cyclic Voltammetry (CVs) recorded at 5 mV·s−1 for (a) R = 0.22, (b) R = 0.40 and (c) R = 0.48. HClO4 1 M.
Figure 6.
Comparison of SSCat and DSCat background corrected oxygen reduction Cyclic Voltammetry (CVs) recorded at 5 mV·s−1 for (a) R = 0.22, (b) R = 0.40 and (c) R = 0.48. HClO4 1 M.

Figure 7.
Oxygen Reduction Reaction (ORR) chronoamperometry recorded on DSCat-0.22, 0.40, and 0.48 in HClO4 0.1 M for ORR selectivity measurement. Both the charge in coulomb and the current expressed in mA per mg of catalysts in the porous electrode are reported as a function of time. Grey areas picture the 10 min time windows after which the electrolyte sampling was performed.

Figure 8.
NxDSCat/NxSScat ratio for x = 1 to 4 and for R = 0.22, 0.40, and 0.48.

Table 1.
Rate production and chemical yield for the SSCat and DSCat catalysts syntheses with R = 0.48, 0.40, and 0.22 at the first stage of CO2 laser pyrolysis reactor.
Table 1.
Rate production and chemical yield for the SSCat and DSCat catalysts syntheses with R = 0.48, 0.40, and 0.22 at the first stage of CO2 laser pyrolysis reactor.
| Catalyst | Catalyst Production Rate As-Formed g·h−1 | Chemical Yield As-Formed Material wt% | Catalyst Production Rate after Acetone Washing g·h−1 | Chemical Yield after Acetone Washing wt% |
|---|---|---|---|---|
| SSCat-0.22 | 8.8 | 28.0 | 6.9 | 21.9 |
| SSCat-0.40 | 7.5 | 23.9 | 6.0 | 19.1 |
| SSCat-0.48 | 6.0 | 19.0 | 4.4 | 14.1 |
| DSCat-0.22 | 6.1 | 19.5 | 5.8 | 18.3 |
| DSCat-0.40 | 5.1 | 16.1 | 4.8 | 15.2 |
| DSCat-0.48 | 3.5 | 10.9 | 3.1 | 9.8 |
Table 2.
Feature of SScat and DSCat catalysts synthesized with R = 0.48, 0.40, and 0.22 at the first stage of CO2 laser pyrolysis reactor.
Table 2.
Feature of SScat and DSCat catalysts synthesized with R = 0.48, 0.40, and 0.22 at the first stage of CO2 laser pyrolysis reactor.
| Catalyst | Iron Content wt% | Specific Surface Area m2·g−1 |
|---|---|---|
| SSCat-0.22 | 0.65 | 124 |
| SSCat-0.40 | 0.83 | 135 |
| SSCat-0.48 | 1.03 | 159 |
| DSCat-0.22 | 0.41 | 115 |
| DSCat-0.40 | 0.59 | 144 |
| DSCat-0.48 | 1.00 | 172 |
Table 3.
XPS semi-quantitative analysis recorded for the catalysts.
| Catalyst | C1s at.% | O1s at.% | N1s at.% | N1s at.%/C1s at.% |
|---|---|---|---|---|
| SSCat-0.22 | 93.6 | 4.4 | 2.0 | 0.021 |
| SSCat-0.40 | 92.2 | 5.6 | 2.2 | 0.024 |
| SSCat-0.48 | 92.4 | 4.4 | 3.2 | 0.034 |
| DSCat-0.22 | 94.8 | 3.1 | 2.1 | 0.022 |
| DSCat-0.40 | 94.5 | 2.7 | 2.8 | 0.028 |
| DSCat-0.48 | 93.7 | 2.9 | 3.4 | 0.030 |
Table 4.
ID/IG band ratios for SSCat and DSCat at R = 0.22, 0.40, and 0.48.
| R = 0.22 | R = 0.40 | R = 0.48 | |
|---|---|---|---|
| ID/IG SS-Cat | 0.90 ± 0.06 | 0.94 ± 0.06 | 0.88 ± 0.04 |
| ID/IG DSCat | 1.03 ± 0.05 | 0.98 ± 0.05 | 0.95 ± 0.05 |
Table 5.
Hydrogen peroxide production and selectivities for SSCat and DSCat at R = 0.22, 0.40, 0.48.
Table 5.
Hydrogen peroxide production and selectivities for SSCat and DSCat at R = 0.22, 0.40, 0.48.
| Catalyst | SSCat-0.22 | SSCat-0.40 | SSCat0.48 | DSCat-0.22 | DSCat-0.40 | DSCat-0.48 |
|---|---|---|---|---|---|---|
| H2O2% | 29.5 | 23.0 | 16.9 | 22.9 | 14.2 | 14.0 |
| Selectivity | 3.41 | 3.54 | 3.66 | 3.54 | 3.72 | 3.72 |
© 2020 by the authors. Licensee MDPI, Basel, Switzerland. This article is an open access article distributed under the terms and conditions of the Creative Commons Attribution (CC BY) license (http://creativecommons.org/licenses/by/4.0/).
Share and Cite
MDPI and ACS Style
Perez, H.; Frégnaux, M.; Charon, E.; Etcheberry, A.; Sublemontier, O. Improving the Activity of Fe/C/N ORR Electrocatalyst Using Double Ammonia Promoted CO2 Laser Pyrolysis. C 2020, 6, 63. https://0-doi-org.brum.beds.ac.uk/10.3390/c6040063
AMA Style
Perez H, Frégnaux M, Charon E, Etcheberry A, Sublemontier O. Improving the Activity of Fe/C/N ORR Electrocatalyst Using Double Ammonia Promoted CO2 Laser Pyrolysis. C. 2020; 6(4):63. https://0-doi-org.brum.beds.ac.uk/10.3390/c6040063
Chicago/Turabian StylePerez, Henri, Mathieu Frégnaux, Emeline Charon, Arnaud Etcheberry, and Olivier Sublemontier. 2020. "Improving the Activity of Fe/C/N ORR Electrocatalyst Using Double Ammonia Promoted CO2 Laser Pyrolysis" C 6, no. 4: 63. https://0-doi-org.brum.beds.ac.uk/10.3390/c6040063
Note that from the first issue of 2016, this journal uses article numbers instead of page numbers. See further details here.