Microwave Plasma Formation of Nanographene and Graphitic Carbon Black
by
 ,
,
Raju R. Kumal
1, 
Akshay Gharpure
1,
Vignesh Viswanathan
2,
Aayush Mantri
2,
George Skoptsov
2 and
Randy Vander Wal
1,* 1
John and Willie Leone Family Department of Energy and Mineral Engineering, the EMS Energy Institute and the University Coalition for Fossil Energy Research (UCFER) Program, Penn State University, University Park, PA 16802, USA
2
H Quest Vanguard, Inc., 750 William Pitt Way, Pittsburgh, PA 15238, USA
*
Author to whom correspondence should be addressed.
C 2020, 6(4), 70; https://0-doi-org.brum.beds.ac.uk/10.3390/c6040070
Submission received: 26 September 2020
/
Revised: 23 October 2020
/
Accepted: 29 October 2020
/
Published: 31 October 2020
(This article belongs to the Special Issue Characterization of Disorder in Carbons)
Abstract
:Aerosol formation of novel carbons offers potential for scale and purity unmatched by condensed phase processes. A microwave driven plasma drives decarbonization of methane to form solid carbon as an aerosol. Dependent upon gas mixture, different forms of carbon are produced: 2D nanographene and a 3D graphitic carbon black analogue. TEM reveals the morphological differences and nanostructure. The ability to tune the dominant form is demonstrated by control of the CH4/Ar ratio. TGA plots reveal the change in products with feed gas composition and quality by oxidation temperature shift. Corresponding Raman analysis illustrates control of graphene content and lamellae quality by peak ratios. To test the origins of the graphitic particles and nanographene, a commercial carbon black was seeded into the microwave reactor, demonstrating a path for graphitic nanostructure evolution and confirming the molecular growth origins for the nanographene.

1. Introduction
High current plasmas are versatile vehicles for synthesis of novel carbon forms given their high energy density, energetic species and abundant radical concentrations. For example, few-layer graphene (FLG) nanosheets, polyhedral graphite particles (PGPs), carbonaceous monocrystals and graphene oxide [1,2] have been synthesized via arc discharge. In addition to graphenes [3], carbon nanotubes [4], nanofibers and onion like structures have been reported using plasma jets [5,6]. Meanwhile, varied studies have reported forming varied carbon blacks in discharge style plasmas [7,8,9].
Focusing on graphene sheets (so-called free-standing graphene), their synthesis has been reported in microwave [10,11,12,13,14] and arc discharge [1,7,8,15] plasmas, in plasma jets [16], dc plasma torches [15,17] and gliding arc discharges [18,19]. One study of graphene nano-flake synthesis in a non-thermal plasma process found that increasing the hydrogen to carbon (H/C) molar ratio promoted the morphological transformation of carbon nanomaterials from spherical carbon nanoparticles (SCNs) to graphene nanoflakes (GNFs), improving the quality of GNFs and reducing the stacking of graphite layers [20,21]. However, increasing the H/C ratio reduced the yields of carbon nanomaterials. Analysis suggested that increasing the H/C ratio reduced the concentration of polycyclic aromatic hydrocarbon (PAH) and generated more H atoms, which fostered two-dimensional nucleation and promoted planar growth. However, an excessive H/C ratio was postulated to introduce some defects due to an etching effect [20]. Elsewhere, to restrict particle nucleation and growth, diluted carbon species’ concentration has been set forth as enabling 2D growth geometry that favors graphene nanoflakes [22].
The effects of hydrogen and gas flow rate on the yield, size, morphology and structure of graphene have been investigated in an alternative-current (AC) rotating gliding arc plasma [23]. As the ratio of H2/CH4 increased, the purity of graphene in the product increased. In parallel, molecular dynamics simulations showed that low carbon source concentrations formed smaller sheets with improved structure while high concentrations formed clusters prone to curling and closing [23,24]. (It appears likely that the termination of edge carbons by C–H bonds can reduce the closure of layers.) In a non-thermal plasma operating at atmospheric pressure, GNFs were produced with sizes of 50–200 nm and 1–20 layers, spherical carbon nanoparticles 10–40 nm in diameter, and graphitic particles. Results showed that the formation of GNFs was dependent upon low precursor concentration, abundant H-atoms and low PAH content [18]. In a magnetically stabilized gliding arc discharge, amorphous spherical particles with a diameter in the range of 10–40 nm and graphene flakes with 1–20 layers were generated. Notably, graphene flakes were produced under a high gas temperature and long thermal history while the spherical particles were favored by the opposite conditions [25].
Using a microwave plasma, our prior work showed the H/C dependence of graphitic content using multiple independent characterization techniques: transmission electron microscopy (TEM), X-ray diffraction (XRD) and thermogravimetric analysis (TGA) [26]. A microwave plasma offers the unique features of atmospheric pressure operation and high electron concentration [11,27]. The former offers ease of processing while the latter ensures a high radical concentration and non-thermal chemistry. Such features are manifested in the direct formation of the free-standing (aerosol) form of nanographene, as reported previously [28]. Our prior study, applying optical radiometry semi-quantitatively, estimated the C2 concentration as ~1015, a very high radical concentration, supporting the non-equilibrium chemistry [26].
Here, a new form of carbon is reported—semi-graphitic carbon black particles. Formed as an aerosol within the reactive plasma, it resembles related forms of carbon black consisting of primary particles clustered together forming an aggregate. However, the lamellae length and stacking are quite different from that of ordinary rubber blacks; 2–3 lamellae form extended ribbons of several nanometers. Hence, its crystallite structure is atypical for a nascent aerosol carbon; it resembles that of an annealed carbon black.
2. Experimental
Microwave power at 2.45 GHz was fed through a water-cooled isolator, three-stub tuner, dual directional coupler, and waveguide coupling port on the plasma reactor cavity (H-Quest Vanguard Inc., Pittsburg, PA, USA) and varied from 1 kW to over 5 kW in this study. Mass flow controllers (Brooks Instruments, Hatfield, PA, USA) were used to control and monitor volumetric gas flow (CH4 and Ar). The Ar and CH4 flows were adjusted to maintain approximately the same overall flow velocity through the reactor as individual concentrations were varied. Experiments were performed varying the gas flow rates. Gases were injected axially. Reactor residence times were sub-second, and conversions were performed at atmospheric pressure.
Carbon black, for specific experiments, was fed into the reaction cavity using a vibratory feeder (Acrison Inc., Moonachie, NJ, USA), with a maximum feed rate capability of 1.7 kg/h. The solid recovery system was comprised of three distinct chambers, each with a separate collection trap: a knockout chamber, a high efficiency cyclone separator, and a baghouse filter. The gas flow pathway was instrumented with thermocouples and pressure transducers (Dwyer Instruments, Michigan City, IN, USA). Carbon products were collected using screen filtration and cyclonic separation.
A PC running a LabVIEW (National Instruments, Austin, TX, USA) control panel supplied the microwave and gas flow control inputs and captured and displayed real time measurements of microwave forward/reflected power, optical spectra, gas composition, and process temperatures and pressures. Further details may be found in prior publications [26,28].
With reactant gas mixture prominent to carbon product distribution, results are reported based on this parameter and are representative of those results under other conditions of power. Single pass conversion and product selectivities are determined by reaction conditions, specific energy input (which vary with microwave power and the reactant gas flow rates), relative flow rates, rate of quenching, etc. Due to high dimensionality of the configuration space, it is not practical to enumerate these configurations. Generally, as the specific energy input increases, the single pass conversion of methane increases, and can be 90% or higher. The selectivity to solid carbon increases with temperature of the stream and can be reduced to 5%–10% with rapid quenching, while increasing selectivity to acetylene.
With this study conducted as a categorical survey across test conditions, results from two reactant categories are presented: a low methane to argon ratio of order 1:10 versus a high methane to argon ratio of order 1:1. These two cases are designated as low ratio (LR) and high ratio (HR). Results are rather insensitive to gas composition, as results may be categorized as methane to argon ratios of less than 25% or methane to argon ratios greater than 75%. Power improves methane conversion while quality is intertwined with gas mixture composition. Addition of hydrogen was beneficial towards improving graphitic quality at lower methane concentrations, as reported previously [26].
3. Results
3.1. TEM
The microwave (MW) plasma reactor allows control of input power, gas flows and mixture composition. Control of the latter affords tuning products towards either a 2D or 3D carbon product form. The sensitivity to mixture composition is low. These (solid) carbons are produced as an aerosol (so-called free-standing) as a mixture; control of reactor conditions permits tuning their relative proportion. At any given condition there is a range of product form, size and quality.
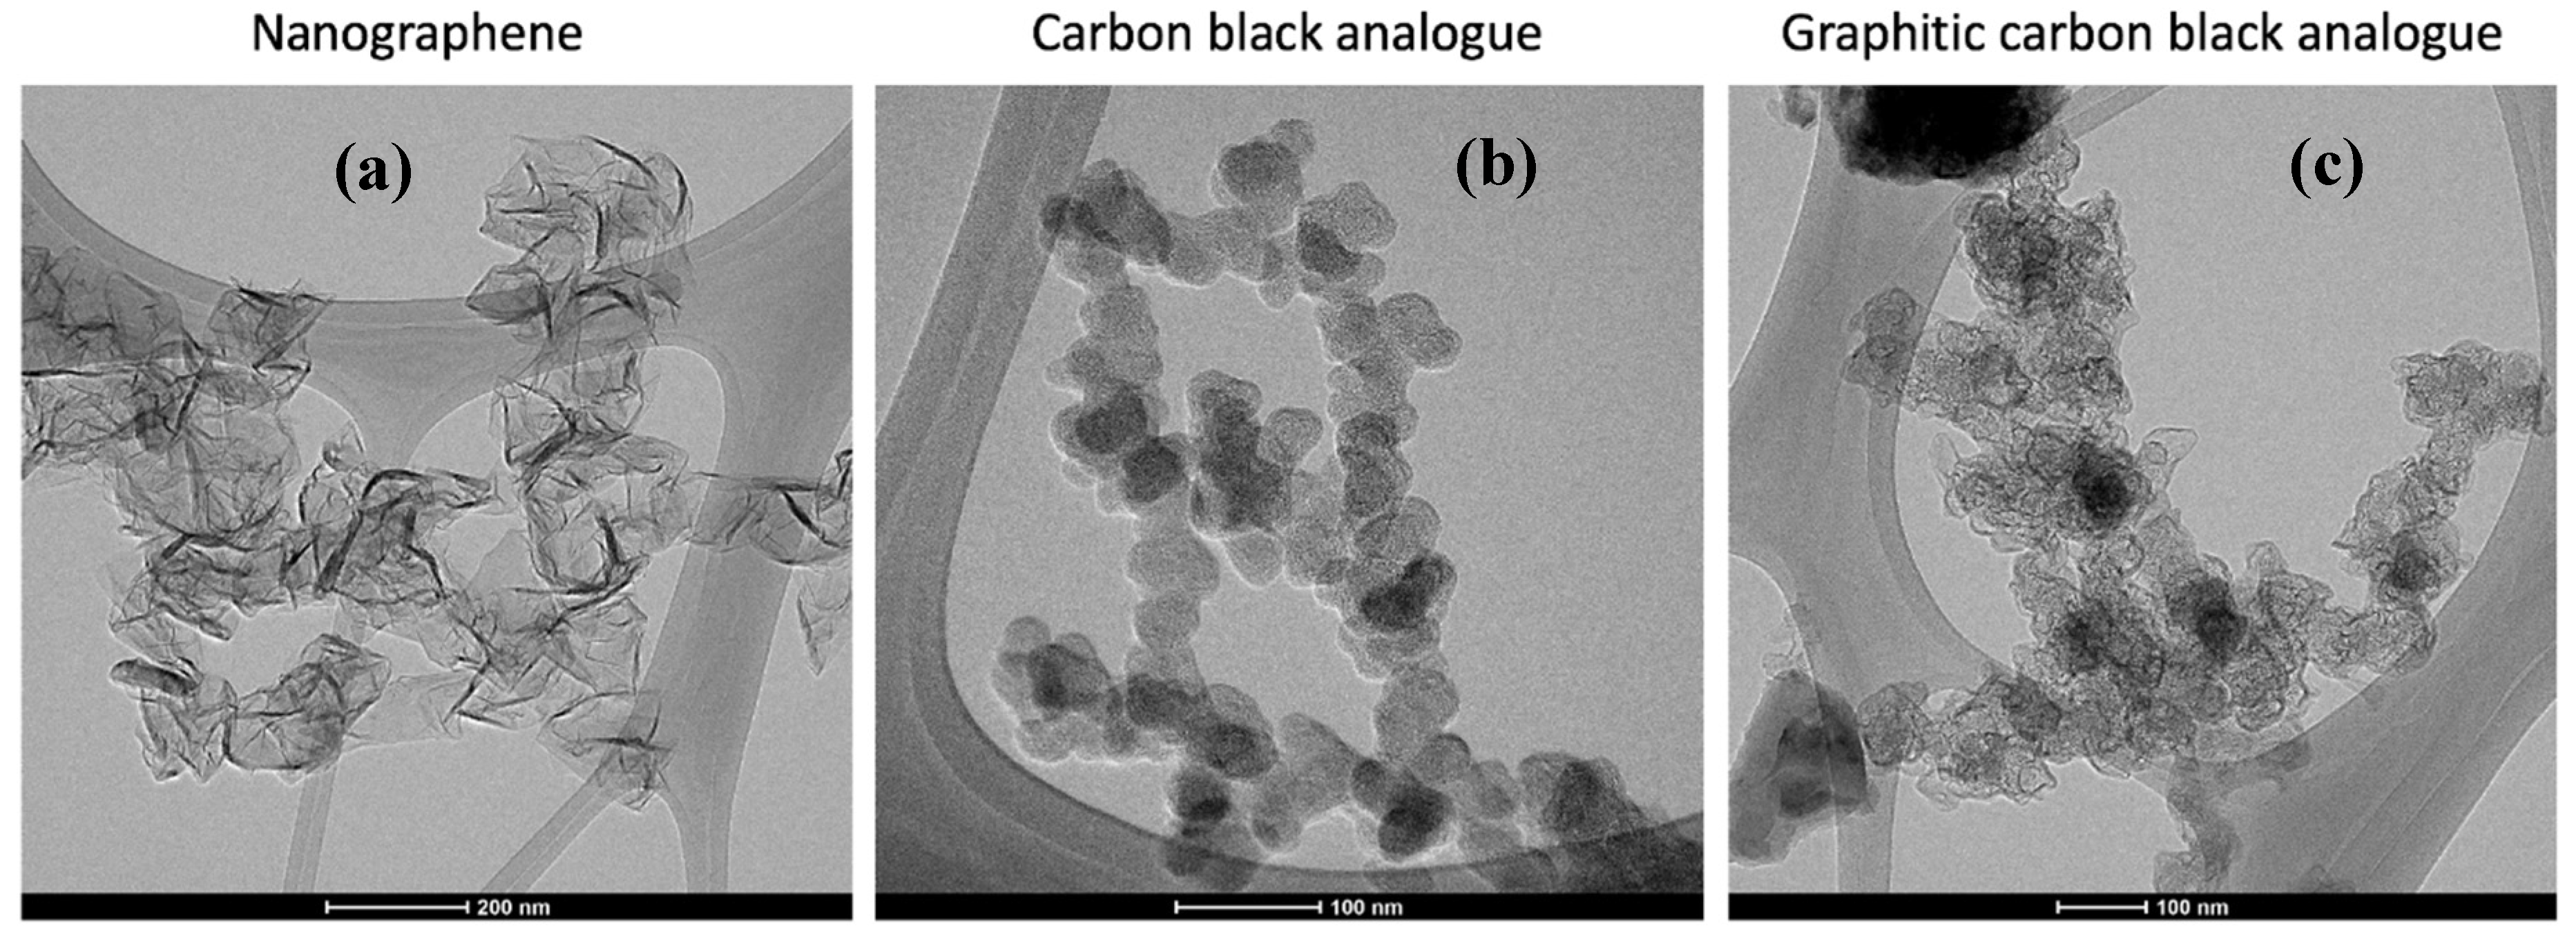
The morphological differences and nanostructure of carbon materials has been gained through the application of high-resolution transmission electron microscopy (TEM) [29,30,31]. Figure 1 shows representative TEM images of the carbon products formed by the action of the MW plasma: particles with high internal nanostructure, referred to as graphitic carbon black analogue (GCBA, Figure 1c), and nanographene (NG, Figure 1a) as reported earlier, and a third form also with particle–aggregate structure but without pronounced internal structure. Possessing sub-unit particles assembled into an aggregate structure, this third “amorphous” form has similar morphology to the GCBA material but with the distinguishing feature that its internal nanostructure metrics are small in comparison, hence its designation as amorphous carbon black analogue, ACBA (Figure 1b). Individual sub-unit particles appear somewhat more distinct relative to those in the GCBA material.
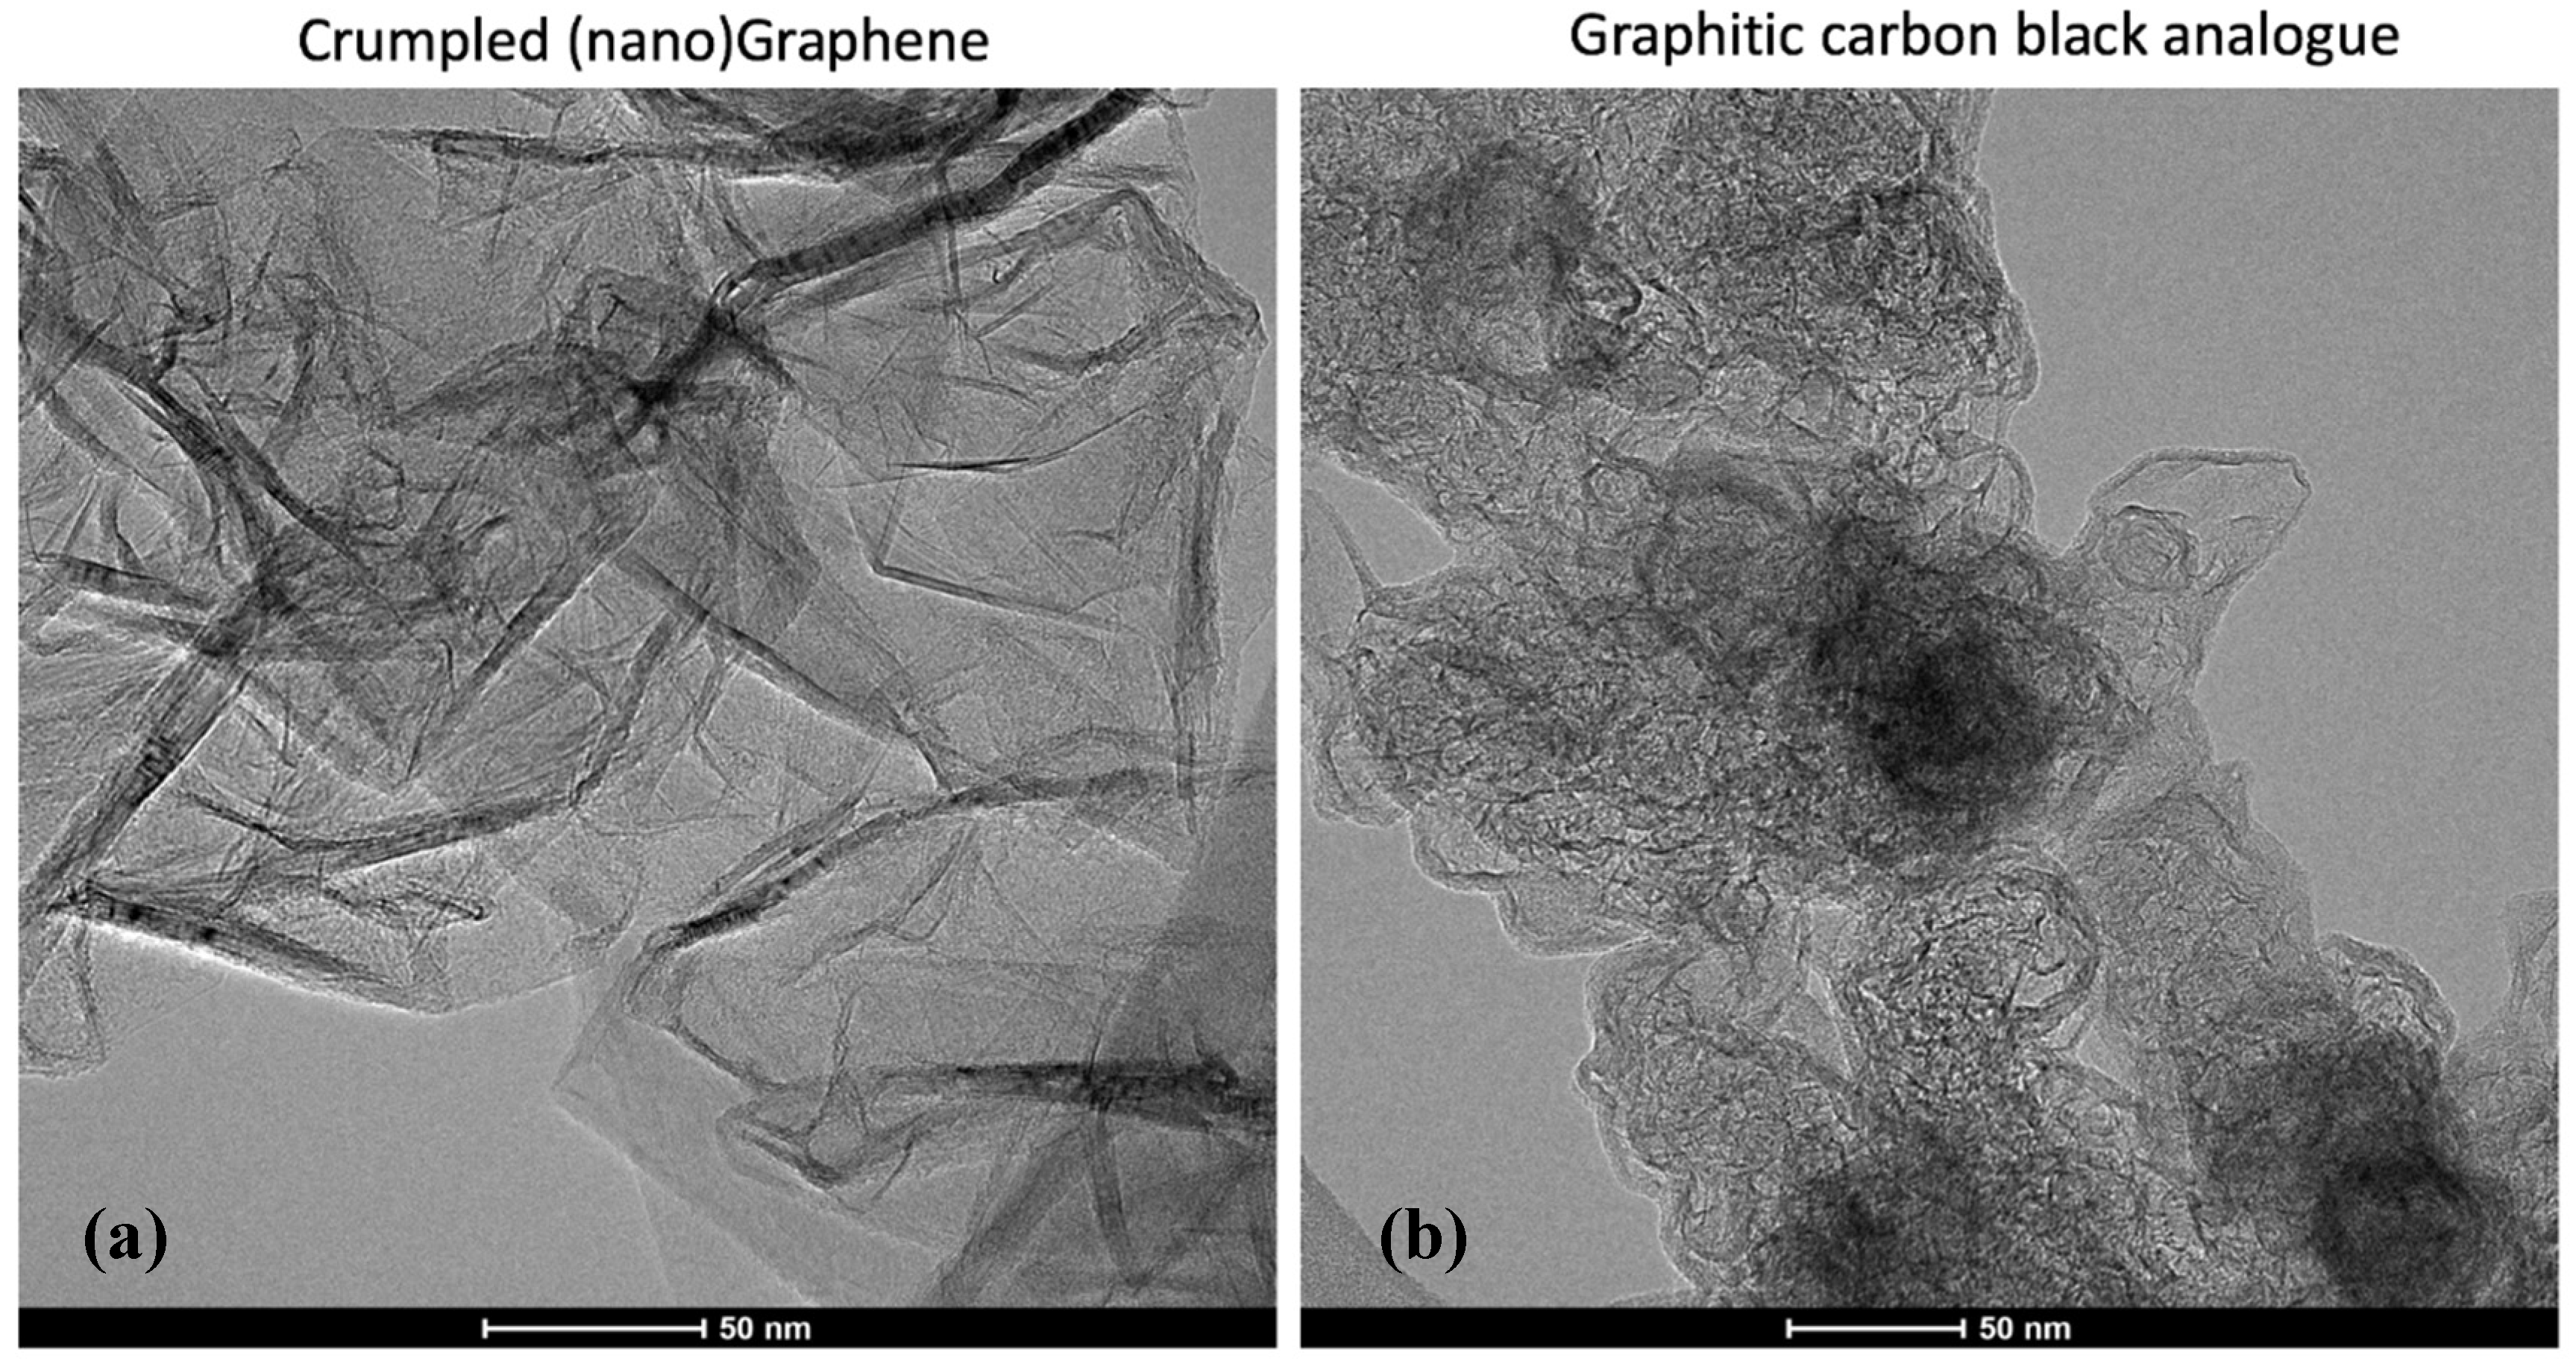
At higher magnification, Figure 2 highlights the contrast between the two morphologically distinct carbons as may be produced by the MW driven plasma: GCBA and graphene. Ribbons of extended lamellae are evident in the former while individual layer edges are seen in the latter. The GCBA material appears to have internal structure, evidence of internal voids with the pronounced shells being formed by extended carbon lamellae, as previously described. Given the ribbons of extended lamellae that are internal to the particles forming compartments and their shells, and their overall morphological similarity to carbon black aggregates, this form is referred to as graphitic carbon black analogue (GCBA) material. The nanographene appears as few-layer “platelets” often with curled edges. Platelets in turn appear connected, and twisted, suggestive of a continuous, albeit geometrically irregular filament. With either flat or crumpled morphology, the NG consists of few layer stacks (generally 3–6 sheets). Often the stacks appear in the form of a connected chain or accordion configuration. Lateral sizes are of the order of 100 nm. For LR conditions, GCBA and nanographene are produced. For HR conditions, GCBA and the ACBA form are produced.
The measured surface area for mixtures at present is modest, ~150 m2/g; it is consistent with ~30% graphene nanoplatelet content, in few-layer stacks, and non-porous carbon spherules. In fact, for this comparatively low graphene content, the surface area compares well with other values reported for similarly layered platelets, ~500 m2/g. Present efforts are focused on mapping reaction conditions for refined product specificity.
3.2. TGA
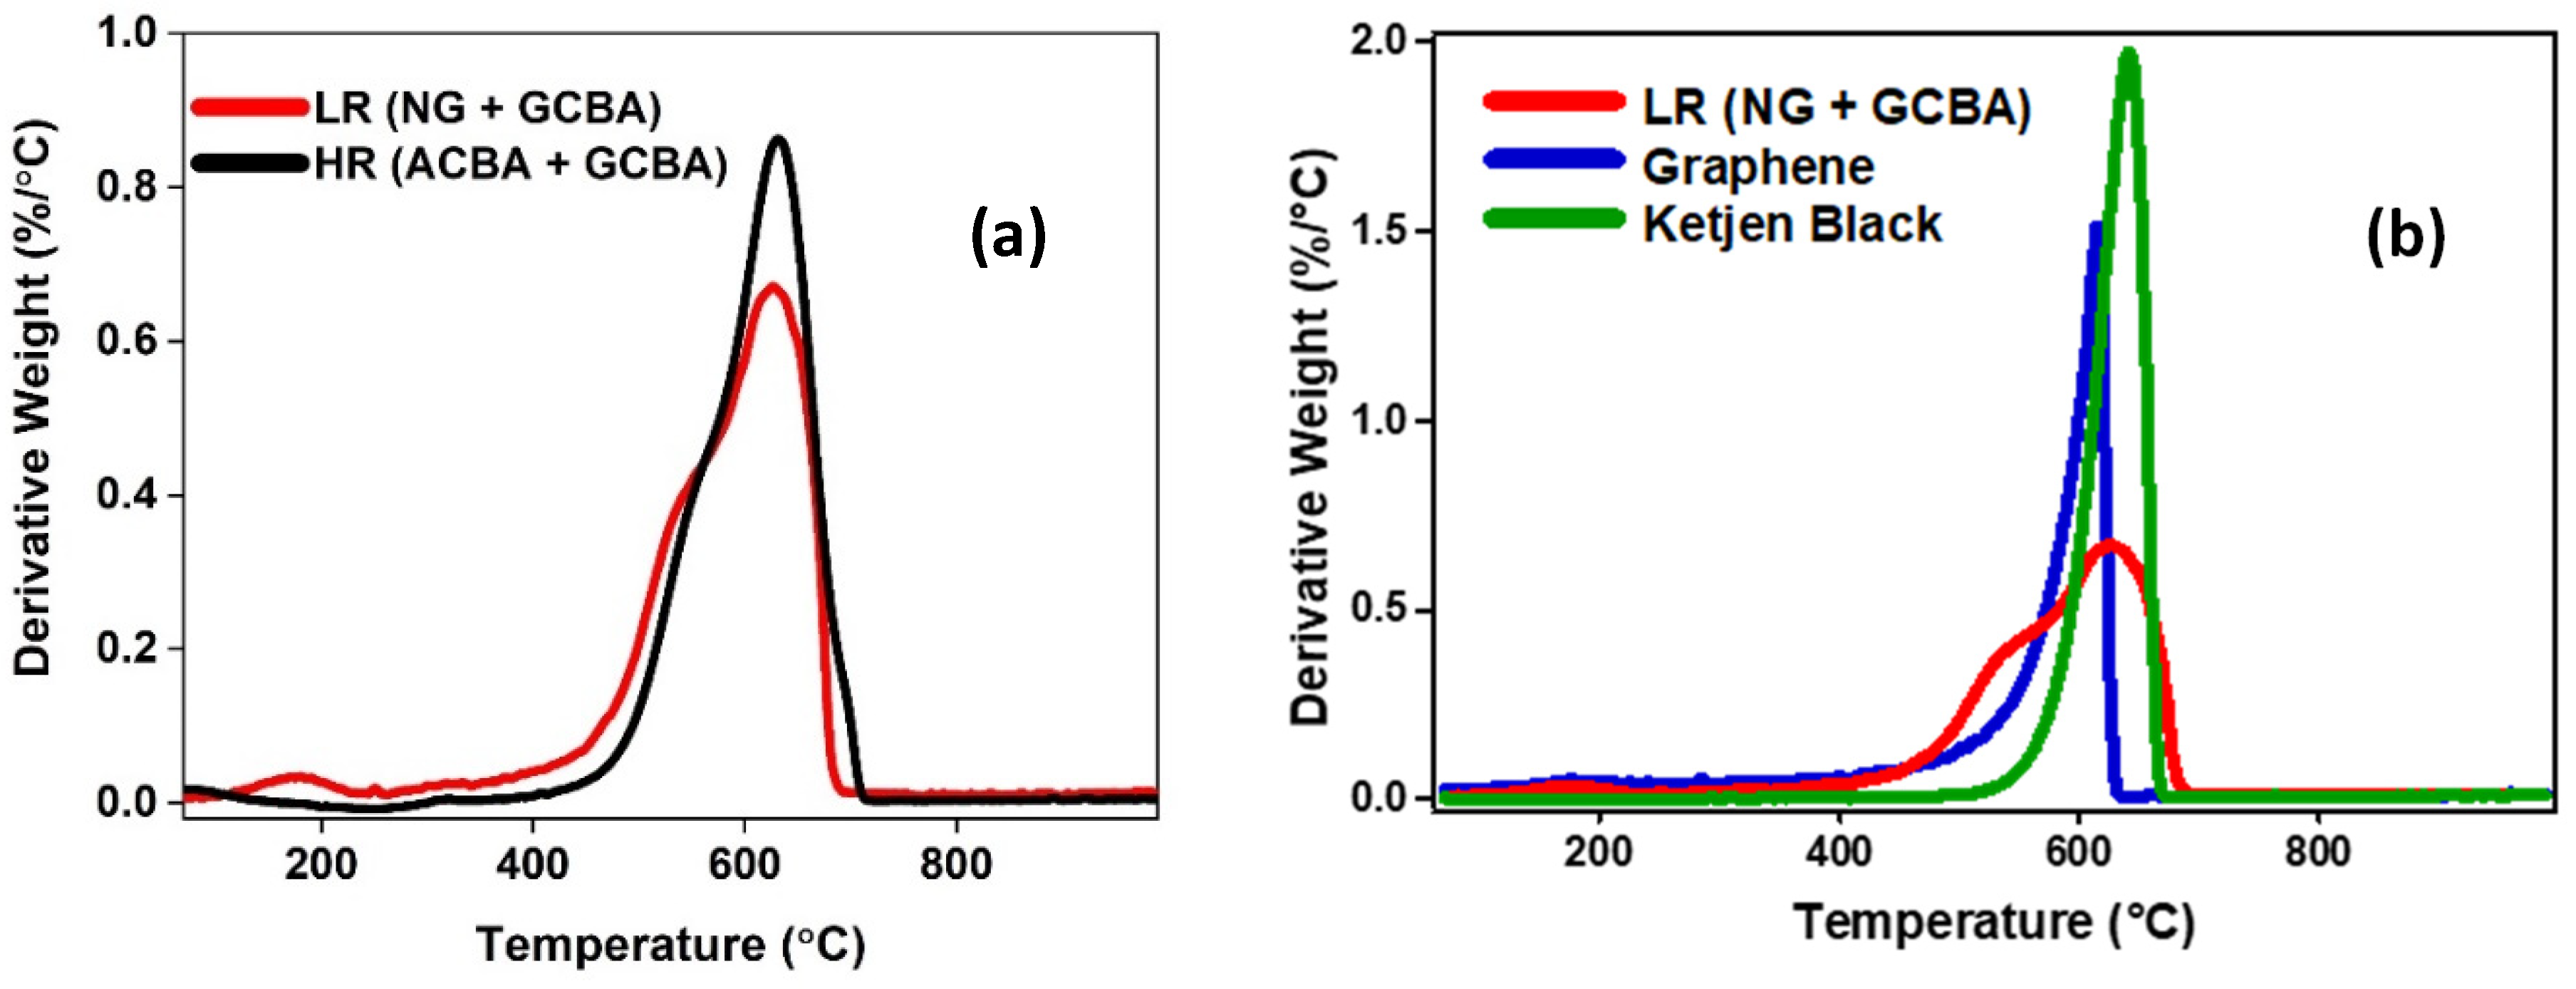
Interpretation of a thermogravimetric analysis (TGA) plot is best done using its derivative form, which marks the peak reaction (oxidation) temperature. These can be referenced to known or otherwise characterized materials with defined graphitic structure and corresponding oxidation resistance. One such form is the moderately graphitic carbon black known as Ketjen Black. TEM images reveal a similar nanostructure comprised of extended ribbons forming internal voids. (Its internal nanostructure is analogous to an annealed (heat-treated) carbon black, accounting for its low reactivity and graphitic nanostructure.) A second reference material graphene exhibits a different, yet sharp profile and lower peak oxidation temperature reflecting edge sites. Derivative spectra are shown in Figure 3b for each of these materials.
Figure 3a shows the derivative plot for the carbons produced under LR and HR conditions. The high temperature peaks align well while the lower temperature edge of the LR plot reflects the graphene content. As shown in the overlay for the LR material in Figure 3b, the Ketjen Black shows close correspondence with the high temperature peak at ~700 °C. The comparative narrowness of the Ketjen Black peak reveals its uniformity while also illustrating that the first, lower-temperature peak in the LR spectrum corresponds to a more readily oxidized material. The graphene overlap with the low temperature band identifies this form. Greater edge site exposure facilitating its oxidation, coupled with large layer separation, accounts for the lower oxidation temperature of the LR graphene compared to the reference graphene.
The similarity in oxidation temperatures with the reference materials suggests similar structural form but what is actually being measured is oxidative reactivity, which is not unique to a particular form. The ratio of edge sites to basal sites, defects, curvature, etc. all contribute the observed reactivity. Definitive assignment of form requires an additional technique such as TEM. Using TEM to assign morphological forms to the two TGA peaks, the split between graphene and GCBA form is ~ 1:1 based on the respective integrated areas of the deconvolved peaks for the LR material. TEM examination of the HR material shows amorphous and graphitic particle forms, guiding interpretation of the corresponding TGA spectrum. Integrated areas bear roughly a 1:1 ratio for these two forms with an estimated nanographene content of less than 5% based on TEM for this condition.
3.3. Raman Spectroscopy
The main features in the Raman spectra of graphitic materials are the D, G and 2D bands at ~1300 cm−1, ~1580 cm−1 and ~2700 cm−1, respectively. The G band stems from in plane vibrations and has E2g symmetry. The D band stems from a double resonance process involving a phonon and a defect and can be considered as a breathing mode of A1g symmetry. Structural defects (such as edges, vacancies or dopants) are generally the cause of the D band and as such its relative intensity can be related to the average crystallite size. The 2D band is an overtone of the D band. Like the D band, it stems from a double resonance process. However, it does not require a defect for activation and instead involves scattering from a second phonon and so its intensity can be related to spatial uniformity in the graphitic plane and interplane spacing.
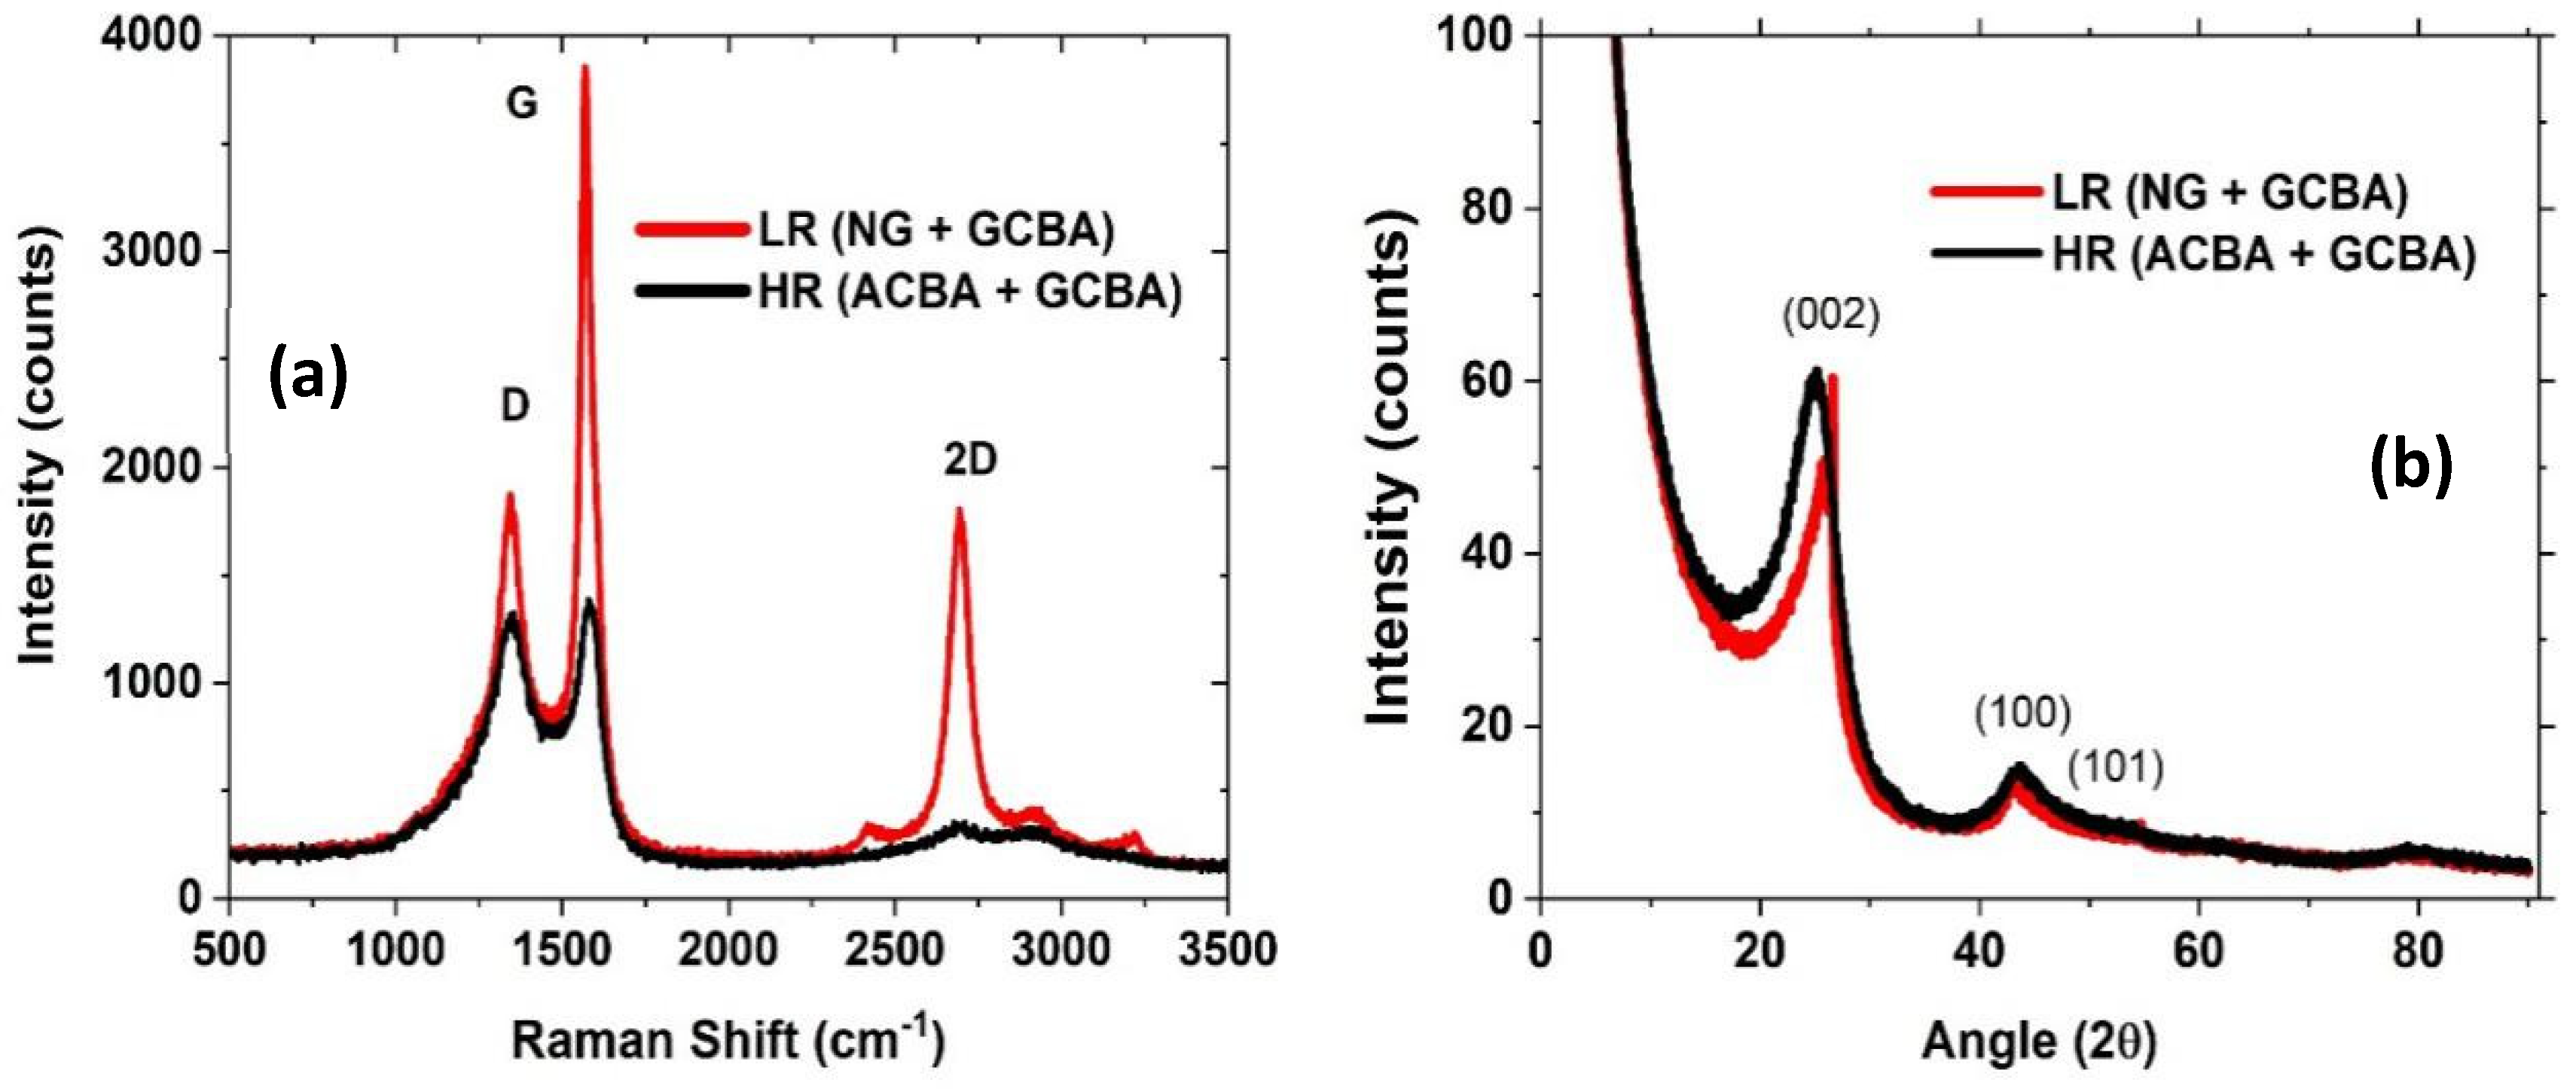
The comparative difference in overall graphitic quality is manifested in the Raman spectra of the carbon formed by the LR and HR reactive gas mixtures, shown in Figure 4a. For the LR condition the high G/D ratio of 2, along with the narrow G-band width is consistent with the extended lamellae, as shown in the TEM images. For the HR case, the corresponding G/D peak ratio is significantly lower, 1, consistent with the lower overall graphitic quality as gauged by TGA and TEM. The ratio of ID/IG may be used to infer an in-place lattice dimension, using La = 4.4(Id/Ig)−1 [32,33]. Applying this analysis to the Raman spectrum for the LR material yields La = 9 Å, consistent with the value of 10.9 Å as extracted from XRD analysis.
As a measure of graphene content, the 2D/G ratio is ~0.5 for the LR condition, while it is ~0.25 for the HR condition. Notably, the ratio is not particular to a given graphene content; instead, it arises from the vibrational mode associated with a free surface (aromatic) layer. The 2D form of the NG (even with curled edges) amplifies the vibrational scattering of the incident light, while lamellae in small crystallites are far more constrained and have low scattering cross section. Therein, the small undulations observed for the HR case correspond to the surface exposed graphene with varied stacking in crystallites. Correspondingly, TEM aids interpretation of the signal origin in relation to the particular carbon forms.
3.4. XRD
The XRD pattern of carbon materials produced at low and high methane to argon ratio (LR and HR) is shown in Figure 4b. The d(002) peak is sharper for the carbon material produced at LR condition compared to the carbon produced at HR condition. This indicates that the carbon produced at LR condition is more crystalline in nature due to the presence of nanographene and GCBA. A two peak fit was applied to the profile for samples from each run condition to obtain the lattice parameters. For the LR case, comparing NG to GCBA, the NG had larger lattice spacing (3.7 Å) compared to 3.4 Å and smaller crystallite stack height Lc (12 Å vs. 32 Å). The larger spacing is common for graphene and indicates turbostratic structure, whereas the small lattice spacing for the GCBA form suggests regular periodic structure given the registry between sheets. Based on Lc values, ~3 lamellae on average are stacked in the NG form while nearly 10 lamellae form the average crystallite in the GCBA material. Given that the 101 peak is unresolved into components, its full width is used to calculate an La value of 110 Å, an average over both forms.
For the HR case, Lc values are 9.5 Å and 21 Å for the ACBA versus GCBA forms, respectively, as crystallite stack heights. The corresponding d(002) values of 3.9 Å and 3.5 Å (ACBA and GCBA, respectively) indicates that the crystallites are 2–3 lamellae on average in the amorphous form while approximately 6 lamellae form the crystallites in the GCBA form.
3.5. Formation Mechanisms for Nanographene and GCBA
An open question is the mechanistic pathway forming either the nanographene or GCBA material. The former is a non-entropic form of carbon that previously has been formed by chemical vapor deposition (CVD) upon catalytically active substrates or via top-down approaches involving exfoliation of varied carbons such as powdered graphite by chemical, thermal or electrochemical processes, or mechanical stripping [34,35]. The formation of “free-standing” graphene as an aerosol is non-intuitive, being contrary to the normal pyrolysis product of carbon spheres configured in aciniform profiles. The difference in both morphology and degree of crystalline structure points to the unique reactive environment created by the MW plasma. Each comprised of sp2 carbon, these two very distinctive morphologies are produced by MW plasma driven decomposition of methane. The reaction path, specific chemical reactions and key intermediates leading to each product are open questions. Moreover, how can both forms occur together under the same reaction conditions?
Our prior studies have shown high concentrations of to correlate with formation of these products and non-equilibrium temperatures—a hallmark indicator of non-thermal plasma chemistry [28]. Such observations point to a bottom-up, molecular synthesis path. Yet an opposite path could be deconstruction of forming carbon particles. One could hypothesize that some particles anneal (i.e., partially graphitize) while others deconstruct under the action of the MW plasma to form the macro-molecular building blocks for the nanographene. Indeed, this sequential product pathway would account for the two observed morphologies. Moreover, the oft observed twisted filament of nanographene sheets would seemingly point to an “unraveling” of a particle into flat ribbons or connected platelets, consistent with the morphological appearance as marked in Figure 1.
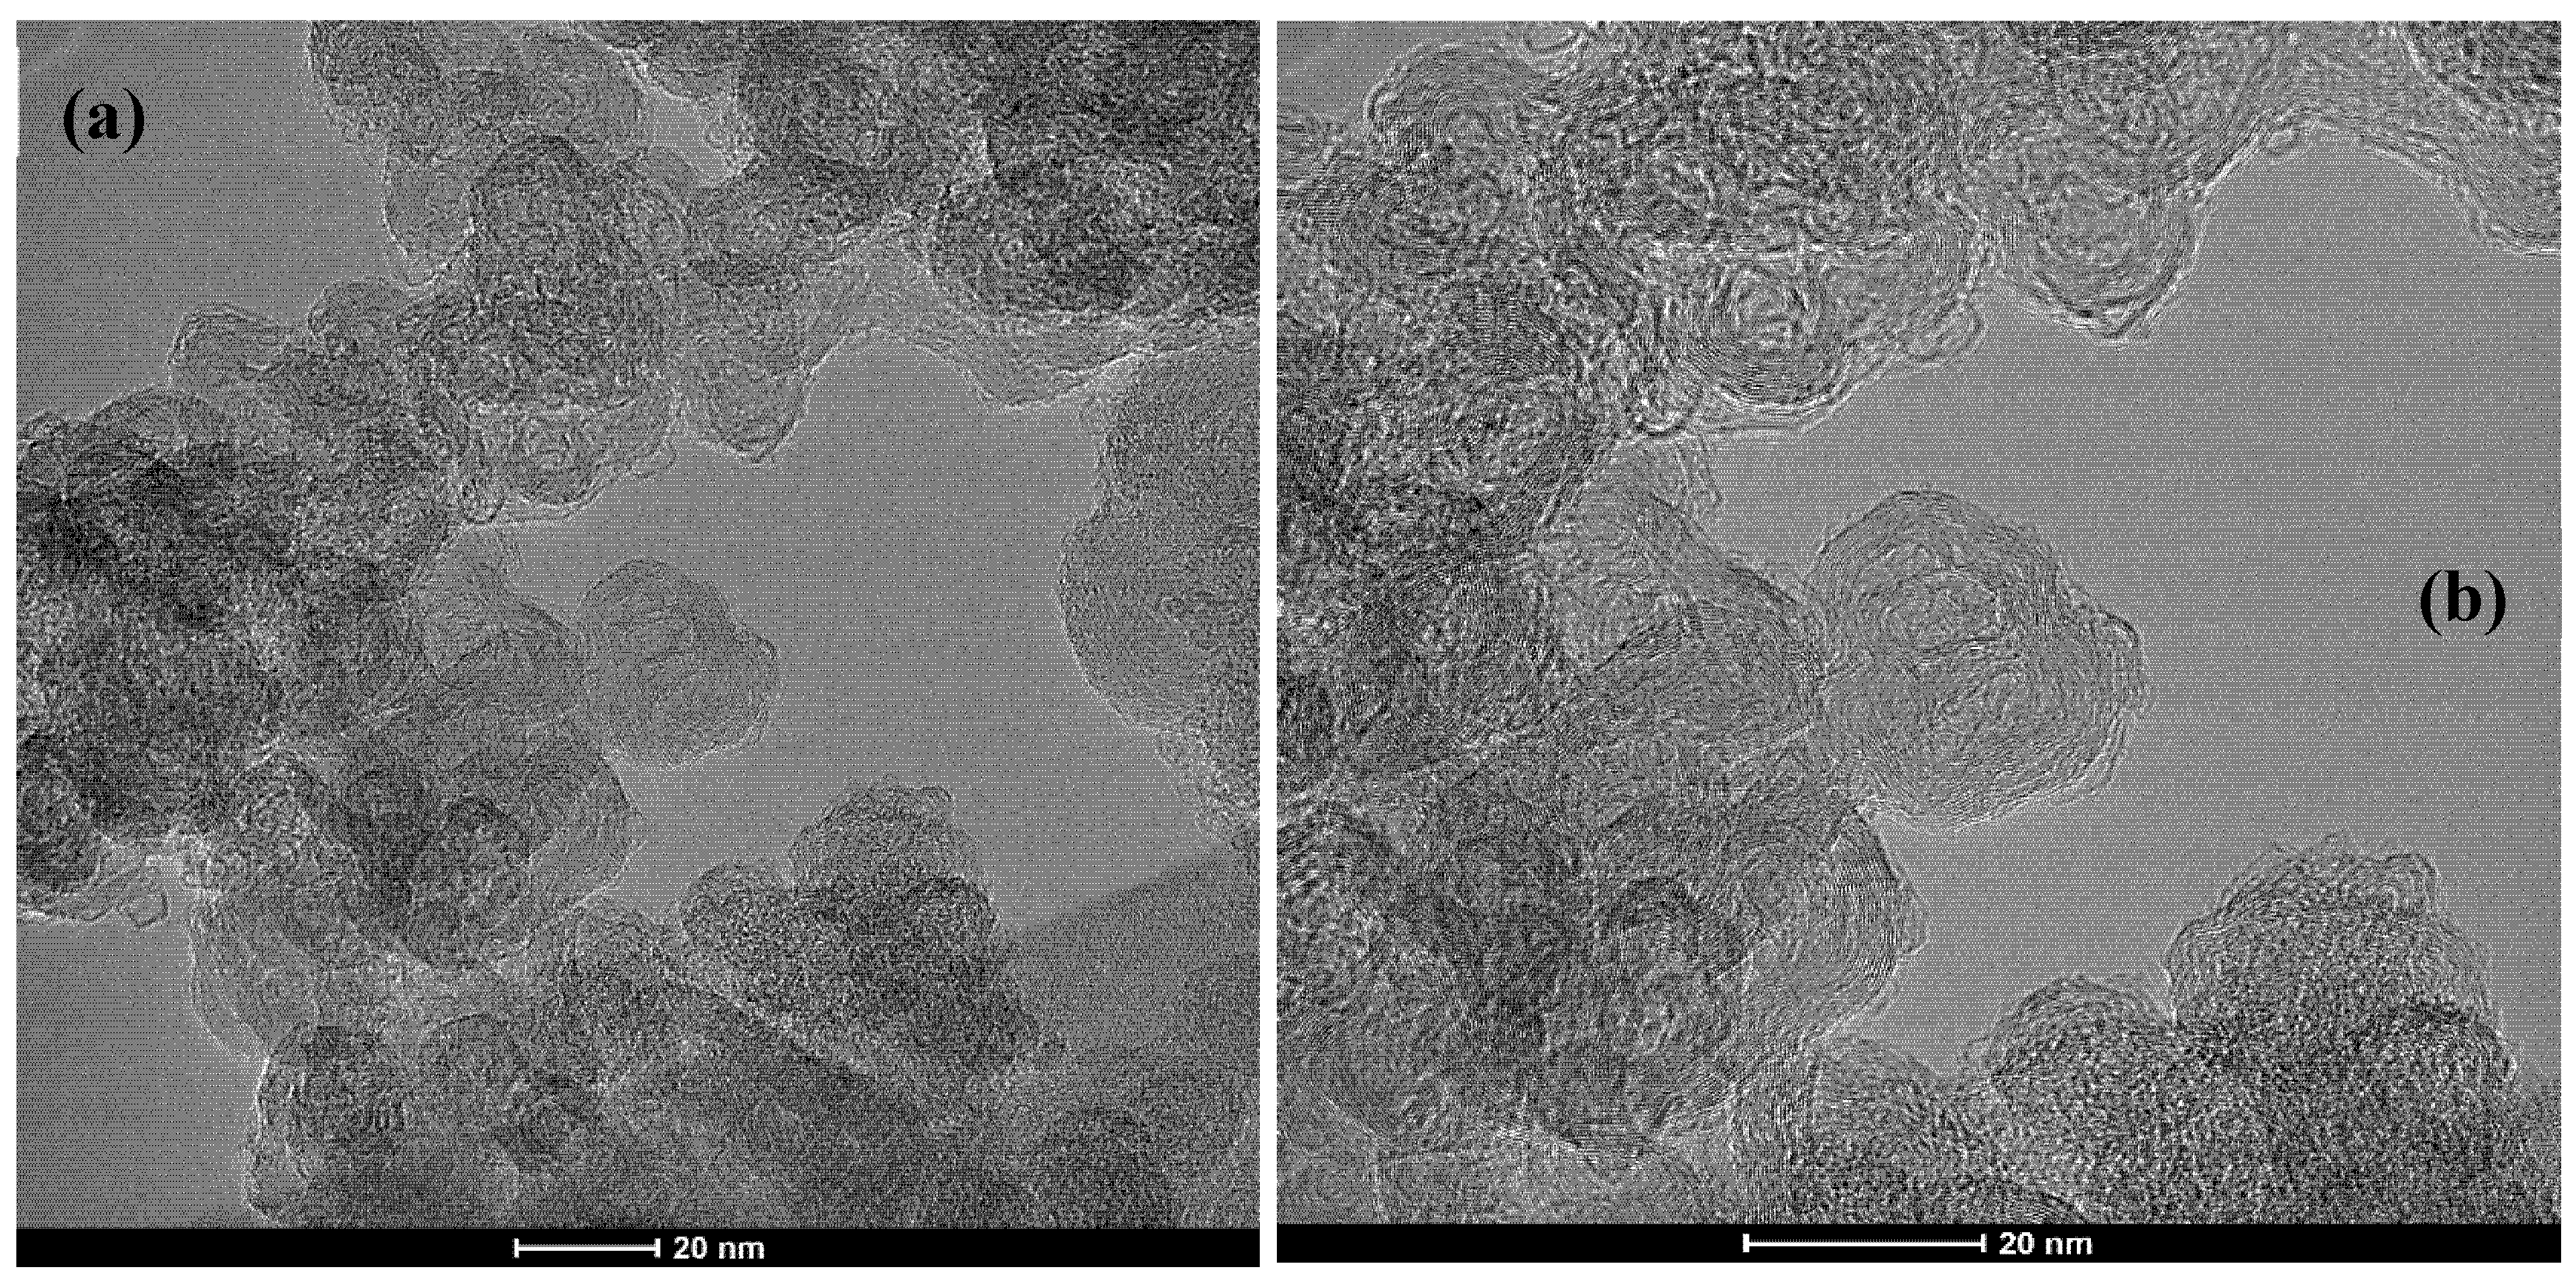
To test this hypothesis, XC-72, a well-known commercial carbon black by Cabot Corp. was seeded into the microwave plasma under an Ar/H2 gas environment. As preformed particles, their transformation into conductive carbon black analogue (CCBA) material and/or conversion into nanographene would be telling. As the images in Figure 5 show, for MW processed XC-72, a very high concentration of partially annealed particles are observed—resembling the GCBA material formed in situ. The images show banded graphene ribbons running along the particle perimeters with internal ribbons dividing the interior into compartments. Multiple internal ribbons and voids are manifest in each particle. The comparative nanostructure, high yield and uniformity of graphitic structure argues for MW heating of forming particles as the origin of the GCBA material. That a higher yield and uniformity are observed than for the GCBA material suggests that for in situ particle formation, not all particles form early enough for MW induced transformation to occur. The general absence of any nanographene form is strong evidence against its origins as being a deconstruction of carbon particles. A bottom-up synthesis path, via assembly of molecular precursors, is consistent with our earlier observations of high concentrations [28].
4. Discussions
Elements of a graphene formation mechanism involve radical formation, a polymerization mechanism involving CH3 radicals and acetylene, leading to the formation of varied carbon nanostructures such as multilayer graphene sheets and nanoparticles in Ar–CH4 gas mixtures [11]. In addition to our results highlighting concentrations [28], related studies report that both radicals and high gas temperatures (>3000 K) are required for the synthesis of these materials [13]. Not surprisingly electron-induced reactions are stated as critical to CH4 conversion and the formation of H-atoms while the generation of C2H2 is essential for aromatic ring growth [36]. Spectral emission analysis has revealed significant H-atom concentrations, suggesting the importance of H atoms in the graphene flake formation. Projected as hypothesis, a high temperature and rich H-atom environment can suppress the formation of curved or closed structures, leading to the production of graphene flakes with high crystallinity [25].
In our prior work, the dependence of the different carbon forms upon H/C ratio of the gas feed mixture was shown across multiple analytical characterizations. Attributes of (a) phase quality (pristine nature of NG) and (b) phase quantity (how much NG forms relative to other carbon sp2 phases) were addressed [26]. Phase identification of the forms was performed via transmission electron microscopy with quantification by thermogravimetric analysis. X-ray diffraction differentiated these forms based on varied extent of graphitic structure. Electron energy loss spectroscopy assessed graphitic content by the ratio of sp2/sp3 bonding. Raman spectroscopy supported the observed shift in relative proportions of the carbon forms towards preferential graphitic content with increasing H/C.
More broadly, the effects of hydrogen have been widely reported in chemical vapor deposition [37,38,39] and arc-discharge syntheses [40,41,42]. It is believed that H atoms can suppress the random bonding between carbonaceous radicals by terminating dangling carbon bonds, and consequently preventing the rolling and closing of graphitic layers into spheres or tubes, which can then facilitate the growth of planar nanoflakes. Yet, beyond these generalities, mechanisms are unmapped. Plasma environments challenge diagnostics, inhibiting species and temperature measurement.
5. Conclusions
This study addresses the capability to tune product characteristics by evaluating the selectivity of product yields and forms. Gas mixture composition governs the dominant carbon form. CH4/Ar ratios of the order of 1:10 are well suited for 2D NG formation. The addition of H2 improves the graphitic quality of both NG and GCBA forms. CH4/Ar ratios in the range of 1:1, regardless of hydrogen addition, favor the formation of 3D structured carbon aerosols similar in form to a graphitic carbon black. Characterization by TEM, XRD and TGA reveal structural features of the two forms. Additive tests using a pre-formed carbon black show that while the MW plasma heating is intense (causing partial annealing), it does not appear to cause disaggregation or disassembly of the carbon particles. Their intact form and assemblies rule out their hypothesized deconstruction as the path for nanographene formation.
Author Contributions
Conceptualization, R.V.W. and G.S.; methodology, G.S. and R.V.W.; formal analysis, R.R.K., A.G. and R.V.W.; investigation, V.V., A.M., R.R.K. and A.G; resources, G.S. and R.V.W.; data curation, R.R.K., A.G., A.M. and V.V.; writing—original draft preparation, R.V.W.; writing—review and editing, R.V.W., R.R.K., A.G., and G.S.; supervision, R.V.W. and G.S.; project administration, R.V.W.; funding acquisition, R.V.W. All authors have read and agreed to the published version of the manuscript.
Funding
The support of the United States Department of Energy, National Energy Technology Laboratory (NETL) through the NETL-Penn State University Coalition for Fossil Energy Research (UCFER 0005-PSU-DOE-6825, DE-FE0026285) is gratefully acknowledged.
Acknowledgments
Material characterizations (TEM, XRD, Raman, TGA) were performed using the facilities of the Material Research Institute (MRI) at the Pennsylvania State University. Authors would like to acknowledge Jennifer Gray, Maxwell Wetherington, Katya Bazilevskaya, Nichole Wonderling and Tawanda Zimudzi for their help in characterization.
Conflicts of Interest
The authors declare no conflict of interest.
References
- Kumar, R.; Singh, R.K.; Dubey, P.K.; Kumar, P.; Tiwari, R.S.; Oh, I.-K. Pressure-Dependent Synthesis of High-Quality Few-Layer Graphene by Plasma-Enhanced Arc Discharge and Their Thermal Stability. J. Nanopart. Res. 2013, 15, 1847. [Google Scholar] [CrossRef]
- Li, B.; Nan, Y.; Zhang, P.; Wang, Z.; Lu, Q.; Song, X. Synthesis and Characterization of Carbon Nanostructures by Evaporating Pure Graphite and Carbon Black in Detonation-Gas Arc Discharge. Diam. Relat. Mater. 2015, 55, 87–94. [Google Scholar] [CrossRef]
- Amirov, R.; Shavelkina, M.; Alihanov, N.; Shkolnikov, E.; Tyuftyaev, A.; Vorob’eva, N. Direct Synthesis of Porous Multilayer Graphene Materials Using Thermal Plasma at Low Pressure. J. Nanomater. 2015, 2015, 724508. [Google Scholar] [CrossRef] [Green Version]
- Poudel, Y.R.; Li, W. Synthesis, Properties, and Applications of Carbon Nanotubes Filled with Foreign Materials: A Review. Mater. Today Phys. 2018, 7, 7–34. [Google Scholar] [CrossRef]
- Shavelkina, M.; Amirov, R.; Bilera, I. Formation of Carbon Nanostructures by The Plasma Jets: Synthesis, Characterization, Application. Mater. Today Proc. 2018, 5, 25956–25961. [Google Scholar] [CrossRef]
- Dato, A. Graphene Synthesized in Atmospheric Plasmas—A review. J. Mater. Res. 2019, 34, 214–230. [Google Scholar] [CrossRef] [Green Version]
- Sun, D.; Hong, R.; Liu, J.; Wang, F.; Wang, Y. Preparation of Carbon Nanomaterials Using Two-Group Arc Discharge Plasma. Chem. Eng. J. 2016, 303, 217–230. [Google Scholar] [CrossRef]
- Wang, F.; Hong, R. Continuous Preparation of Structure-Controlled Carbon Nanoparticle Via Arc Plasma and The Reinforcement of Polymeric Composites. Chem. Eng. J. 2017, 328, 1098–1111. [Google Scholar] [CrossRef]
- Pristavita, R.; Mendoza-Gonzalez, N.-Y.; Meunier, J.-L.; Berk, D. Carbon Nanoparticle Production by Inductively Coupled Thermal Plasmas: Controlling The Thermal History of Particle Nucleation. Plasma Chem. Plasma Process. 2011, 31, 851–866. [Google Scholar] [CrossRef]
- Dias, A.; Tatarova, E.; Henriques, J.; Luhrs, C. Microwave plasma based single-step method for generation of carbon nanostructures. In Proceedings of the 31st ICPIG, Granada, Spain, 14–19 July 2013. [Google Scholar]
- Bundaleska, N.; Tsyganov, D.; Dias, A.; Felizardo, E.; Henriques, J.; Dias, F.; Abrashev, M.; Kissovski, J.; Tatarova, E. Microwave Plasma Enabled Synthesis of Free Standing Carbon Nanostructures at Atmospheric Pressure Conditions. Phys. Chem. Chem. Phys. 2018, 20, 13810–13824. [Google Scholar] [CrossRef]
- Melero, C.; Rincón, R.; Muñoz, J.; Zhang, G.; Sun, S.; Perez, A.; Royuela, O.; González-Gago, C.; Calzada, M. Scalable Graphene Production from Ethanol Decomposition by Microwave Argon Plasma Torch. Plasma Phys. Control. Fusion 2017, 60, 014009. [Google Scholar] [CrossRef]
- Rincón, R.; Melero, C.; Jiménez, M.; Calzada, M. Synthesis of Multi-Layer Graphene and Multi-Wall Carbon Nanotubes from Direct Decomposition of Ethanol by Microwave Plasma without Using Metal Catalysts. Plasma Sources Sci. Technol. 2015, 24, 032005. [Google Scholar] [CrossRef]
- Yamada, T.; Kim, J.; Ishihara, M.; Hasegawa, M. Low-Temperature Graphene Synthesis Using Microwave Plasma CVD. J. Phys. D Appl. Phys. 2013, 46, 063001. [Google Scholar] [CrossRef]
- Kim, K.S.; Hong, S.H.; Lee, K.-S.; Ju, W.T. Continuous Synthesis Of Nanostructured Sheetlike Carbons by Thermal Plasma Decomposition of Methane. IEEE Trans. Plasma Sci. 2007, 35, 434–443. [Google Scholar] [CrossRef]
- Fronczak, M.; Fazekas, P.; Károly, Z.; Hamankiewicz, B.; Bystrzejewski, M. Continuous and Catalyst Free Synthesis of Graphene Sheets In Thermal Plasma Jet. Chem. Eng. J. 2017, 322, 385–396. [Google Scholar] [CrossRef]
- Shavelkina, M.; Amirov, R.; Katarzhis, V.; Kiselev, V. Application of DC Plasma Torch For Synthesis Of Carbon Nanostructured Materials. J. Phys. Conf. Ser. 2016, 748, 012021. [Google Scholar] [CrossRef]
- Li, D.; Wang, C.; Lu, Z.; Song, M.; Xia, W.; Xia, W. Synthesis of Graphene Flakes Using A Non-Thermal Plasma Based on Magnetically Stabilized Gliding Arc Discharge. Fuller. Nanotub. Carbon Nanostruct. 2020, 28, 1–11. [Google Scholar] [CrossRef]
- Wang, C.; Lu, Z.; Li, D.; Xia, W.; Xia, W. Effect of The Magnetic Field on The Magnetically Stabilized Gliding Arc Discharge and Its Application in The Preparation of Carbon Black Nanoparticles. Plasma Chem. Plasma Process. 2018, 38, 1223–1238. [Google Scholar] [CrossRef]
- Lu, Z.; Li, D.; Wang, C.; Chen, X.; Xia, W. Effects of Hydrogen/Carbon Molar Ratio on Graphene Nano-Flakes Synthesis by A Non-Thermal Plasma Process. Diam. Relat. Mater. 2020, 108, 107932. [Google Scholar] [CrossRef]
- Chen, X.; Wang, C.; Song, M.; Ma, J.; Ye, T.; Xia, W. The Morphological Transformation of Carbon Materials from Nanospheres to Graphene Nanoflakes by Thermal Plasma. Carbon 2019, 155, 521–530. [Google Scholar] [CrossRef]
- Meunier, J.-L.; Mendoza-Gonzalez, N.-Y.; Pristavita, R.; Binny, D.; Berk, D. Two-Dimensional Geometry Control of Graphene Nanoflakes Produced by Thermal Plasma for Catalyst Applications. Plasma Chem. Plasma Process. 2014, 34, 505–521. [Google Scholar] [CrossRef]
- Zhong, R.; Hong, R. Continuous Preparation and Formation Mechanism of Few-Layer Graphene by Gliding Arc Plasma. Chem. Eng. J. 2020, 387, 124102. [Google Scholar] [CrossRef]
- Jain, V.; Kandasubramanian, B. Functionalized Graphene Materials for Hydrogen Storage. J. Mater. Sci. 2020, 55, 1–39. [Google Scholar] [CrossRef]
- Wang, C.; Song, M.; Chen, X.; Li, D.; Xia, W. Synthesis of Few-Layer Graphene Flakes by Magnetically Rotating Arc Plasma: Effects of Input Power and Feedstock Injection Position. Appl. Phys. A 2020, 126, 1–13. [Google Scholar] [CrossRef]
- Singh, M.; Sengupta, A.; Zeller, K.; Skoptsov, G.; Vander Wal, R.L. Effect of Hydrogen Concentration on Graphene Synthesis Using Microwave-Driven Plasma-Mediated Methane Cracking. Carbon 2019, 143, 802–813. [Google Scholar] [CrossRef]
- Szabó, D.V.; Schlabach, S. Microwave Plasma Synthesis of Materials—From Physics and Chemistry to Nanoparticles: A Materials Scientist’s Viewpoint. Inorganics 2014, 2, 468–507. [Google Scholar] [CrossRef] [Green Version]
- Vander Wal, R.; Sengupta, A.; Musselman, E.; Skoptsov, G. Microwave-Driven Plasma-Mediated Methane Cracking: Product Carbon Characterization. C—J. Carbon Res. 2018, 4, 61. [Google Scholar] [CrossRef] [Green Version]
- Harris, P.J. Transmission Electron Microscopy of Carbon: A Brief History. C—J. Carbon Res. 2018, 4, 4. [Google Scholar] [CrossRef] [Green Version]
- Kumal, R.R.; Liu, J.; Gharpure, A.; Vander Wal, R.L.; Kinsey, J.S.; Giannelli, B.; Stevens, J.; Leggett, C.; Howard, R.; Forde, M. Impact of Biofuel Blends on Black Carbon Emissions from A Gas Turbine Engine. Energy Fuels 2020, 34, 4958–4966. [Google Scholar] [CrossRef]
- Jurkiewicz, K.; Pawlyta, M.; Burian, A. Structure of Carbon Materials Explored by Local Transmission Electron Microscopy and Global Powder Diffraction Probes. C—J. Carbon Res. 2018, 4, 68. [Google Scholar] [CrossRef] [Green Version]
- Mallet-Ladeira, P.; Puech, P.; Toulouse, C.; Cazayous, M.; Ratel-Ramond, N.; Weisbecker, P.; Vignoles, G.L.; Monthioux, M. A Raman Study to Obtain Crystallite Size of Carbon Materials: A Better Alternative to The Tuinstra–Koenig Law. Carbon 2014, 80, 629–639. [Google Scholar] [CrossRef]
- Bokobza, L.; Bruneel, J.-L.; Couzi, M. Raman Spectra of Carbon-Based Materials (from Graphite to Carbon Black) and of Some Silicone Composites. C—J. Carbon Res. 2015, 1, 77–94. [Google Scholar] [CrossRef] [Green Version]
- Choi, W.; Lahiri, I.; Seelaboyina, R.; Kang, Y.S. Synthesis of Graphene and Its Applications: A Review. Crit. Rev. Solid State 2010, 35, 52–71. [Google Scholar] [CrossRef]
- Das, S.; Choi, W. Graphene Synthesis. Graphene Synth. Appl. 2011, 3, 27–63. [Google Scholar]
- Angjian, W.; Hang, C.; Zheng, J.; Jian, Y.; Xiaodong, L.; Changming, D.; Zhiliang, C.; Aoni, X.; Jie, Q.; Yi, X. Conversion of Coalbed Methane Surrogate into Hydrogen and Graphene Sheets Using Rotating Gliding Arc Plasma. Plasma Sci. Technol. 2019, 21, 115501. [Google Scholar]
- Vlassiouk, I.; Regmi, M.; Fulvio, P.; Dai, S.; Datskos, P.; Eres, G.; Smirnov, S. Role of Hydrogen in Chemical Vapor Deposition Growth of Large Single-Crystal Graphene. ACS Nano 2011, 5, 6069–6076. [Google Scholar] [CrossRef]
- Lin, L.; Deng, B.; Sun, J.; Peng, H.; Liu, Z. Bridging The Gap between Reality and Ideal in Chemical Vapor Deposition Growth of Graphene. Chem. Rev. 2018, 118, 9281–9343. [Google Scholar] [CrossRef]
- Xiao, S.; Zhu, X.; Li, B.-H.; Mortensen, N.A. Graphene-Plasmon Polaritons: From Fundamental Properties to Potential Applications. Front. Phys. 2016, 11, 117801. [Google Scholar] [CrossRef] [Green Version]
- Shen, B.; Ding, J.; Yan, X.; Feng, W.; Li, J.; Xue, Q. Influence of Different Buffer Gases on Synthesis of Few-Layered Graphene by Arc Discharge Method. Appl. Surf. Sci. 2012, 258, 4523–4531. [Google Scholar] [CrossRef]
- Li, B.; Song, X.; Zhang, P. Raman-Assessed Structural Evolution of As-Deposited Few-Layer Graphene by He/H2 Arc Discharge During Rapid-Cooling Thinning Treatment. Carbon 2014, 66, 426–435. [Google Scholar] [CrossRef]
- Zhang, D.; Ye, K.; Yao, Y.; Liang, F.; Qu, T.; Ma, W.; Yang, B.; Dai, Y.; Watanabe, T. Controllable Synthesis of Carbon Nanomaterials by Direct Current Arc Discharge from The Inner Wall of The Chamber. Carbon 2019, 142, 278–284. [Google Scholar] [CrossRef]
Figure 1.
TEM images of (a) nanographene (NG), (b) amorphous carbon black analogue (ACBA) and (c) graphitic carbon black analogue (GCBA) carbons.
Figure 1.
TEM images of (a) nanographene (NG), (b) amorphous carbon black analogue (ACBA) and (c) graphitic carbon black analogue (GCBA) carbons.

Figure 2.
High resolution images of plasma formed (a) nanographene and (b) GCBA carbon.

Figure 3.
(a) Derivative TGA plots for carbon produced at low (LR) and high (HR) ratio of methane to argon, and (b) comparison of LR produced carbon with standard samples.
Figure 3.
(a) Derivative TGA plots for carbon produced at low (LR) and high (HR) ratio of methane to argon, and (b) comparison of LR produced carbon with standard samples.

Figure 4.
(a) Raman spectra illustrating the control of 2D nanographene material revealed by the graphene signature peak at ~2700 cm−1. The overall graphitic content varies concurrently, as seen from the relative intensities of the D and G peaks. (b) X-ray diffraction (XRD) pattern of LR and HR produced carbons.

Figure 5.
TEM images of microwave plasma processed XC-72 at (a) low and (b) high magnification.

Publisher’s Note: MDPI stays neutral with regard to jurisdictional claims in published maps and institutional affiliations. |
© 2020 by the authors. Licensee MDPI, Basel, Switzerland. This article is an open access article distributed under the terms and conditions of the Creative Commons Attribution (CC BY) license (http://creativecommons.org/licenses/by/4.0/).
Share and Cite
MDPI and ACS Style
Kumal, R.R.; Gharpure, A.; Viswanathan, V.; Mantri, A.; Skoptsov, G.; Vander Wal, R. Microwave Plasma Formation of Nanographene and Graphitic Carbon Black. C 2020, 6, 70. https://0-doi-org.brum.beds.ac.uk/10.3390/c6040070
AMA Style
Kumal RR, Gharpure A, Viswanathan V, Mantri A, Skoptsov G, Vander Wal R. Microwave Plasma Formation of Nanographene and Graphitic Carbon Black. C. 2020; 6(4):70. https://0-doi-org.brum.beds.ac.uk/10.3390/c6040070
Chicago/Turabian StyleKumal, Raju R., Akshay Gharpure, Vignesh Viswanathan, Aayush Mantri, George Skoptsov, and Randy Vander Wal. 2020. "Microwave Plasma Formation of Nanographene and Graphitic Carbon Black" C 6, no. 4: 70. https://0-doi-org.brum.beds.ac.uk/10.3390/c6040070
Note that from the first issue of 2016, this journal uses article numbers instead of page numbers. See further details here.