Raman Spectroscopy of Twisted Bilayer Graphene


1
Núcleo Multidisciplinar de Pesquisas em Computação—NUMPEX-COMP, Campus Duque de Caxias, Universidade Federal do Rio de Janeiro, Duque de Caxias 25240-005, RJ, Brazil
2
Instituto de Física, Universidade Federal Fluminense, Niterói 24210-346, RJ, Brazil
3
Departamento de Física, Universidade Federal de Minas Gerais, Belo Horizonte 30123-970, MG, Brazil
*
Author to whom correspondence should be addressed.
C 2021, 7(1), 10; https://0-doi-org.brum.beds.ac.uk/10.3390/c7010010
Submission received: 28 December 2020
/
Revised: 20 January 2021
/
Accepted: 23 January 2021
/
Published: 26 January 2021
(This article belongs to the Special Issue 2D Ultrathin Carbon Films)
Abstract
:When two periodic two-dimensional structures are superposed, any mismatch rotation angle between the layers generates a Moiré pattern superlattice, whose size depends on the twisting angle . If the layers are composed by different materials, this effect is also dependent on the lattice parameters of each layer. Moiré superlattices are commonly observed in bilayer graphene, where the mismatch angle between layers can be produced by growing twisted bilayer graphene (TBG) samples by CVD or folding the monolayer back upon itself. In TBG, it was shown that the coupling between the Dirac cones of the two layers gives rise to van Hove singularities (vHs) in the density of electronic states, whose energies vary with . The understanding of the behavior of electrons and their interactions with phonons in atomically thin heterostructures is crucial for the engineering of novel 2D devices. Raman spectroscopy has been often used to characterize twisted bilayer graphene and graphene heterostructures. Here, we review the main important effects in the Raman spectra of TBG discussing firstly the appearance of new peaks in the spectra associated with phonons with wavevectors within the interior of the Brillouin zone of graphene corresponding to the reciprocal unit vectors of the Moiré superlattice, and that are folded to the center of the reduced Brillouin Zone (BZ) becoming Raman active. Another important effect is the giant enhancement of G band intensity of TBG that occurs only in a narrow range of laser excitation energies and for a given twisting angle. Results show that the vHs in the density of states is not only related to the folding of the commensurate BZ, but mainly associated with the Moiré pattern that does not necessarily have a translational symmetry. Finally, we show that there are two different resonance mechanisms that activate the appearance of the extra peaks: the intralayer and interlayer electron–phonon processes, involving electrons of the same layer or from different layers, respectively. Both effects are observed for twisted bilayer graphene, but Raman spectroscopy can also be used to probe the intralayer process in any kind of graphene-based heterostructure, like in the graphene/h-BN junctions.
1. Introduction
Raman spectroscopy is a powerful and extremely useful technique to characterize any kind of graphene related system, since it is possible to obtain information about disorder effects, including pontual defects and the atomic structure of the edges [1,2], the stacking order and the orientation between different layers, like the number of graphene layers stacked in a Bernal configutation [3,4], strain effects [5,6], charge transfer [7,8,9], and many other properties. Additionally, when the energy of the exciting laser can be tuned, it is also possible to obtain further information about the electronic structure and the dispersion of phonons near the Dirac point [10].
In monolayer graphene, only one optical mode is active in the first order Raman scattering, which gives rise to the so-called G band that appears around 1580 cm. Other Raman bands are also observed in monolayer graphene due to the double-resonance (DR) mechanism, which is used to interpret two distinct kinds of phenomena, the defect induced processes which involve just one phonon but with momentum conserved by a defect: like the defect induced D ( cm), D ( cm) and D ( cm) bands, as well as processes involving two phonons with opposite momenta, like the combination D + D band ( cm) and the overtone 2D band ( cm). The Raman peaks related to the DR mechanism have the remarkable property of being dispersive with the excitation energy. The position, intensity, and width of these bands can be well reproduced using the fourth order perturbation theory [11], where all possible phonons, obtained from fully ab initio calculations based on density-functional theory (DFT) corrected with GW, are considered and the electronic structure is treated within a tight-binding approach in which the parameters are fitted to reproduce DFT + GW calculations.
Since its discovery, graphene materials have attracted a lot of attention because of their potential use in technological applications, mostly in electronics [12]. In particular, when a graphene layer is deposited on top or, alternatively, covered by another periodic two-dimensional crystalline structure, which can be another single layer graphene (SLG), hexagonal boron nitride (h-BN), or any kind of transition-metal dichalcogenide (TMD) layer, like WSe or MoS, the static interlayer potential gives rise to Moiré patterns which correspond to a superstructure that depends on the twist angle due to misalignment between layers and/or the ratio between the lattice parameters of the two crystalline layers. In graphene, Moiré patterns can be directly observed by scanning tunneling and electron microscopy techniques, and the relationship between Moiré pattern arrangement and electronic properties has been extensively studied [13,14,15,16,17,18,19,20,21,22,23,24,25,26,27,28,29].
Recently, the appearance of strong correlated phases in twisted bilayer graphene (TBG) was reported by Cao et al. [30,31], caused by a flattening of the electronic bands in the vicinity of the Fermi energy that only occurs when the twist angle is close to 1.1, the so-called magic angle. In momentum space, the Dirac cones of each layer in TBG are rotated by the twist angle, which controls the intersect of the energy bands. When the energy scale of the intersection is comparable to the interlayer coupling energy, flat bands with energy width of only a few meV are induced by hybridization. In this regime, the electron–electron interactions can dominate the many body interactions and give rise to correlated phenomena like superconductivity.
In general, the Moiré pattern interlayer interaction depends strongly on the angle between adjacent layers, and the dependence of the electronic properties with the twist angle can be useful in applications such as ultra-sensitive strain sensors and ultra-thin capacitors [13]. In this way, systematic studies of misoriented graphene layers are quite interesting, and Raman spectroscopy plays an important role on its characterization, considering that several previous works in the literature show that the Moiré patterns can activate new Raman peaks in the spectra. The Raman mechanism involves both the electron and phonon properties that are essential for describing the physical properties and technological applications of the system.
The additional possibility of controlling the twisting angle in TBG opens a fascinating route to build novel tunable quantum devices. For example, the interaction between electrons of different layers (interlayer el-ph processes) generates van Hove singularities (vHs) in the density of electronic states, whose energies are dependent [15,16,17]. On the other hand, electron–phonon coupling is a fundamental interaction that affects a broad range of phenomena in condensed matter physics such as electron mobility and thermal conductivity, and in atomically thin heterostructures, the interaction can involve electrons in the same layer(intralayer el-ph interaction) or in adjacent layers (interlayer el-ph interaction). The interlayer el-ph interaction can be observed in different kinds of layers as in the WSe/h-BN heterostructures [32], while the intralayer process was also observed in the Raman spectra of gr/h-BN samples. It allows the experimental determination of the mismatch angle between the crystallographic axes of graphene and h-BN even when lattice parameters of these structures do not match. In this case, the el-ph process occurs in a graphene monolayer and the h-BN surface imposes a periodic potential needed for the momentum conservation in the resonant Raman process. This effect is expected to be sensitive to the strength of the interaction between monolayer graphene and any other single layer or crystalline surface.
In this article, we review the main important feature in the spectra and the ability of Raman spectroscopy to probe and distinguish the two kinds of interlayer and intralayer el-ph interactions in TBG and graphene heterostructures. First, we introduce the basic physics of Raman spectroscopy in graphene, and discuss the effects of a different scattering mechanism. Then, we will present some recent results from Raman spectroscopy in different samples of TBG and gr/h-BN, with a previously determined mismatch twisting angle , for different excitation photon energy. It will be shown that prominent new peaks are observed in the Raman spectra of TBG samples and that the origin of these peaks is related to phonons within the interior of the Brillouin zone (BZ) of graphene that are folded to the center of the reduced Moiré pattern BZ and the frequencies of these phonons depend on the twisting angle [14,19,20,21,33,34,35]. Finally, we will propose some directions where the Raman spectroscopy could be applied to better understand and appoint some open questions for both an experimental and theoretical point of view.
2. Background Theory
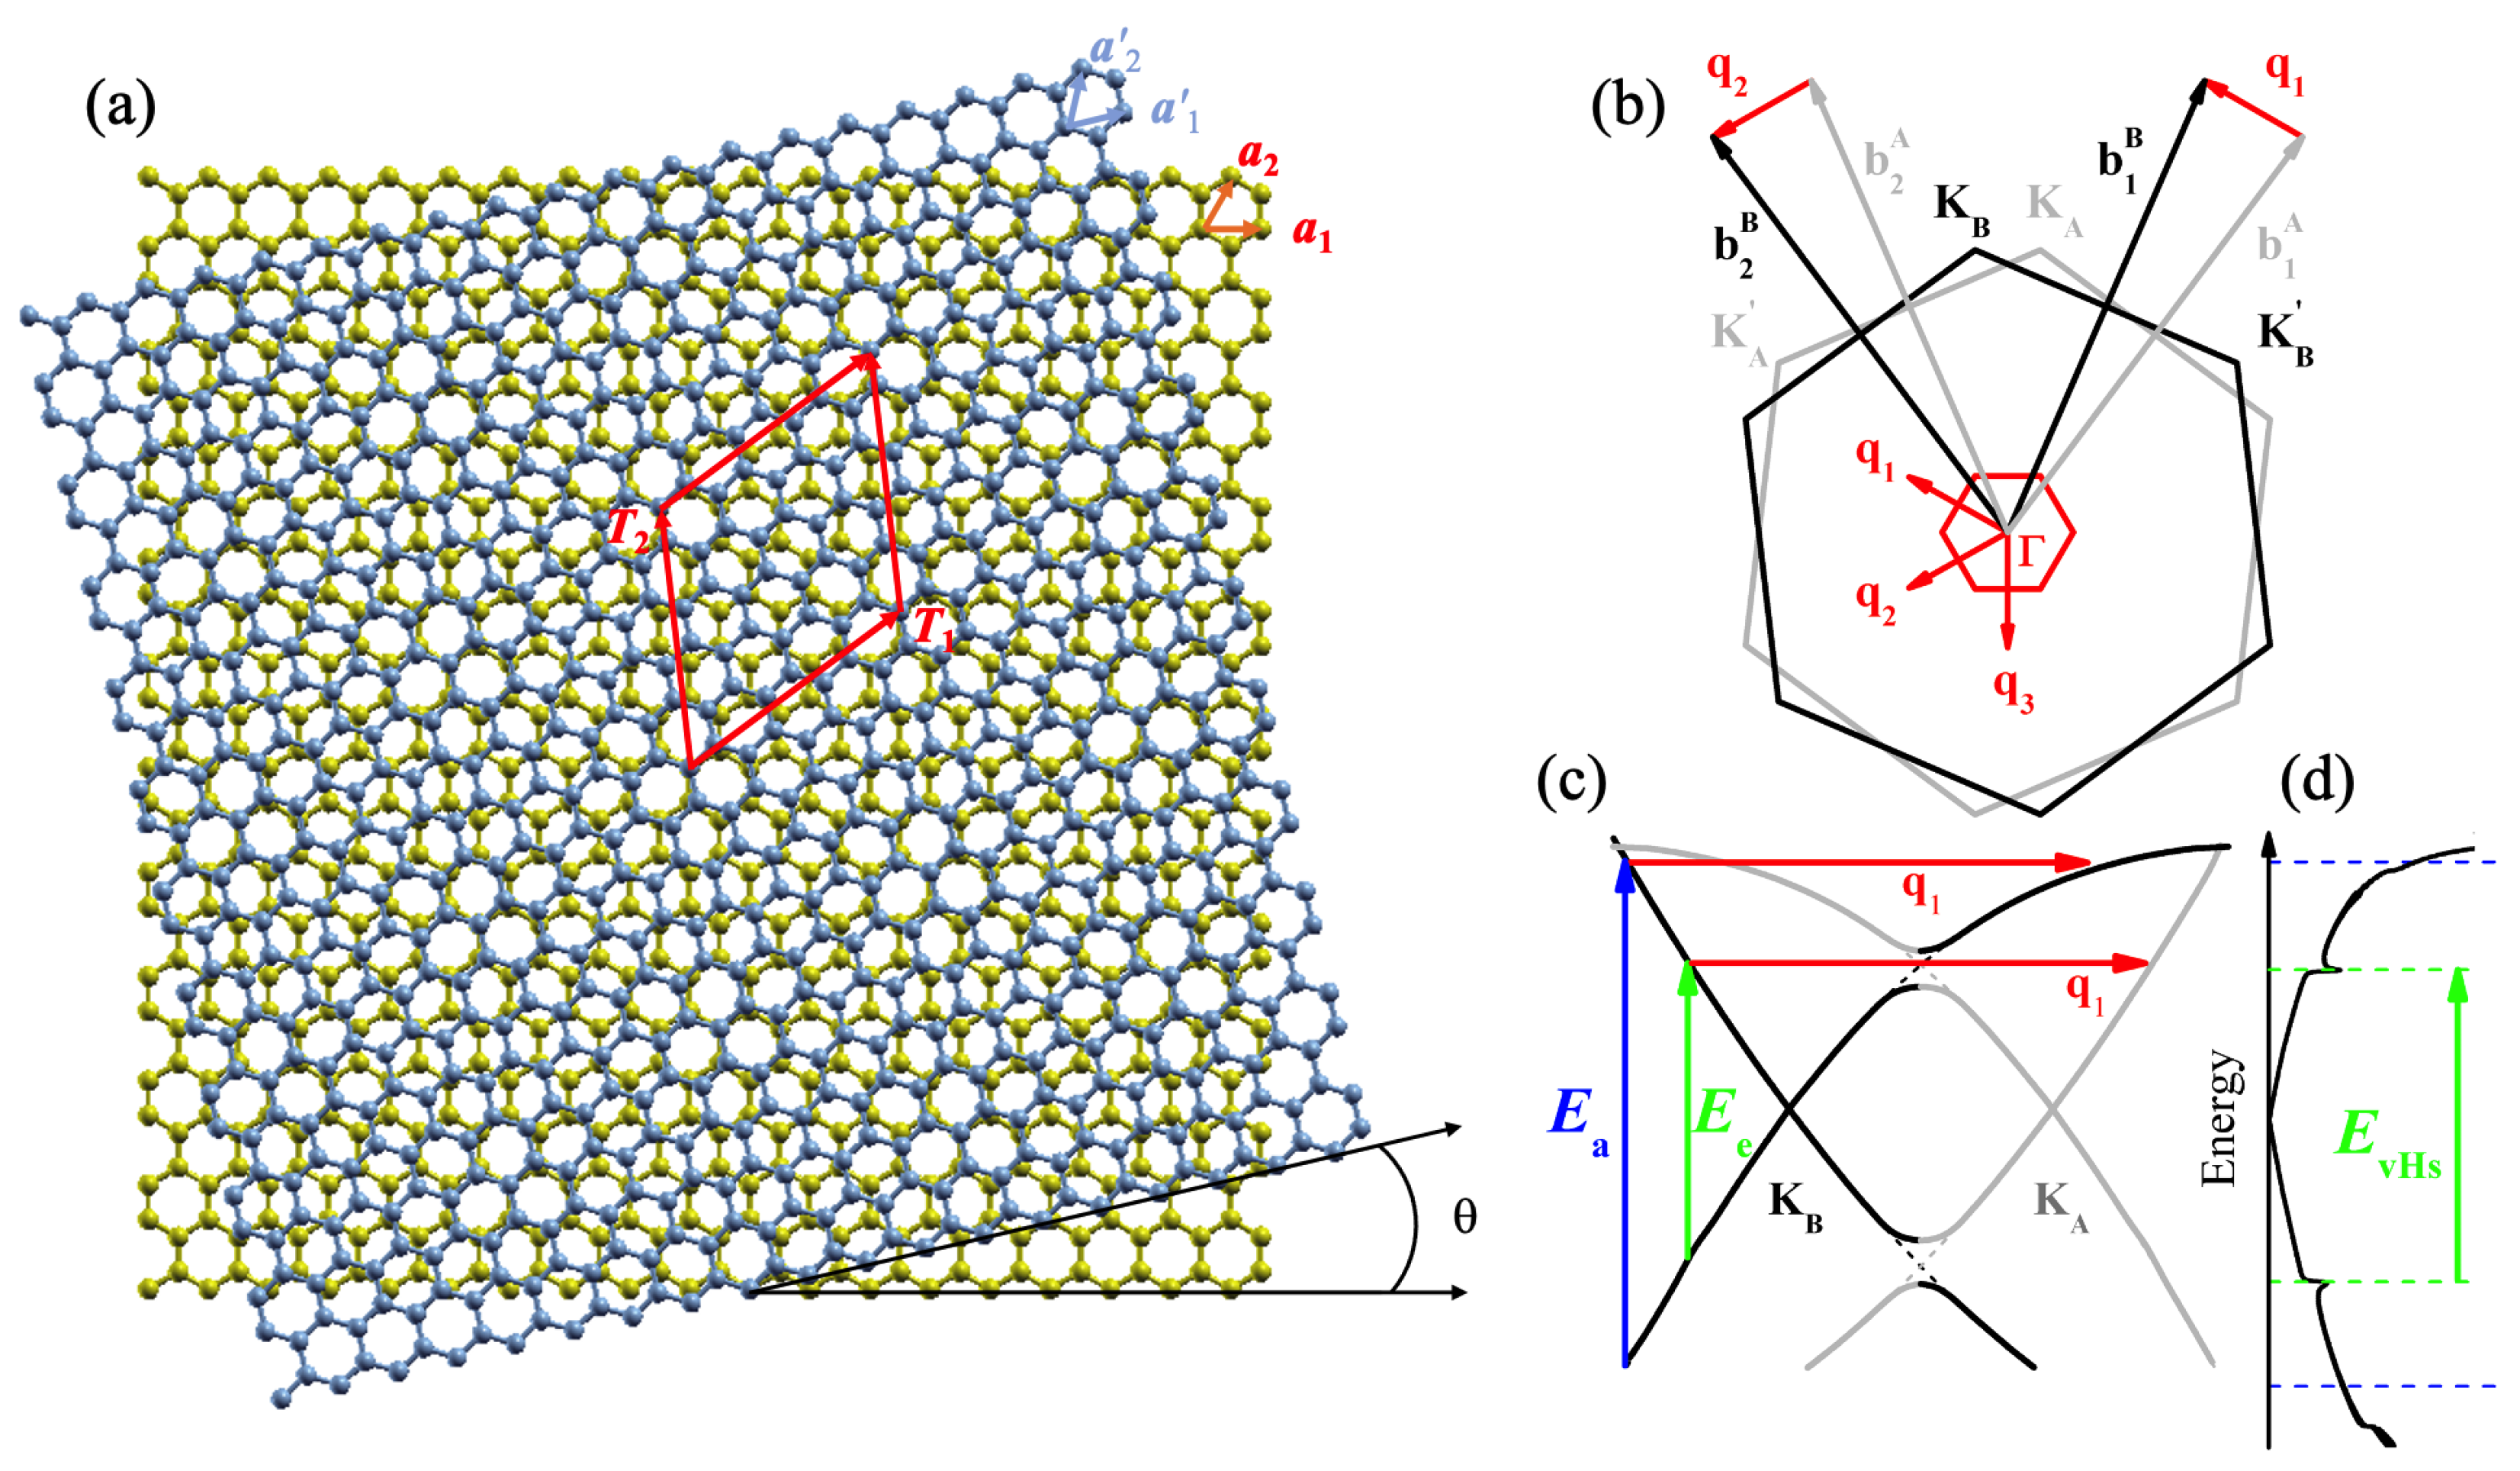
The periodic structure of a bilayer graphene twisted by a angle can be built introducing a twisting vector with respect to the first layer of a bilayer graphene lattice (golden layer in Figure 1a), where n and m are integers () without any integer common divisor greater than 1, while and are the lattice vectors for the first graphene layer, with Å being the lattice constant of graphene. Assuming, for simplicity, that the two layers have the same origin, for a commensurate unit cell, and n and m represent the minimal number of steps in each lattice direction until the top and bottom atoms meet again. It means that there is another vector (not shown in Figure 1a) given by a different pair of integers with respect to the lattice vectors and of the second layer, which are rotated by with respect to the first layer. Both vectors, and , must have the same size and, after some algebra [16], it can be shown that
The commensurate unit cell is then constructed by the superlattice vectors and , where the last vector is simply the former one rotated by and can be given, in terms of n and m, by . For all TBG structures, including commensurate or incommensurate structures, we can also observe a quasi-periodic pattern, known as Moiré pattern, whose size is less than or equal to the unit cell defined by , since the unit cell of the Moiré pattern is not strictly periodic but only quasi-periodic [18]. The size or lattice constant of the Moiré unit cell is given by [36]
Notice that the size of the Moiré unit cell depends only on the twisting angle . In fact, the size of the Moiré unit cell is smaller than the superlattice unit cell size, that is, . Therefore, = only for the family = 1. For example, the superlattice unit cell and Moiré unit cell for the TBG structure belongs to the family, and the size of the Moiré cell is one half of the superlattice size [23]. The number N of carbon atoms in the superlattice unit cell of TBG is given by
By the above expression, we get that , which means that commensurate structures can only be generated when the twisted angle provides an integer value of N. In this way, ( and ) corresponds to AB stacked bilayer graphene (Bernal) with four atoms in the unit cell and () represents the graphene AA stacked with twelve atoms in the cell, which is three times larger than in the conventional unit cell. In Figure 1a, we show an example of a commensurate unit cell with carbon atoms, twisting vector , and twisted angle .
In the momentum space, we can define two reciprocal lattice vectors and of TBG in terms of the graphene reciprocal vectors and . They are simply given by for where is a rotation matrix for an angle around the perpendicular axis of the TBG surface. Figure 1b shows the hexagonal Brillouin zones of two graphene layers A and B twisted by = 13.2 and represented, respectively, by the grey and black hexagons. The vectors , and correspond to the unit vectors of the Moiré reciprocal lattice. The reduced BZ of the Moiré superlattice is shown by the small red hexagon in the center of Figure 1b, and it can be understood by considering the rotated monolayers BZ, since, in TBG, they can be superimposed with a relative rotation. The line connecting the two original K points from each layer, and , forms one edge of the Moiré BZ, and the point folds back to the origin.
The electronic band structure of a single graphene layer near the Fermi level consists of a Dirac-cone-like structure at the Brillouin zone edge (K point). When two single layers of graphene are combined with no rotation between them (), the Dirac cones from the two layers are placed exactly on top of each other in reciprocal space. Therefore, when , the Dirac cones of the two graphene layers are now separated in reciprocal space by , but the two Dirac cones are still overlapping in a small region between the cones. The interaction between the Dirac cones of the two graphene layers is particularly strong in the overlap region, and it opens a hybridization small gap and leads to van Hove singularities (vHs) in the density of states (DOS) of the TBG which depends on the angle . It is important to mention that a relative displacement between graphene layers does not affect considerably the energy bands and the optical spectra for both commensurate or incommensurate supercells, except for = 0 [17]. In this way, it is entirely possible to study electronic phenomena as a function of , in the theoretical point of view, considering only rotations between two graphene BZ. Figure 1c shows the energy versus momentum diagram for TBG with = 13.2. The grey (black) curves represent the Dirac cone of layer A (layer B) from Figure 1b. Figure 1d shows the DOS of the 13.2 TBG, as well as the optical transition between vHs in the valence and conduction bands.
Since the positions of the singularities in the DOS of the TBG are dependent, one can use Raman spectroscopy to study selectively certain regions of their electronic spectra, controlling the energy of the incoming excitation photon. Raman spectroscopy is an experimental technique commonly used to characterize carbon-based materials, and it provides a wide amount of information about the electronic and vibrational properties. Without disorder, the two most prominent Raman bands in the spectra of graphene-based systems are the G and the 2D peaks. The mechanism behind of the G band is simpler than the 2D, since it involves creation of just one phonon at the Brillouin zone center per each scattered photon (momentum conservation requires that the created phonon must have zero momentum because the momenta of the incoming and the scattering photons are negligible). On the other hand, the 2D band involves emissions of two phonons with opposite momenta per each scattered photon. In TBG, the intensity of the Raman G peak is also dependent on the twisted angle with a huge intensity increase () when the incoming photon energy is comparable to the separation between the vHs, while Raman 2D peak intensity, position, and width present a much more complicated dependence [37].
The full theoretical description of the Raman bands will always involve a computation of the electron–phonon and the electron–photon matrix elements, which control the selection rules and the relative intensities between different bands. However, a lot of information can be extracted from a complex graphene-based system since the electron and phonon properties in the single layer graphene are well known.
3. Raman Signature in Twisted Graphene Layers
In 2010, Gupta et al. [33] reported the presence of a non dispersive new peak around 1380 cm in the Raman spectra of a graphene system with a monolayer folded back upon itself. They interpreted the result considering that the static interlayer perturbation between layers activates a finite wavevector that conserves momentum with a phonon through the double-resonant Raman (DRR) scattering. Several peaks were also reported later by Righi et al. [14], and the authors showed that these extra peaks are associated with phonon modes from the interior of the graphene BZ that are folded to the center of the reduced BZ and become Raman-active by the neighbor graphene layers twisted between each other. They also showed that each family of peaks, observed by many other authors, can be associated with Moiré patterns with specific rotational angles [14,19,20,21,33,34,35]. In a paper in 2011, Carozo et al. [34] attributed the new peaks in the vicinity of the G band position to the intervalley and intravalley DRR processes, and they estimated the resonance energies as a function of for these two processes. The valleys considered in this work belong to the same graphene layer and, therefore, both cases correspond to an intralayer electron–phonon scattering process.
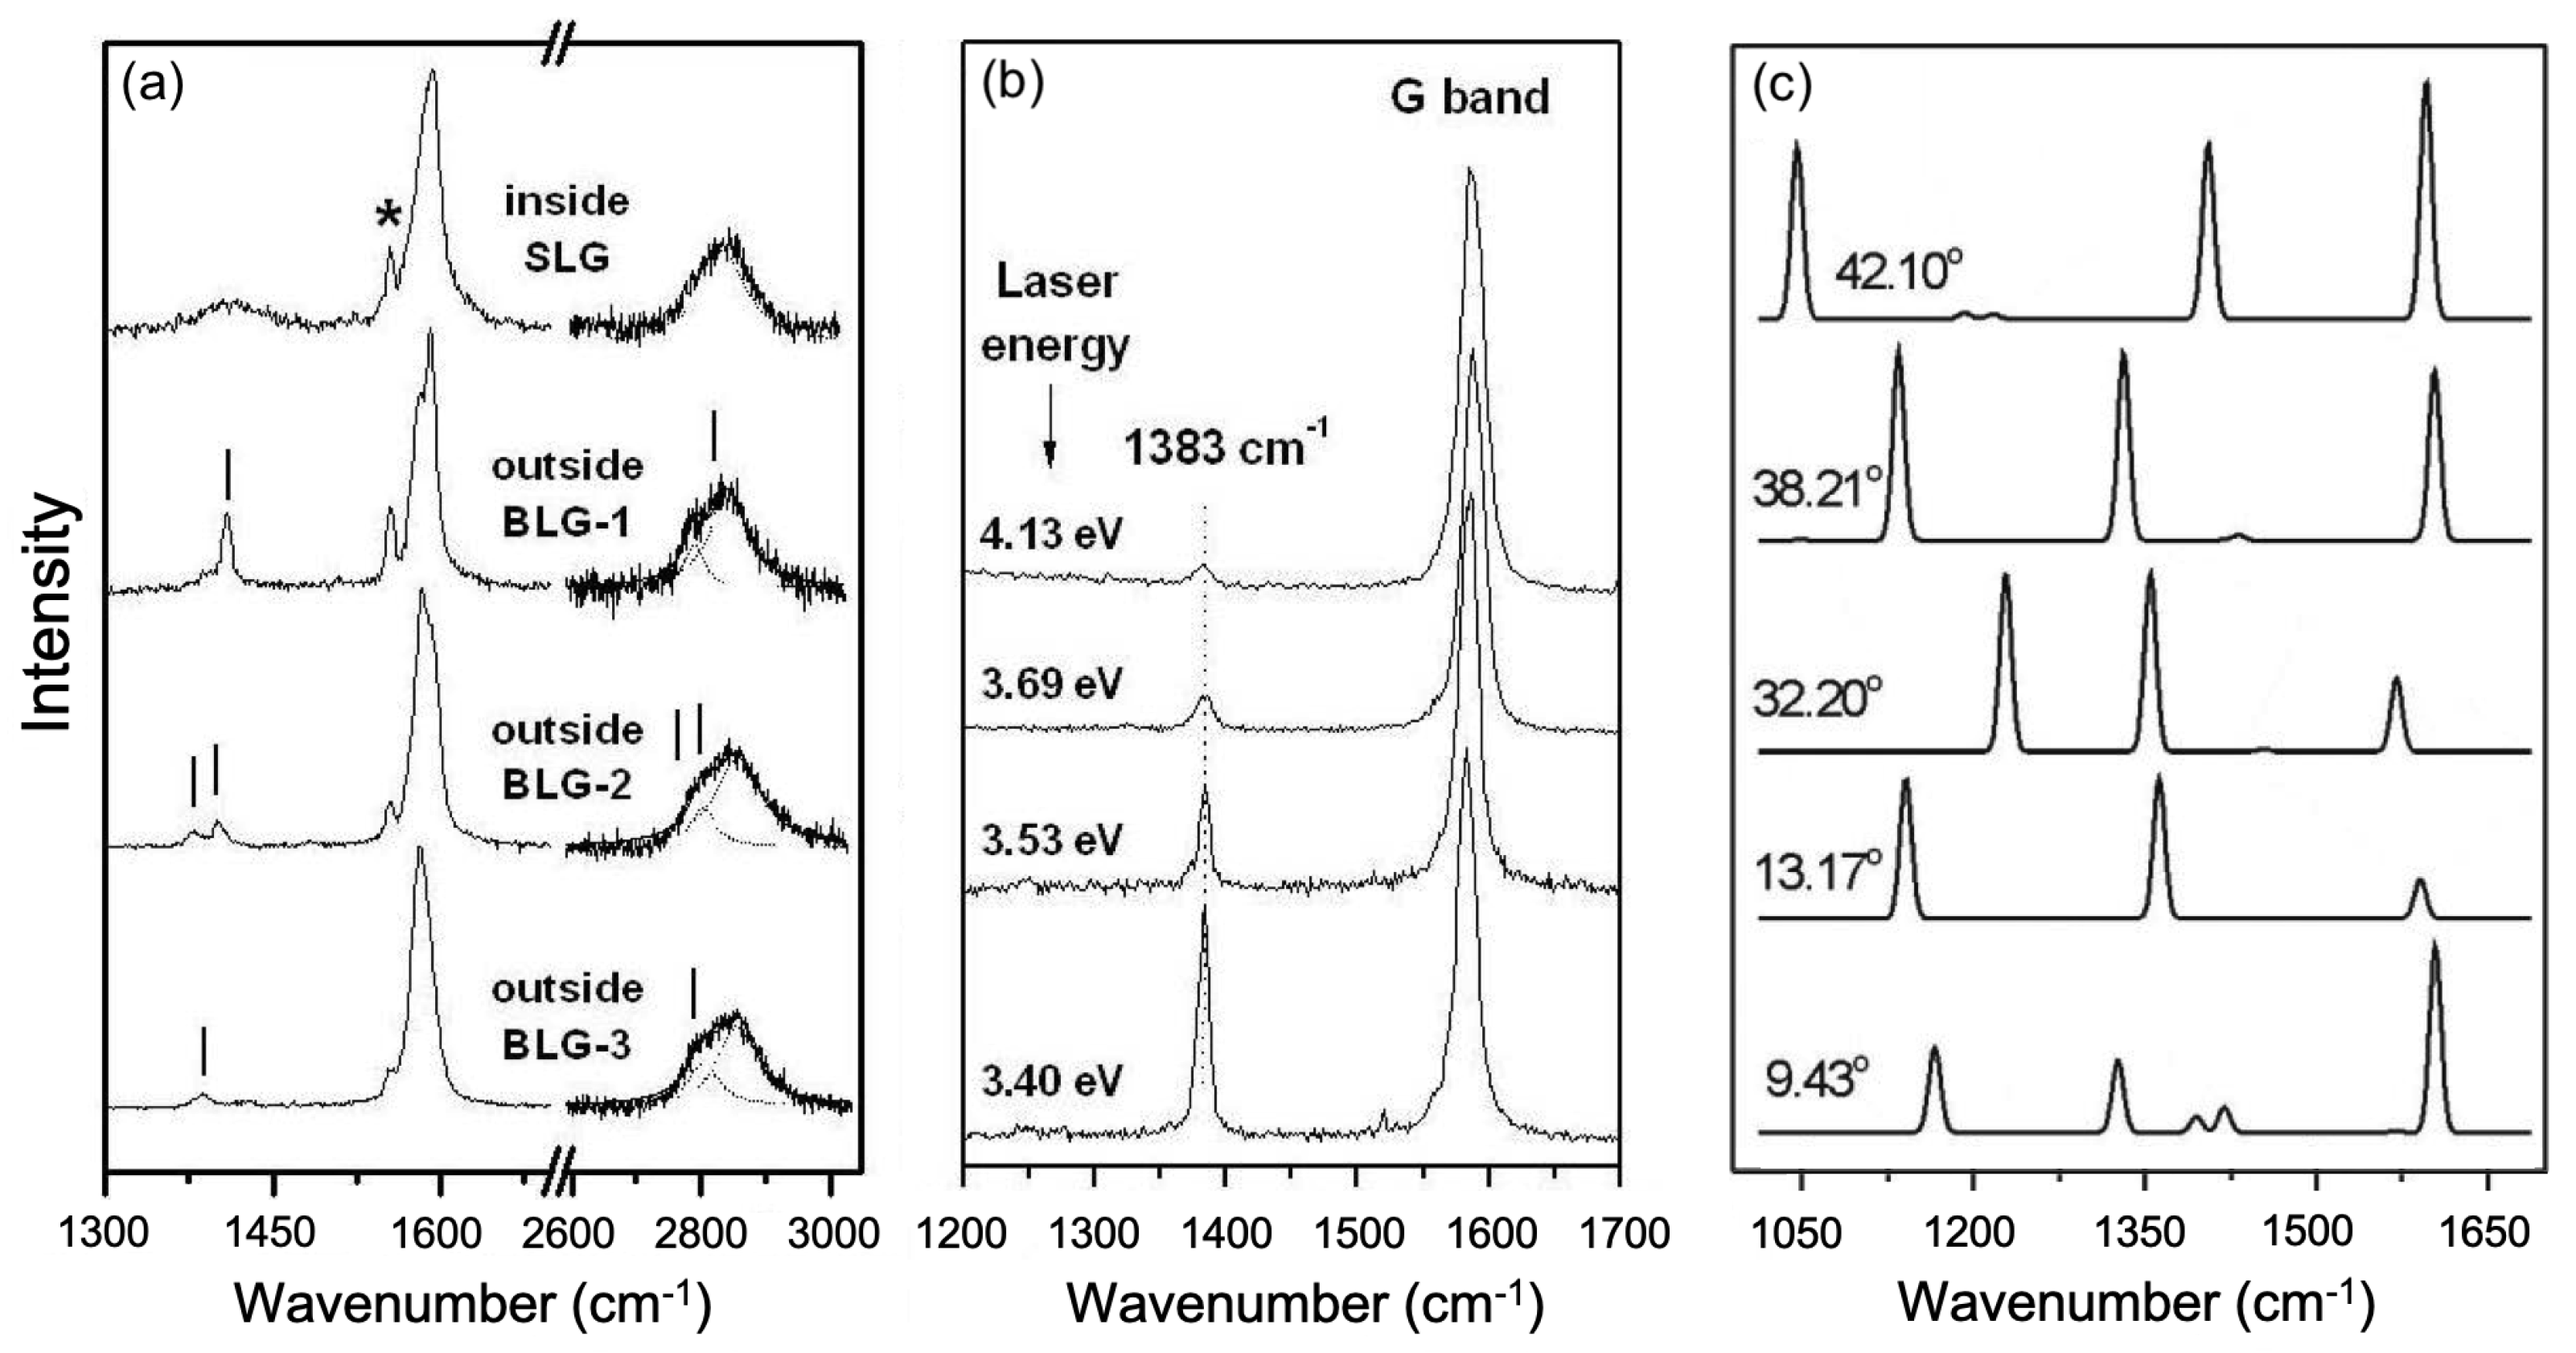
Figure 2a shows the Raman spectra obtained by Righi et al. [14] in four different regions of the sample, grown by chemical vapor deposition (CVD) on a copper-foil enclosure at a high temperature, inside and outside the Cu enclosure. The top spectrum of Figure 2a was recorded in a region inside the enclosure that contains domains of single layer graphene (SLG), and shows the D, G, and the 2D bands (the D band is dispersive and appears around 1420 cm using the 3.82 eV laser line) [1,10]. The three other spectra in Figure 2a were obtained in three different regions of the film grown on the outside of the Cu enclosure, with a high density of bilayer graphene (BLG) domains. Notice that, in addition to the G band, these three spectra also exhibit a number of sharp extra around 1400 cm (the absence of the D band can be ascribed to the high crystalline quality of the sample in these three regions).
The authors interpreted the origin of the new Raman peaks showed in Figure 2a as a consequence of a periodical perturbation originated from the twisted-double-layer Moiré pattern. The perturbation allows for elastic scattering from electron states to , described by matrix elements . This leads to a double resonance (DR) Raman scattering process, similar to those of the D and bands, where the electron is (i) optically excited, (ii) inelastically scattered by a phonon of wavevector , (iii) back-scattered by the elastic scattering process with wavevector , and (iv) radiatively de-excited. In the cases of the D and D bands, the local perturbation , which is due to defects, leads to non-null values of in a continuum range of [1]. In contrast, the periodic Moiré perturbation leads to allowed scattering (non-null ) only for a discrete set of , where is the magnitude of the reciprocal lattice unit vectors of the Moiré pattern. This process can therefore be described as an umklapp DR process for the Moiré lattice. From momentum conservation, we have , and therefore the only relevant phonon scattering events in such umklapp-Moiré double resonance process are those for phonons with wavevectors .
The similarity between the physical processes (elastic scattering, double resonance) involved in the D band and those of the umklapp-Moiré peaks suggests that they should occur at similar wavenumber ranges, for a given laser photon energy. Figure 2a shows the Raman spectra of monolayer graphene in a region of the sample with defects, where the broad D band can be observed centered around 1420 cm. Notice that the frequencies of sharp peaks of the umklapp-Moiré spectra overlap with the broader D band shown in the top of Figure 2a. The main difference is that umklapp-Moiré peaks are much narrower than the D band, and they are not dispersive, as can be seen in Figure 2b, where the Raman spectrum were taken in the same spot of the sample using different laser energies (3.40, 3.53, 3.69, and 4.13 eV). The frequency of the peak at 1383 cm does not depend on the laser energy, but its intensity changes, as expected for a U-DR process. In this type of process, each phonon with allowed wavevector will achieve resonance at a specific laser energy, and, for the analyzed sample, the resonance condition for the peak at 1383 cm has not yet been achieved at 3.40 eV, and it should occur at lower laser energies.
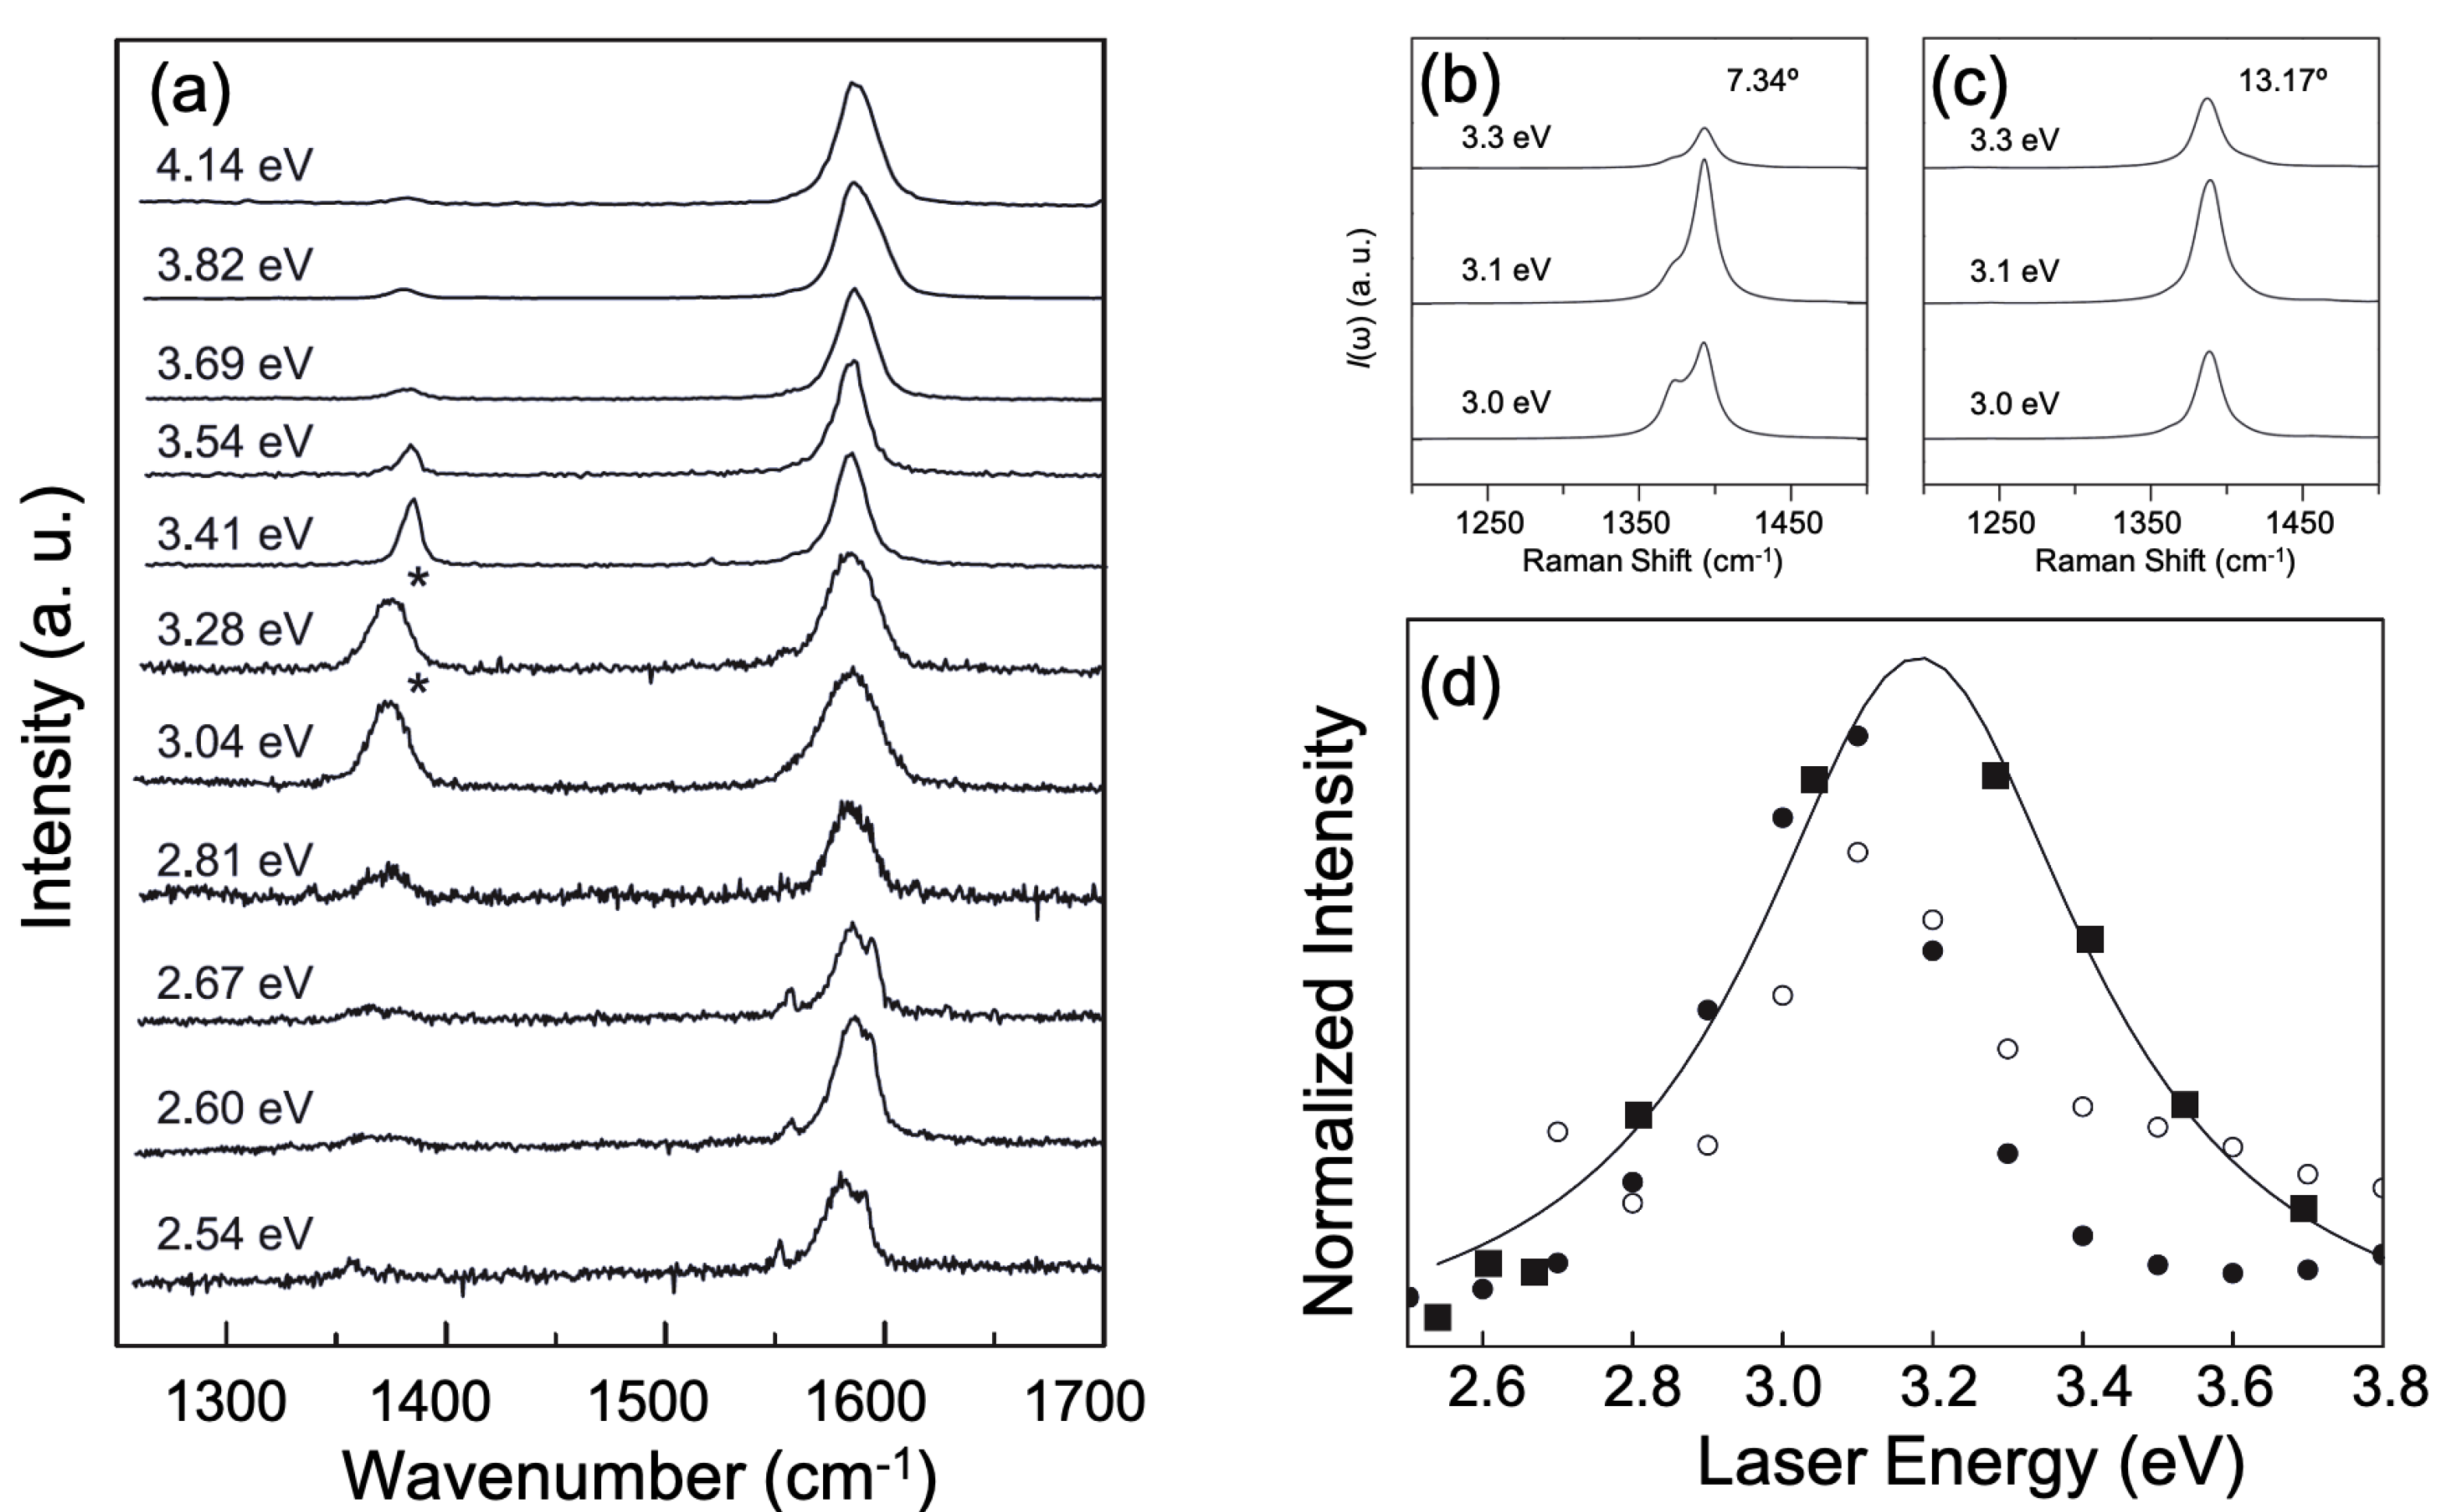
In order to check the laser energy dependence of the extra peaks, Righi et al. [19] measured the same region of the TBG using different laser lines in the range of 2.54–4.14 eV. Figure 3a shows the Raman spectra in the 1200–1700 cm range, obtained with many different laser lines, where one can observe the peak around 1380 cm associated with the TBG. Notice, in Figure 3a, that the position of the extra peak does not depend significantly on the laser energy , whereas its intensity is strongly dependent on , with the maximum intensity occurring around 3.04 eV. The authors interpreted the resonance behavior of the extra peaks in the framework of the double resonance process involving the wavevectors of the Moiré superlattice for the momentum conservation, as described before. They simulated the umklapp double-resonance (U-DR) Raman spectrum , for two different twisting angles (7.34 and 13.17), and for different incident laser energies, following the methodology described in Ref. [14], but assuming that the TBG is a monolayer of graphene interacting with a network of defects corresponding to the Moiré lattice vectors.
Figure 3d shows the Raman excitation profile (REP) of the intensity of the extra peak around 1380 cm, normalized by the intensity of the G-band. The black squares correspond to the experimental results presented in Figure 3a and the open and black circles correspond to the simulated spectra for the two different twisting angles shown, respectively, in Figure 3b,c for three different laser energies close to the resonance. As one can see, there is a nice qualitative agreement between experimental and simulated results, showing that the extras peaks are indeed due to U-DR processes.
It was shown that there is a simple physical interpretation that explains both the origin and the position of the laser energy resonance, as well as the width of the REP, which is very large in comparison with the small widths of the Raman peaks. From momentum conservation, the only relevant phonon scattering events in such U-DR process are those for phonons with wavevector with the same magnitude as the Moiré reciproal lattice . As a consequence, instead of a wide and dispersive Raman resonance as observed for the D band, the umklapp Moiré resonances is characterized by several sharp, non-dispersive resonances peaks found in the same spectral region as that of the D and D bands.
Assuming that the periodic perturbative potential of the Moiré lattice can be approximated by a periodic array of localized perturbations that leads to the D band, the umklapp Moiré resonances become, essentially, a “filtered” D band. That is, each resonance is placed at the energy of a phonon with wavevectors , with its intensity given by the intensity of the D band at that same energy. Therefore, within this approximation, the analysis of the laser energy dependence of the intensity of a given Moiré resonance peak at phonon frequency , given by , can be mapped into the laser energy dependence of the intensity of the D band at the same frequency . It was also proposed in Ref. [19] that the peak width in the REP of the for a given is proportional to the width of the D band, which is consistent with the experimental results.
The spectra computed for several possible twist angles between graphene layers using the model described in Refs. [14,19] are shown in Figure 2c. For all angles, the simulated Raman peaks group at three distinct wavenumber regions. The first and second groups, respectively in the ranges 1050–1250 cm and 1325–1450 cm, show stronger dispersions with respect to twist angles, and come from the longitudinal acoustic (LA) and in-plane transversal optical (TO) branches, respectively. The third group, near 1600 cm and associated with the in-plane longitudinal optical (LO) phonon branch, is almost dispersionless with respect to twist angle.
This theoretical model presents qualitative agreement between the simulated and observed spectra. However, the intensity of the simulated Raman bands is not well reproduced since the selection rules and the matrix elements are not taken into account for the calculation of these bands [14]. This issue can be partially overcome assuming that the intensity of the extra peak can be mapped into the laser energy dependence of the D band intensity at the same frequency [19]. Anyway, the qualitative agreement between the observed and simulated spectra provides a support for the interpretation that the families of Raman peaks are associated with Moiré patterns of graphene layers twisted with different angles. In a sample of two graphene layers presenting domains misoriented between each other, the maps of the Moiré peaks can give a direct image of these domains.
4. Giant G Band Enhancement by Resonances with the Moiré Pattern Singularities
In order to understand the origin of the van Hove singularities (vHs) associated with both the commensurate superlattice unit cell or with the smaller quasi-periodic Moiré unit cell , Ribeiro et al., in a paper in 2015 [23], performed Raman mapping experiments in more than 100 TBG samples with many different twisting angles between 0 and 30, measured by direct inspection of the optical microscope images.
Figure 4a shows the plot of / for all measured samples in [23] as a function of the twisting angle , obtained with the three different laser energies. A giant enhancement of the TBG G-band is observed for samples with intermediate twisting angles ranging from to , where the intensity is more than 90 times the intensity of the single layer G band, as previously reported by Ni et al. [24] and Havener et al. [25]. For small ( 9) and large () twisting angles, the ratio / was observed to be always smaller than two, as shown in the insets of Figure 4a.
The G-band full-width at half maximum (FWHM) of all TBG samples studied in Ref. [23] is depicted in Figure 4b that shows the angular dependence of the ratio between the FWHMs of the TBG and SLG regions, for all investigated samples. This ratio is close to one for > 7, but it increases with decreasing twisting angle in the low angle range. Insets in Figure 4b show the fitting of the TBG G-band for one sample with a large twisting angle () and another with a small twisting angle (). It can be seen that the G band is well fitted by just one Lorentzian for large twisting angle, whereas, for low , the G band is asymmetric and can be fitted by two Lorentzian curves. The broadening of the G band for samples with very low twisting angles can be ascribed to the fact that, in this very low regime of twisting angles, there is an arrangement of the atoms on the two layer that gives rise to domains of AB and AA stacking, separated by incommensurate regions, and the interlayer interactions for different stacking should give different phonon frequencies, increasing the total spectral width. Since the phonon mode can see only an averaged potential over the unit cell, especially for longer wavelength phonons, the difference of AA and AB stacking order would be smeared out for a small unit cell (or Moiré cell).
5. Intralayer and Interlayer Electron–Phonon Processes
In 2013, Carozo et al. [35] and Wang et al. [21] reported measurements of TBG samples with intermediate twisting angles (13–16) using different laser lines. In both works, the appearance of new peaks in the range 1380–1450 cm was observed to occur in the same spectra where the G band was enhanced. This resonance behavior could not be explained by the predictions of the process involving the periodic potential of the Moiré cell [34], and revealed that a different electron–phonon process involving phonons with momentum might exist. In 2018, Eliel et al. [38] have shown that the new phonons observed in the previous works by Carozo et al. [35] and Wang et al. [21] are activated by the interlayer electron–phonon scattering processes.
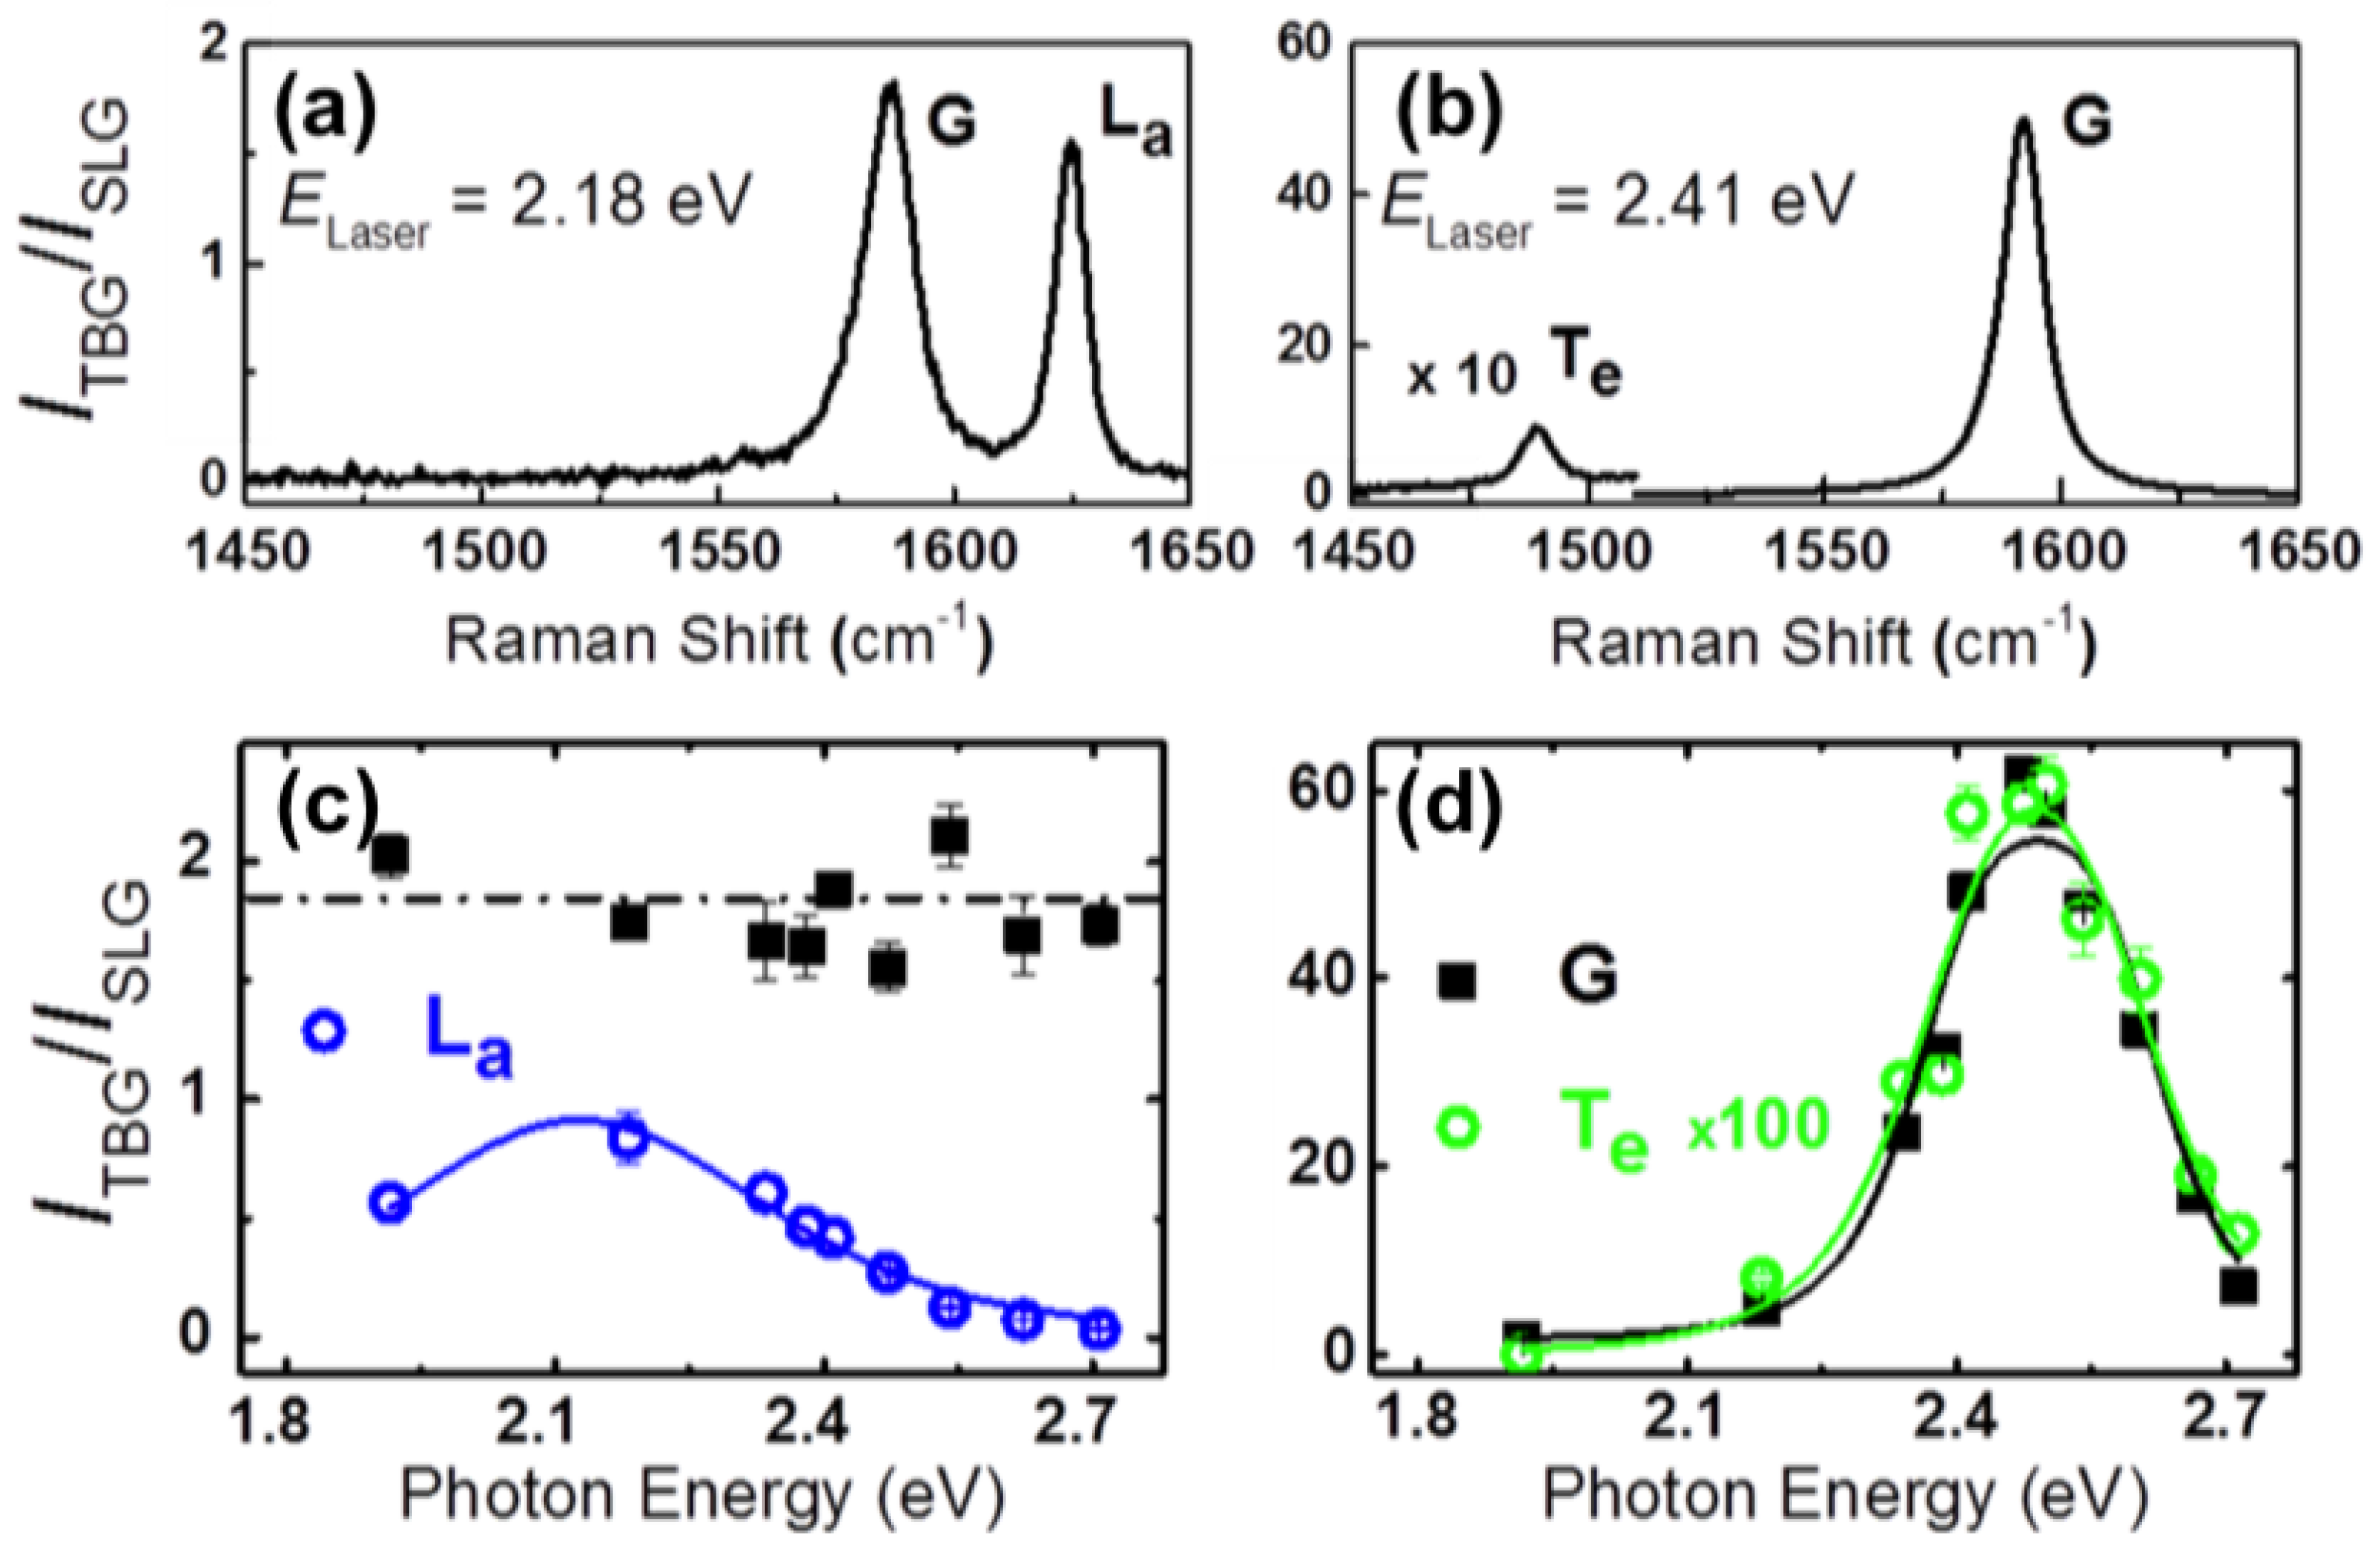
The extra peaks below and above the G band position used to be called in the literature as the R and R peaks [34,35]. However, since they can be activated either by the intralayer or the interlayer electron–phonon scattering process, a physical meaningful notation was proposed by Eliel et al. [38]. They proposed to call these peaks as A, where A = T or L refers to the branch (TO or LO) of the unfolded phonon and refers to the electron–phonon scattering mechanism ( = a or e for intralayer and interlayer processes, respectively). Figure 5a,b show clearly that the extra peaks apart from the G band might be called L and T, respectively. These figures show the Raman spectra for two TBG samples with = 6 and 13, recorded with the 2.18 eV and 2.41 eV laser lines, respectively. The vertical scale, , corresponds to the ratio of the peak intensities in TBG and single-layer graphene (SLG). The ratio = 1.8 for the G band intensity (around 1580 cm) of the = 6 sample shown in Figure 5a corresponds to the observed value far from resonances [23]. However, for the = 13 sample shown in Figure 5b, the G band ratio is more than 50. This huge increase of the G band intensity has already been observed in previous Raman studies of TBGs [23,24,25,37] and explained by the resonance of the incident photons with the optical transition between van Hove singularities (vHs) in a density of electronics states of a TBG.
Multiple-excitation Raman measurements using many different laser lines in the visible range were reported in Ref. [38], and the results were used to obtain an accurate Raman excitation profile (REP) of Raman peaks in samples with small and intermediate twisting angles. It was observed that the G band ratio of the = 6 sample does not depend on the photon energy and is always around 1.8, an expected value far from resonance conditions [23]. On the other hand, the L peak exhibits a resonance behavior and reaches the maximum intensity for photon energies around 2.2 eV, where it becomes as intense as the G band in SLG. However, for the = 13 sample, both the G band and the T peak exhibit a resonance behavior and are enhanced in the same excitation energy range.
Figure 5c,d show the the intensity of each peak as a function of the photon energy of the G, L and T peaks, that is, the Raman excitation profile (REP), for the = 6 and = 13 samples, respectively. Figure 5c shows that the REP of the L peak exhibits maximum enhancement at approximately 2.2 eV and has a width around 0.7 eV. This value of width agrees with the result in a previous UV Raman study of TBGs [19]. In the case of the = 13 sample shown in Figure 5d, the G band and the T peak exhibit very similar REPs, except for the fact that the intensity of the extra peak was multiplied by ≈ 100 for comparison. The data in Figure 5d were fitted by the expression of the Raman-cross section based on the third-order perturbation model [35], where the fitting parameters are the energies of the optical transitions between vHs, , and the width of the REP. The values of the parameters that fit the experimental data in Figure 5d are = 2.37 eV and = 0.25 eV. Notice that this value of agrees with the width of the peaks in the optical absorption spectra of TBGs [26]. Several other samples with low (4–6) and intermediate (12–16) twisting angles were also investigated by the authors using multiple excitation Raman measurements. The dependence on the values of and for the G band on the twisting angle is shown in Ref. [27].
6. Electronic Transitions in TBG
The difference between the intralayer and interlayer processes can be understood by a theoretical simulation, where, in the first case, the excited electronic state from one layer is scattered by phonon with momentum to another excited state in the same layer (intralayer process), whereas, in the other case, the excited electron is scattered to an excited state of the other layer (interlayer process). These mechanisms give rise to resonances at different energies.
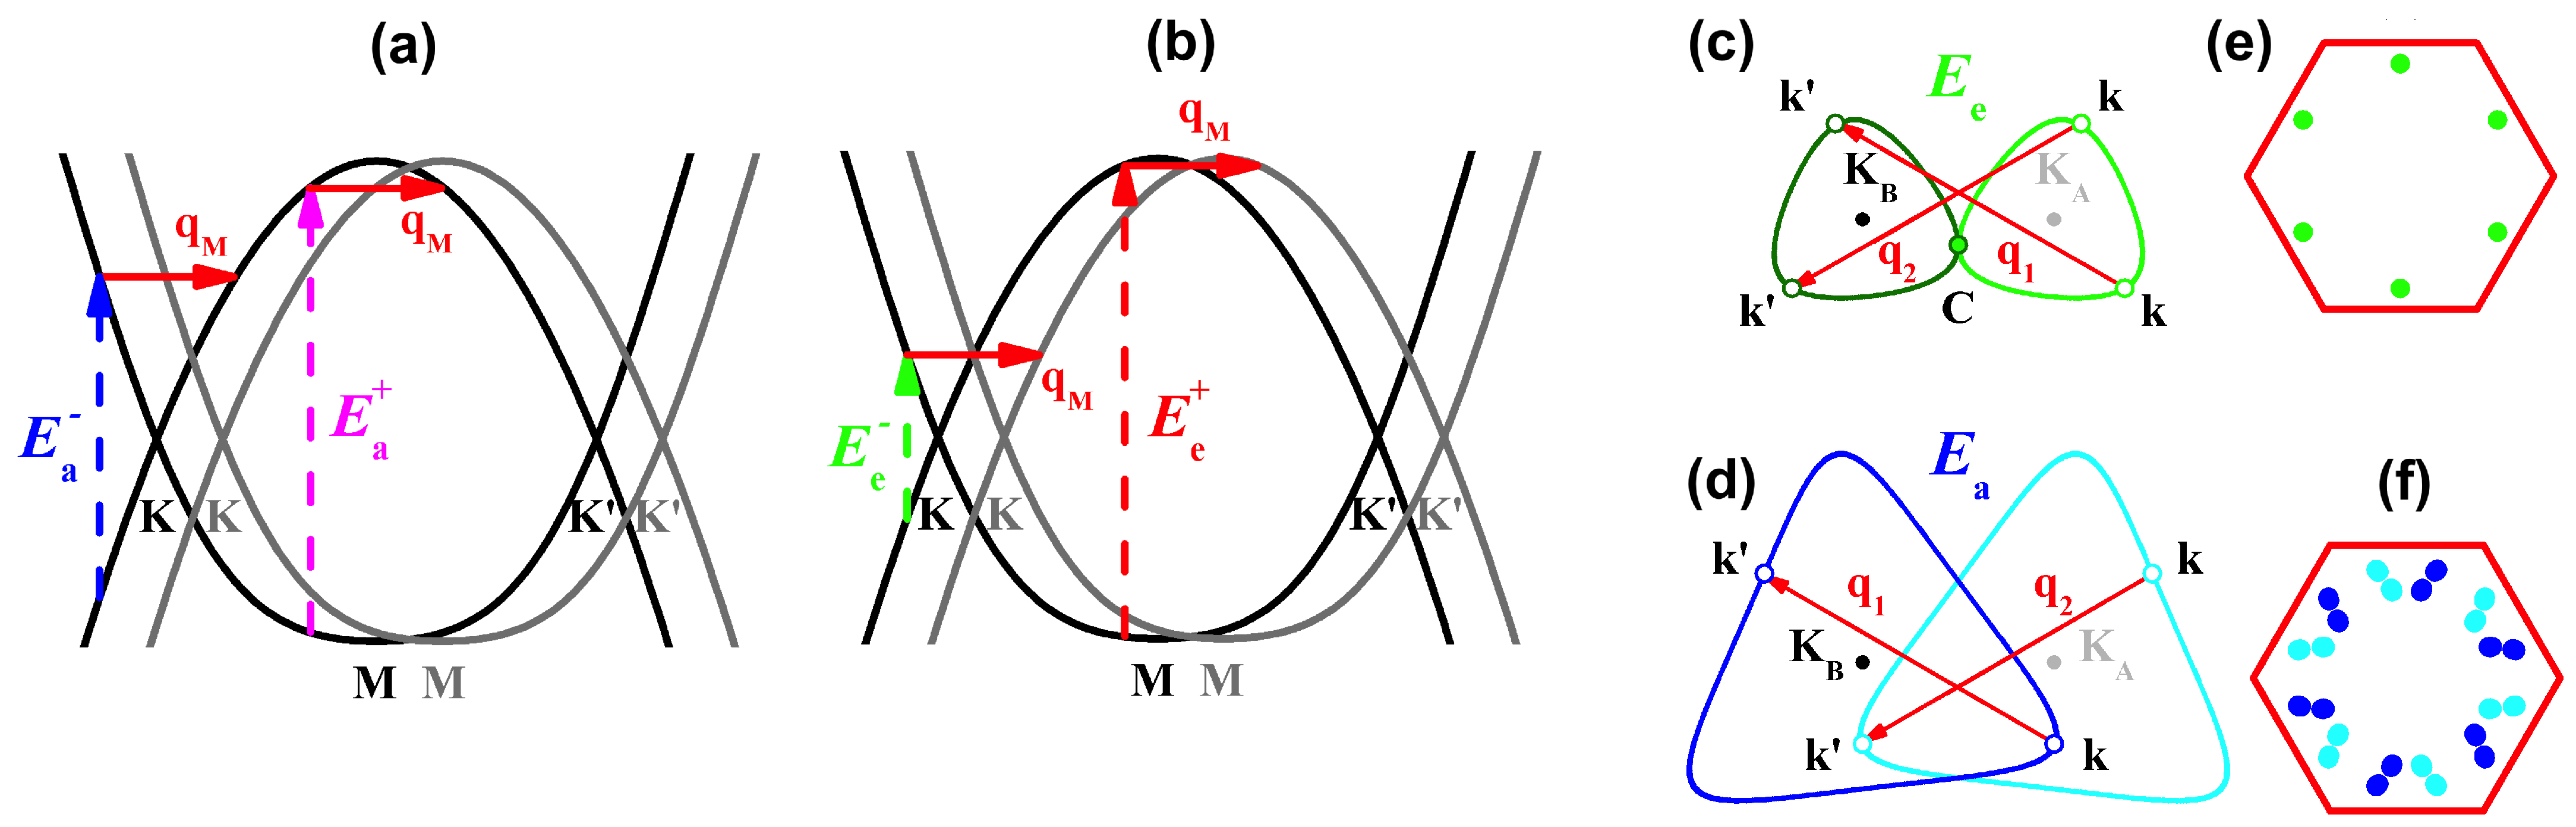
The intralayer and interlayer processes in TBG are represented by the energy dispersion curves shown in Figure 6a,b for = 13.2. In the intralayer process in Figure 6a, an incident photon with energy (represented by the vertical dashed arrows) creates an electron–hole pair, and a phonon with momentum (represented by the horizontal red arrow) scatters the excited electron near the K point to another state in the same K point Dirac cone (−) or to the other Dirac cone (+). The symbols − and + thus design the intravalley and intervalley processes, respectively. For simplicity, it was not plotted in these figures the change in energy between the two states since the phonon energy is much smaller than the energy of visible photons. In the interlayer process represented in Figure 6b, an incident photon with energy creates one electron–hole pair, but now the electron from one layer is scattered to a state of the other layer by a phonon with momentum . In both cases, the electron is then scattered back elastically to the first excited state by the Moiré potential with wave vector , for electron–hole recombination and emission of the scattered photon. Notice that, for both processes, in the limit of small and large twisting angles, the low energy transitions involve states near the K point of graphene (intravalley process), whereas the high energy transitions involve states near the M point (intervalley process).
Figure 6c illustrates the interlayer process in the graphene reciprocal space. The dark and light green curves correspond to the equi-energy curves around the Dirac points K and K, respectively. An excited electron with momentum ℏk from the Dirac cone of one layer (dark green curve) is scattered by a phonon with momentum (red arrows) to a state with momentum in the Dirac cone of the other layer (light green curve). The lowest possible value of occurs when the equi-energies curves of the two layers tangentiate, as shown in Figure 6c. In this situation, the anti-crossing between states of the Dirac cones gives rise to van Hove singularities (vHs) in the density of states (DOS), shown in Figure 1d. For photons with energies below , the difference is always smaller than and the interlayer condition cannot be satisfied. Therefore, the minimum energy for the interlayer scattering process, , corresponds to the energy separation between the vHs in the valence and conduction bands of a TBG.
The intralayer el-ph scattering process is schematically represented in Figure 6d. Now, the light and dark blue curves around K and K, from different layers, respectively, correspond to the curves of constant energy . In this case, the excited states with momenta and belong to the Dirac cones of the same layer (dark or light blue curves). The intralayer process is similar to the double-resonance Raman mechanism that gives rise to the disorder-induced D and D bands in the Raman spectrum of graphene [1]. For the disorder-induced bands, the electron is scattered back to the initial excited state by a defect, whereas, in the case of TBG, the back-scattering is provided by a periodic potential of the Moiré pattern. This double resonance (DR) Raman process, where momentum conservation is provided by a vector of the Moiré lattice, has been called the U-DR process [14] previously.
The discussion of the two processes above were made in the extended BZ scheme, where the activated phonons have finite . In the reduced BZ scheme, they are folded to the center of the reduced BZ and have zero momenta. The first-order Raman process can be accomplished in this scheme since the two excited states k and in the extended BZ in Figure 6c are folded to the same point in the reduced BZ, which are represented by the green dots in Figure 6e. They are located at the saddle point in the electronic structure of TBG, near the M point in the reduced BZ that gives rise to a van Hove singularity (vHs). The intralayer process can be also represented in the reduced BZ scheme. Figure 6f shows that the two excited states k and in the extended BZ in Figure 6d are folded to the blue dots within the reduced BZ. Differently from the case of the interlayer process that occurs near the M point of the reduced BZ, the intralayer process occur for states at general positions within the interior of the reduced BZ.
The resonance energies and can be calculated by the restricted density of joint electronic states that satisfy the intralayer and interlayer conditions. For the calculation, the graphene BZ was divided in a k-points grid and, for each twisted angle , the number of joint electronic states that satisfy the restriction is stored, where the superscript symbolizes the valence or the conduction bands and eV is an arbitrary tolerance. The electronic structures were obtained by folding the SLG calculation based on a fifth neighbors tight-binding approach, following the procedure given in Ref. [11], in which the parameters are fitted to reproduce density functional theory (DFT) calculations with many-body corrections. For the intralayer case, we have that because the two electronic states, and , are connected by while, for the interlayer process, , being the rotation matrix that takes the Dirac cone of one layer into the Dirac cone of the other layer. Considering these two conditions in the model, momentum conservation is always achieved by a given pair of states and , as long as the density of k-points considered in the calculation is large enough that the energy difference between the states becomes less than the value of , as shown in Figure 6c,d, where the small circles in the equi-energy edges represent the tolerance.
Figure 7a,b show the calculated joint density of states (JDOS) that satisfy the intralayer and interlayer resonance conditions, respectively. The results were smoothed by Lorentzian functions with eV of FWHM and normalized by the maximum intensity for best visualization of the peaks. In both cases, some peaks are observed in the restricted JDOS, and their energies depend on the twisting angle . The position of the low energy peaks increases, whereas the position of the high energy peaks decreases with increasing values of . These two maximums are associated with electronic transitions close to K and M points of the graphene, and will be called and . For the intralayer process, the positions of and are indicated by the blue and purple arrows in Figure 7a, respectively, and the positions of and for the interlayer process are marked in Figure 7b by the green and red arrows. Notice in Figure 7b that corresponds in fact to the onset for the interlayer process, which occurs when the Dirac cones touch each other as shown in Figure 6c, giving rise to vHs in the valence and conduction bands with energy separation . The values of and correspond in fact to the energies of the optical absorption peaks observed in TBG [26].
Figure 7c shows the calculated values of , , and as a function of the twisting angle represented by the dashed blue, green, pink, and red curves, respectively. The experimental values of the resonance energies obtained from the analysis of the REPs of the extra Raman peaks are also plotted in Figure 7c. The blue open circles in Figure 7c represent the resonance energies of the peaks in the range 1600–1620 cm that are observed in samples with small angles (4 to 6). They nicely agree with the calculated versus results represented by the dashed blue curve. The values of the resonance energies obtained from the REPs of the extra peaks in the range 1450–1550 cm for samples with intermediate twisting angles (12–16) are plotted as full and open black circles in Figure 7c. These points are close to the dashed green curve that represents as a function of . The black symbols × in Figure 7c represent the experimental values of optical transition energies measured directly by optical conductivity [26]. It is interesting to note that, despite the fact that the model does not consider electronic coupling between the layers that opens a mini-gap which split the valence and the conduction bands in TBG, the agreement between the minimum possible value shown in Figure 7b and the experimental values of the optical transitions [26] is remarkable. It means that the allowed transitions do not depend on the size of the minigap and, therefore, the folding approach is supposed to give good results concerning the Raman processes investigated [26].
The red and black curves in Figure 7d display, respectively, the calculated frequencies of LO and TO phonons with momenta as a function of . The phonon structures were also obtained by folding the SLG calculation results where the phonon dispersion was obtained from many-body corrected DFT calculations. The many-body corrections change the phonon slope of the highest optical branch near K (with respect to DFT), reproducing the Kohn anomaly and providing a much better agreement with inelastic X-ray scattering measurements for graphite [39]. These curves accurately describe the D band of graphene when a red shift of 40 cm is applied for phonons close to the K point. However, in order to reproduce the phonons close to the graphene G band, a constant blue shifted of 20 cm is applied to all frequencies. Even though the calculations were done only by folding the SLG results, the physics of the intralayer and interlayer processes in TBG is nicely captured, since the weak van der Waals interactions between layers in TBG do not significantly alter the frequencies of the optical phonon branches [28].
The frequencies of the extra peaks of samples with small (intermediate) values of are plotted as open blue (black) circles in Figure 7d. By comparing the experimental with the calculated results of the resonance energies and phonon frequencies shown in Figure 7c,d, one can conclude that, using visible photons, the Raman peaks below the G band come from TO phonons and are activated by the interlayer process, whereas the peaks above the G band come from the LO phonon branch and are activated by the intralayer process.
In principle, the intralayer and interlayer el-ph processes can also activate TO and LO phonons, respectively, and give rise to T and L peaks for samples with intermediate angles. However, T and L were not observed by the authors in the multiple excitation experiments using visible photons. The lack of observation of L can be due to the huge enhancement of the G band. Since the position of the L peak is very close to the G band position in samples with intermediate twisting angles, it is possibly masked by the G band enhancement. For samples with around 10 and measured using the 1.96 eV laser line, Campos-Delgado et al. [20] reported the observation of a peak at 1622 cm that might be assigned to the L. The absence of T can be ascribed to the very weak cross-section of TO phonons activated by the intralayer process. Electron–phonon matrix elements’ calculations would be necessary to better clarify this issue.
7. Raman Spectra of TBG Using Infrared and Ultraviolet Photons
The calculated results presented in Figure 7c show that, for TBG samples with small twisting angles, both the intralayer and the interlayer processes are expected to be observed using excitation energies below ∼2 eV. This prediction was indeed observed in several Raman results performed in many different samples with in the range 2–9, using near infrared (IR) laser lines. It was observed that the LO phonon is activated by the intralayer el-ph process, but, for very small angles, the L peak is much stronger than the G band, suggesting that the electron–phonon coupling for this phonon branch increases with decreasing , when the wave vector tends to the center of the BZ. In general, a huge enhancement of the Raman intensity is observed in this regime, and only in the tails of the G band is it possible to observe the two extra peaks below and above the G band that are assigned, respectively, as the T and L peaks. The L peak, due to the activation of a LO phonon by the interlayer el-ph process, is not usually seen in the visible range, and it can also be explained by the increase of electron–phonon coupling for the LO phonons when tends to zero.
The theoretical predictions in Figure 7c for samples with large twisting angles (between 20 and 30) show that extra peaks are expected to appear in the UV Raman spectra (for excitation energies above 3 eV). Figure 7d shows that the activated phonons are close to the K point of the single-layer graphene, and come from both the TO and LO branches, with frequencies in the range 1350–1420 cm. The non-dispersive extra peaks observed in the pioneer Raman study of Gupta et al. [33] lays in this frequency range, and they were enhanced in the UV Raman spectrum ( = 3.41 eV). These extra peaks were also studied by Righi et al. [14,19] in the UV Raman spectra of TBGs, but the twisting angles could not be determined in this work. In both studies [14,33], the appearance of new peaks was not accompanied by the enhancement of the G band, as expected for an intralayer el-ph process. In contrast, the UV data of Wang et al. [21] in TBG samples with large values of show the activation of new peaks in spectra where the G band also exhibits an enhancement of 5 to 20 times, thus indicating an interlayer electron–phonon scattering. These peaks observed in the UV Raman spectra are represented by the black open squares in Figure 7c,d, respectively.
Notice in Figure 7c that, for large twisting angles, both the intralayer () and interlayer () resonances occur in the same energy range (3–4 eV). In principle, these two processes can be distinguished by observing the enhancement of the G band of TBG, which is a signature of the interlayer process.
Although the folding method provides a good description of the phonon frequencies and of the electronic transitions of TBG, the theoretical model proposed above does not provide the intensities of Raman peaks. For that, one needs to consider the values of the matrix elements for the electron–phonon and electron–photon interactions. The computation of these matrix elements could clarify, through the intensity, the origin of the peaks for large twisted angles, since the T and L peaks are very close to each other in this regime
8. Intralayer Process in Any Graphene Heterostructure
It was seen that the intralayer electron–phonon process occurs in one graphene layer, and the second layer only imposes a periodic potential needed for momentum conservation in the double-resonance Raman process. Therefore, extra peaks are also expected to appear in the Raman spectra of graphene deposited on the top of any atomically flat substrate, assuming that the interaction graphene/substrate is strong enough to scatter electrons. In a study of graphene on the top of h-BN, Eckmann et al. [40] reported the observation of weak extra peaks both below and above positions of the the G band in graphene, and suggested that they arise from the graphene/h-BN interaction.
In this case, where the two layers of materials have different lattice parameters, a Moiré pattern is observed even with no twisted angle, due to slight lattice mismatch between layers. The size of the Moiré length is now a function of the lattice mismatch and the twisted angle , and can be given by , where, in the case of graphene/h-BN samples, is the graphene lattice constant and [41].
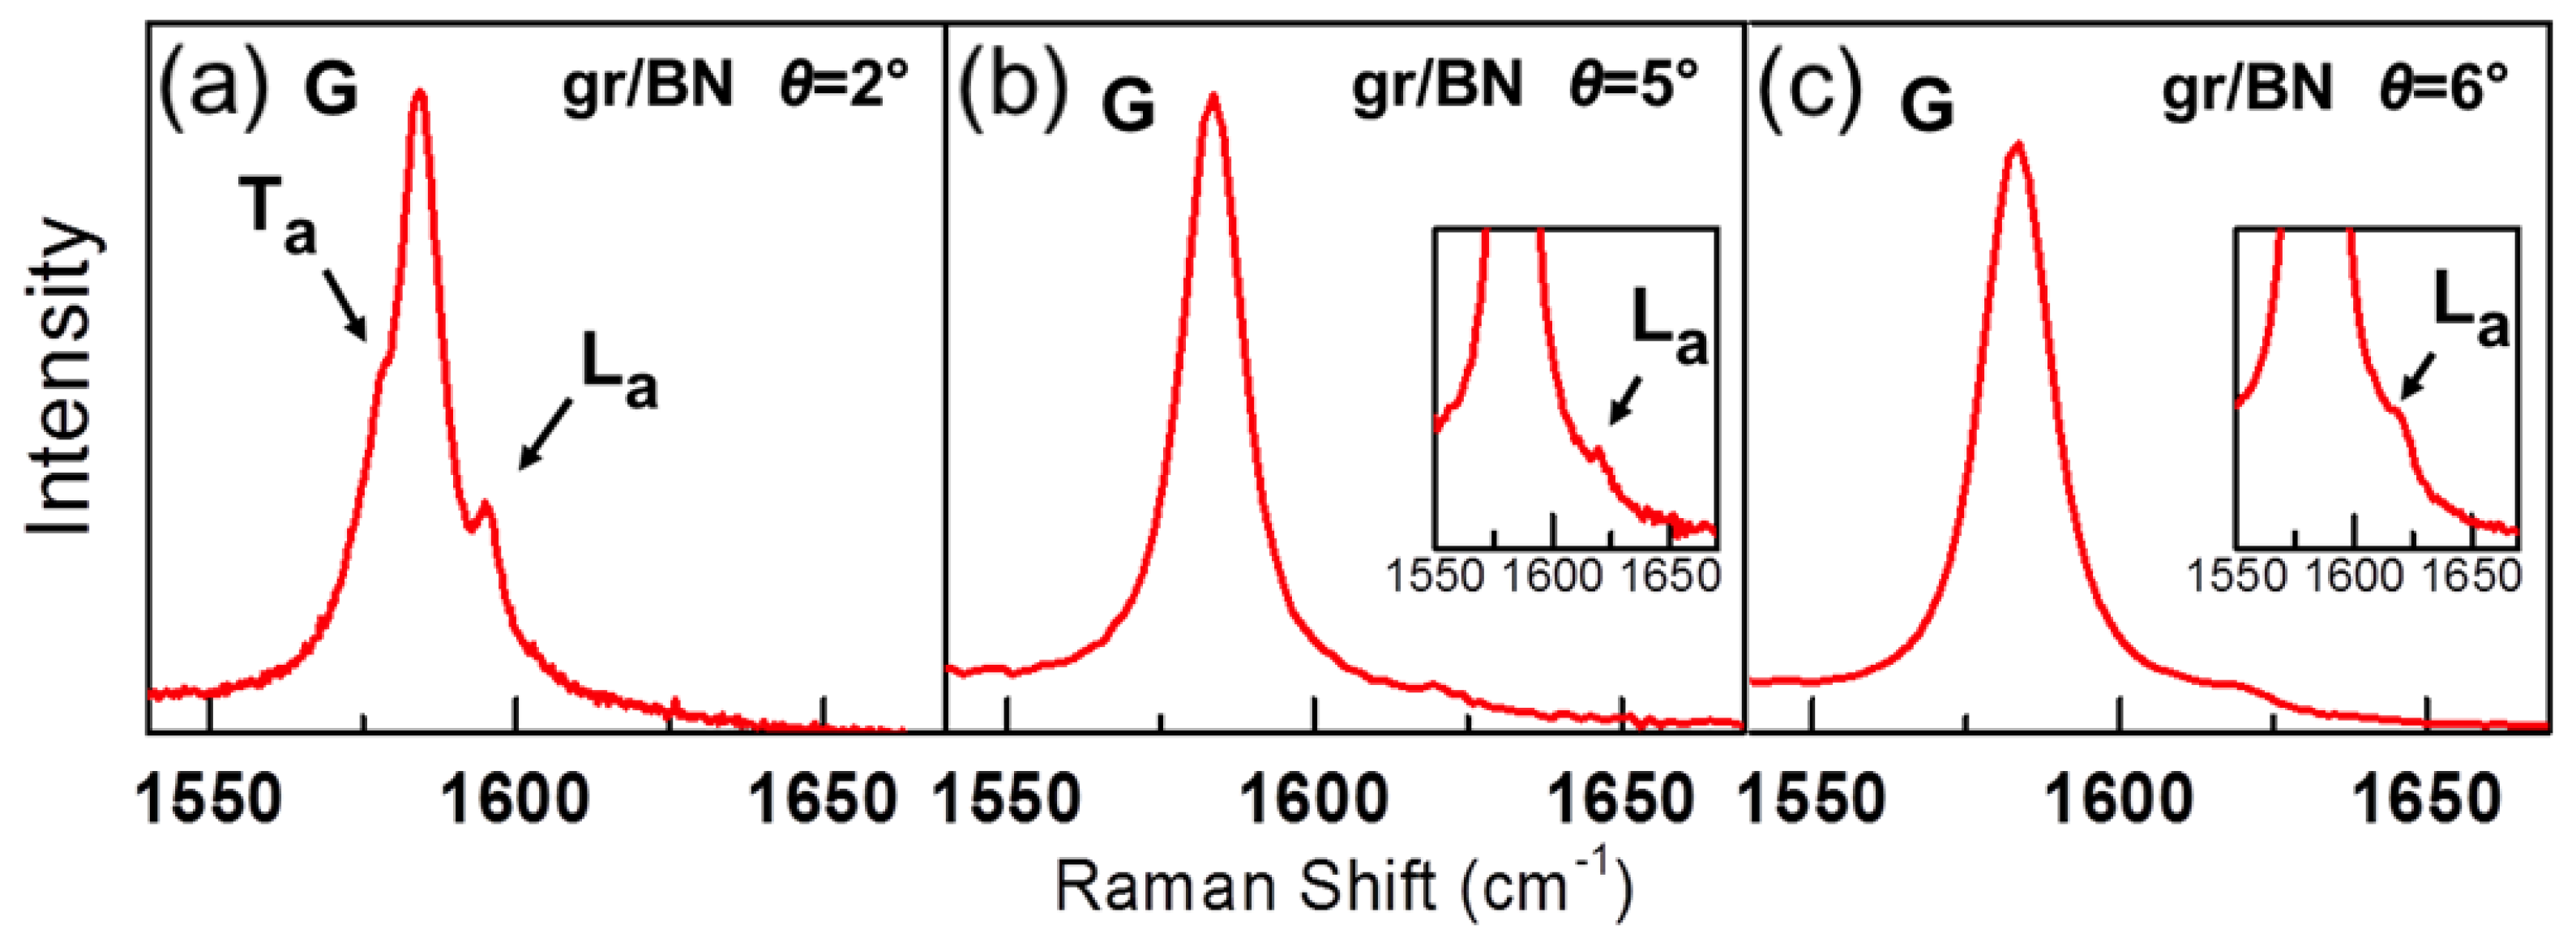
Figure 8a–c show the Raman spectra in three samples of graphene/h-BN, with = 2, 5 and 6, in the range 1550–1650 cm. In the three cases, it is possible to see a very weak peaks above the G band frequency, assigned as L peaks. In the case of the = 2 sample, it is also possible to observe in Figure 8a a sharp peak below the G band, and this result is thus an experimental manifestation of the T process. The positions of the extra peaks in graphene/h-BN are approximately the same of TBG graphene, except for the case of samples with very small twisting angles () [40]. They are much less intense than the extra peaks in bilayer graphene, showing that the imposed potential of h-BN on graphene is much weaker than graphene–graphene interaction. Results shown in Figure 8a–c thus demonstrate that extra peaks enhanced by the intralayer electron–phonon process in TBG occur whenever graphene interacts with an atomically flat crystalline surface that imposes a periodic potential for the electrons of graphene.
9. Conclusions
In conclusion, in this article, we have reviewed the main important effects observed in the Raman spectra of twisted bilayer graphene and twisted graphene heterostructures, with different twisting angles and recorded with different laser excitation energies.
A new result that appears in the Raman spectra of twisted bilayer graphene and twisted graphene heterostructures is the appearance of new Raman peaks, whose positions depend on the twisting angle . These peaks come from phonons with wavevectors within the interior of the graphene Brillouin zone (BZ) that become Raman active for graphene twisted structures. The wavevectors of these phonons correspond to the unit vectors of the Moiré patterns, and they are folded to the center of the reduced BZ of the superlattice. The positions of these extra peaks provide a rough estimate of the twisting angle .
Another important result in the Raman spectra of twisted bilayer graphene is the giant enhancement of the Raman G band when the energy of the excitation laser line matches the energy separation between the van Hove singularities in the DOS of twisted bilayer graphene. Previous Raman studies of more than 100 samples of twisted bilayer graphene (TBG) covering all values between 0 and 30, using laser excitation energies in the visible range show that only samples with from 9 to 17 exhibit a strong enhancement of Raman intensity. On the other hand, for TBG with low and high twisting angle, the TBG Raman intensity is smaller than twice the single layer graphene (SLG) G band intensity. These results show that the G band enhancement is associated with the smaller quasi-periodic Moiré unit cell , and not with the commensurate superlattice unit cell .
It has been reported recently that the enhancement of the extra peaks associated with the Moiré patterns has two different resonance processes. Some peaks are enhanced, both below or above the G band position, for excitation laser energies where the G band is not enhanced. This resonance mechanism is called the intralayer electron–phonon process, and is similar to the double resonance Raman process that activate the disorder-induced D band but, in the case of TBG, the momentum conservation of the DR process is provided by the periodic potential of the Moiré superlattice.
Author Contributions
M.V.O.M., P.V. and M.A.P. contributed equally writing this review. All authors have read and agreed to the published version of the manuscript.
Funding
This research received no external funding.
Acknowledgments
The authors thank the Brazilian Institute of Science and Technology (INCT) in Carbon Nanomaterials and the Brazilian agencies Fapemig, CAPES, CNPq, and FAPERJ Grant No. E-26/010.101126/2018.
Conflicts of Interest
The authors declare no conflict of interest.
References
- Pimenta, M.A.; Dresselhaus, G.; Dresselhaus, M.S.; Cançado, L.G.; Jorio, A.; Saito, R. Studying disorder in graphite-based systems by raman spectroscopy. Phys. Chem. Chem. Phys. 2007, 9, 1276–1290. [Google Scholar] [CrossRef] [PubMed]
- Cançado, L.G.; Pimenta, M.A.; Neves, B.R.A.; Dantas, M.S.S.; Jorio, A. Influence of the atomic structure on the raman spectra of graphite edges. Phys. Rev. Lett. 2004, 93, 247401. [Google Scholar] [CrossRef] [PubMed]
- Cançado, L.G.; Takai, K.; Enoki, T.; Endo, M.; Kim, Y.A.; Mizusaki, H.; Speziali, N.L.; Jorio, A.; Pimenta, M.A. Measuring the degree of stacking order in graphite by raman spectroscopy. Carbon 2008, 46, 272–275. [Google Scholar] [CrossRef] [Green Version]
- Ferrari, A.C.; Meyer, J.C.; Scardaci, V.; Casiraghi, C.; Lazzeri, M.; Mauri, F.; Piscanec, S.; Jiang, D.; Novoselov, K.S.; Roth, S.; et al. Raman spectrum of graphene and graphene layers. Phys. Rev. Lett. 2006, 97, 187401. [Google Scholar] [CrossRef] [PubMed] [Green Version]
- Mohiuddin, T.M.G.; Lombardo, A.; Nair, R.R.; Bonetti, A.; Savini, G.; Jalil, R.; Bonini, N.; Basko, D.M.; Galiotis, C.; Marzari, N.; et al. Uniaxial strain in graphene by raman spectroscopy: g peak splitting, grüneisen parameters, and sample orientation. Phys. Rev. B 2009, 79, 205433. [Google Scholar] [CrossRef]
- Huang, M.; Yan, H.; Chen, C.; Song, D.; Heinz, T.F.; Hone, J. Phonon softening and crystallographic orientation of strained graphene studied by raman spectroscopy. Proc. Natl. Acad. Sci. USA 2009, 106, 7304. [Google Scholar] [CrossRef] [Green Version]
- Pisana, S.; Lazzeri, M.; Casiraghi, C.; Novoselov, K.S.; Geim, A.K.; Ferrari, A.C.; Mauri, F. Breakdown of the adiabatic born–oppenheimer approximation in graphene. Nat. Mater. 2007, 6, 198–201. [Google Scholar] [CrossRef] [Green Version]
- Yan, J.; Zhang, Y.; Kim, P.; Pinczuk, A. Electric field effect tuning of electron–phonon coupling in graphene. Phys. Rev. Lett. 2007, 98, 166802. [Google Scholar] [CrossRef] [Green Version]
- Das, A.; Pisana, S.; Chakraborty, B.; Piscanec, S.; Saha, S.K.; Waghmare, U.V.; Novoselov, K.S.; Krishnamurthy, H.R.; Geim, A.K.; Ferrari, A.C.; et al. Monitoring dopants by raman scattering in an electrochemically top-gated graphene transistor. Nat. Nanotechnol. 2008, 3, 210–215. [Google Scholar] [CrossRef] [Green Version]
- Malard, L.M.; Pimenta, M.A.; Dresselhaus, G.; Dresselhaus, M.S. Raman spectroscopy in graphene. Phys. Rep. 2009, 473, 51–87. [Google Scholar] [CrossRef]
- Venezuela, P.; Lazzeri, M.; Mauri, F. Theory of double-resonant raman spectra in graphene: Intensity and line shape of defect-induced and two-phonon bands. Phys. Rev. B 2011, 84, 035433. [Google Scholar] [CrossRef] [Green Version]
- Neto, A.H.C.; Guinea, F.; Peres, N.M.R.; Novoselov, K.S.; Geim, A.K. The electronic properties of graphene. Rev. Mod. Phys. 2009, 81, 109–162. [Google Scholar] [CrossRef] [Green Version]
- MacDonald, A.H.; Bistritzer, R. Graphene moiré mystery solved? Nature 2011, 474, 453. [Google Scholar] [CrossRef]
- Righi, A.; Costa, S.D.; Chacham, H.; Fantini, C.; Venezuela, P.; Magnuson, C.; Colombo, L.; Bacsa, W.S.; Ruoff, R.S.; Pimenta, M.A. Graphene moiré patterns observed by umklapp double-resonance raman scattering. Phys. Rev. B 2011, 84, 241409. [Google Scholar] [CrossRef] [Green Version]
- Dos Santos, J.M.B.L.; Peres, N.M.R.; Neto, A.H.C. Graphene bilayer with a twist: Electronic structure. Phys. Rev. Lett. 2007, 99, 256802. [Google Scholar]
- Sato, K.; Saito, R.; Cong, C.; Yu, T.; Dresselhaus, M.S. Zone folding effect in raman g-band intensity of twisted bilayer graphene. Phys. Rev. B 2012, 86, 125414. [Google Scholar] [CrossRef] [Green Version]
- Moon, P.; Koshino, M. Optical absorption in twisted bilayer graphene. Phys. Rev. B 2013, 87, 205404. [Google Scholar] [CrossRef] [Green Version]
- Moon, P.; Koshino, M. Energy spectrum and quantum hall effect in twisted bilayer graphene. Phys. Rev. B 2012, 85, 195458. [Google Scholar] [CrossRef] [Green Version]
- Righi, A.; Venezuela, P.; Chacham, H.; Costa, S.D.; Fantini, C.; Ruoff, R.S.; Colombo, L.; Bacsa, W.S.; Pimenta, M.A. Resonance raman spectroscopy in twisted bilayer graphene. Solid State Commun. 2013, 175, 13–17. [Google Scholar] [CrossRef]
- Campos-Delgado, J.; Cançado, L.G.; Achete, C.A.; Jorio, A.; Raskin, J.-P. Raman scattering study of the phonon dispersion in twisted bilayer graphene. Nano Res. 2013, 6, 269–274. [Google Scholar] [CrossRef] [Green Version]
- Wang, Y.; Su, Z.; Wu, W.; Nie, S.; Xie, N.; Gong, H.; Guo, Y.; Lee, J.H.; Xing, S.; Lu, X.; et al. Resonance raman spectroscopy of g-line and folded phonons in twisted bilayer graphene with large rotation angles. Appl. Phys. Lett. 2013, 103, 123101. [Google Scholar] [CrossRef] [Green Version]
- Lu, C.; Lin, Y.; Liu, Z.; Yeh, C.; Suenaga, K.; Chiu, P. Twisting bilayer graphene superlattices. ACS Nano 2013, 7, 2587–2594. [Google Scholar] [CrossRef] [PubMed]
- Ribeiro, H.B.; Sato, K.; Eliel, G.S.N.; Souza, E.A.T.; Lu, C.; Chiu, P.; Saito, R.; Pimenta, M.A. Origin of van hove singularities in twisted bilayer graphene. Carbon 2015, 90, 138–145. [Google Scholar] [CrossRef]
- Ni, Z.; Liu, L.; Wang, Y.; Zheng, Z.; Li, L.; Yu, T.; Shen, Z. g-band raman double resonance in twisted bilayer graphene: Evidence of band splitting and folding. Phys. Rev. B 2009, 80, 125404. [Google Scholar] [CrossRef] [Green Version]
- Havener, R.W.; Zhuang, H.; Brown, L.; Hennig, R.G.; Park, J. Angle-resolved raman imaging of interlayer rotations and interactions in twisted bilayer graphene. Nano Lett. 2012, 12, 3162–3167. [Google Scholar] [CrossRef]
- Havener, R.W.; Liang, Y.; Brown, L.; Yang, L.; Park, J. Van hove singularities and excitonic effects in the optical conductivity of twisted bilayer graphene. Nano Lett. 2014, 14, 3353–3357. [Google Scholar] [CrossRef] [PubMed] [Green Version]
- Eliel, G.S.N.; Ribeiro, H.B.; Sato, K.; Saito, R.; Lu, C.; Chiu, P.; Fantini, C.; Righi, A.; Pimenta, M.A. Raman excitation profile of the g-band enhancement in twisted bilayer graphene. Braz. J. Phys. 2017, 47, 589–593. [Google Scholar] [CrossRef]
- Cocemasov, A.I.; Nika, D.L.; Balandin, A.A. Phonons in twisted bilayer graphene. Phys. Rev. B 2013, 88, 035428. [Google Scholar] [CrossRef] [Green Version]
- Luican, A.; Li, G.; Reina, A.; Kong, J.; Nair, R.R.; Novoselov, K.S.; Geim, A.K.; Andrei, E.Y. Single-layer behavior and its breakdown in twisted graphene layers. Phys. Rev. Lett. 2011, 106, 126802. [Google Scholar] [CrossRef]
- Cao, Y.; Fatemi, V.; Fang, S.; Watanabe, K.; Taniguchi, T.; Kaxiras, E.; Jarillo-Herrero, P. Unconventional superconductivity in magic-angle graphene superlattices. Nature 2018, 556, 43–50. [Google Scholar] [CrossRef]
- Cao, Y.; Fatemi, V.; Demir, A.; Fang, S.; Tomarken, S.L.; Luo, J.Y.; Sanchez-Yamagishi, J.D.; Watanabe, K.; Taniguchi, T.; Kaxiras, E.; et al. Correlated insulator behavior at half-filling in magic-angle graphene superlattices. Nature 2018, 556, 80–84. [Google Scholar] [CrossRef] [PubMed]
- Jin, C.; Kim, J.; Suh, J.; Shi, Z.; Chen, B.; Fan, X.; Kam, M.; Watanabe, K.; Taniguchi, T.; Tongay, S.; et al. Interlayer electron–phonon coupling in wse2/hbn heterostructures. Nat. Phys. 2017, 13, 127–131. [Google Scholar] [CrossRef]
- Gupta, A.K.; Tang, Y.; Crespi, V.H.; Eklund, P.C. Nondispersive raman d band activated by well-ordered interlayer interactions in rotationally stacked bilayer graphene. Phys. Rev. B 2010, 82, 241406. [Google Scholar] [CrossRef] [Green Version]
- Carozo, V.; Almeida, C.M.; Ferreira, E.H.M.; Cançado, L.G.; Achete, C.A.; Jorio, A. Raman signature of graphene superlattices. Nano Lett. 2011, 11, 4527–4534. [Google Scholar] [CrossRef] [PubMed]
- Carozo, V.; Almeida, C.M.; Fragneaud, B.; Bedê, P.M.; Moutinho, M.V.O.; Ribeiro-Soares, J.; Andrade, N.F.; Filho, A.G.S.; Matos, M.J.S.; Wang, B.; et al. Resonance effects on the raman spectra of graphene superlattices. Phys. Rev. B 2013, 88, 085401. [Google Scholar] [CrossRef]
- Miller, D.L.; Kubista, K.D.; Rutter, G.M.; Ruan, M.; de Heer, W.A.; First, P.N.; Stroscio, J.A. Structural analysis of multilayer graphene via atomic moiré interferometry. Phys. Rev. B 2010, 81, 125427. [Google Scholar] [CrossRef] [Green Version]
- Kim, K.; Coh, S.; Tan, L.Z.; Regan, W.; Yuk, J.M.; Chatterjee, E.; Crommie, M.F.; Cohen, M.L.; Louie, S.G.; Zettl, A. Raman spectroscopy study of rotated double-layer graphene: Misorientation-angle dependence of electronic structure. Phys. Rev. Lett. 2012, 108, 246103. [Google Scholar] [CrossRef] [PubMed] [Green Version]
- Eliel, G.S.N.; Moutinho, M.V.O.; Gadelha, A.C.; Righi, A.; Campos, L.C.; Ribeiro, H.B.; Chiu, P.; Watanabe, K.; Taniguchi, T.; Puech, P.; et al. Intralayer and interlayer electron—Phonon interactions in twisted graphene heterostructures. Nat. Commun. 2018, 9, 1221. [Google Scholar] [CrossRef] [PubMed]
- Maultzsch, J.; Reich, S.; Thomsen, C.; Requardt, H.; Ordejón, P. Phonon dispersion in graphite. Phys. Rev. Lett. 2004, 92, 075501. [Google Scholar] [CrossRef] [PubMed]
- Eckmann, A.; Park, J.; Yang, H.; Elias, D.; Mayorov, A.S.; Yu, G.; Jalil, R.; Novoselov, K.S.; Gorbachev, R.V.; Lazzeri, M.; et al. Raman fingerprint of aligned graphene/h-bn superlattices. Nano Lett. 2013, 13, 5242–5246. [Google Scholar] [CrossRef] [PubMed]
- Yankowitz, M.; Xue, J.; Cormode, D.; Sanchez-Yamagishi, J.D.; Watanabe, K.; Taniguchi, T.; Jarillo-Herrero, P.; Jacquod, P.; LeRoy, B.J. Emergence of superlattice dirac points in graphene on hexagonal boron nitride. Nat. Phys. 2012, 8, 382–386. [Google Scholar] [CrossRef] [Green Version]
Figure 1.
Real and reciprocal spaces of TBG—adapted from Ref. [38]. (a) Schematics of two rotated monolayer graphene with the blue layer sitting on the top of the golden layer. The layers are twisted by an angle (13.2 in this case), generating a periodic Moiré pattern. Vectors and define the supercell, while and ( and ) are the untwisted (twisted) graphene lattice vectors. (b) The grey and black hexagons correspond to the Brillouin zones (BZ) of two graphene layers, denoted by A and B, twisted by the angle = 13.2. The small red hexagon represents the reduced BZ and the vectors , and correspond to the unit vectors of the Moiré reciprocal lattice; (c) energy versus momentum diagram calculated for = 13.2. The grey (black) curves represent the Dirac cone of layer A (layer B). The vertical blue arrow represents the optical transition for the intralayer process, and the vertical green arrow represents the transition for the interlayer case. The horizontal red arrows represent the wave vector of the phonon; (d) density of electronic states (DOS) of the TBG and optical transition between vHs in the valence and conduction bands.

Figure 2.
Experimental and simulated Raman spectra—adapted from Ref. [14]. (a) Raman spectra obtained in four different regions of a graphene sample that contains regions with single layer and bilayer regions. The spectrum on the top was recorded inside the Cu enclosure, and the other three were obtained in different regions outside of the Cu enclosure, with bilayer graphene (BLG) domains. The peak marked by an asterisk is an artifact that comes from the substrate; (b) Raman spectra taken in the same spot of the sample, showing the extra peak at 1383 cm recorded with four different laser energies 3.40, 3.53, 3.69 and 4.13 eV; (c) simulated Raman spectra using Equation (1) from Ref. [14] with sets of vectors for several possible twist angles between graphene layers. The G band is not shown in the figure.

Figure 3.
Raman excitation profile of the extra peaks in TBG—adapted from Ref. [19]. (a) Raman spectra in the 1200–1700 cm range, obtained with different laser lines, showing the resonance behavior of the sharp extra peak around 1380 cm. The peaks marked with asterisks are broadened since the laser lines of the diode laser were very broad; (b,c) simulated umklapp double-resonance Raman spectra, , for two possible twisting angles and three different laser energies, indicated in the figures; (d) laser energy dependence of the relative intensity of the extra M band with respect to the G-band intensity. The black squares correspond to the experimental results presented in (a) and the open and black circles correspond to the simulated results for TBG with 7.34 and 13.17, respectively.

Figure 4.
G band intensity and width in TBG—adapted from Ref. [23]. (a) / for more than 100 TBG samples with many different twisting angles between and . Blue, green, and red dots are data taken at 488, 532, and 633 nm. Solid lines are the Gaussian fits to the observed angle dependence /. The insets show a zoom of / for low () and high twisting angles (); (b) angular dependence of the ratio between the FWHM of TBG and SLG. The insets show the fitting of the G Band with two and one Lorentzians for and , respectively.
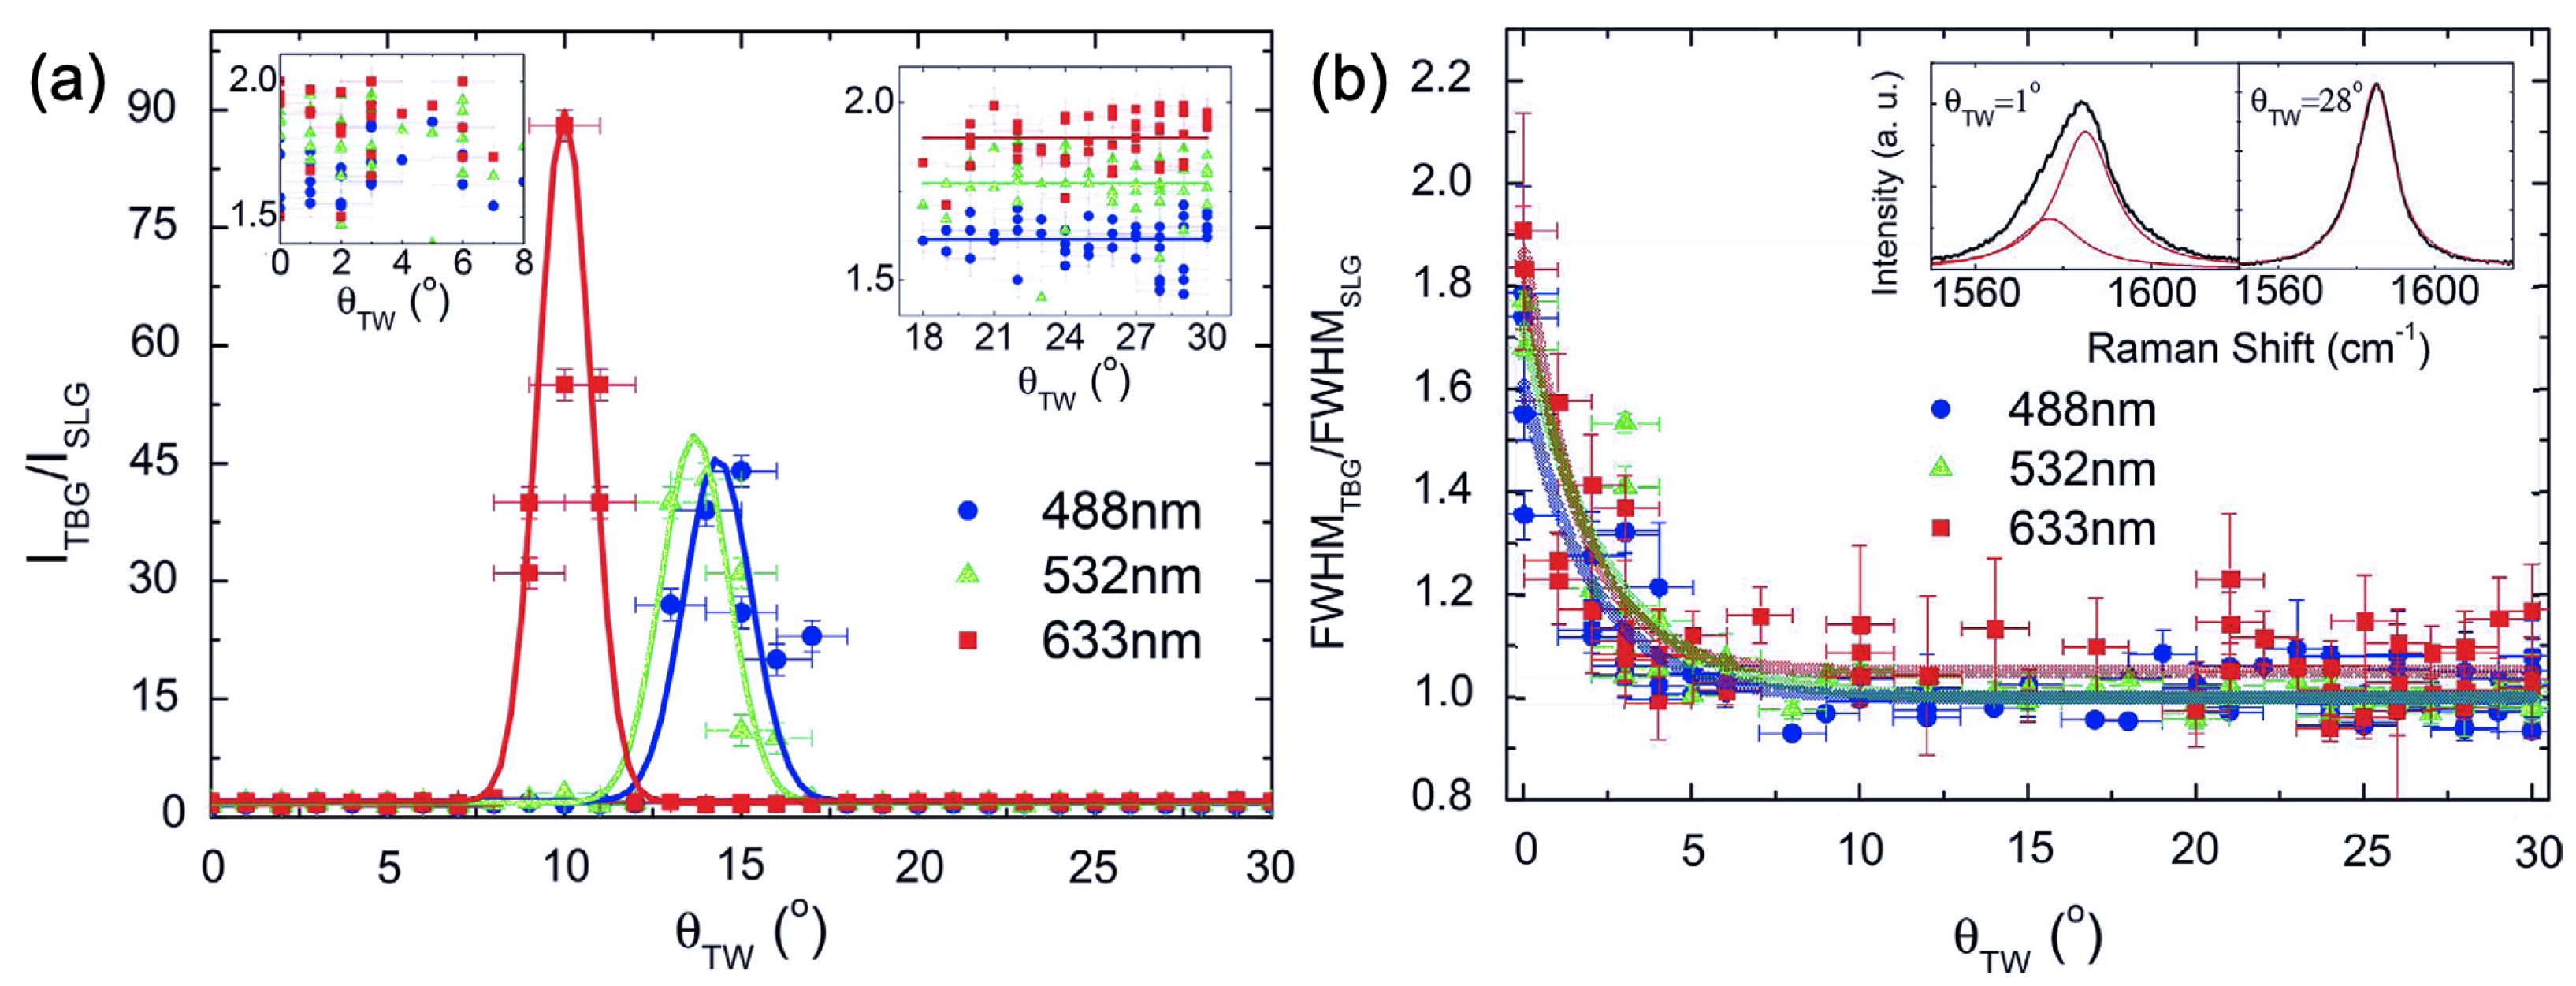
Figure 5.
Raman results of two different samples of TBG in the visible range—adapted from Ref. [38]. (a,b) Raman spectra in two samples of TBG with = 6 and 13 recorded with the 2.18 eV and 2.41 eV laser lines, respectively. The vertical scale, , corresponds to the ratio of the peak intensities of the Raman spectra in TBG and single-layer graphene (SLG). The peak around 1620 cm in (a) is called L since it comes from the LO phonon branch and is activated by the intralayer electron–phonon scattering process, whereas the peak at 1480 cm in part (b) is called T since it comes from the in-plane TO phonon branch and is activated by the interlayer process; (c) Raman excitation profile (REP) of the G band (black squares) and the L peak (blue circles) of the sample with a low twisting angle ( = 6); (d) Raman excitation profile (REP) of the G band (black squares) and of the T peak (green circles) of the sample with intermediate twisting angle ( = 13). The T peak intensity was multiplied by ≈ 100 times for comparison with the G band REP and, in both (c,d) panels, the error bars represent the standard deviation.

Figure 6.
Intralayer and interlayer el-ph scattering processes—adapted from Ref. [38]. (a,b) are representation of the low (−) and high (+) energy for the intralayer and interlayer processes, respectively; (c) an interlayer el-ph process where a phonon with momentum connects the states and . The light and dark green curves correspond to the equi-energies around K and K; (d) intralayer el-ph process where both states and are in the equi-energies of the same layer (light and dark blue curves around K and K, respectively); (e) interlayer (green dots) and (f) intralayer (blue dots) electronic states and represented in a reduced BZ scheme.

Figure 7.
Resonance energies and phonon frequencies for the intralayer and interlayer el-ph processes—adapted from Ref. [38]. (a,b) joint density of states that satisfy the intralayer and interlayer processes, respectively, for some twisting angles . (c) The dashed blue, green, pink, and red curves represent the calculated values of , , , and as a function of the twisting angle . The blue and black open circles correspond to the resonance energies of the extra peaks observed in the visible Raman spectra in samples with, respectively, small and intermediate angles. The light blue and red open squares correspond to the laser energies where the extra peaks observed in the Raman spectra in samples with in the ranges 3–5 and 6–10 have the maximum intensity. The black open squares correspond to the resonance energies of the extra peaks observed in the UV Raman spectra for samples with large twisting angles (22–28). The black symbols × correspond to the energies of the peaks in the optical absorption spectra of TBG reported in Ref. [26]. (d) The red and black curves represent the dependence of the TO and LO phonon frequencies as a function of . The blue and black circles, and the green, red, and black squares correspond to the frequencies of the extra peaks observed in the visible, IR and UV Raman spectra as described in part (c). The black triangles correspond to the results reported by Wang et al. [21]. The error bars in the panels (c,d) represent the standard deviation.
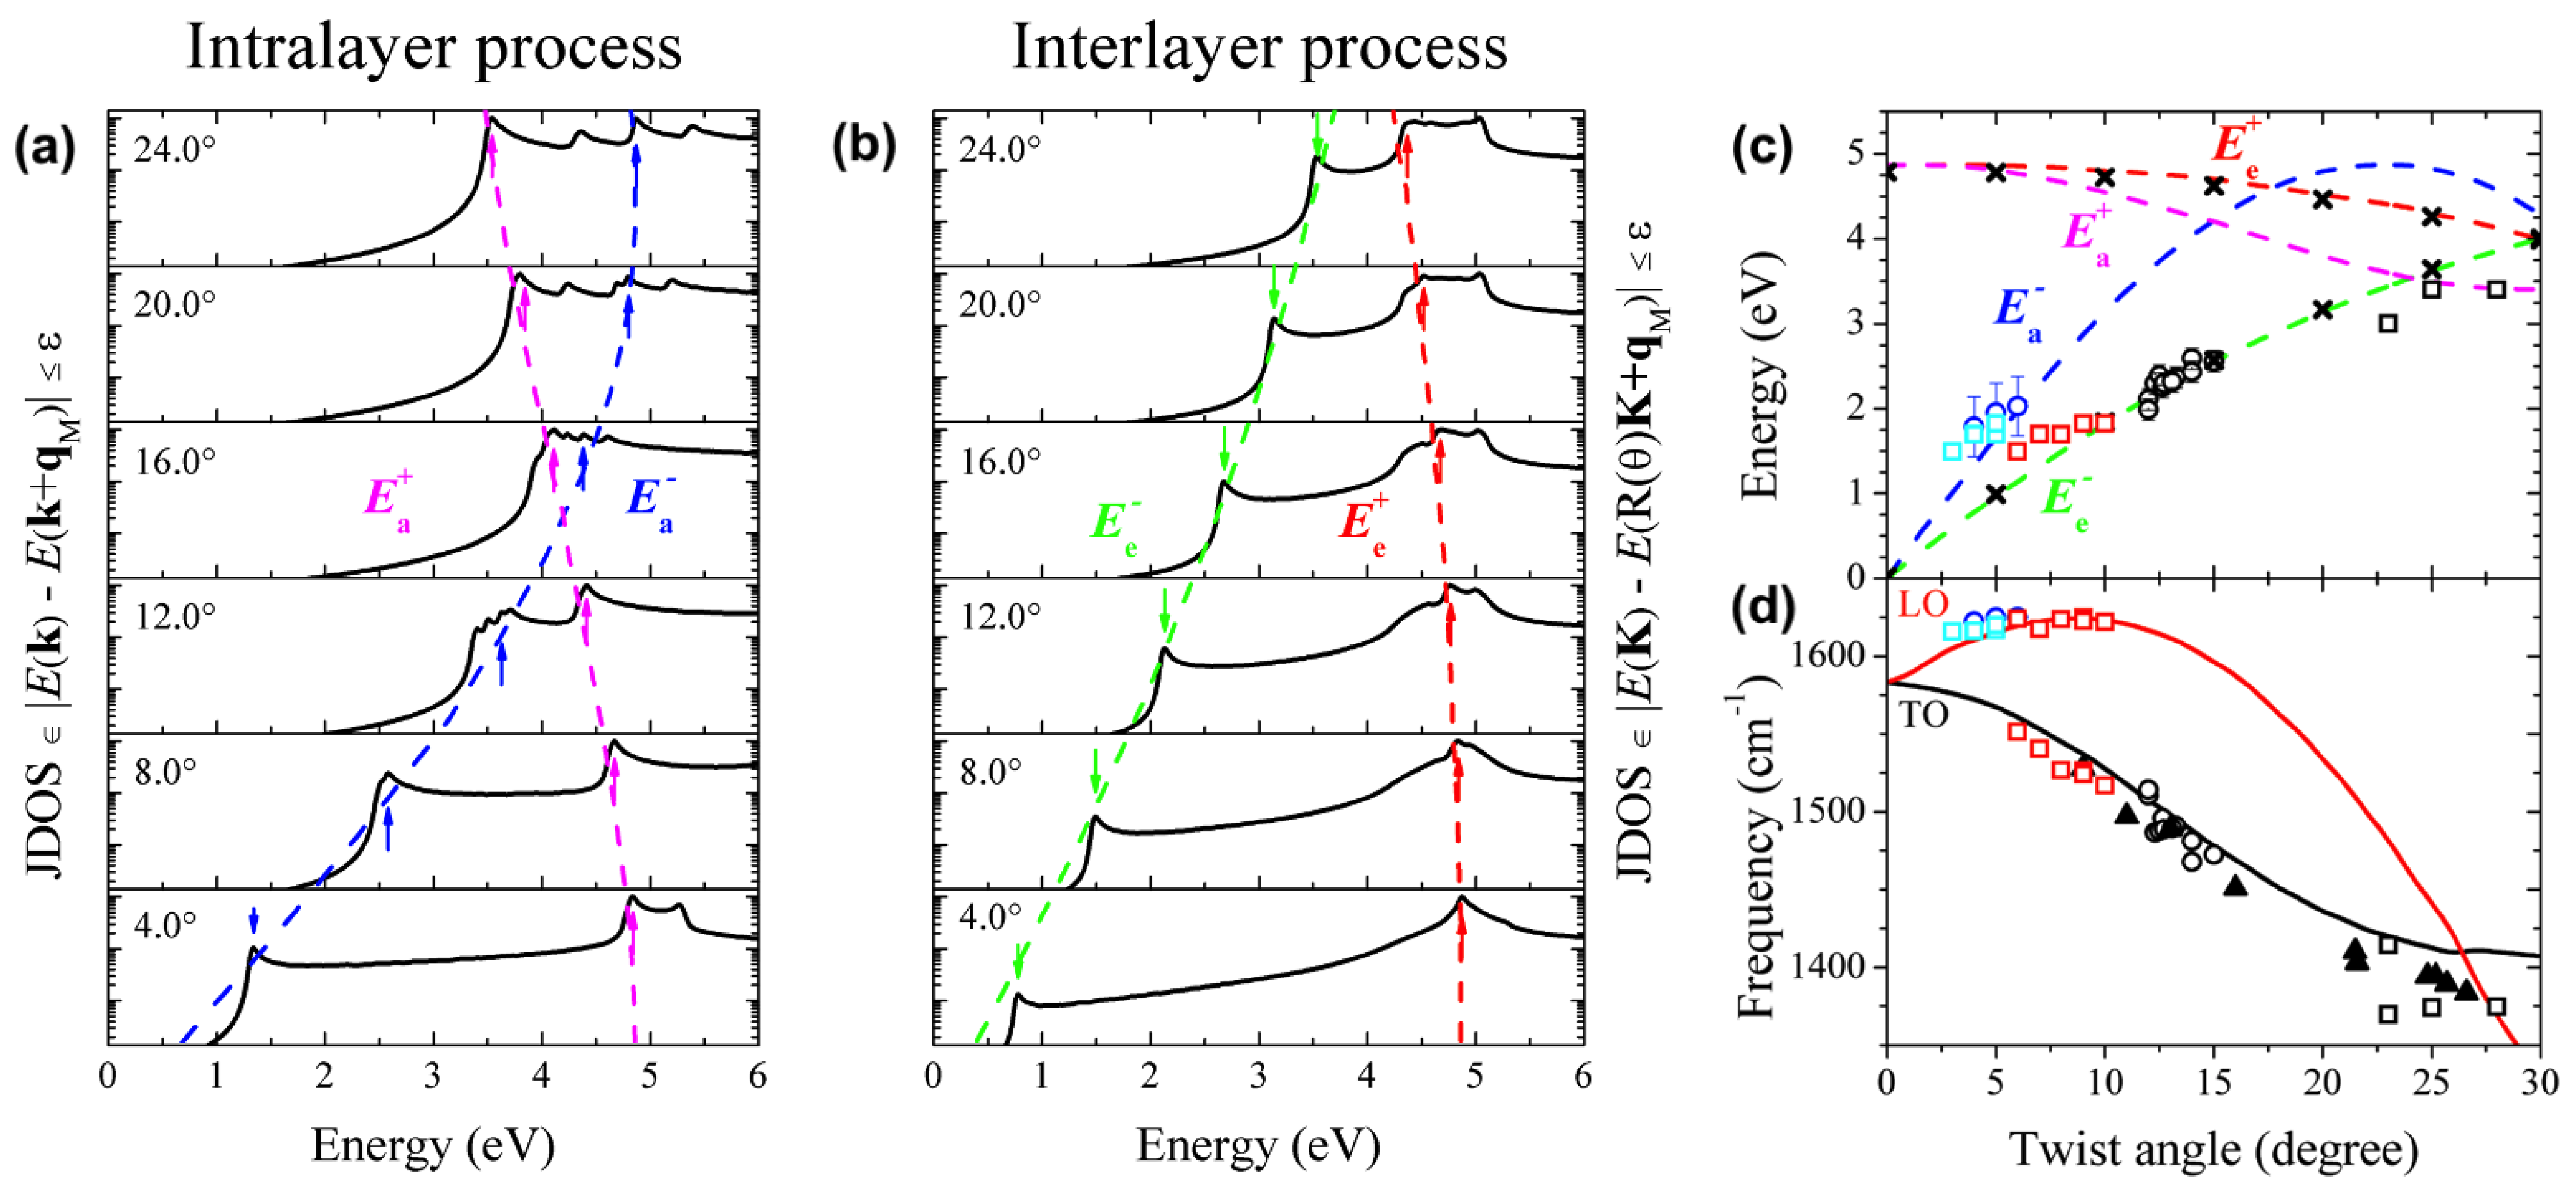
Figure 8.
Raman results for gr/h-BN—adapted from Ref. [38]. (a–c) Raman spectra in three different samples of graphene on the top of h-BN, with twisting angles = 2, 5, and 6, recorded with the 1.96 eV excitation energy.
Figure 8.
Raman results for gr/h-BN—adapted from Ref. [38]. (a–c) Raman spectra in three different samples of graphene on the top of h-BN, with twisting angles = 2, 5, and 6, recorded with the 1.96 eV excitation energy.
Publisher’s Note: MDPI stays neutral with regard to jurisdictional claims in published maps and institutional affiliations. |
© 2021 by the authors. Licensee MDPI, Basel, Switzerland. This article is an open access article distributed under the terms and conditions of the Creative Commons Attribution (CC BY) license (http://creativecommons.org/licenses/by/4.0/).
Share and Cite
MDPI and ACS Style
Moutinho, M.V.O.; Venezuela, P.; Pimenta, M.A. Raman Spectroscopy of Twisted Bilayer Graphene. C 2021, 7, 10. https://0-doi-org.brum.beds.ac.uk/10.3390/c7010010
AMA Style
Moutinho MVO, Venezuela P, Pimenta MA. Raman Spectroscopy of Twisted Bilayer Graphene. C. 2021; 7(1):10. https://0-doi-org.brum.beds.ac.uk/10.3390/c7010010
Chicago/Turabian StyleMoutinho, Marcus V. O., Pedro Venezuela, and Marcos A. Pimenta. 2021. "Raman Spectroscopy of Twisted Bilayer Graphene" C 7, no. 1: 10. https://0-doi-org.brum.beds.ac.uk/10.3390/c7010010
Note that from the first issue of 2016, this journal uses article numbers instead of page numbers. See further details here.