Design of Porous Carbons for Supercapacitor Applications for Different Organic Solvent-Electrolytes


1
Centre for Engineering Materials, University of Surrey, Guildford GU2 7XH, UK
2
Faculty of Science and Engineering, University of Plymouth, Plymouth PL4 8AA, UK
*
Author to whom correspondence should be addressed.
C 2021, 7(1), 15; https://0-doi-org.brum.beds.ac.uk/10.3390/c7010015
Submission received: 21 December 2020
/
Revised: 22 January 2021
/
Accepted: 26 January 2021
/
Published: 29 January 2021
(This article belongs to the Special Issue Carbon Based Electrochemical Devices)
Abstract
:The challenge of optimizing the pore size distribution of porous electrodes for different electrolytes is encountered in supercapacitors, lithium-ion capacitors and hybridized battery-supercapacitor devices. A volume-averaged continuum model of ion transport, taking into account the pore size distribution, is employed for the design of porous electrodes for electrochemical double-layer capacitors (EDLCs) in this study. After validation against experimental data, computer simulations investigate two types of porous electrodes, an activated carbon coating and an activated carbon fabric, and three electrolytes: 1.5 M TEABF4 in acetonitrile (AN), 1.5 M TEABF4 in propylene carbonate (PC), and 1 M LiPF6 in ethylene carbonate:ethyl methyl carbonate (EC:EMC) 1:1 v/v. The design exercise concluded that it is important that the porous electrode has a large specific area in terms of micropores larger than the largest desolvated ion, to achieve high specific capacity, and a good proportion of mesopores larger than the largest solvated ion to ensure fast ion transport and accessibility of the micropores.
1. Introduction
Porous carbon is the main electrode material in the majority of symmetric electrochemical double-layer capacitors (EDLCs) [1], due to its good conductivity and ability to be activated into a large specific surface area. It is applied in different formats, including activated carbon fibers and activated carbon fabrics (ACFs) [2,3], activated carbon (AC) powder coatings [4,5,6], graphene [7,8,9,10,11], graphene oxide [11,12] and carbon nanotubes [13,14,15], where multiwall carbon nanotubes (MWCNT) also enhance electrode conductivity [5,16,17]. Composite electrodes consisting of a blend of these materials combine low resistance with high specific capacitance, resulting in supercapacitors of high power density and high energy density [5,16,17,18]. Such materials are also easy to be recycled [19], where the supercapacitor is disassembled, and a dissolution process is applied to dissolve any electrode binder material [20,21], followed by dielectrophoresis to separate different carbon particulates such as AC, MWCNT and carbon black material [19,22].
EDLC electrodes are designed taking into account three key characteristics: high specific surface area, which defines the capacitance value, fast transport of electrolyte ions to all pores, which defines the power value, and accessibility of all pores to the electrolyte ions, so that the full pore wall surface area accounts for the capacitance. Micropores provide much higher specific area than meso- and macropores. However, a network of meso- and micropores is recommended where the large pores allow for fast ion transport to micropores. It has been observed that very small micropores of similar size as the ion size maximize the electrode capacitance [23]. It can be seen that it is rather difficult to just define empirical rules and measures to take into account the interplay of all three key characteristics of EDLC electrodes. A more complex and comprehensive model is needed for the design of meso- and microporous electrodes for EDLCs, which could also be applied to certain battery electrodes relying on similar ion transport and attachment principles, such as lithium–air [24,25,26] and lithium–sulfur batteries [27,28].
There is a plethora of modeling approaches at different levels. Equivalent circuit models [2,29] are generally used to simulate device behavior [2], to elucidate different effects and degradation with cycling [30], and for power management and control for device and system operation [29]. At the other end, molecular dynamics (MD) simulations are useful in predicting the properties of electrolyte solutions, such as viscosity, diffusion coefficient and conductivity and the size and coordination number of solvated ions [31,32]. Density functional theory (DFT) simulations elucidate interactions [33] and can predict binding energies [34] between ions and pore walls, for example. In general, molecular-level simulations require such large memory and computation time, such that they can model at best a domain of the size of a short micropore. As such, they cannot be applied for the design of the pore architecture of porous electrodes in EDLCs.
Modeling the ion transport employing the Nernst-Planck equation [35] can be carried out through the full pore network, which could be obtained via image analysis of 3D-CT scans [36], for example; however, the problem is that 3D-CT scan and other technologies have a resolution around 1 micron at best, which does not capture the micro- and mesopores and a large portion of macropores of supercapacitor electrodes. The most appropriate model, developed by the authors’ group [37], is a volume-averaged continuum model of ion transport through the porous material, taking into account a discretized pore size distribution (PSD) at each numerical point [38]. Pore size distribution of the porous electrode can be obtained from the pressure isotherms in nitrogen adsorption/desorption experiments to low relative pressure, to cover a pore size range of 0.3–120 nm [38]. This is the model adopted for the design of the porous carbon electrodes in this study.
The model is based on parallel ion transport equations for each pore size in the PSD, including interpore ion flux based on a hierarchical pore line hypothesis [38]. The ions move as solvated ions if the pores can accommodate them [38]. Otherwise, they become desolvated if there is sufficient amount of electrochemical (and thermal energy) to overcome the binding energy between the ion and “bound” solvent molecules [38]. Viscosity, electrolyte conductivity and the diffusion coefficient are continuously updated at each point of the electrode domain during the computer simulation, depending on the changing ion concentration [38,39,40,41]. In common with other models by Lekakou’s group of species transport through porous media considering multiple pore sizes [42,43,44], a finite difference/finite volume numerical solution is applied [45].
According to this model, which we shall use as a tool to design porous electrodes, the relationship between ion size (solvated or desolvated, as appropriate) and pore size is a decisive factor in pore accessibility, in the first place, and also in determining the magnitude of the diffusion coefficient and electrolyte conductivity, which affect the rate of transport [38,39,40]. The size of desolvated ion also plays an important role in the number of ions lining the pore wall under charge voltage in the Stern monolayer [46], which determines the EDLC capacitance. Early in the validation of our model against experimental data, it was realized that using the van der Waals surface wrapping the molecular model of the species to determine the minimum and maximum dimensions, Lmin,VdW and Lmax,VdW, respectively, and volume of the molecule or ion [28] yielded the best fit between predictions and experimental data. Solvated ion sizes are generally within the upper limit of micropore range [32]; hence, ions can easily migrate through the separator, which has much larger pores in the macropore range of the order of several microns [47] or micron if the separator was fabricated via electrospinning [48,49]. For this reason, the model assumes a fully permeable separator of negligible thickness, so that the ion transport is governed by the porous architecture of the anode and cathode [38].
EDLCs with aqueous electrolytes have generally low maximum voltage of operation, Vmax, typically below 1.2 V [50], which is far lower than that for organic electrolytes and ionic liquid electrolytes. Such low-energy devices are not recommended for high-voltage systems, such as automotive and aircraft, or even medium-voltage applications. On the other hand, electronics that operate at low voltage favor solid electrolytes to avoid leaking of liquids. Design of EDLC materials, in this case, depends strongly on the ion diffusion through the solid electrolyte-separator region, which is beyond the scope of this paper. Ionic liquid electrolytes operate to high Vmax to 4.5 V but are of high viscosity, and their supercapacitors operate at reasonable power only at elevated temperature [51]. Organic electrolytes are the most suitable electrolytes for supercapacitors, operating to about Vmax = 3 V [52]. Popular organic electrolytes for supercapacitors are the low-viscosity solution of TEABF4 in acetonitrile (AN) and the solution of TEABF4 in propylene carbonate (PC) which is of higher viscosity and lower conductivity than AN but less volatile [53]. Recently, there has been increased interest in lithium-ion (Li-ion) electrolytes for lithium-ion capacitors (LICs) [54] and hybridized battery-supercapacitors [55,56,57], for which porous electrode materials have not yet been optimized.
This study engages with the design of porous electrodes in EDLCs for three representative liquid electrolytes: TEABF4 in AN, TEABF4 in PC and LiPF6 in EC-EMC. We pioneer the porous carbon material design by employing computer simulations of the galvanostatic charge-discharge of symmetric EDLC cells based on the advanced volume averaged continuum model developed and presented in [38], which considers the pore size distribution of electrodes. Two typical activated carbon electrodes are simulated with typical PSDs of electrode materials used in supercapacitors. An important feature and contribution of this work is model validation in comparisons of predictions with experimental data.
2. Materials and Methods
The following electrode materials were investigated:
- (a)
- ACF fabric ACC-507-15 (Kynol Europa Gmbh, Hamburg, Germany) of a nominal thickness of 0.5 mm and areal density of 12.05 mg cm−2;
- (b)
- AC coating electrodes consisting of 95 wt% activated carbon (AC) (Sigma Aldrich: product C9157: 4C Norit A charcoal, peat bog-derived, BETAC = 1000 m2 g−1) and 5 wt% polyvinylidene difluoride (PVDF) (MW = 534 × 103, from Sigma Aldrich, Gillingham, UK).
The electrode ACF fabric and the electrode AC coating were examined using scanning electron microscopy (SEM) on a Jeol 7100 microscope (Zaventem, Belgium) and atomic force microscopy (AFM) in tapping mode on a Bruker Dimension Edge AFM Instrument (Ettlingen, Germany), at the University of Surrey. The electrode ACF fabric and the electrode coating were also characterized in nitrogen adsorption/desorption experiments at 77 K and relative pressure P/Po in the range of 1 × 10⁻⁶ − 1 using a BELSORP-Max ((from MICROTRAC, Hope, UK) at the University of Plymouth. Each sample was degassed beforehand at 305 K for 3 h, at a rate of 9.5 mPa min−1 on average. The pore size distribution was determined from the adsorption/desorption isotherms through GCMC (Grand canonical Monte Carlo) simulations using the BELMaster software at the University of Surrey.
The following symmetric EDLCs are considered in this study, subjected to galvanostatic charge-discharge (GCD) tests at different currents:
Case A: EDLC of 4 cm2 with ACF fabric electrodes of 0.5 mm thickness and electrolyte 1.5 M TEABF4/AN;
Case B: EDLC of 2 cm2 with AC coating electrodes of 90 µm thickness and areal density of 5.2 mg cm−2, and electrolyte 1.5 M TEABF4/AN;
Case C: EDLC of 2 cm2 with AC coating electrodes of 100 μm thickness and areal density of 5.73 mg cm−2, and electrolyte 1.5 M TEABF4/PC.
Case D: EDLC of 1.766 cm2 with AC coating electrodes of 90 µm thickness and areal density of 4.6 mg cm−2, and electrolyte 1 M LiPF6 in EC:EMC 50:50 v/v.
Case E: EDLC of 1.766 cm2 with ACF fabric electrodes of 0.5 mm thickness and electrolyte 1 M LiPF6 in EC:EMC 50:50 v/v.
The porous electrode design is based on computer simulations of ion transport [38] during virtual GCD experiments for EDLCs with the two alternative electrode materials and the three electrolyte systems, replicating corresponding experimental studies. The ion transport model [38] used in the simulations is presented in Table A1, Appendix A. The inputted data for the physical properties of the electrolyte solutions are given in Table 1, where kd is the dissociation constant, ηo is the solvent viscosity and σ2 is the solution electrical conductivity.
3. Results
Figure 1 presents SEM and AFM images of the ACF fabric electrode. The SEM image in Figure 1a shows macropores between the crossing yarns of fabric, of the order of 200–500 µm dimensions, with macropores between the fibers in a yarn of the order of 10–20 μm width: these large macropores are considered as the reservoirs of the bulk electrolyte in the electrode, in the model of ion transport. The large-magnification SEM image in Figure 1b depicts hierarchical macro- and mesopore architectures of circular cross-section from the surface into the bulk of the fiber ranging from 200 nm down to 10 nm (detected on the SEM image). AFM images of a fiber surface, depending on the surface part examined and the fitted maximum depth of the tapping AFM probe, depict mesopores of both cylindrical (Figure 1c) and slit cross-section (Figure 1d) from the fiber surface into the fiber bulk, with the mesopore width ranging from 50 down to 10 nm.
Figure 2 presents SEM and AFM images of the AC coating electrode. The SEM image in Figure 2a presents large macropores of about 10 μm between AC particles, which are considered as the reservoirs of the bulk electrolyte in this type of electrode, in the model of ion transport. Examining the particle surface, macropores of circular cross-section can be identified in the SEM images in Figure 2b–d, of a diameter from 500 nm down to 20 nm (detected). Such features are also detected in the AFM images (Figure 2e–h), where slit type of pore channels can also be identified in Figure 2g, of the order of 10 nm width.
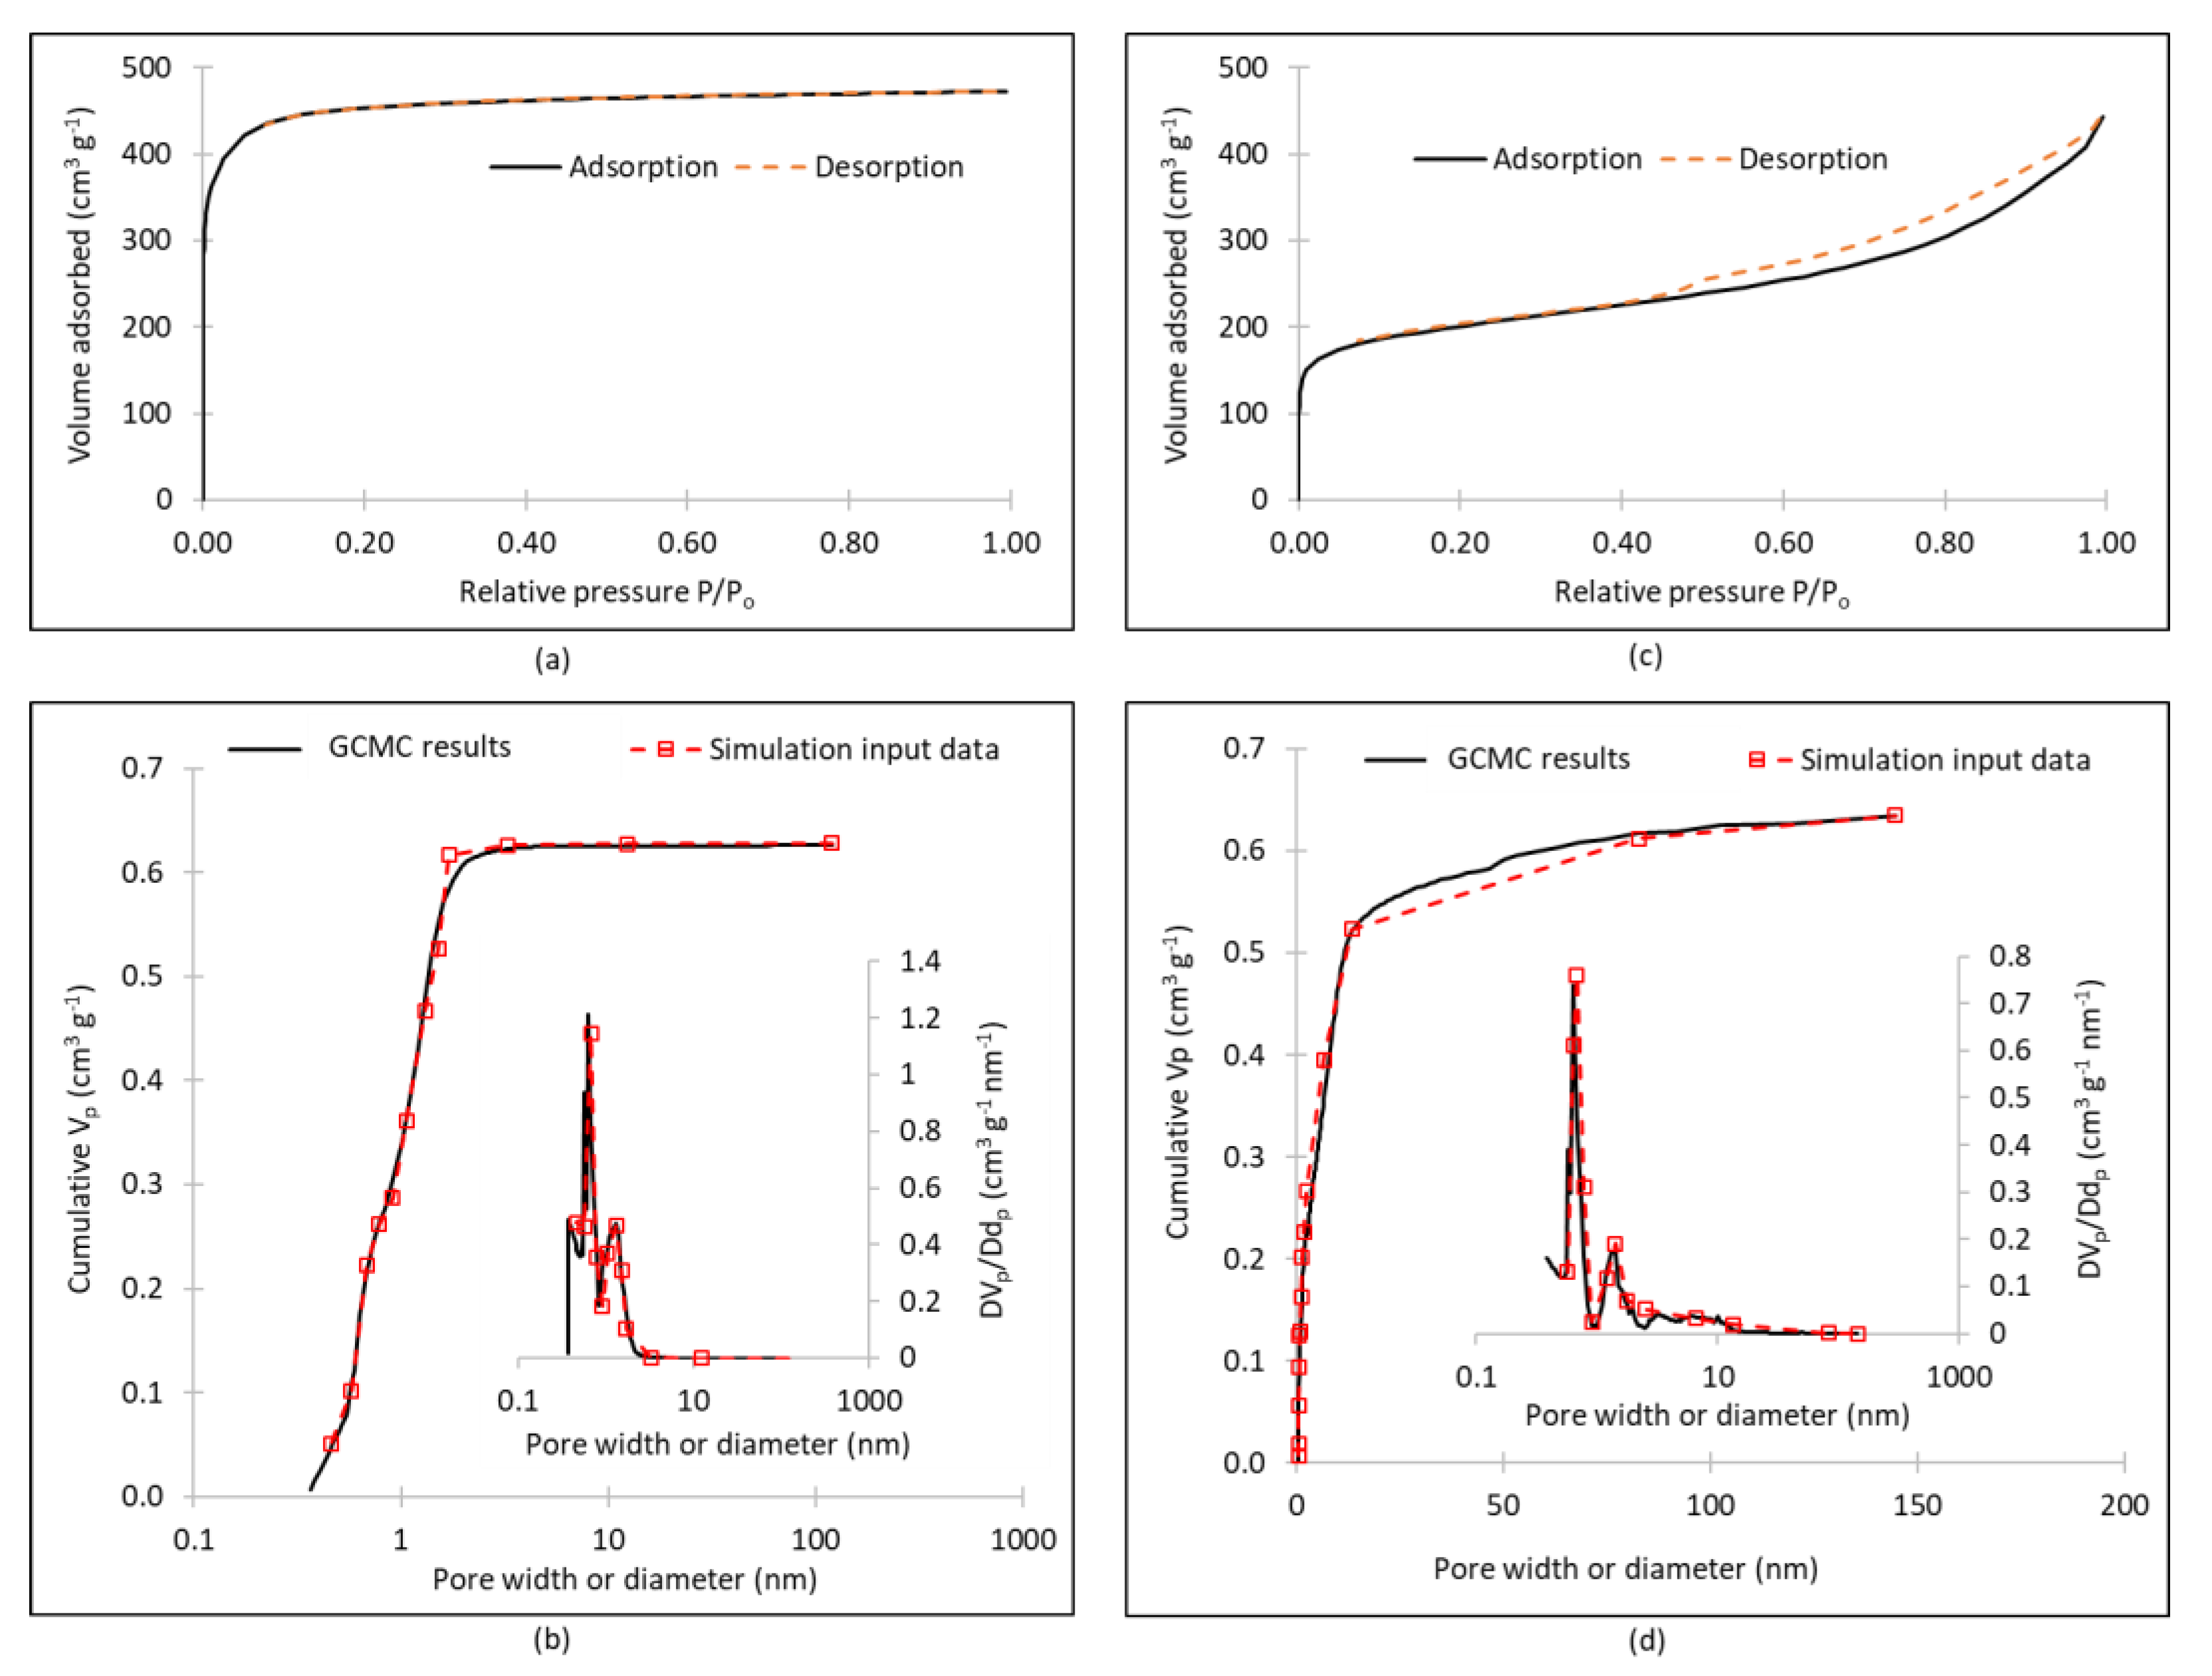
Nitrogen adsorption/desorption experiments for the ACF fabric yielded a type I isotherm (Figure 3a), indicating a generally microporous material. Using the t-plot method in the BELMaster software, the specific surface area of the ACF fabric was calculated as BETACF = 1734.3 m2 g−1. Employing the assumption of slit pore shape, which is considered to be the case for micropores of carbonaceous materials, the GCMC method was applied to derive the PSD of ACF fabric from the experimental data of the adsorption isotherm, and the results are presented in Figure 3b. The incremental PSD curve is generally bimodal with small peaks at 0.38 and 0.57 nm and main peaks at 0.64 and 1.31 nm. Furthermore, a discrete PSD of 12 pore sizes was fitted to the GCMC curve and is also presented in Figure 3b. The discrete PSD will be used as input data of the different pore sizes in the simulations for the ACF electrodes in this paper.
Nitrogen adsorption/desorption experiments for the AC coating yielded a type III isotherm (Figure 3c), indicating a hierarchical pore structure with accessible micropores. The GCMC method was also applied to derive the PSD of the AC coating from the experimental data of the adsorption isotherm, and the results are presented in Figure 3d. The incremental PSD curve is generally bimodal with a small peak at 0.39 nm, main peaks at 0.68 and 1.41 mn, and further small peaks at 1.77, 3.19 and 9.93 nm. A discrete PSD line of 14 pore sizes was fitted to the experimental PSD curve and is also presented in Figure 3d. The discrete PSD will be used as input data of the different pore sizes in the simulations for the AC coating electrodes in this paper.
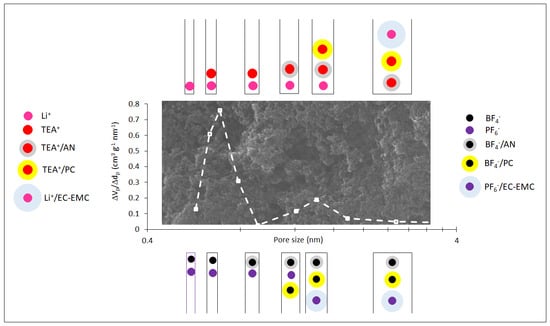
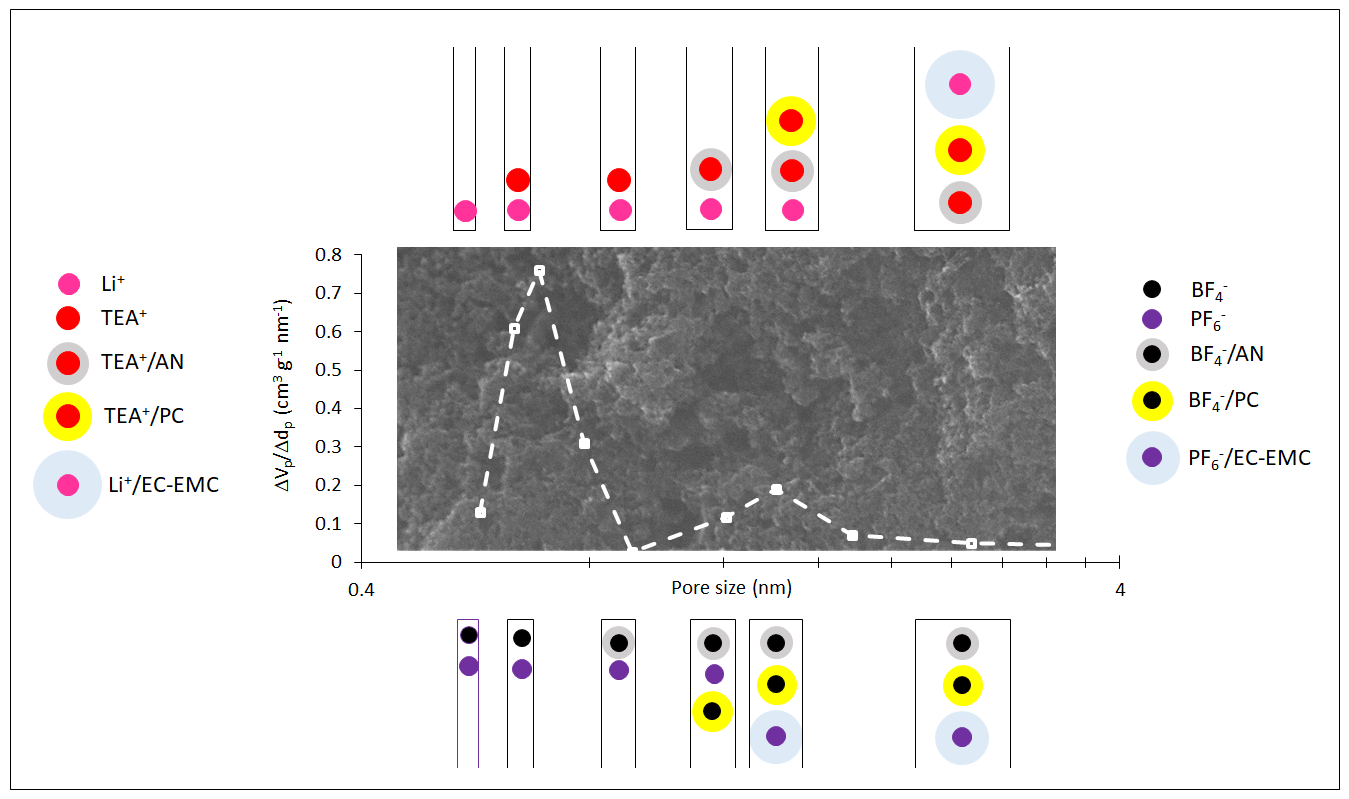
Table 2 presents the ion parameters for different electrolyte solutions, as discovered in the literature. It seems that both ACF fabric and AC coating have their major peak in their PSD in Figure 3, at 0.64 and 0.68 nm respectively, at the appropriate pore size to accommodate the TEA+ desolvated ion in the TEABF4 electrolytes and, thus, maximize specific capacitance. ACF also has also a smaller peak at 0.57 nm that can just accommodate the Li+ desolvated ion in the Li-ion electrolyte.
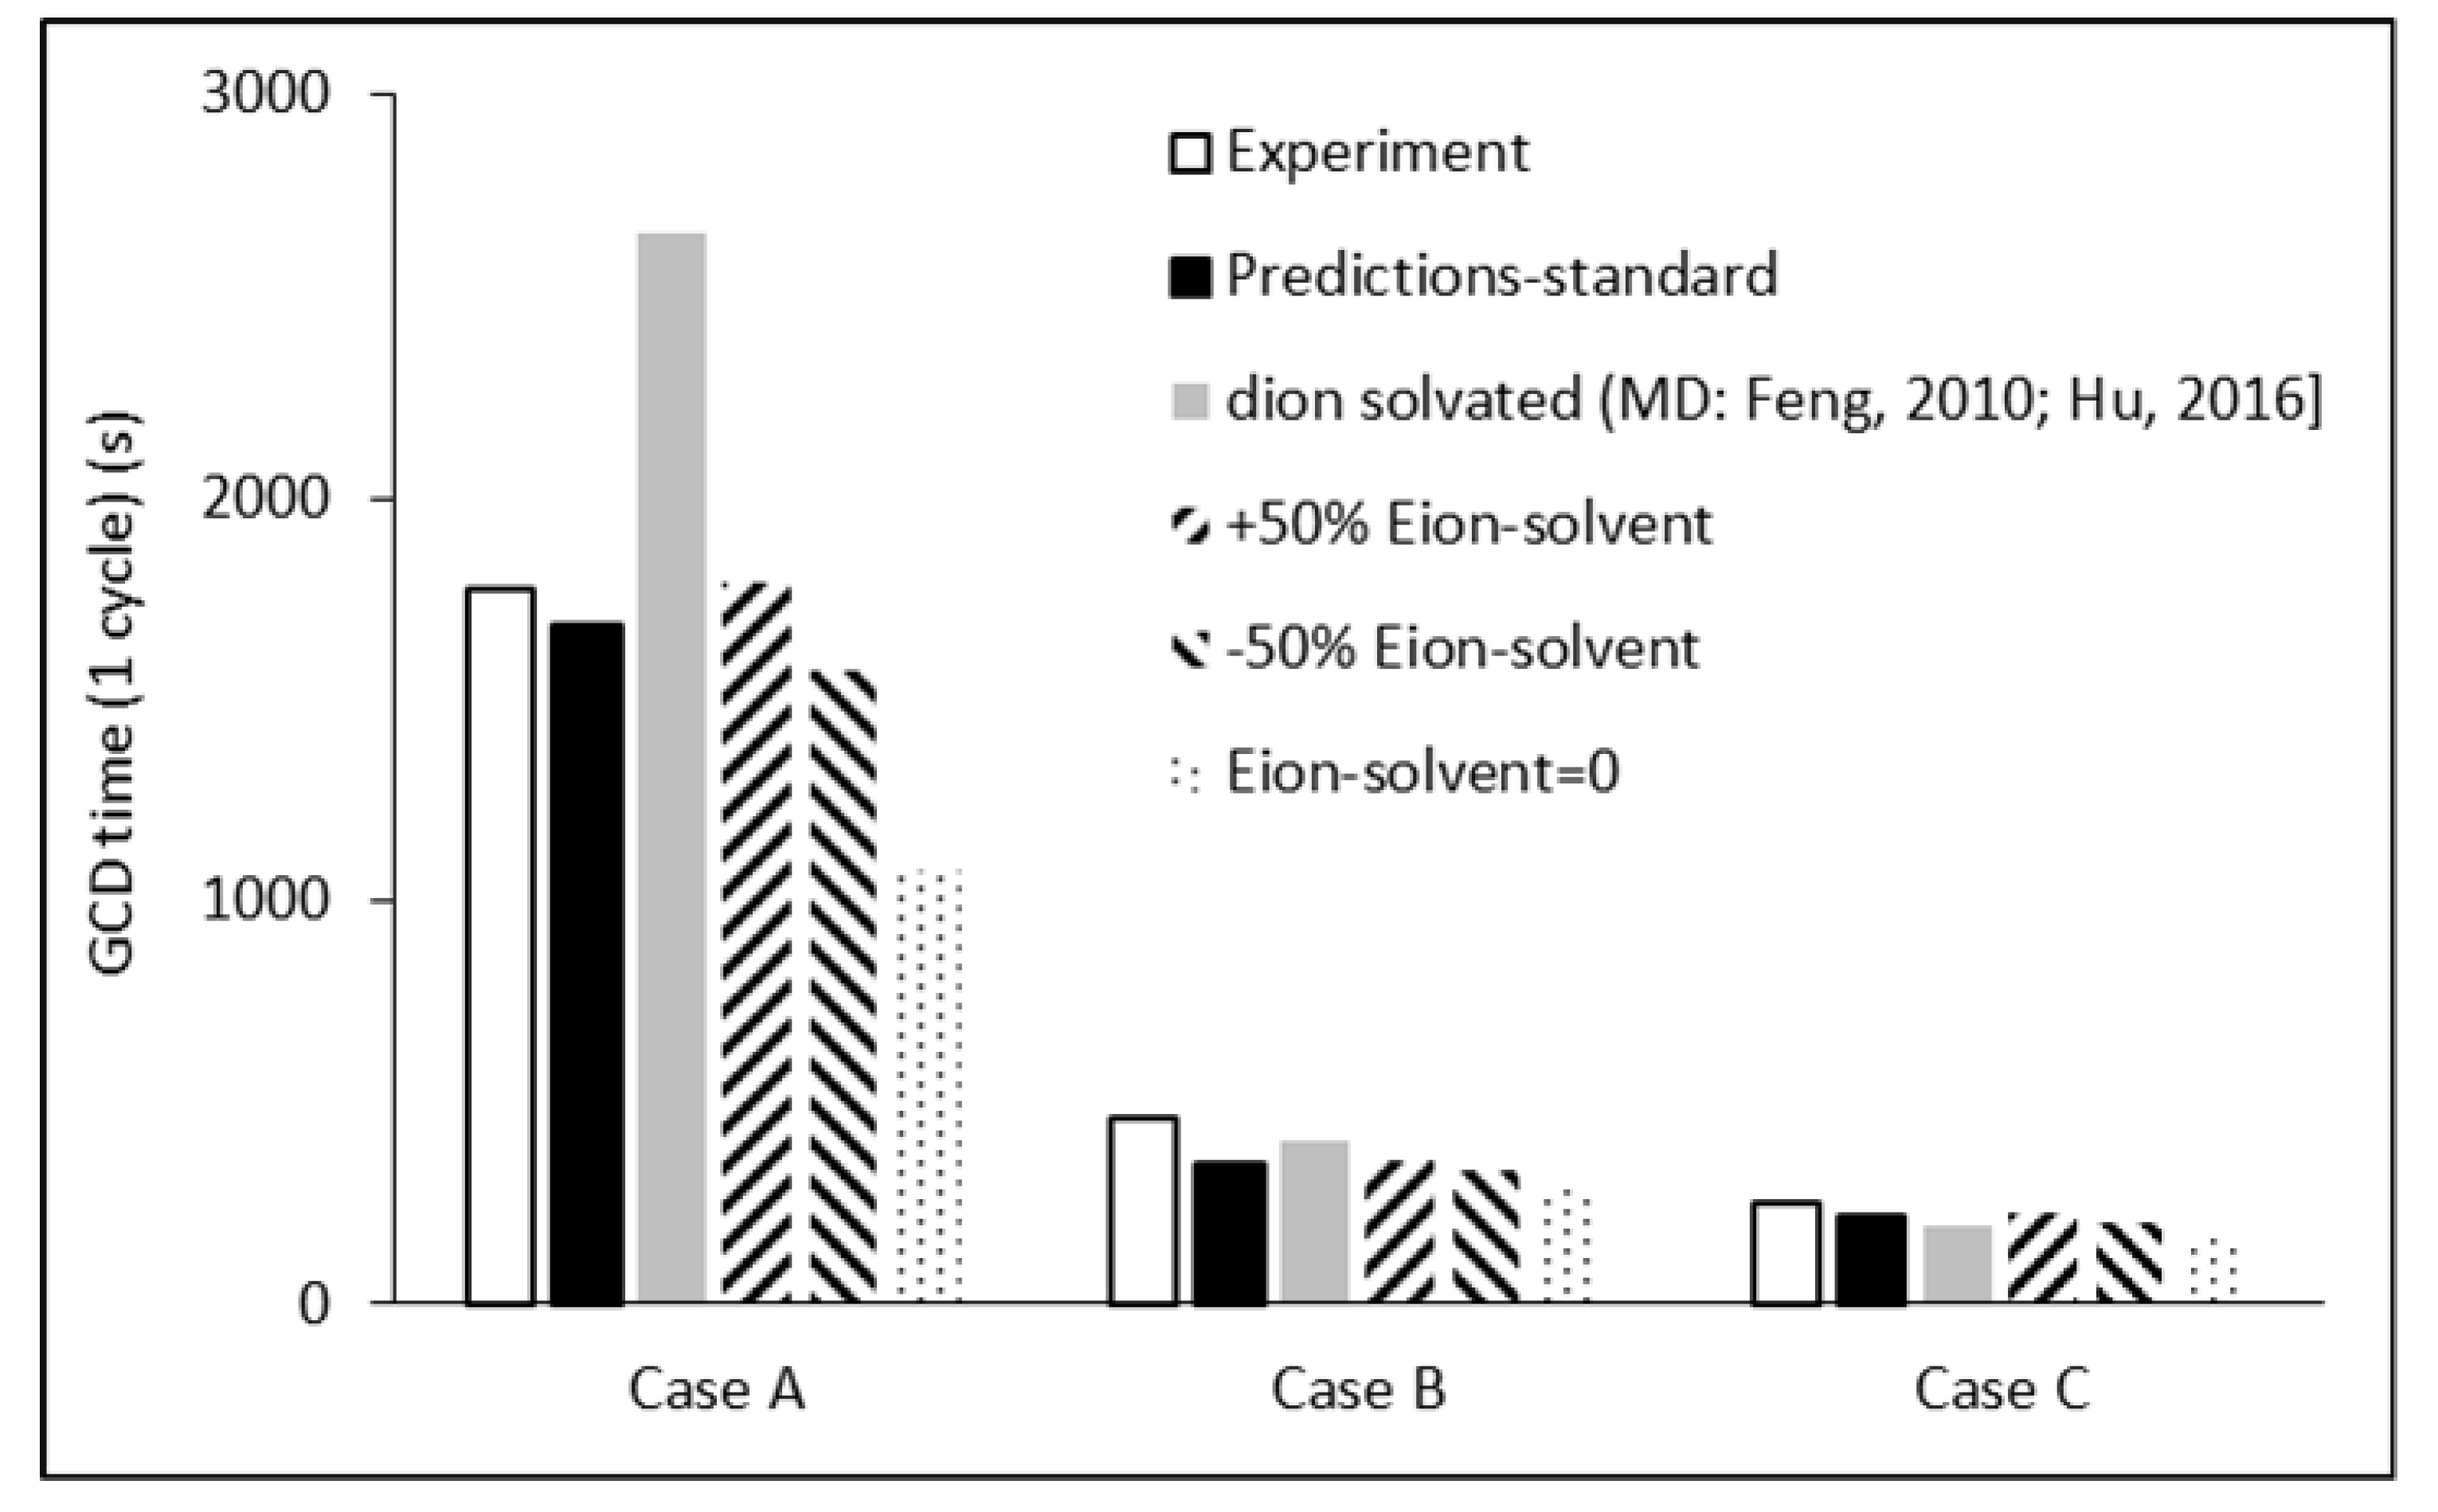
The first step was to conduct a sensitivity analysis of the proposed model, in a GCD simulation at 2.5 mA cm−2 for the examples of Cases A, B, and C. The graph in Figure 4 contains the experimental data, the predictions with the electrolyte data of Table 2 used in the simulations (Figure 4—predictions standard), a simulation with size of solvated ions as the center-of-mass radial distribution function (RDF) predicted directly from MD simulations by Feng for AN solvent [31] and Hu for PC solvent [63], and parametric studies of changing the desolvation energy by +50%, −50%, and Eion/solvent = 0. The model and algorithm are very sensitive to large solvated ions for electrode materials with the largest pore size peak smaller than the solvated ion as in Case A: ACF fabric, dp,peak = 1.31 nm in Figure 3b against dTEA+/AN = 1.55 nm from MD simulations. Hence, the solvated ion dimensions determined from a simple Van der Waals volume method in Table 2 yield better predictions, closer to the experimental data in Figure 4 for Case A than the solvated ion size from MD simulations and, hence, are used as input data in the simulations henceforth. Changes in the desolvation energy by ±50% bring relatively small changes in the total GCD cycle, of the order of 5% on average. Setting Eion/solvent = 0 brings much greater changes in the total GCD cycle, in the range of 20–35% (36% in Case A, 16% in Case B and 23% in Case C) compared to the predictions from a standard simulation.
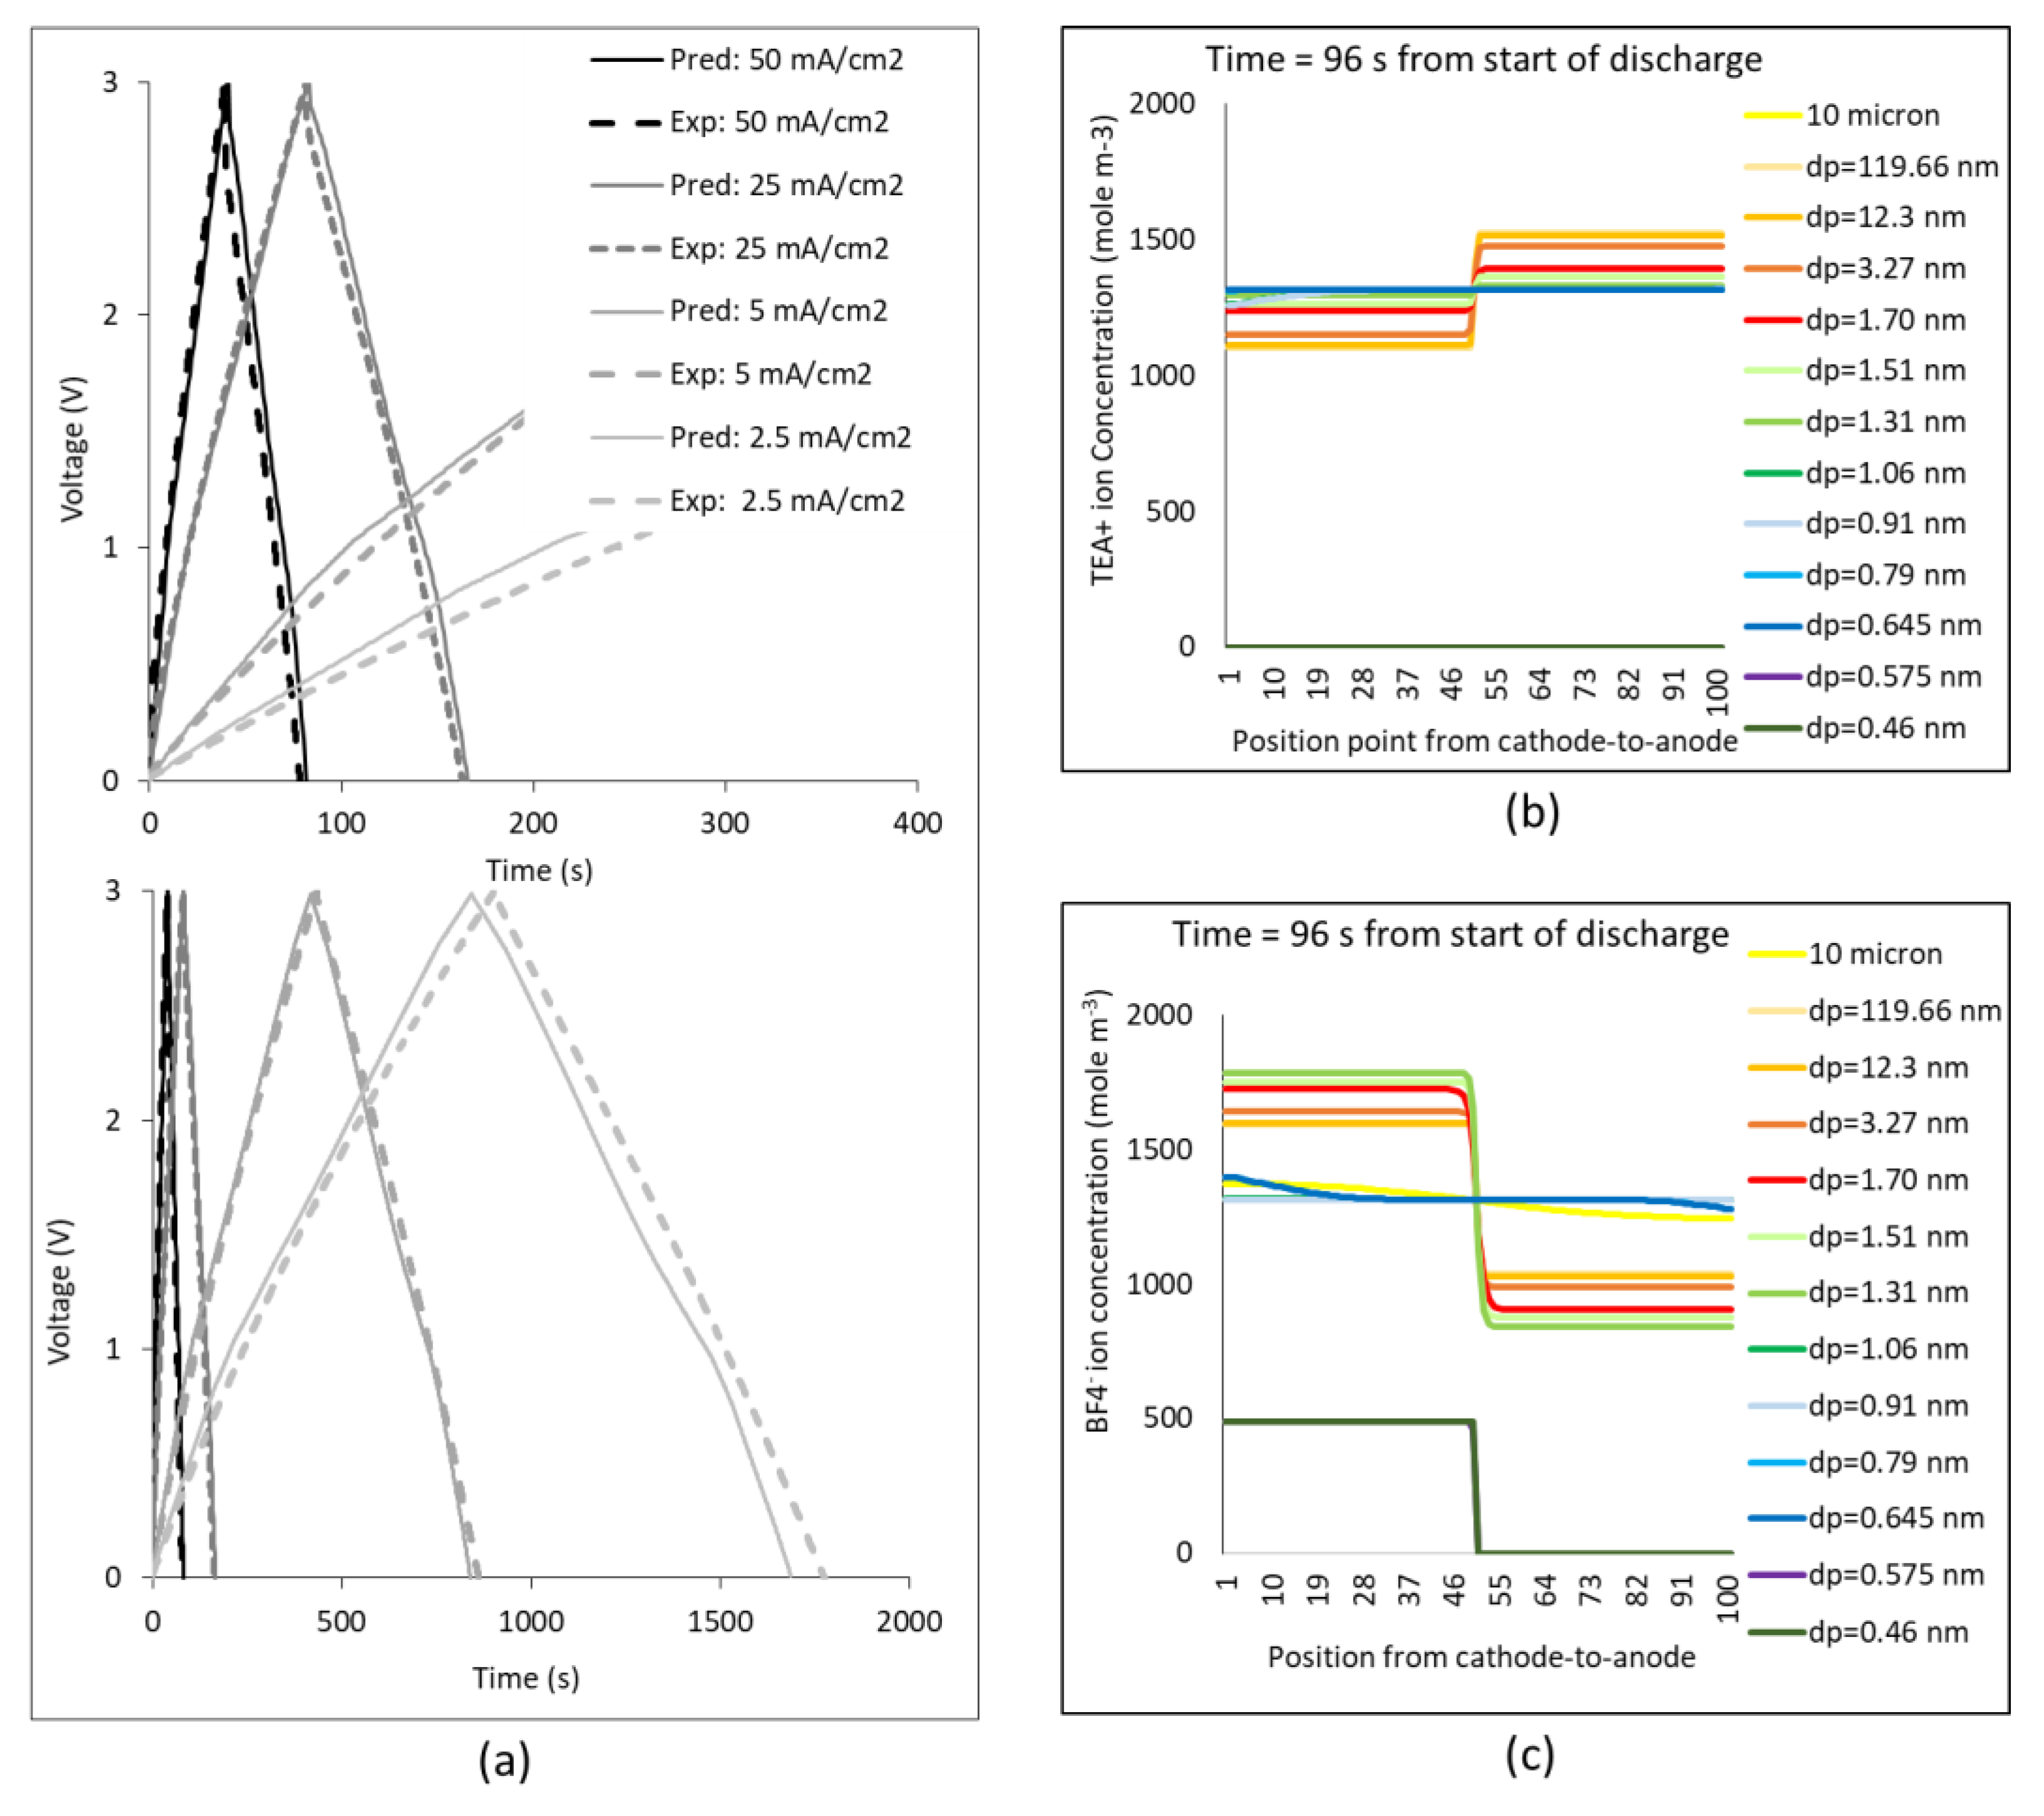
Figure 5a presents the predicted charge–discharge curves for Case Study A at four different current densities: 2.5, 5, 25 and 50 mA cm−2 and the experimental data for the corresponding case study from [18,62]. Generally, good agreement can be seen between predictions and experimental data. At the high current of 50 mA cm−2, at the beginning of discharge, the voltage drop due to commonly known reasons of equivalent-in-series resistance and ion diffusion in equivalent electric circuit models [2] seems to follow a parallel trend to that of the experimental line. The prediction curves at all currents seem to have a small change in slope around 0.8–1.1 V, especially visible at the low currents, reminiscent of small intercalation bumps in pseudocapacitors [64].
Figure 5b,c displays the predicted TEA+ and BF4− ion concentration profiles across the EDLC cell, from the cathode to the anode, 96 s after the start of discharge in a GCD cycle at the low current of 2.5 mA cm−2 for Case A. Apart from the change, either side of the separator in the middle of the cell, the ion concentration profiles are generally flat in the main cathode and main anode region, all the way to the border with the corresponding current collector. At 11% time of the full discharge, there is still most charge stored in the respective electrodes: as expected, there is still a deficiency of TEA+ ions in the cathode and an excess of TEA+ ions in the anode, and the opposite happens with the BF4− ions.
Figure 6 presents the ion concentration profiles at x = 0 (cathode/current collector) and x = L (anode/current collector) against time for Case A. The ion transport across the electrodes is fully captured: during charge, the TEA+ ion concentration decreases in the cathode and increases in the anode, whereas the BF4−ion concentration increases in the anode and decreases in the cathode; the reverse happens during discharge. Solvated TEA+ ion transport takes place in macro-, meso- and micropores down to 1.31 nm pore size, and desolvated TEA+ ions are transported in pores of 1.06 and 0.91 nm size. The TEA+ ion concentration in the pores of 0.79 nm and 0.645 nm remains constant, as the initial electrolyte concentration, indicating no noticeable ion transport in these pores, which is attributed to the low ion diffusivity due to high pore constrictivity for these small micropores. BF4−ion concentration changes in all pore sizes in the cathode, indicating ion transport in all pores in desolvated state for pores smaller than 0.85 nm. While the 0.58 nm and 0.46 nm pores did not contain any electrolyte initially, as these pores cannot accommodate the TEA+ ions (even desolvated), desolvated BF4−ions are still transported in the cathode and their concentration rises to a maximum of 209 mole m−3 at the end of charge. In the anode, a restriction was placed to the motion of BF4−ions in the model and computer algorithm for pores smaller than dTEA+ = 0.67 nm, following the findings in in situ NMR studies of cation adsorption only in the anode [65]. In addition, the predictions in Figure 6 go beyond this restriction, as they demonstrate that there is no BF4− ion transport in the cathode for dp ≤ 0.91 nm (constant BF4−concentration equal to the initial concentration in those pores), which is attributed to pore constrictivity reducing the diffusion coefficient and high ion concentration effects in these small pore sizes in the anode. These predictions capture the findings of Forse et al. [65] without the need for the additional externally imposed restriction in the algorithm. On the other hand, ion exchange occurs for the bigger micro- and also the meso- and macropores in the anode, also agreeing with the findings of the NMR study by Deschamps et al. [66]. Examining the small bumps in the predicted voltage profile in Figure 5a in relation to the ion concentration profiles in different pore sizes in Figure 6, the following observations have been made: (i) the small bump at 1.1 V (209 s) during charge is attributed to the desolvation of TEA+ and its start of migration and diffusion into the smallest anode pore, dp = 0.91 nm, when it enters the simulation results during charge; (ii) the small bump at 0.9 V (1490 s) during discharge is attributed to the desolvation of BF4− and its start of migration and diffusion into the smallest anode pore, dp = 0.645 nm, when it returns during discharge.
Similar trends are observed in the ion concentration profiles versus time for Case B in Figure 7, The difference is that, due to the larger proportion of larger micropores and mesopores in the AC coating electrodes in Case B according to the PSD in Figure 3d compared to the ACF electrodes in Case A (PSD in Figure 3b), these larger pores facilitate ion transport in Case B, which results in a higher maximum concentration of TEA+ ions in the smallest micropore 0.91 nm in size, into which they are transported, than in Case A for the same size micropore. In both cases, ion desolvation took place before the TEA+ ions enter the 0.91 nm micropore. The ion concentration profiles against time for Case C in Figure 7 display smaller rise or decrease in ion concentration at the end of charge than in Case B, where both cases have the same AC coating electrodes but different electrolyte solvent, with PC in Case C being a larger molecule than AN in Case B, resulting in reduced ion transport rate because of lower diffusivity due to pore constrictivity against the larger PC-solvated ions. The smaller pore size accessible by desolvated TEA+ ions is 1.2 nm, whereas desolvated BF4−ions reach the smallest pores of 0.49 nm in the cathode. In the anode, there is no transport of BF4− ions for pores smaller than 1.2 nm, agreeing with the findings of Forse et al. [65] in their in situ NMR studies.
Case studies D and E involve electrolyte 1M LiPF6 in EC:EMC 50:50 v/v with the predicted ion concentration profiles against time presented in Figure 8. Linear profiles of the Li+ concentration are depicted for both types of electrodes, AC coating (Case D) and ACF fabric (Case E), due to the small size of desolvated Li+, which allows for easier transport through small micropores than TEA+ in the previous organic electrolyte systems. An ion exchange mechanism is followed in both case studies.
The maximum change in Li+ concentration in Figure 8 occurs in 1.4 nm, 1.6 nm and 1.77 nm pores for Case D, and 1.5 nm and 1.7 nm for Case E, where all these pores contain deformed solvated Li+ ions. In discharge, Li+ concentration decreases also linearly to the original 1 M concentration for most pore sizes, apart from the 119 nm macropore, which empties to 1 M after some delay. The maximum rise in the PF6− concentration profiles in the cathode occurs in 2.9 nm, 3.6 nm, 14.6 nm and 119 nm pores for Case D, and 3.3, 12.3 and 119 nm for Case E, in which the solvated anion can move easily (see Table 2). The slower transport of PF6− in pores smaller than 1.8 nm corresponds to the limit of the tetrahedral solvated Li+ ion [38], and seems to be linked to the ion exchange mechanism, where a lag is encountered for the PF6− concentration to rise at the start of charge. In the anode, the delay of the PF6− to return to 1 M in pores smaller than 1.2 nm at the end of discharge is due to the fact of insufficient electrochemical energy to overcome the desolvation energy barrier towards the end of discharge for PF6− to desolvate and return to the small pores. This creates a chain effect in delaying to empty the cathode macropore of 119 nm from PF6− ions, as well as delaying emptying the anode macropore of 119 nm of Li+ ions.
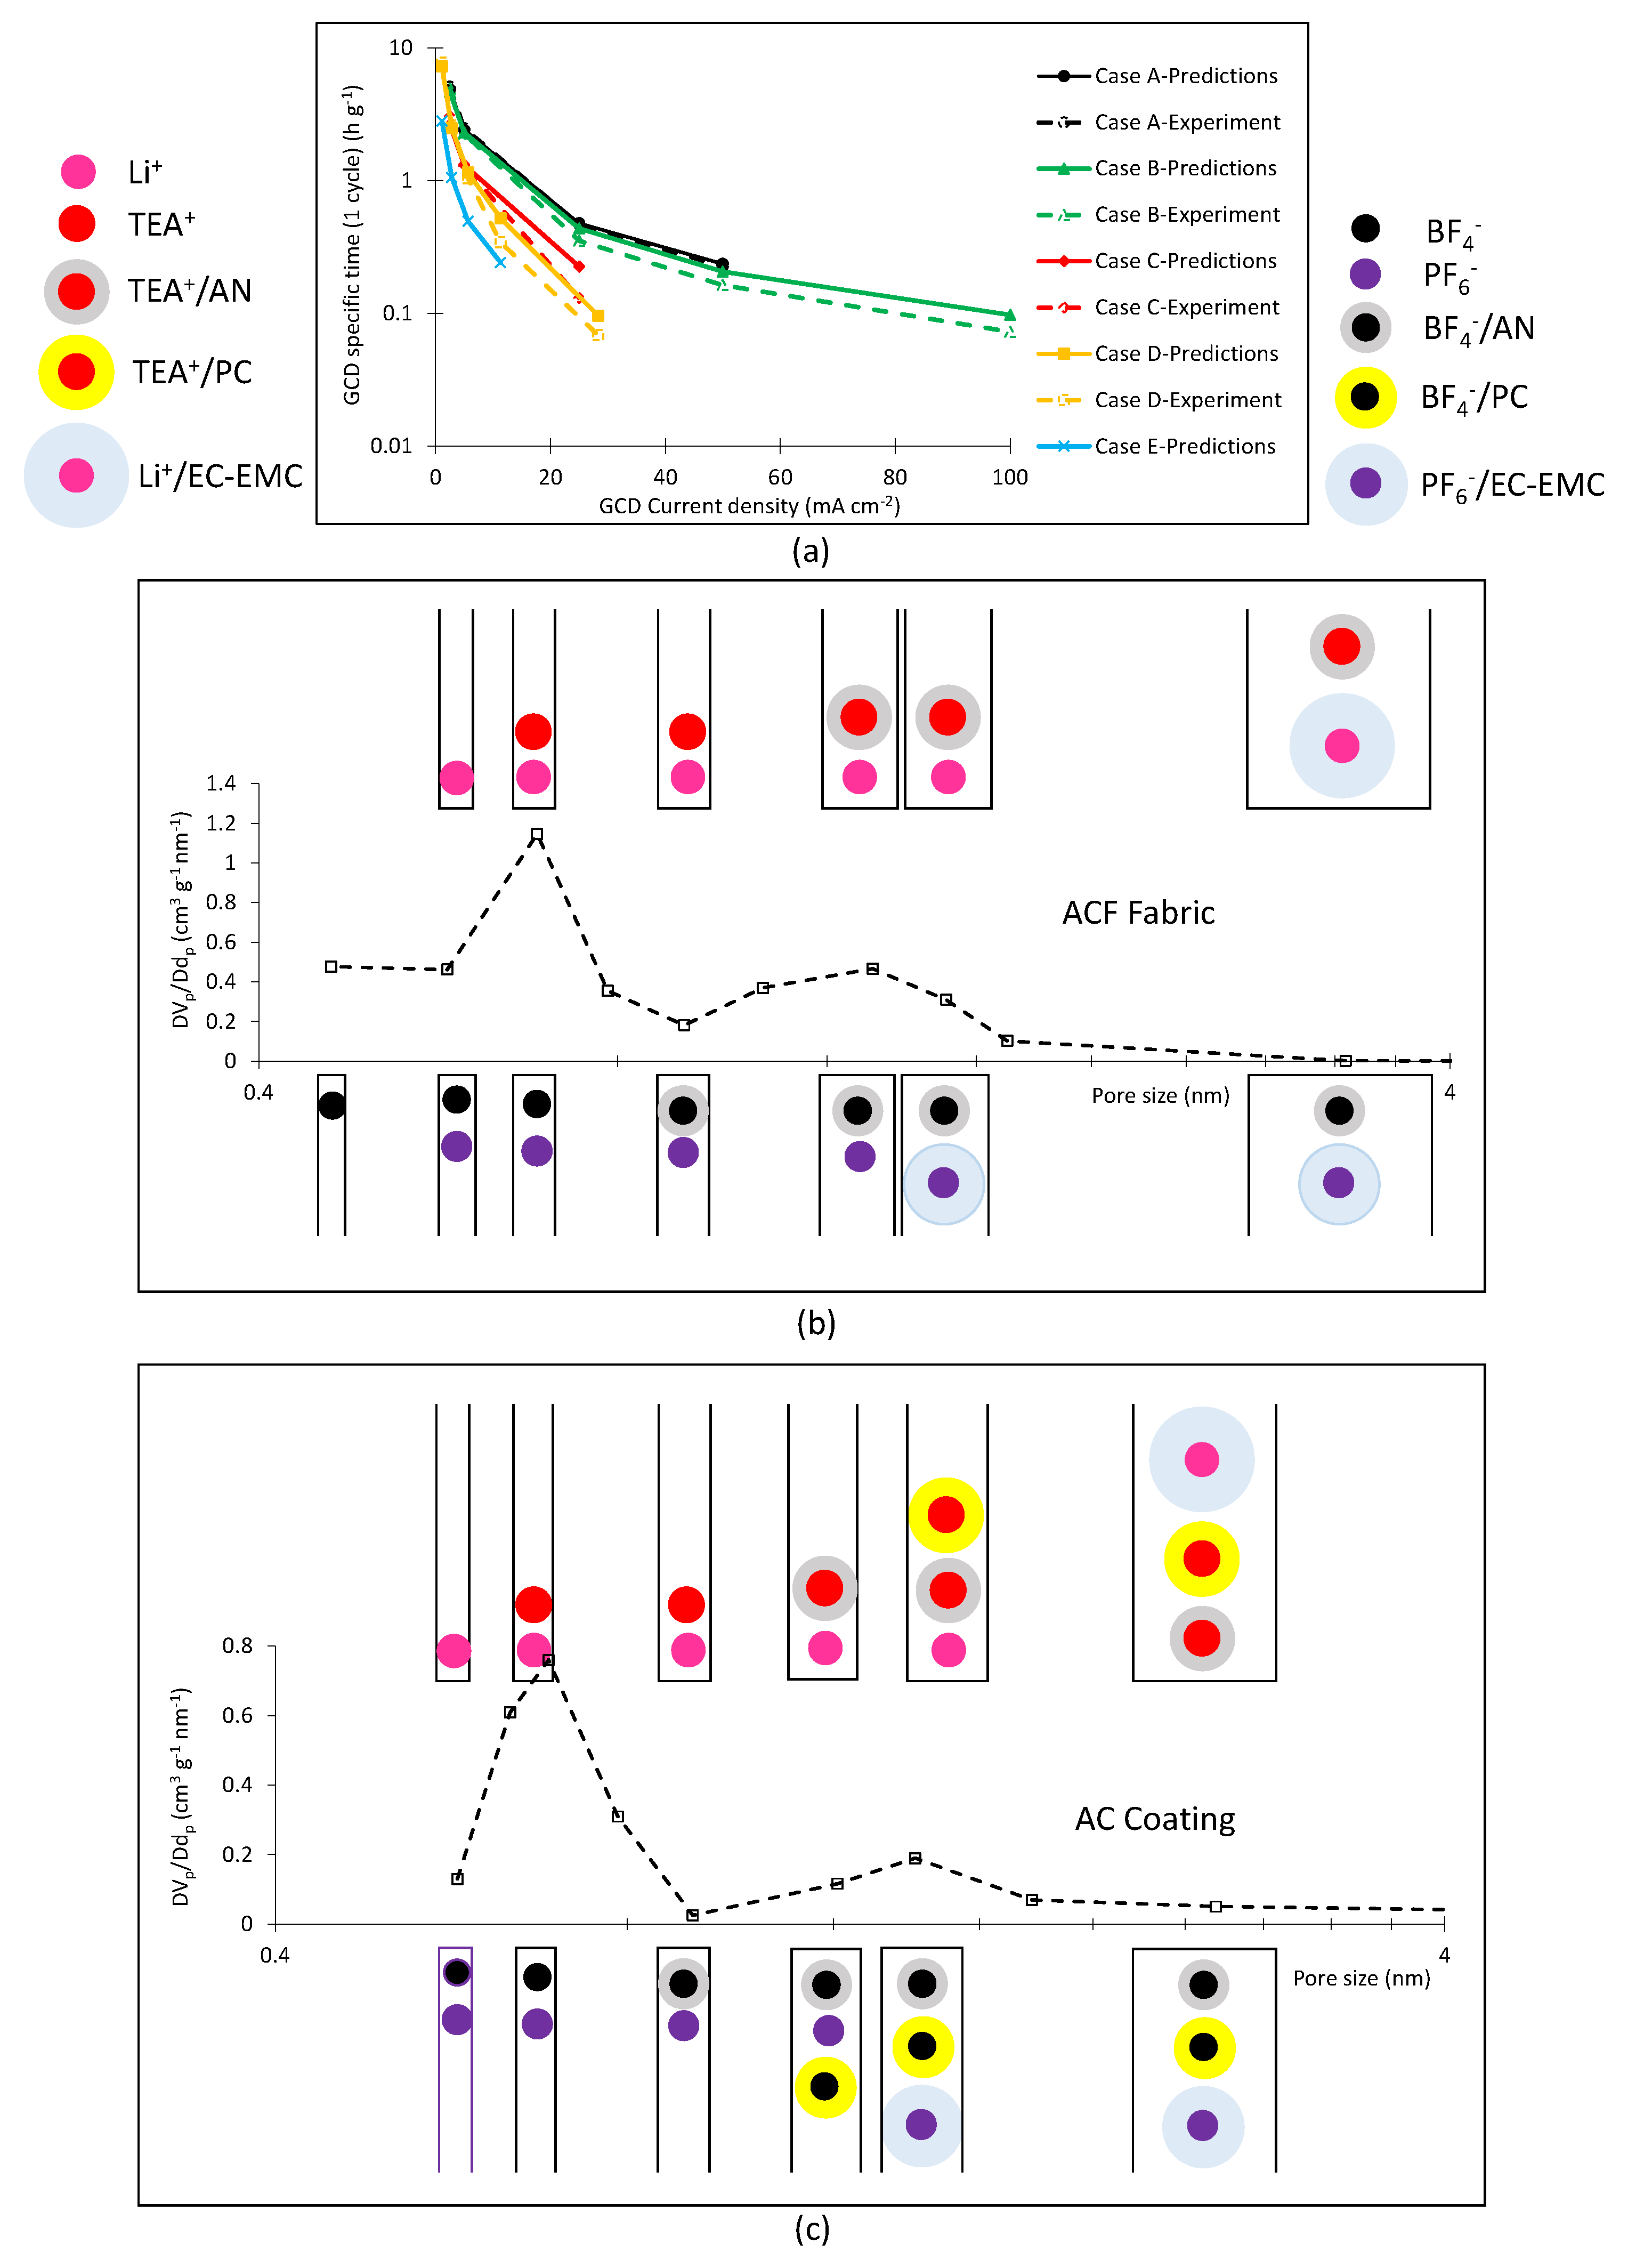
Figure 9a presents the predicted GCD time duration of the tested EDLCs at different current densities, normalized by the mass of the two electrodes of the EDLC to cater for differences in the electrode areal density and size of cells. Experimental data were available [16,18,38,62] for Cases A, B, C and D and are used to compare with predictions and validate the numerical model. In all cases, the experimental specific GCD cycle (per gram of electrodes) is 5–10% longer than the predictions at the lowest tested current density, related to possibly a little slower desolvated ion generation and diffusion in the predictions than in the experiment, which apart from the value of binding energy might also be due to the limited number of points in the discretized pore size distribution inputted in the simulations. On the other hand, the predicted specific GCD cycle is a little longer than the experimental data at high current density.
4. Discussion
The predicted differences between the performance of the different Cases presented in Figure 9a are fully reflected in the experimental data. Figure 9b,c illustrate the relationship between ion size (solvated or desolvated) and pore size from the discretized PSD lines inputted in the computer simulations, for ACF fabric and AC coating, respectively, to aid explaining these differences in performance. It must be noted that pores smaller than the desolvated ion size are not in use during the operation of EDLC. The importance of the relation between solvated or desolvated ion size and pore size of supercapacitor electrodes, as well as the ease of ion desolvation for different solvents, has been recognized in the past ([67], for example). The advantage of the present design study is the use of a comprehensive ion transport model, incorporating the pore size distribution, the ion transport in the form of solvated or desolvated ion and the use of binding energy to control ion desolvation when compared to the available electrochemical (and thermal) energy. As a result, the findings in this study are quantitative with predicted GCD cycle.
Case D exhibits the longest specific GCD cycle at the lowest tested current density, which is related to the best specific capacitance, which is attributed to (a) the smallest size of the desolvated cation (Li+ compared to TEA+) that allows a high concentration of Li+ ions to line the pore walls in the Stern monolayer and (b) the good accessibility of the AC coating micropores due to the good portion of meso- and large micropores in the AC coating allowing transport of the large solvated ion Li+/EC-EMC (Figure 9c). On the other hand, Case E with ACF fabric electrodes and the same electrolyte has about 1/3 of the specific GCD time of Case D because of poor accessibility of its large micropore surface area by the cations, which is due to the fact that ACF fabric (Figure 9b) has 1/30 of the specific pore volume of AC coating of meso- and large micropores, allowing transport of the large solvated ion Li+/EC-EMC. Increasing the current density shortens the specific GCD cycle of Cases D and E much faster than in Cases A, B and C. This is attributed to the size of solvated ion Li+/EC-EMC, which is much larger than that of the other two solvated cations of the other electrolytes, TEA+/AN and TEA+/PC, slowing down solvated ion transport in meso- and large micropores, which governs the EDLC performance at medium and high current densities. In fact, the large solvated cation effect against the available meso- and large micropore specific volume reduces the limit of maximum current density in the operation of Cases D and E, but also in Case C which has the next largest solvated cation TEA+/PC.
Case B, AC coating electrodes with 1.5 M TEABF4/AN electrolyte, has the most balanced overall performance features for an EDLC, with a good specific capacitance across a large range of current densities, which is attributed to the reasonable specific surface area of the AC coating and good accessibility of micropores by cations, due to the good transport of the smallest solvated cation TEA+/AN amongst all investigated electrolytes, and the good proportion of meso- and large micropores in the AC coating being able to accommodate the motion of the solvated ions. In all discussions, the focus has been on the size of the cation, as the solvated anions are all smaller than their associated solvated cations, and the desolvated anions are smaller than or of similar size as the desolvated cations.
5. Conclusions
The study has demonstrated the usefulness of the volume-averaged continuum model of ion transport through porous electrodes in supercapacitors, taking into account the pore size distribution. Such a model allows confidence in the design of the porous electrodes in terms of optimizing their pore size distribution for a certain or a specified range of electrolytes. An AC coating with a very good specific surface area, for high specific capacitance, and a good proportion of mesopores, for solvated ion transport and accessibility of micropores, may be designed to be suitable for a range of medium maximum voltage electrolytes, from the best EDLC electrolyte TEABF4/AN to the lower-volatility electrolyte TEABF4/PC, to Li-ion electrolytes used in LICs and hybridized battery-supercapacitor devices. Although EDLCs with Li-ion electrolytes might not reach the highest current densities of EDLCs with electrolyte TEABF4/AN, their maximum current density, at 10C of the battery, for example, in a hybridized battery-supercapacitor device, is still a low current density for an EDLC. Furthermore, Li-ion electrolytes bring the highest specific capacitance at a very low current density, equivalent to 0.1C or 1C of the battery part in a hybridized battery-supercapacitor device.
Author Contributions
Conceptualization, C.L.; methodology, J.B., F.M., C.L. and G.M.L.; software, J.B. and C.L.; validation, J.B. and C.L.; formal analysis, J.B., F.M., C.L. and G.M.L.; investigation, J.B. (experiment, simulations), F.M. (molecular modeling of TEABF4 electrolyte ions), C.L. (simulations) and G.M.L. (experiment: N2 adsorption/desorption experiments); resources, C.L.; data curation, C.L.; writing—C.L. and J.B.; supervision, C.L.; funding acquisition, C.L. All authors have read and agreed to the published version of the manuscript.
Funding
This research was partially funded by EPSRC under the HiPoBat project: ISCF Wave 1: High Power Material Hybridized Battery, EP/R022852/1.
Institutional Review Board Statement
Not applicable.
Informed Consent Statement
Not applicable.
Data Availability Statement
Data are available from the corresponding author, after reasonable request, for research purposes.
Conflicts of Interest
The authors declare no conflict of interest.
Appendix A

Table A1.
Equations of the continuum model of the electrochemical processes in EDLCs.
| Mass ion transport equations for all pore sizes p (p = 1 to Np) and ions i (i = + and −): | (A1) |
| Current flux of ion i from pore p − 1 to pore p: | (A2) |
| Decay factor if electrochemical energy, EEC, is less than : | (A3) |
| Desolvation energy barrier for dion < dp < dsolv.ion+ (for larger pores: Δni = 0): | (A4) |
| (A5) | |
| (A6) | |
| (A7) | |
| (A8) | |
| (A9) | |
| (A10) | |
| (A11) | |
| Poisson equation: | (A12) |
| (A13) | |
| (A14) | |
| (A15) | |
| (A16) | |
| (A17) | |
| (Nernst-Einstein equation) | (A18) |
| Initial conditions, at t = 0, before the first charge: for dp > dion,i and for dp < dion,i i1 = i2 = 0. ϕ1 = ϕ2 = 0. | (A19) |
| Boundary conditions: At x = xS (separator): i1 = 0 ϕ1 = 0 At x = 0 and x = L (current collector/cathode or anode): │i1│= io, the current density in galvanostatic charge-discharge. | (A20) |
where subscript p: pore size p, where p is integer from 1 to Np; subscript i: + (positive ion) or − (negative ion).
Variables: t: time; x: the through-thickness direction in the cell from x = 0 at the current collector of the cathode to x = L at the current collector of the anode; αi,p: volume fraction of i ion in volume of pore p; ci,p: molar concentration of i ion in volume of pore p; i1: electron current density in solid phase; i2: ion current density in the electrolyte phase; ϕ1: potential of solid-phase; ϕ2: potential of electrolyte phase in the non-Stern region.
Properties: : diffusion coefficient of ion i in pore p; δi,p: constrictivity of ion i in pore p; ti,p: transference number of ion i in pore size p; η: viscosity of electrolyte: determined by equations given in Table 1.
Electrode: vp, Ap and εp: specific pore volume, specific wall surface area and pore fraction of pore p: specified from the experimental data of Section 2 and Section 3.
Electrolyte: Vi: volume of ion i; ΔΕi,p: desolvation energy barrier in ion i in pore p; Ei: solvation energy for first solvent shell around ion i; ni: coordination number of ion i; Δni: change of coordination number in desolvation of ion i in small micropore; ηο: viscosity of solvent; εr: relative permittivity of the electrolyte; kd: dissociation constant: input data with values listed in Table A1.
General parameters and variables: zi number of transferred electrons for ion i; NA: Avocadro’s number; F: Faraday constant; R: ideal gas constant; kB: Boltzmann constant, εo: vacuum permittivity; T: absolute temperature.
References
- Simon, P.; Gogotsi, Y. Perspectives for electrochemical capacitors and related devices. Nat. Mater. 2020, 19, 1151–1163. [Google Scholar] [CrossRef] [PubMed]
- Markoulidis, F.; Lei, C.; Lekakou, C. Investigations of activated carbon fabric-based supercapacitors with different interlayers via experiments and modelling of electrochemical processes of different timescales. Electrochim. Acta 2017, 249, 122–134. [Google Scholar] [CrossRef]
- Pina, A.C.; Amaya, A.; Marcuzzo, J.S.; Rodrigues, A.C.; Baldan, M.R.; Tancredi, N.; Cuña, A. Supercapacitor Electrode Based on Activated Carbon Wool Felt. C J. Carbon Res. 2018, 4, 24. [Google Scholar] [CrossRef] [Green Version]
- Lei, C.; Amini, N.; Markoulidis, F.; Wilson, P.; Tennison, S.; Lekakou, C. Activated carbon from phenolic resin with controlled mesoporosity for an electric double-layer capacitor (EDLC). J. Mater. Chem. A 2013, 1, 6037–6042. [Google Scholar] [CrossRef]
- Lei, C.; Lekakou, C. Activated carbon–carbon nanotube nanocomposite coatings for supercapacitor applications. Surf. Coat. Technol. 2013, 232, 326–330. [Google Scholar] [CrossRef]
- Reece, R.; Lekakou, C.; Smith, P.A. A High-Performance Structural Supercapacitor. ACS Appl. Mater. Interfaces 2020, 12, 25683–25692. [Google Scholar] [CrossRef]
- Vermisoglou, E.C.; Giannakopoulou, T.; Romanos, G.; Giannouri, M.; Boukos, N.; Lei, C.; Lekakou, C.; Trapalis, C. Effect of hydrothermal reaction time and alkaline conditions on the electrochemical properties of reduced graphene oxide. Appl. Surf. Sci. Part A 2015, 358, 100–109. [Google Scholar] [CrossRef]
- Liu, G.; Yu, Z.; Neff, D.; Zhamu, A.; Jang, B.Z. Graphene-based supercapacitor with an ultrahigh energy density. Nano Lett. 2010, 10, 4863–4868. [Google Scholar] [CrossRef]
- Yang, H.; Kannappan, S.; Pandian, A.S.; Jang, J.-H.; Lee, Y.S.; Lu, W. Graphene supercapacitor with both high power and energy density. Nanotechnology 2017, 28, 445401. [Google Scholar] [CrossRef] [PubMed]
- Vermisoglou, E.C.; Giannakopoulou, T.; Romanos, G.; Boukos, N.; Psycharis, V.; Lei, C.; Lekakou, C.; Petridis, D.; Trapalis, C. Graphene-based materials via benzidine-assisted exfoliation and reduction of graphite oxide and their electrochemical properties. Appl. Surf. Sci. 2017, 392, 244–255. [Google Scholar] [CrossRef]
- Reece, R.; Lekakou, C.; Smith, P.A.; Grilli, R.; Trapalis, C. Sulphur-linked graphitic and graphene oxide platelet-based electrodes for electrochemical double layer capacitors. J. Alloy. Compd. 2019, 792, 582–593. [Google Scholar] [CrossRef]
- Vermisoglou, E.C.; Giannakopoulou, T.; Romanos, G.E.; Boukos, N.; Giannouri, M.; Lei, C.; Lekakou, C.; Trapalis, C. Non-activated high surface area expanded graphite oxide for supercapacitors. Appl. Surf. Sci. Part A 2015, 358, 110–121. [Google Scholar] [CrossRef]
- Lekakou, C.; Moudam, O.; Markoulidis, F.; Andrews, T.; Watts, J.F.; Reed, G.T. Carbon-based fibrous EDLC capacitors and supercapacitors. J. Nanotechnol. 2011. [Google Scholar] [CrossRef] [Green Version]
- Izadi-Najafabadi, A.; Yamada, T.; Futaba, D.N.; Yudasaka, M.; Takagi, H.; Hatori, H.; Iijima, S.; Hata, K. High-power supercapacitor electrodes from single-walled carbon nanohorn/nanotube composite. ACS Nano 2011, 5, 811–819. [Google Scholar] [CrossRef] [PubMed]
- Markoulidis, F.; Lei, C.; Lekakou, C. Fabrication of high-performance supercapacitors based on transversely oriented carbon nanotubes. Appl. Phys. A 2013, 111, 227–236. [Google Scholar] [CrossRef]
- Markoulidis, F.; Lei, C.; Lekakou, C.; Duff, D.; Khalil, S.; Martorana, B.; Cannavaro, I. A method to increase the energy density of supercapacitor cells by the addition of multiwall carbon nanotubes into activated carbon electrodes. Carbon 2014, 68, 58–66. [Google Scholar] [CrossRef]
- Markoulidis, F.; Todorova, N.; Grilli, R.; Lekakou, C.; Trapalis, C. Composite electrodes of activated carbon and multiwall carbon nanotubes decorated with silver nanoparticles for high power energy storage. J. Compos. Sci. 2019, 3, 97. [Google Scholar] [CrossRef] [Green Version]
- Fields, R.; Lei, C.; Markoulidis, F.; Lekakou, C. The Composite supercapacitor. Energy Technol. 2016, 4, 517–525. [Google Scholar] [CrossRef] [Green Version]
- Vermisoglou, E.C.; Giannouri, M.; Todorova, N.; Giannakopoulou, T.; Lekakou, C.; Trapalis, C. Recycling of typical supercapacitor materials. Waste Manag. Res. 2016, 34, 337–344. [Google Scholar]
- Kampouris, E.M.; Papaspyrides, C.D.; Lekakou, C.N. A model recovery process for scrap polystyrene foam by means of solvent systems. Conserv. Recycl. 1987, 10, 315–319. [Google Scholar] [CrossRef]
- Kampouris, E.M.; Papaspyrides, C.D.; Lekakou, C.N. A model process for the solvent recycling of polystyrene. Polym. Eng. Sci. 1988, 28, 534–537. [Google Scholar] [CrossRef]
- Murugesh, A.K.; Uthayanan, A.; Lekakou, C. Electrophoresis and orientation of multiple wall carbon nanotubes in polymer solution. Appl. Phys. A 2010, 100, 135–144. [Google Scholar] [CrossRef]
- Huang, J.; Sumpter, B.G.; Meunier, V. Theoretical model for nanoporous carbon supercapacitors. Angew. Chem. Int. Ed. 2008, 47, 520–524. [Google Scholar] [CrossRef] [PubMed]
- Xiao, J.; Mei, D.; Li, X.; Xu, W.; Wang, D.; Graff, G.L.; Bennett, W.D.; Nie, Z.; Saraf, L.V.; Aksay, I.A.; et al. Hierarchically porous graphene as a lithium-air battery electrode. Nano Lett. 2011, 11, 5071–5078. [Google Scholar] [CrossRef] [PubMed]
- Feng, N.; Mu, X.; Zheng, M.; Wang, C.; Lin, Z.; Zhang, X.; Shi, Y.; He, P.; Zhou, H. A multi-layered Fe2O3/graphene composite with mesopores as a catalyst for rechargeable aprotic lithium–oxygen batteries. Nanotechnology 2016, 27, 365402. [Google Scholar] [CrossRef]
- Shui, J.; Lin, Y.; Connell, J.W.; Xu, J.; Fan, X.; Dai, L. Nitrogen-doped holey graphene for high-performance rechargeable Li−O2 batteries. ACS Energy Lett. 2016, 1, 260–265. [Google Scholar] [CrossRef]
- Xu, G.; Ding, B.; Nie, P.; Shen, L.; Dou, H.; Zhang, X. Hierarchically porous carbon encapsulating sulfur as a superior cathode material for high performance lithium−sulfur batteries. ACS Appl. Mater. Interfaces 2014, 6, 194–199. [Google Scholar] [CrossRef]
- Robinson, J.; Xi, K.; Kumar, R.V.; Ferrari, A.C.; Au, H.; Titirici, M.M.; Puerto, A.P.; Kucernak, A.; Fitch, S.D.S.; Garcia-Araez, N. 2020 Roadmap on Lithium Sulfur Batteries. J. Phys. Energy 2021. accepted for publication. [Google Scholar]
- Lei, C.; Fields, R.; Wilson, P.; Lekakou, C.; Amini, N.; Tennison, S.; Perry, J.; Gosso, M.; Martorana, B. Development and evaluation of a composite supercapacitor-based 12 V transient start-stop (TSS) power system for vehicles: Modelling, design and fabrication scaling up. Proc. Inst. Mech. Eng. Part A J. Power Energy 2020. [Google Scholar] [CrossRef]
- Abouelamaiem, D.I.; He, G.; Neville, T.P.; Patel, D.; Ji, S.; Wang, R.; Parkin, I.P.; Jorge, A.B.; Titirici, M.-M.; Shearing, P.R.; et al. Correlating electrochemical impedance with hierarchical structure for porous carbon-based supercapacitors using a truncated transmission line model. Electrochim. Acta 2018, 284, 597–608. [Google Scholar] [CrossRef] [Green Version]
- Feng, G.; Huang, J.; Sumpter, B.G.; Meunier, V.; Qiao, R. Structure and dynamics of electrical double layers in organic electrolytes. Phys. Chem. Chem. Phys. 2010, 12, 5468–5479. [Google Scholar] [CrossRef] [PubMed]
- Babar, S.; Lekakou, C. Molecular modeling of electrolyte and polysulfide ions for lithium-sulfur batteries. Ionics 2021, 27, 635–642. [Google Scholar] [CrossRef]
- Lian, C.; Zhao, S.; Liu, H.; Wu, J. Time-dependent density functional theory for the charging kinetics of electric double layer containing room-temperature ionic liquids. J. Chem. Phys. 2016, 145, 204707. [Google Scholar] [CrossRef] [Green Version]
- Wang, L.; Wang, J.; Zhang, Z.; Wang, L.; Wang, W.; Liu, J.; Hong, Z.; Cho, K.; Wang, W. Origin of theoretical pseudocapacitance of two-dimensional supercapacitor electrodes Ti3C2T2 (T = bare, O, S). J. Mater. Chem. A 2019, 7, 16231–16238. [Google Scholar] [CrossRef]
- Drummond, R.; Howey, D.A.; Duncan, S.R. Low-order mathematical modelling of electric double layer supercapacitors using spectral methods. J. Power Sources 2015, 277, 317–328. [Google Scholar] [CrossRef] [Green Version]
- Di Lecce, D.; Marangon, V.; Du, W.; Brett, D.J.L.; Shearing, P.R.; Hassoun, J. The role of synthesis pathway on the microstructural characteristics of sulfur-carbon composites: X-ray imaging and electrochemistry in lithium battery. J. Power Sources 2020, 472, 228424. [Google Scholar] [CrossRef]
- Bates, J. Modelling and Simulations of Energy Storage Devices. Ph.D. Thesis, University of Surrey, Guildford, UK, 2020. [Google Scholar]
- Markoulidis, F.; Bates, J.; Lekakou, C.; Slade, R.; Laudone, G.M. Supercapacitors with lithium-ion electrolyte: An experimental study and design of the activated carbon electrodes via modelling and simulations. Carbon 2020, 164, 422–434. [Google Scholar] [CrossRef]
- Bruggeman, D.A.G. Berechnung verschiedener physikalischer Konstanten von heterogenen Substanzen. I. Dielektrizitätskonstanten und Leitfähigkeiten der Mischkorper aus isotropen Substanzen. Ann. Phys. 1935, 416, 636–664. [Google Scholar] [CrossRef]
- Beck, R.E.; Schultz, J.S. Hindered diffusion in microporous membranes with known pore geometry. Science 1970, 170, 1302–1305. [Google Scholar] [CrossRef]
- Murch, G.E. The exact Nernst-Einstein equations and the interpretation of cross phenomenological coefficients in unary, binary, and ambipolar systems. Radiat. Eff. 1983, 73, 299–305. [Google Scholar] [CrossRef]
- Amico, S.; Lekakou, C. Flow through a two-scale porosity, oriented fibre porous medium. Transp. Porous Media 2004, 54, 35–53. [Google Scholar] [CrossRef]
- Lekakou, C.; Edwards, S.; Bell, G.; Amico, S.C. Computer modelling for the prediction of the in-plane permeability of non-crimp stitch bonded fabrics. Compos. A Appl. Sci. Manuf. 2006, 37, 820–825. [Google Scholar] [CrossRef]
- Elsayed, Y.; Lekakou, C.; Tomlins, P. Modeling, simulations and optimization of smooth muscle cell tissue engineering for the production of vascular grafts. Biotechnol. Bioeng. 2019, 116, 1509–1522. [Google Scholar] [CrossRef] [PubMed]
- Lekakou, C.N.; Richardson, S.M. Simulation of reacting flow during filling in reaction injection molding (RIM). Polym. Eng. Sci. 1986, 26, 1264–1275. [Google Scholar] [CrossRef]
- Oldham, K.B. A Gouy–Chapman–Stern model of the double layer at a (metal)/(ionic liquid) interface. J. Electroanal. Chem. 2008, 613, 131–138. [Google Scholar]
- Kannan, D.; Terala, P.; Moss, P.; Weatherspoon, M. Analysis of the separator thickness and porosity on the performance of lithium-ion batteries. Int. J. Electrochem. 2018, 2018, 1925708. [Google Scholar] [CrossRef]
- Salifu, A.A.; Lekakou, C.; Labeed, F.H. Electrospun oriented gelatin-hydroxyapatite fiber scaffolds for bone tissue engineering. J. Biomed. Mater. Res. Part A 2017, 105, 1911–1926. [Google Scholar] [CrossRef]
- Salifu, A.A.; Nury, B.D.; Lekakou, C. Electrospinning of nanocomposite fibrillar tubular and flat scaffolds with controlled fiber orientation. Ann. Biomed. Eng. 2011, 39, 2510. [Google Scholar] [CrossRef] [Green Version]
- Zhao, C.; Zheng, W. A review for aqueous electrochemical supercapacitors. Front. Energy Res. 2015. [Google Scholar] [CrossRef] [Green Version]
- Yu, L.; Chen, G.Z. Ionic liquid-based electrolytes for supercapacitor and supercapattery. Front. Chem. 2019. [Google Scholar] [CrossRef]
- Heng, I.; Lai, C.W.; Juan, J.C. Organic electrolytes for supercapacitors. In Supercapacitor Technology; Materials Research Foundations: Millersville, PA, USA, 2019; Volume 61, pp. 1–10. [Google Scholar]
- Chmiola, J.; Largeot, C.; Taberna, P.-L.; Simon, P.; Gogotsi, Y. Desolvation of ions in subnanometer pores and its effect on capacitance and double-layer theory. Angew. Chem. Int. Ed. 2008, 47, 3392–3395. [Google Scholar] [CrossRef] [PubMed]
- Jagadale, A.; Zhou, X.; Xiong, R.; Dubal, D.P.; Xu, J.; Yang, S. Lithium ion capacitors (LICs): Development of the materials. Energy Storage Mater. 2019, 19, 314–329. [Google Scholar] [CrossRef]
- Zhang, F.; Zhang, T.; Yang, X.; Zhang, L.; Leng, K.; Huang, Y.; Chen, Y. A high-performance supercapacitor-battery hybrid energy storage device based on graphene-enhanced electrode materials with ultrahigh energy density. Energy Environ. Sci. 2013, 6, 1623–1632. [Google Scholar] [CrossRef]
- Choi, H.S.; Chong Park, R. Theoretical guidelines to designing high performance energy storage device based on hybridization of lithium-ion battery and supercapacitor. J. Power Sources 2014, 259, 1–14. [Google Scholar] [CrossRef]
- Vlad, A.; Singh, N.; Rolland, J.; Melinte, S.; Ajayan, P.M.; Gohy, J.-F. Hybrid supercapacitor-battery materials for fast electrochemical charge storage. Sci. Rep. 2014, 4, 4315. [Google Scholar] [CrossRef] [PubMed] [Green Version]
- Saito, M.; Kawaharasaki, S.; Ito, K.; Yamada, S.; Hayamizub, K.; Sekic, S. Strategies for fast ion transport in electrochemical capacitor electrolytes from diffusion coefficients, ionic conductivity, viscosity, density and interaction energies based on HSAB theory. RSC Adv. 2017, 7, 14528–14535. [Google Scholar] [CrossRef] [Green Version]
- Perricone, E.; Chamas, M.; Cointeaux, L.; Leprêtre, J.-C.; Judeinstein, P.; Azais, P.; Béguin, F.; Alloin, F. Investigation of methoxypropionitrile as co-solvent for ethylene carbonate based electrolyte in supercapacitors. A safe and wide temperature range electrolyte. Electrochim. Acta 2013, 93, 1–7. [Google Scholar] [CrossRef]
- Logan, E.R.; Tonita, E.M.; Gering, K.L.; Li, J.; Ma, X.; Beaulieu, L.Y.; Dahn, J.R. A study of the physical properties of li-ion battery electrolytes containing esters. J. Electrochem. Soc. 2018, 165, A21–A30. [Google Scholar] [CrossRef]
- Afanas’ev, V.N.; Tyunina, E.Y.; Chekunova, M.D. The influence of temperature and concentration on viscous flow of solutions of Et4NBF4 in propylene carbonate. Russ. J. Phys. Chem. A 2009, 83, 2069–2073. [Google Scholar] [CrossRef]
- Markoulidis, F. Materials and Processing Techniques for the Fabrication of Supercapacitors for Automotive Applications. Ph.D. Thesis, University of Surrey, Guildford, UK, 2014. [Google Scholar]
- Hu, L.; Guo, D.; Feng, G.; Li, H.; Zhai, T. Asymmetric behavior of positive and negative electrodes in carbon/carbon supercapacitors and its underlying mechanism. J. Phys. Chem. C 2016, 120, 24675–24681. [Google Scholar] [CrossRef]
- Gogotsi, Y.; Penner, R.M. Energy storage in nanomaterials—Capacitive, pseudocapacitive, or battery-like? ACS Nano 2018, 12, 2081–2083. [Google Scholar] [CrossRef] [PubMed] [Green Version]
- Forse, A.C.; Merlet, C.; Griffin, J.M.; Grey, C.P. New perspectives on the charging mechanisms of supercapacitors. J. Am. Chem. Soc. 2016, 138, 5731–5744. [Google Scholar] [CrossRef] [PubMed] [Green Version]
- Deschamps, M.; Gilbert, E.; Azais, P.; Raymundo-Piñero, E.; Ramzi Ammar, M.; Simon, P.; Massiot, D.; Béguin, F. Exploring electrolyte organization in supercapacitor electrodes with solid-state NMR. Nat. Mater. 2013, 12, 351–358. [Google Scholar] [CrossRef] [PubMed]
- Decaux, C.; Matei Ghimbeu, C.; Dahbi, M.; Anouti, M.; Lemordant, D.; Béguin, F.; Vix-Guterl, C.; Raymundo-Piñero, E. Influence of electrolyte ion–solvent interactions on the performances of supercapacitors porous carbon electrodes. J. Power Sources 2014, 263, 130–140. [Google Scholar] [CrossRef]
Figure 1.
SEM images (a,b) and AFM images (c,d) of the surface of the activated carbon fabric (ACF) electrode.
Figure 1.
SEM images (a,b) and AFM images (c,d) of the surface of the activated carbon fabric (ACF) electrode.

Figure 2.
SEM images (a–d) and AFM images (e–h) of the surface of the AC coating electrode.
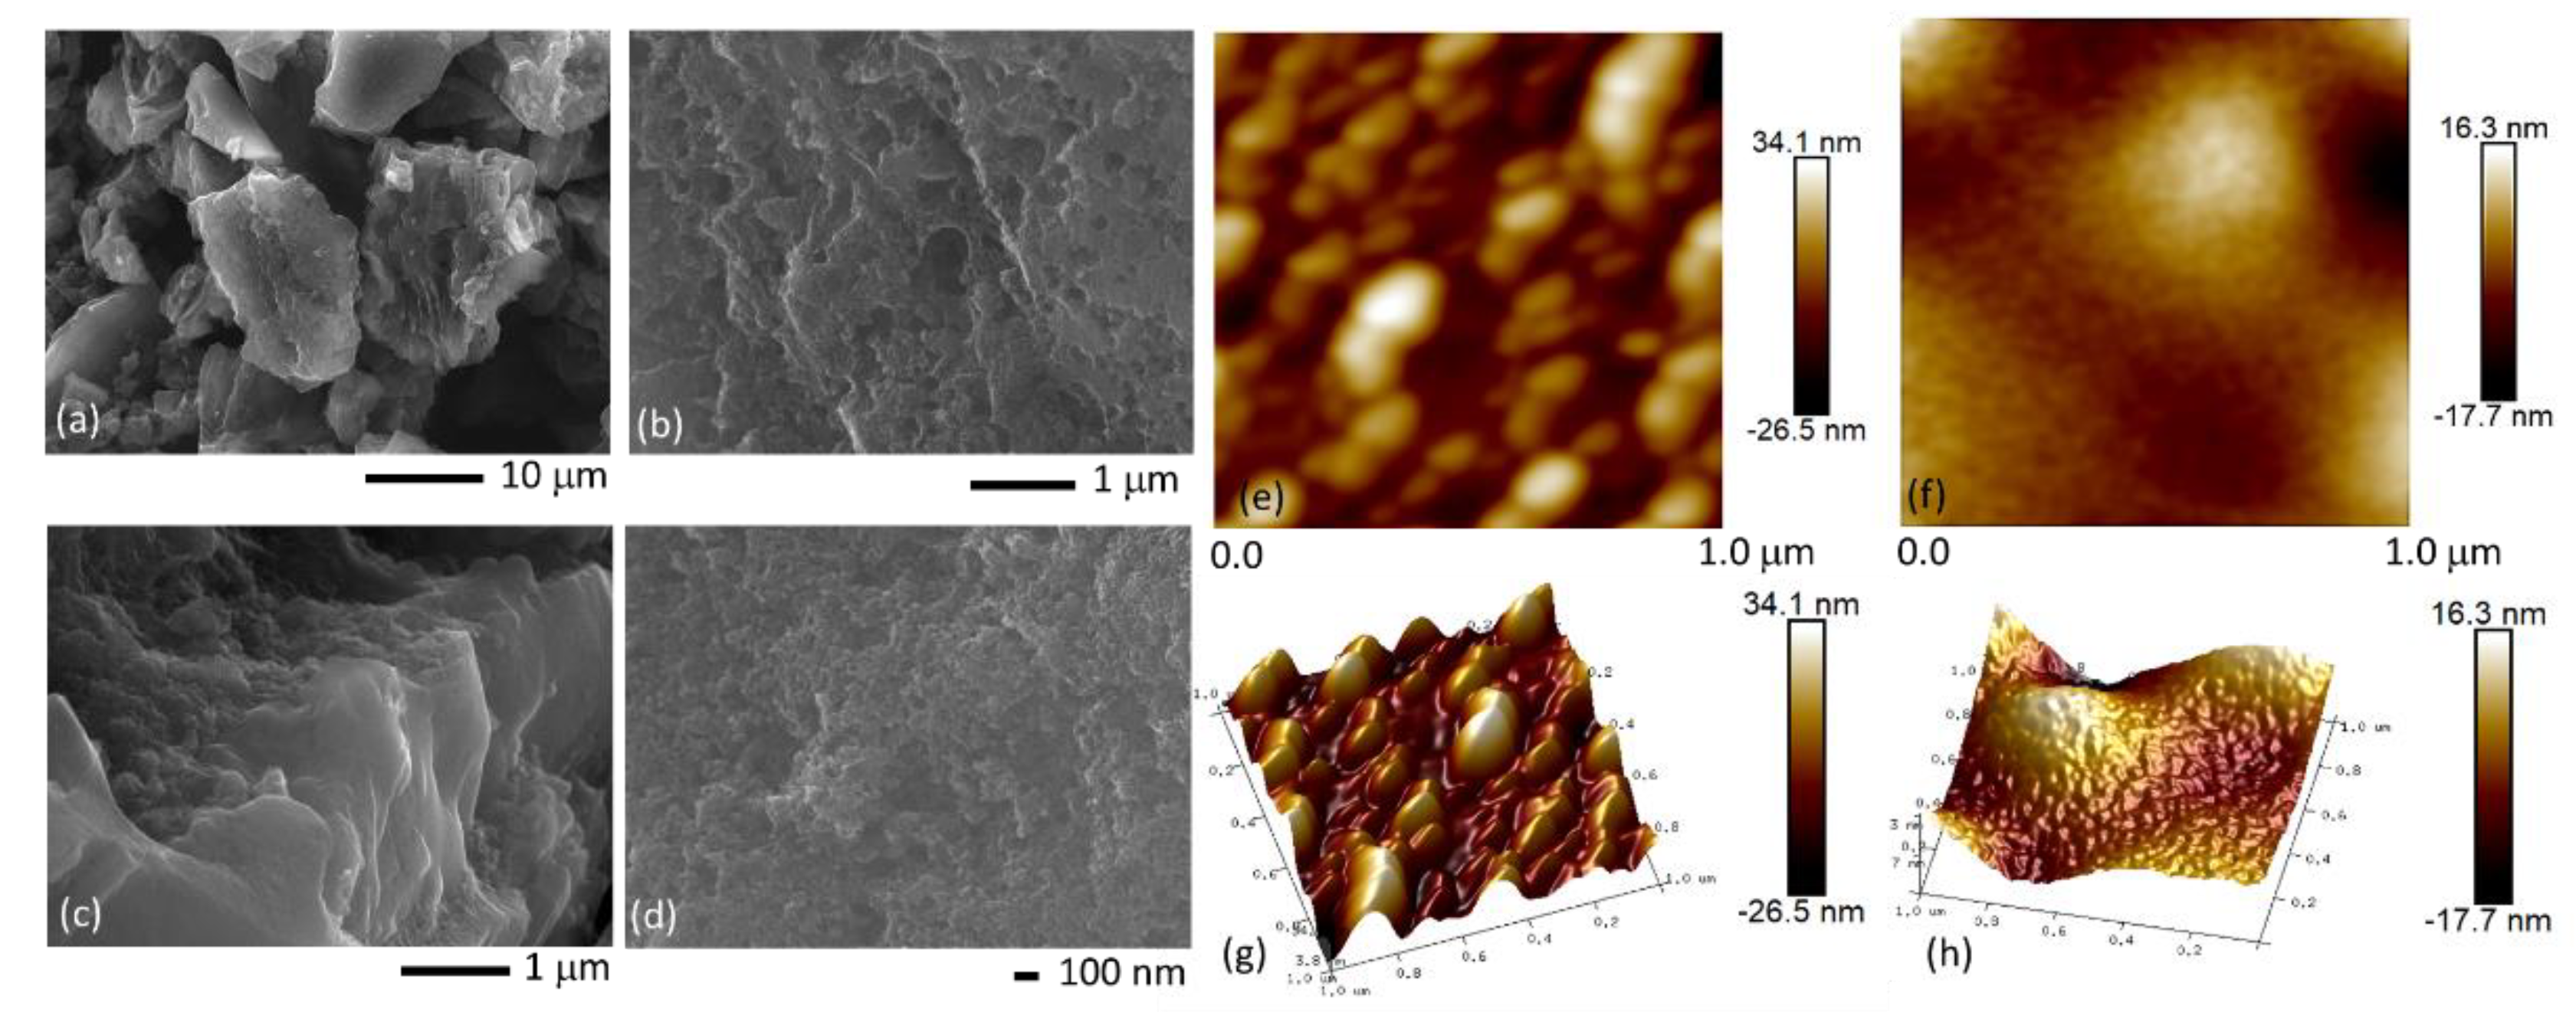
Figure 3.
Nitrogen adsorption/desorption experimental data and analysis results: adsorption/desorption isotherms for (a) the ACF fabric and (c) the AC coating; pore size distribution (PSD), derived from the experimental adsorption isotherms using the GCMC method, of (b) the ACF fabric and (d) the AC coating from experimental data and fitted discrete PSD lines used as input data in the simulations in this paper.

Figure 4.
Results of a sensitivity analysis, for a galvanostatic charge-discharge (GCD) cycle time at a GCD current density of 2.5 mA cm−2 of cell area.
Figure 4.
Results of a sensitivity analysis, for a galvanostatic charge-discharge (GCD) cycle time at a GCD current density of 2.5 mA cm−2 of cell area.

Figure 5.
(a) Predicted GCD curves for Case A (4 cm2 electrochemical double-layer capacitor (EDLC) cell, with ACF electrodes and 1.5 M TEABF4/AN electrolyte) and experimental data [18,62]. (b,c) Ion concentration profiles across the EDLC cell thickness 95 s after the start of discharge in GCD cycle at 2.5 mA cm−2 for Case A: cell thickness in Case A is 1 mm consisting of 0.5 mm cathode and 0.5 mm anode (separator is considered fully permeable by ions and of negligible thickness).

Figure 6.
Predicted ion concentration profiles against time at x = 0 (cathode/current collector) and x = L (anode/current collector) for Case A: ACF fabric electrodes and 1.5 M TEABF4/AN electrolyte.
Figure 6.
Predicted ion concentration profiles against time at x = 0 (cathode/current collector) and x = L (anode/current collector) for Case A: ACF fabric electrodes and 1.5 M TEABF4/AN electrolyte.
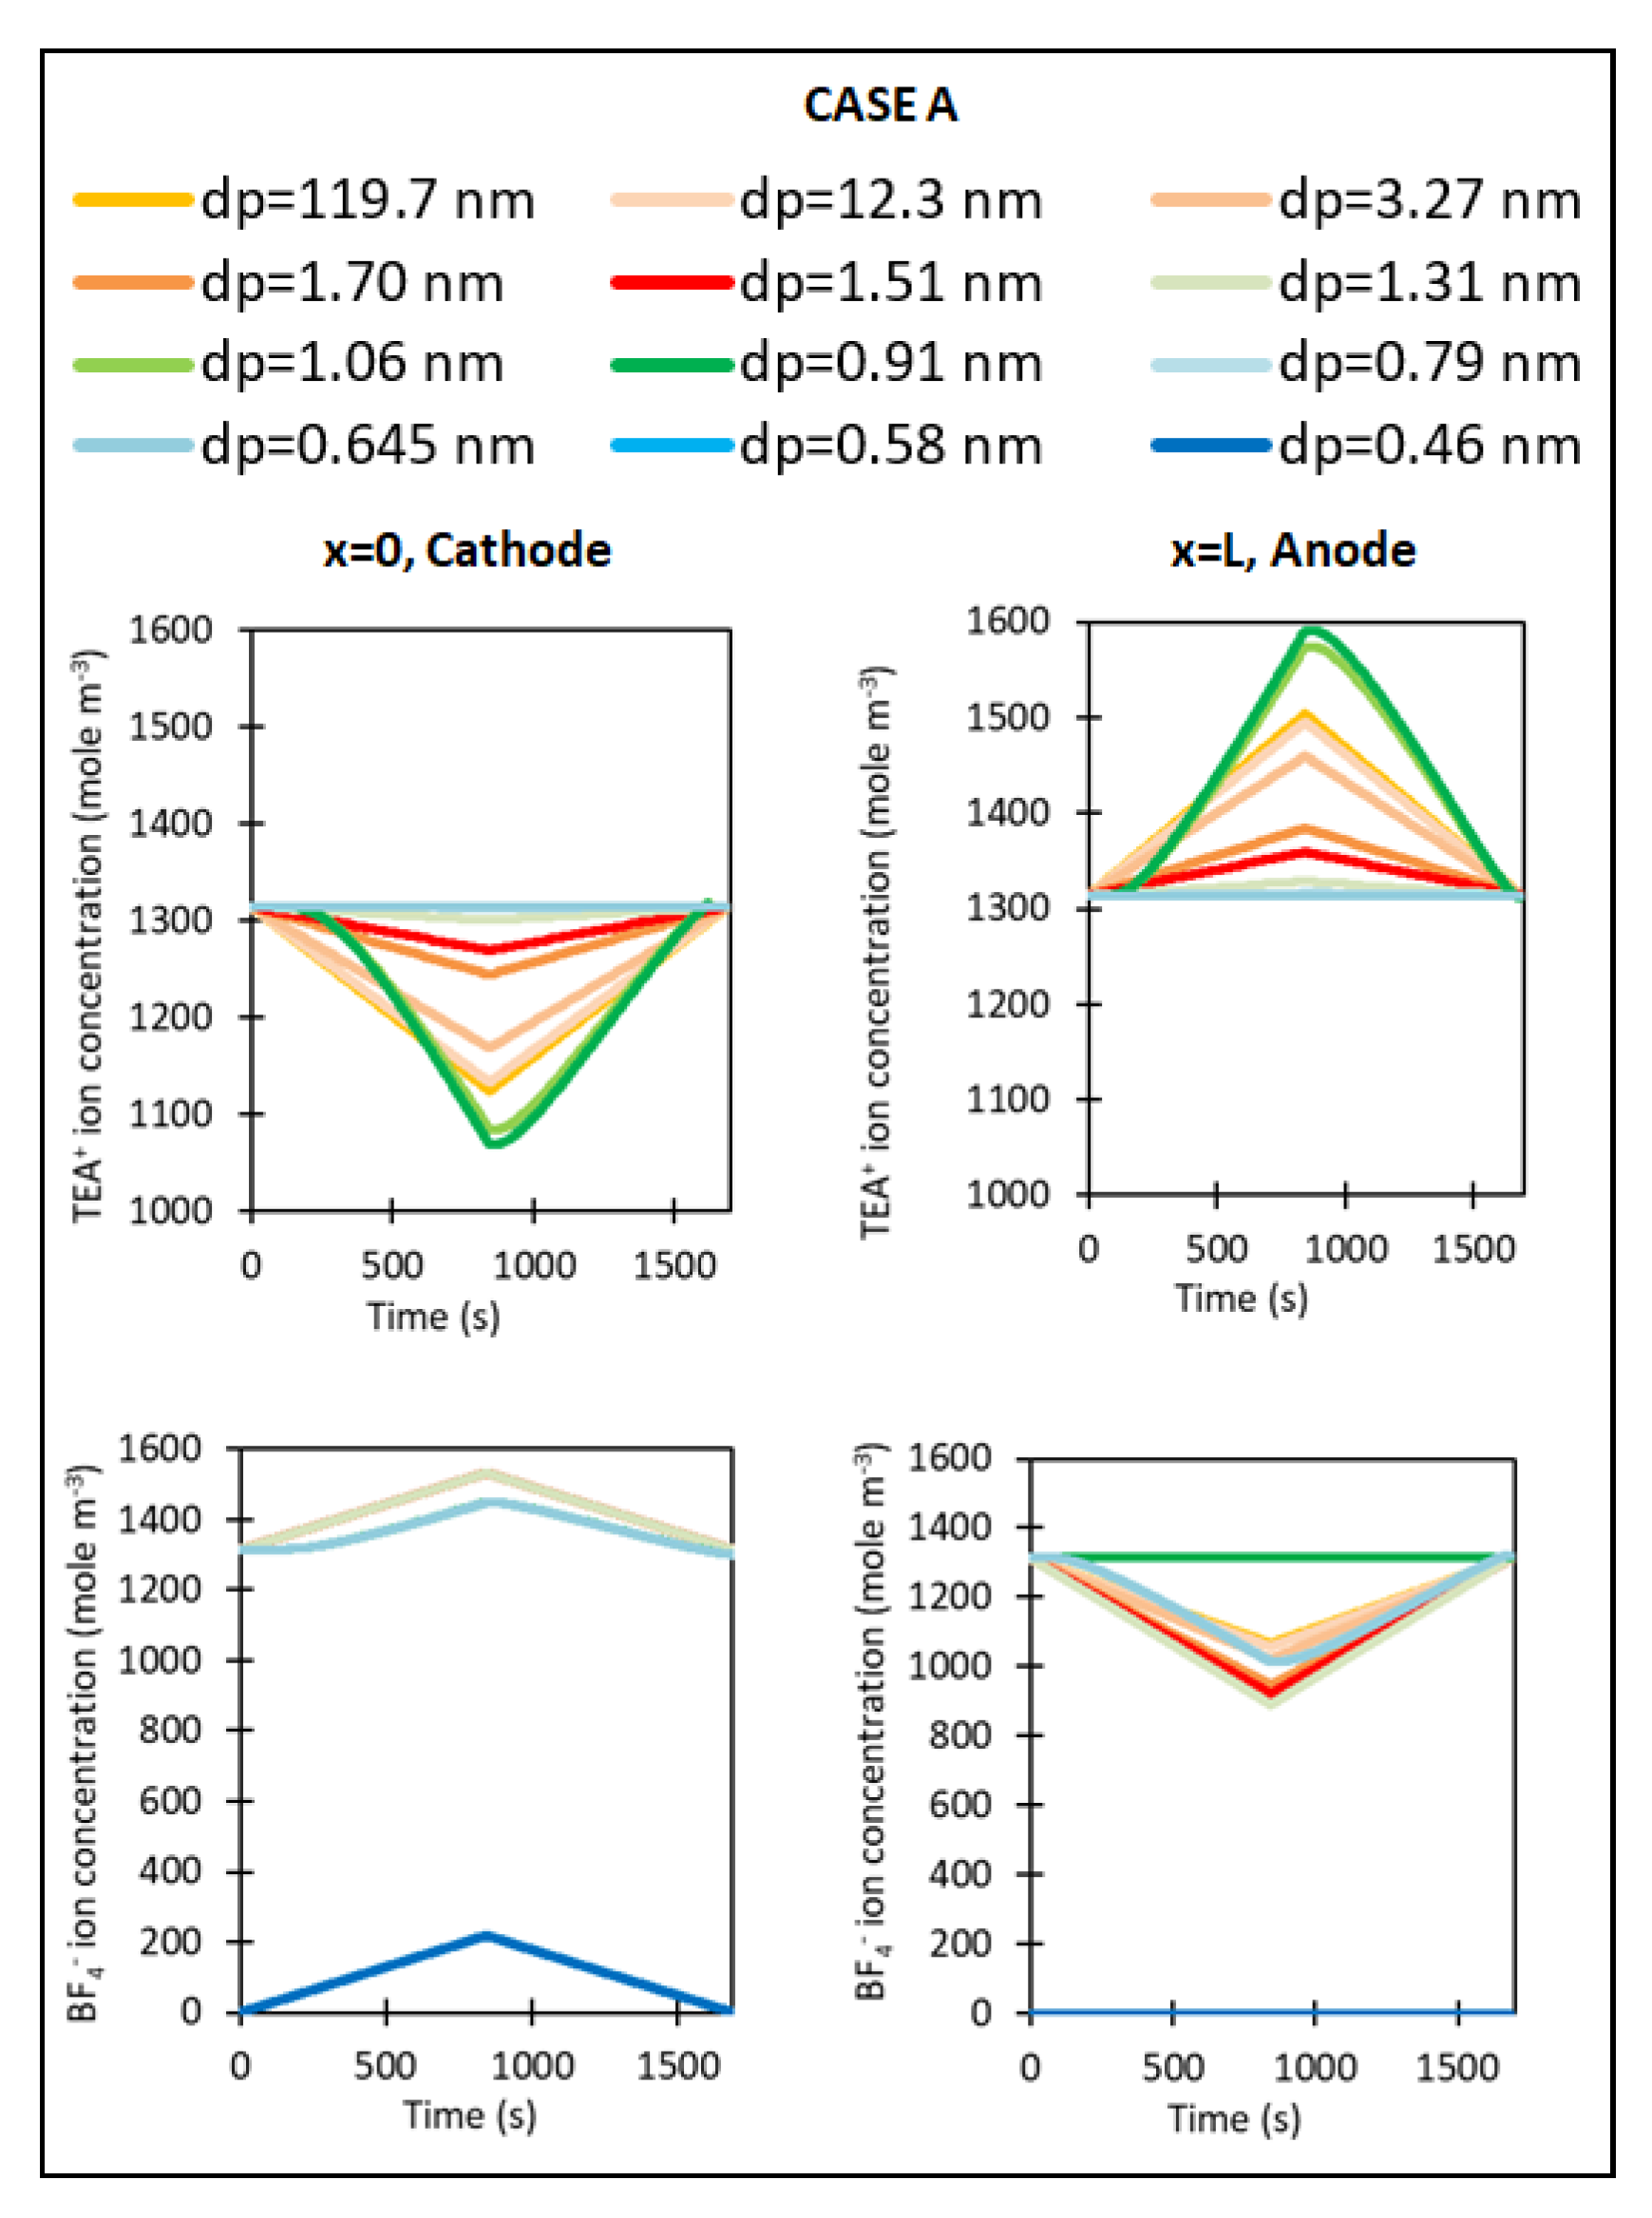
Figure 7.
Predicted ion concentration profiles against time at x = 0 (cathode/current collector) and x = L (anode/current collector) for AC coating electrodes and Case B: 1.5 M TEABF4/AN electrolyte and Case C: 1.5 M TEABF4/PC electrolyte.
Figure 7.
Predicted ion concentration profiles against time at x = 0 (cathode/current collector) and x = L (anode/current collector) for AC coating electrodes and Case B: 1.5 M TEABF4/AN electrolyte and Case C: 1.5 M TEABF4/PC electrolyte.

Figure 8.
Predicted ion concentration profiles against time at x = 0 (cathode/current collector) and x = L (anode/current collector) for EDLC with electrolyte 1 M LiPF6/EC-EMC and: Case D: AC coating electrodes and Case E: ACF fabric electrodes.
Figure 8.
Predicted ion concentration profiles against time at x = 0 (cathode/current collector) and x = L (anode/current collector) for EDLC with electrolyte 1 M LiPF6/EC-EMC and: Case D: AC coating electrodes and Case E: ACF fabric electrodes.
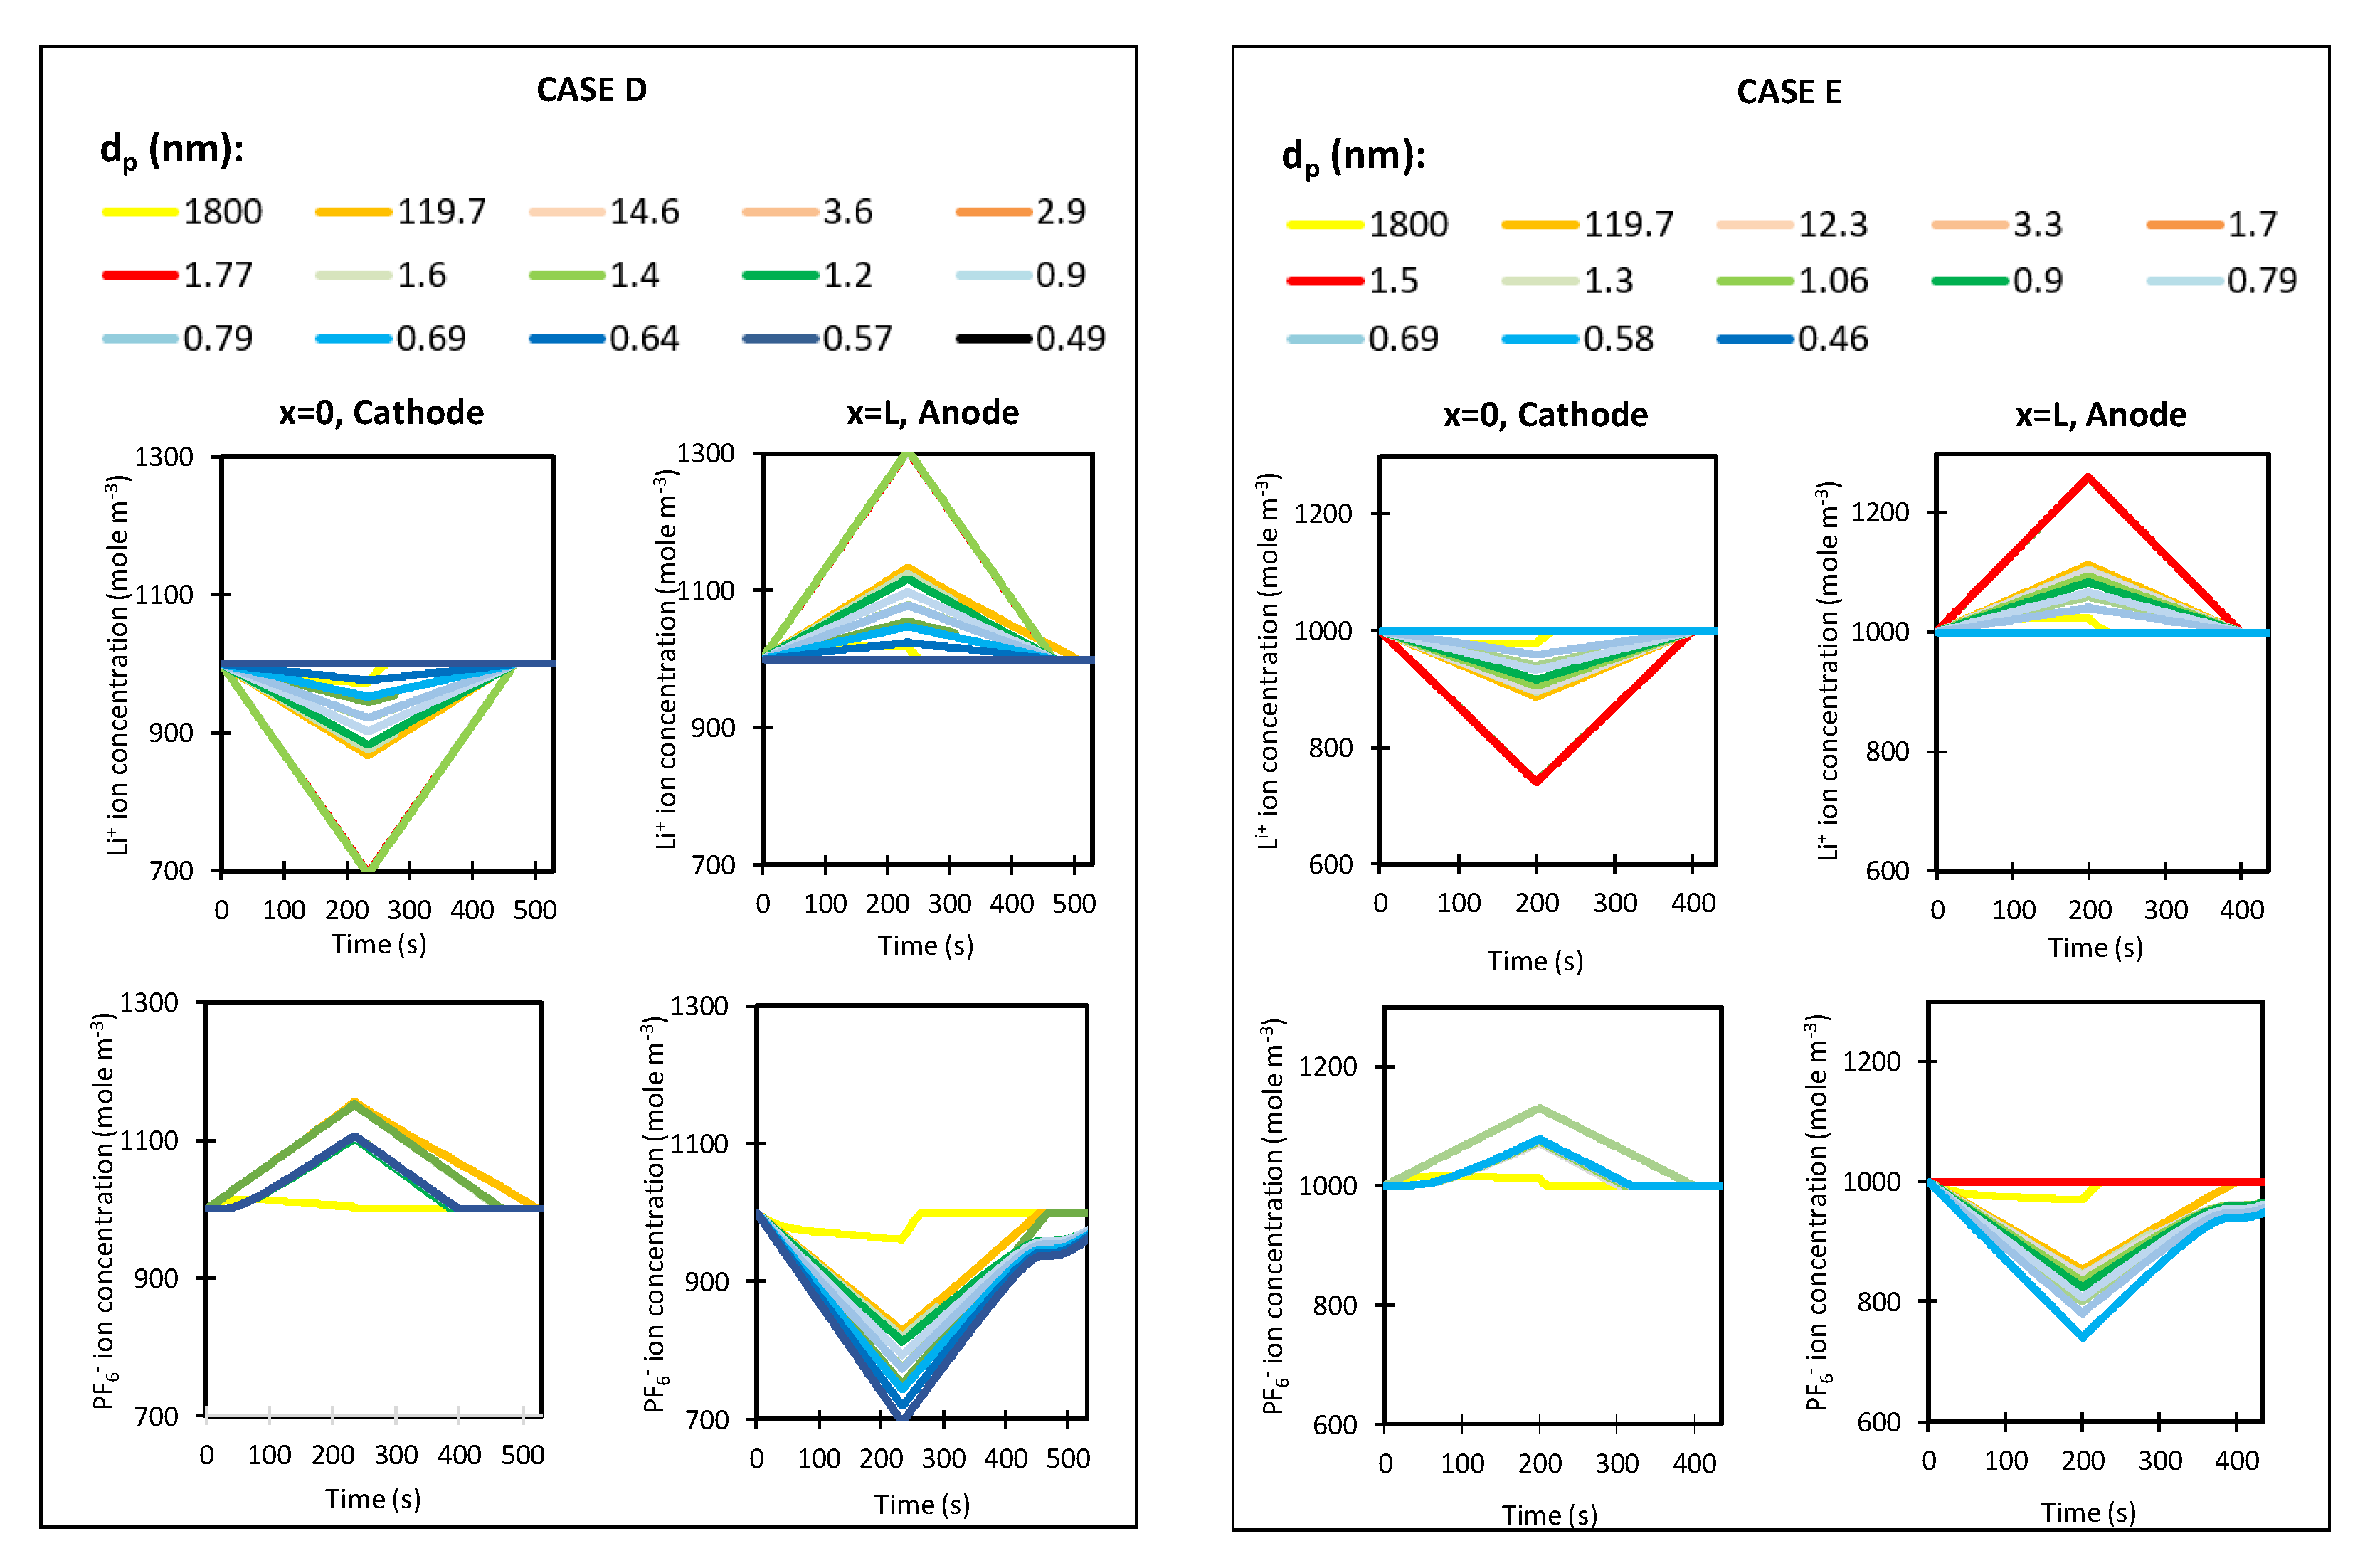
Figure 9.
Predicted EDLC performance in (a), and relationship between the size of ion (solvated or desolvated) and pore size in (b) for ACF fabric and (c) for AC coating. Electrodes: ACF fabric in Cases A and E; AC coating in Cases B, C and D. Electrolyte: 1.5 M TEABF4/AN in Cases A and B; 1.5 M TEABF4/PC in Case C; 1 M LiPF6/EC-EMC in Cases D and E. Experimental data in (a) from studies [16,18,38,62].

| Property | 1.5 M TEABF4/AN | 1.5 M TEABF4/PC | 1 M LiPF6/EC-EMC |
|---|---|---|---|
| kd | 0.876 | 0.6 | 1 |
| ηo (mPa s) | 0.37 | 1.8 | 1.4 |
| σ2 (S m−1) | 6 | 1.3 | 0.5 |
| Electrolyte Ion | Lmin,VdW (nm) 1 | nc 2 | Eion/solvent (kJ mol−1) 3 |
|---|---|---|---|
| TEA+ | 0.60 | 6(AN), 3(PC) | |
| BF4− | 0.45 | 3.3(AN), 3(PC) | |
| TEA+/AN | 1.1 | 15.5 | −222 |
| BF4−/AN | 0.85 | 6.75 | −196 |
| TEA+/PC | 1.28 | 13 | −10 |
| BF4−/PC | 1.04 | 6 | −35 |
| Li+ | 0.56 | 4 | |
| PF6− | 0.5 | 0 | |
| Li+/EC-EMC | 1.8 | 4 | −400 |
| PF6−/EC-EMC | 1.4 | 3 | −70 |
1 Minimum ion size (desolvated or solvated) from the Van der Waals volume. 2 Coordination number. 3 Binding energy between ion and solvent from the coordination solvent shell.
Publisher’s Note: MDPI stays neutral with regard to jurisdictional claims in published maps and institutional affiliations. |
© 2021 by the authors. Licensee MDPI, Basel, Switzerland. This article is an open access article distributed under the terms and conditions of the Creative Commons Attribution (CC BY) license (http://creativecommons.org/licenses/by/4.0/).
Share and Cite
MDPI and ACS Style
Bates, J.; Markoulidis, F.; Lekakou, C.; Laudone, G.M. Design of Porous Carbons for Supercapacitor Applications for Different Organic Solvent-Electrolytes. C 2021, 7, 15. https://0-doi-org.brum.beds.ac.uk/10.3390/c7010015
AMA Style
Bates J, Markoulidis F, Lekakou C, Laudone GM. Design of Porous Carbons for Supercapacitor Applications for Different Organic Solvent-Electrolytes. C. 2021; 7(1):15. https://0-doi-org.brum.beds.ac.uk/10.3390/c7010015
Chicago/Turabian StyleBates, Joshua, Foivos Markoulidis, Constantina Lekakou, and Giuliano M. Laudone. 2021. "Design of Porous Carbons for Supercapacitor Applications for Different Organic Solvent-Electrolytes" C 7, no. 1: 15. https://0-doi-org.brum.beds.ac.uk/10.3390/c7010015
Note that from the first issue of 2016, this journal uses article numbers instead of page numbers. See further details here.