Removal of Lead by Oxidized Graphite
by

Namasivayam Selvanantharajah
1, 
Poobalasuntharam Iyngaran
1,
Poobalasingam Abiman
1 and
Navaratnarajah Kuganathan
2,* 1
Department of Chemistry, University of Jaffna, Sir. Pon Ramanathan Road, Thirunelvely, Jaffna 40000, Sri Lanka
2
Department of Materials, Imperial College London, London SW7 2AZ, UK
*
Author to whom correspondence should be addressed.
C 2021, 7(1), 23; https://0-doi-org.brum.beds.ac.uk/10.3390/c7010023
Submission received: 9 January 2021
/
Revised: 15 February 2021
/
Accepted: 17 February 2021
/
Published: 20 February 2021
(This article belongs to the Special Issue Carbon-Related Nanomaterials in Analytical Nanoscience and Nanotechnology)
Abstract
:Lead ion adsorption on the surfaces of pristine and oxidized graphite is studied quantitatively using X-ray photoelectron spectroscopy (XPS) and standard electrochemical measurements. The XPS analysis confirmed the oxidation of graphite, yielding a final composite consisting of 15.97% of oxygen and 84.03% of carbon in comparison with the pristine graphite powder consisting of 6.13% oxygen and 93.87% carbon. The adsorption of lead (II) ion was confirmed by the peaks observed at 138 eV and 143.8 eV, associated with the emissions from Pb4f 7/2 and Pb4f 5/2, respectively. The effective concentration of Pb2+ ion and the optimum dosage of oxidized graphite were calculated to be 400 µM and 200 mg, respectively. Adsorption capacity of bare graphite was 41.18%, whereas that of oxidized graphite was 73.3%. The present results show that graphite oxide is a candidate material for the adsorption of Pb2+ ion from water.
1. Introduction
The presence of heavy metals in waste water and industrial effluent is one of the major concerns for the environmental community and society at large [1]. Lead is one of the industrial pollutants entering the ecosystem through soil, air and water [2]. The main sources of lead from human activities include lead mining, smelting and the use of leaded gasoline lead-based paints and water pipes [3,4,5,6]. Lead (II) ion (Pb2+) is highly toxic at its exceeded level, responsible for intellectual disabilities in children and causes around 143,000 deaths annually in developing countries [7,8]. Furthermore, lead accumulates mainly in bones, brain, kidney and muscles, causing many serious disorders like anemia, kidney disease and nervous disorder [9,10]. The safe and efficient removal of lead is, thus, necessary to prevent it from causing harmful damage to the environment.
Removal of heavy metals from waste water has been achieved by using several methods such as adsorption, precipitation, electroplating, chemical coagulation, ion-exchange, membrane separation and electro kinetics [11,12,13,14,15,16]. Significant effort has been devoted to the removal heavy metals from waste water using adsorption as this method is an efficient and economical method [17,18]. A variety of sorbents, such as activated carbon [19], oxidized activated carbon [20], carbon nanotubes [21], oxidized carbon nanotubes [22], chemically modified carbon [23], synthetic oxide [24], oxide minerals [25] and agricultural based bio sorbents (stems, peels, husks, shells and leaves) [26,27,28], have been used extensively.
High surface area with active functional groups will lead to high active sites for the adsorption of Pb2+ ions. A variety of adsorbent materials containing different chemical functional groups, such as carbonyl, carboxylic, phenolic and aromatic groups, have been reported [29,30,31,32]. The presence of chemical functional groups such as carboxylic acid (-COOH) or alcohol (-OH) on the adsorbents will enhance the adsorption efficacy via dipole-dipole interaction such as cation π-bonding for Pb2+ adsorption [30,33]. The mechanism for the adsorption of lead ions onto okra wastes was reported to be either via ion exchange or the formation of hydroxyl complexes [34]. Adsorption efficacy of Pb2+ ions not only depends on the structure and chemical properties of the adsorbent, but also on initial concentration of the metal ions, the pH of the solution, the dose of adsorbent and the temperature [35,36]. For example, Alghamdi et al. [36] have shown that adsorption capacity of Pb2+ ions on the polypyrrole-based activated carbon increases with increase in concentration and decreases with increase in adsorbent dose.
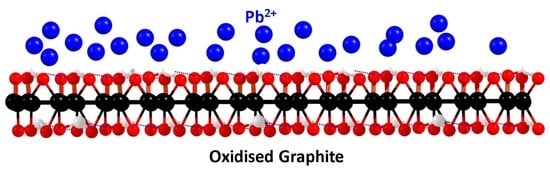
Oxidized graphite is a candidate material to remove large concentration of heavy metals as it has larger surface area decorated with organic functional groups, such as phenolic, carboxylic, carbonyl, quinoyl and lactonyl groups. As these functional groups are polar, the adsorption capacity of heavy metals is expected to be high. Furthermore, graphite powder is an inexpensive naturally occurring material that can be used in developing countries to purify water from heavy metals which cause chronic diseases.
In this study, we use standard electrochemical studies to determine the concentration of Pb2+ ions and XPS to confirm the adsorption of Pb2+ ions.
2. Materials and Methods
2.1. Reagents and Equipment
In order to prepare stock solution of Pb2+ ions (5 mM), lead nitrate (Aldrich, St. Louis, MO, USA) was used. The graphite powder from Aldrich was directly used and the particle size of the graphite powder was less than 20 µm in diameter. A standard pH meter (PHS-W series microprocessor pH/mV meter, Shanghai, China) was used in all cases to measure the pH of the solutions. A computer controlled Metrohm Autolab potentiostat (Type of instrument PGSTAT 302N, Utrecht, The Netherlands) was used to record the electrochemical measurements. The three-electrode system in the autolab, consisted of a glassy carbon electrode (working electrode), a saturated silver-silver chloride (reference electrode) and a platinum electrode (counter electrode). For stirring solutions, a standard magnetic stirrer (IKA C-MAG HS7) was used. Using Omicron ESCA Probe spectrometer XPS analysis was carried out at Indian Institute of Technology, Madras, India. The Al Kα band (hν = 1486.7 eV) was used to determine the X-ray radiation. OriginPro 8 was used to analyze the resulting spectra.
2.2. Oxidation of Graphite
Graphite particles (<20 µm in diameter) were oxidized by stirring 1 g of graphite powder with 20 mL of acid mixture prepared by mixing of 15 M HNO3 and 18 M H2SO4 with 3:1 ratio for 12 h. Using distilled water the oxidized graphite powder was washed thoroughly until a neutral filtrate was obtained. Finally, the oxidized graphite powder was allowed to dry using a suction pump and kept in a desiccator.
2.3. Linear Range Determination of Square Wave Anodic Stripping Voltammetry (SWASV)
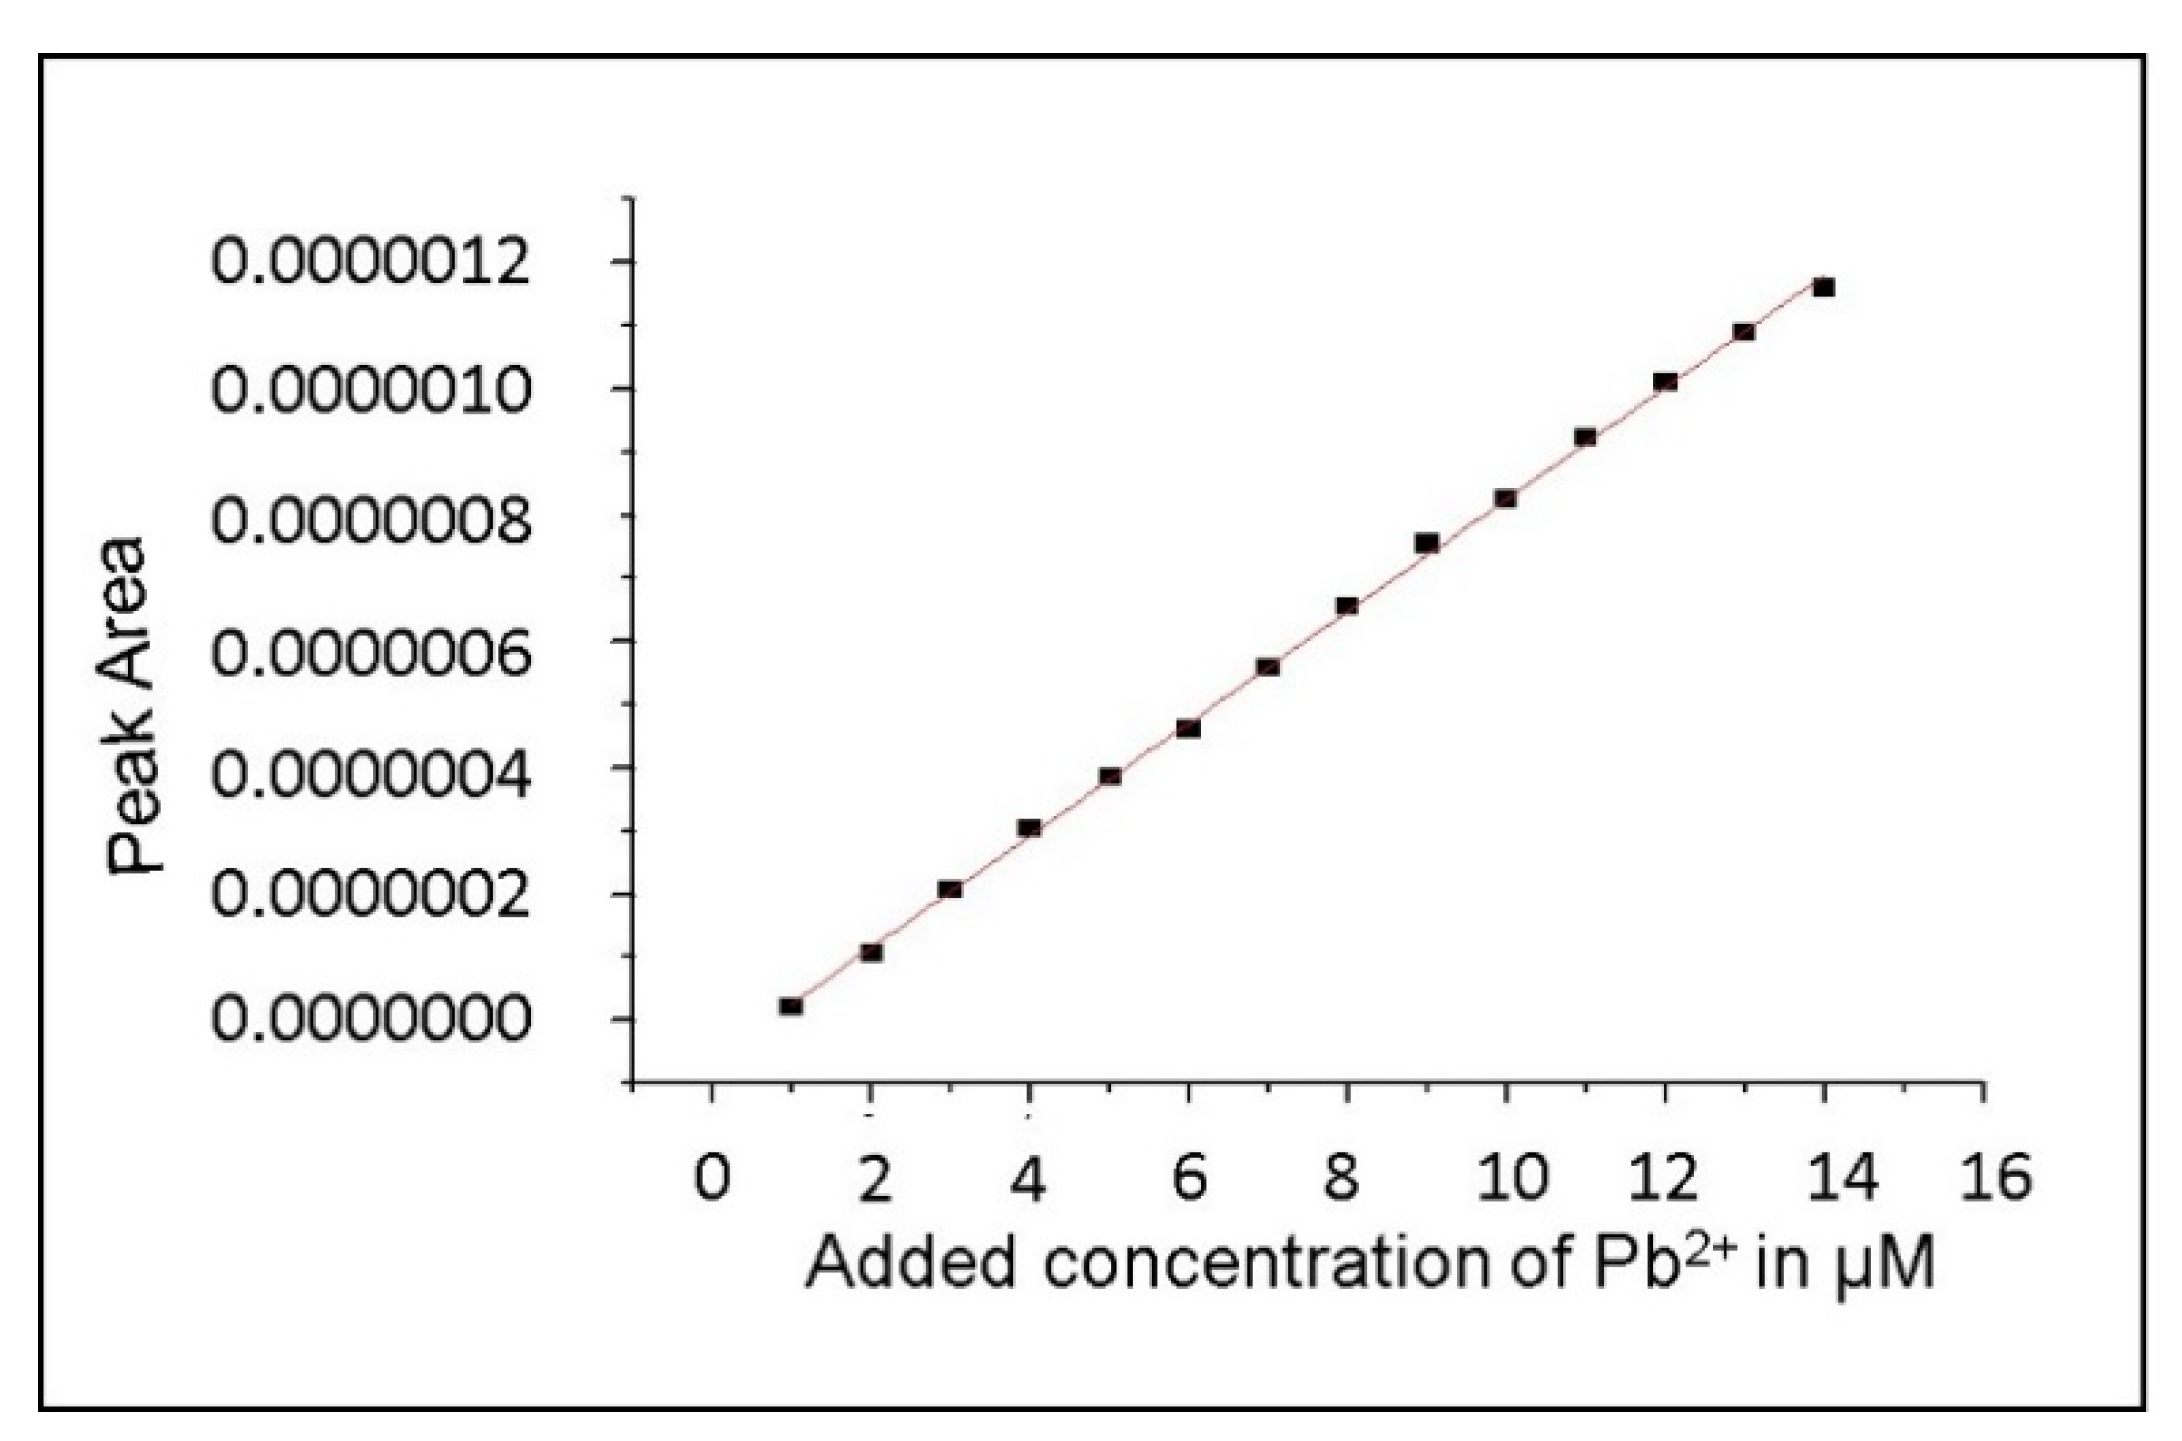
In order to determine the linear range for the determination of Pb2+, a blank solution of pH 4.5 buffer (sodium acetate buffer solution of pH 4.5 was prepared by mixing 0.5 M sodium acetate and 0.5 M acetic acid) was used in the standard addition method. A 25.0 mL of the above buffer solution was taken in the cell and a glassy carbon electrode was dipped into the solution at a deposition potential of −1.1 V vs. saturated silver-silver chloride electrode and held for 120 s with stirring. Then the resulting solution was allowed for 10 s to reach equilibrium. Before each voltammogram potential was swept from −1.1 to −0.3 V at a scan rate of 0.1Vs−1 a potentials of +0.8 V was applied for 180 s as conditioning potential to remove the remaining deposits on the surface in the previous experiment (see Supplementary Materials). A linear detection range of 1–14 µM was produced by SWASV. Figure 1 shows the current versus potential graph of SWASV with standard addition of Pb2+ on glassy carbon electrode in a cell containing 25.0 mL acetate buffer solution (pH = 4.5) after a pre-concentration period of 120 s at −1.1 V and 10 s for equilibrium time. Figure 2 shows the standard addition plot of peak area from Figure 1 against added Pb2+ concentration (1–14 µM).
Optimum initial concentration was determined by stirring 100 mg of oxidized graphite with 10.0 mL of different concentration (50–500 µM) of Pb2+ solution for 30 min and the rest for 6 h. Using a suction pump mixtures were filtered and the standard addition method was used to determine the remaining Pb2+ ions in the filtrates.
2.4. Optimum Dosage of Oxidized Graphite for the Adsorption of Lead Ions (Pb2+)
Optimum dosage of oxidized graphite was determined by stirring 10.0 mL of 100 µM of Pb2+ solution with 100 mg, 200 mg, 300 mg and 400 mg of oxidized graphite for 30 min. Then the resultant solutions were then equilibrated for 6 h. Finally, filtration was carried out on the mixtures using a suction pump to determine the remaining Pb2+ ions in the filtrates. The difference between the initial and final amounts of Pb2+ ions is the amount of Pb2+ adsorbed on the oxidized graphite.
2.5. Adsorption of Pb2+ Ions
The following equation was used to determine the percentage of lead adsorption from aqueous solution.
where Ci and Cf are the initial and final concentrations of Pb2+, respectively.
The following equation was used to determine the adsorbed moles of Pb2+ ions.
where Ci and Cf are the initial and final concentration of Pb2+ ion, respectively, W (mg) is the amount of oxidized graphite powder and V (ml) is the volume of Pb2+ ion solution.
3. Results and Discussion
3.1. XPS Characterization
Samples of blank and oxidized graphite powders were characterized using XPS in order to calculate the amount of oxygen adsorbed on the surface of graphite. The XPS analysis was also carried out on the graphite and the oxidized graphite powders after the exposure of Pb2+ solution. Small portions of the samples were analyzed separately with the aid of XPS spectrometer and scans were carried out in the range between 0 and 1200 eV (see Figure 3).
Two significant peaks are observed with binding energies of 284.6 eV and 532.6 eV associated with the photo electrons emitted from C 1s and O1s levels, respectively (see Figure 3a). The XPS of oxidized graphite powder is shown in Figure 3b. The peaks correspond to the binding energies of 282.9 eV and 532.4 eV can be attributed to the photo electrons emitted from C 1s and O1s levels, respectively.
A quantitative analysis revealed that atomic percentages of O (O1s peak) and C (C1s peak) on the for blank graphite powder were 6.13% and 93.87%, respectively. The same analysis was also carried out on the oxidized graphite powder. The result shows that the atomic percentages of the peaks of O1s and C1s were 15.97% and 84.03%, respectively. The enhancement in the percentage of atomic oxygen from 6.13% to 15.97% confirmed the oxidation of blank graphite.
Next, XPS analysis was carried out at 30 °C on the sample of oxidized graphite powder after exposing of 100 µM Pb2+ ion solution for a period of 6.5 h (stirring: 30 min; equilibrium: 6 h) and the pH of the solution was maintained at 6.5. The XPS spectra of oxidized graphite powder after exposure of Pb2+, with wide scan ranges of 0–1200 eV and 130–155 eV, are shown in Figure 4.
The spectrum of oxidized graphite shows that there are two peaks at 138 eV and 143.8 eV in addition to C1s and O1s peaks (see Figure 4b). These peaks correspond to the emissions from Pb4f7/2 and Pb4f5/2, respectively, confirming the adsorption of Pb2+.
3.2. Effective Concentration of Pb2+ Ions
The effective concentration of Pb2+ ions was examined by considering different concentration of Pb2+ with a fixed amount of oxidized graphite powder. A series of Pb2+ solution with different concentration (50–500 µM) were prepared by diluting 5 mM of Pb2+ (stock solution). A total of 100.0 mg of oxidized graphite powder was then added to 10.0 mL of each solution and the mixture was stirred for 30 min and allowed to rest for 6 h. Then the concentration of Pb2+ ions in the remaining solution was determined using SWASV. Table 1 shows average adsorbed moles of Pb2+ on the oxidized graphite (100 mg) with initial concentration of Pb2+ from 50 µM to 500 µM.
As the initial concentration of Pb2+ increases from 50 µM to 400 µM, there is a gradual increase in the adsorption. The maximum adsorption of lead ions takes place at 400 µM concentration and then at 500 µM there is a very small decrease in the moles of adsorption of Pb2+. It may be due to ion-ion repulsion. Once the active sites of oxidised graphite are saturated, there is a poor chance of further adsorption of Pb2+ and the strength of ion–ion repulsion will be dominant at high concentration of Pb2+.
3.3. Effective Amount of Oxidized Graphite Powder on Adsorption
The effective amount of oxidized graphite for the adsorption of Pb2+ ion was examined by adding 100.0, 200.0, 300.0 and 400.0 mg of oxidized graphite powder individually to 10.0 mL of 100 µM of Pb2+ ion solution. The concentration of remaining Pb2+ ions in the solution was determined using SWASV. Table 2 shows average moles of Pb2+ adsorbed on the oxidized graphite.
The adsorption of Pb2+ increases with the increase of oxidized graphite powder from 100 mg to 200 mg. Adsorption decreases once the dosage of oxidized graphite exceeds 200 mg. The optimum dosage of oxidized graphite is 200.0 mg.
4. Conclusions
Using X-ray photoelectron spectroscopy (XPS) and standard electrochemical measurements, we examined the adsorption efficacy of Pb2+ ion on the surfaces of bare and oxidized graphite. The XPS measurement confirmed the oxidation of graphite with the final composite having 15.97% of oxygen and 84.03% of carbon, in comparison with the pristine graphite powder consisting of 6.13% oxygen and 93.87% carbon. The peaks, determined at 138 eV and 143.8 eV, associated with the emissions from Pb4f7/2 and Pb4f5/2, respectively, confirmed the adsorption of Pb2+ ions. The adsorption capacity of bare graphite was 41.18%, whereas that of oxidized graphite was 73.3%. This experimental study shows that oxidized graphite is a candidate material for the safe and effective capture of Pb2+ ions from waste water.
Supplementary Materials
The following are available online at https://0-www-mdpi-com.brum.beds.ac.uk/2311-5629/7/1/23/s1, Figure S1: Potential versus current graph for standard addition of Pb2+ for graphite powder, Figure S2: Standard addition plot of peak area from Figure S1 against added Pb2+ concentration (1–5 µM), Figure S3: Potential (V) versus current (A) graph for standard addition of Pb2+ solution for oxidized graphite powder, Figure S4: Standard addition plot of peak area from Figure S3 against added Pb2+ concentration (1–5 µM).
Author Contributions
Conceptualization, N.S. and P.I.; methodology, P.A.; software, N.S.; validation, N.S., P.A. and P.I.; formal analysis, N.S.; investigation, N.S.; resources, P.A.; data curation, N.S.; writing—original draft preparation, N.S.; writing—review and editing, N.K.; supervision, P.I., P.A.; All authors have read and agreed to the published version of the manuscript.
Funding
This research was funded by National Research Council, Sri Lanka.
Institutional Review Board Statement
Not Applicable.
Informed Consent Statement
Not Applicable.
Data Availability Statement
The data created in this study are contained within the article and the corresponding supplementary material.
Acknowledgments
T. Pradeep from Indian Institute of Technology. Madras, India is acknowledged for the XPS spectra.
Conflicts of Interest
The authors declare no conflict of interest.
References
- Lester, J.N. Significance and behavior of heavy metals in waste water treatment processes I. Sewage treatment and effluent discharge. Sci. Total Environ. 1983, 30, 1–44. [Google Scholar] [CrossRef]
- Smith, W.H. Lead contamination of the roadside ecosystem. J. Air Pollut. Control Assoc. 1976, 26, 753–766. [Google Scholar] [CrossRef] [PubMed]
- Sullivan, M.; Green, D. Toward eliminating children’s lead exposure: A comparison of policies and their outcomes in three lead producing and using countries. Environ. Res. Lett. 2020, 15, 103008. [Google Scholar] [CrossRef]
- Khoder, M.I.; Hassan, S.K.; El-Abssawy, A.A. An evaluation of loading rate of dust, Pb, Cd, and Ni and metals mass concentration in the settled surface dust in domestic houses and factors affecting them. Indoor Built Environ. 2010, 19, 391–399. [Google Scholar] [CrossRef]
- Yang, J.; Li, X.; Xiong, Z.; Wang, M.; Liu, Q. Environmental pollution effect analysis of lead compounds in China Based on Life Cycle. Int. J. Environ. Res. Public Health 2020, 17, 2184. [Google Scholar] [CrossRef] [Green Version]
- Rieuwerts, J.S.; Farago, M.E. Lead contamination in smelting and mining environments and variations in chemical forms and bioavailability. Chem. Speciat. Bioavailab. 1995, 7, 113–123. [Google Scholar] [CrossRef]
- Meyer, P.A.; McGeehin, M.A.; Falk, H. A global approach to childhood lead poisoning prevention. Int. J. Hyg. Environ. Health 2003, 206, 363–369. [Google Scholar] [CrossRef] [Green Version]
- Kordas, K.; Ravenscroft, J.; Cao, Y.; McLean, E.V. Lead Exposure in low and middle-income countries: Perspectives and lessons on patterns, injustices, economics, and politics. Int. J. Environ. Res. Public Health 2018, 15, 2351. [Google Scholar] [CrossRef] [Green Version]
- Rădulescu, A.; Lundgren, S. A pharmacokinetic model of lead absorption and calcium competitive dynamics. Sci. Rep. 2019, 9, 14225. [Google Scholar] [CrossRef]
- Wani, A.L.; Ara, A.; Usmani, J.A. Lead toxicity: A review. Interdiscip. Toxicol. 2015, 8, 55–64. [Google Scholar] [CrossRef] [Green Version]
- Agarwal, M.; Singh, K. Heavy metal removal from wastewater using various adsorbents: A review. J. Water Reuse Desalination 2016, 7, 387–419. [Google Scholar]
- Barakat, M.A. New trends in removing heavy metals from industrial wastewater. Arab. J. Chem. 2011, 4, 361–377. [Google Scholar] [CrossRef] [Green Version]
- Fu, F.; Wang, Q. Removal of heavy metal ions from wastewaters: A review. J. Environ. Manag. 2011, 92, 407–418. [Google Scholar] [CrossRef]
- Bankole, M.T.; Abdulkareem, A.S.; Mohammed, I.A.; Ochigbo, S.S.; Tijani, J.O.; Abubakre, O.K.; Roos, W.D. Selected heavy metals removal from electroplating wastewater by purified and polyhydroxylbutyrate functionalized carbon nanotubes adsorbents. Sci. Rep. 2019, 9, 4475. [Google Scholar] [CrossRef] [Green Version]
- Dean, J.G.; Bosqui, F.L.; Lanouette, K.H. Removing heavy metals from waste water. Environ. Sci. Technol. 1972, 6, 518–522. [Google Scholar] [CrossRef]
- Li, A.Y.; Deng, H.; Jiang, Y.H.; Ye, C.H.; Yu, B.G.; Zhou, X.L.; Ma, A.Y. Superefficient removal of heavy metals from wastewater by Mg-Loaded biochars: Adsorption characteristics and removal mechanisms. Langmuir 2020, 36, 9160–9174. [Google Scholar] [CrossRef]
- Mnasri-Ghnimi, S.; Frini-Srasra, N. Removal of heavy metals from aqueous solutions by adsorption using single and mixed pillared clays. Appl. Clay Sci. 2019, 179, 105151. [Google Scholar] [CrossRef]
- Arora, R. Adsorption of Heavy Metals—A Review. Mater. Today Proc. 2019, 18, 4745–4750. [Google Scholar] [CrossRef]
- Netzer, A.; Hughes, D.E. Adsorption of copper, lead and cobalt by activated carbon. Water Res. 1984, 18, 927–933. [Google Scholar] [CrossRef]
- Deliyanni, E.A.; Kyzas, G.Z.; Triantafyllidis, K.S.; Matis, K.A. Activated carbons for the removal of heavy metal ions: A systematic review of recent literature focused on lead and arsenic ions. Open Chem. 2015. [Google Scholar] [CrossRef]
- Ouni, L.; Ramazani, A.; Taghavi Fardood, S. An overview of carbon nanotubes role in heavy metals removal from wastewater. Front. Chem. Sci. Eng. 2019, 13, 274–295. [Google Scholar] [CrossRef]
- Nyairo, W.N.; Eker, Y.R.; Kowenje, C.; Akin, I.; Bingol, H.; Tor, A.; Ongeri, D.M. Efficient adsorption of lead (II) and copper (II) from aqueous phase using oxidized multiwalled carbon nanotubes/polypyrrole composite. Sep. Sci. Technol. 2018, 53, 1498–1510. [Google Scholar] [CrossRef]
- Abiman, P.; Wildgoose, G.G.; Crossley, A.; Compton, R.G. Quantitative studies of metal Ion adsorption on a chemically modified carbon surface: Adsorption of Cd(II) and Hg(II) on glutathione modified carbon. Electroanalysis 2009, 21, 897–903. [Google Scholar] [CrossRef]
- McKenzie, R.M. The adsorption of lead and other heavy metals on oxides of manganese and iron. Soil Res. 1980, 18, 61–73. [Google Scholar] [CrossRef]
- Rashed, M.N. Lead removal from contaminated water using mineral adsorbents. Environmentalist 2001, 21, 187–195. [Google Scholar] [CrossRef]
- Shi, B.; Zuo, W.; Zhang, J.; Tong, H.; Zhao, J. Removal of Lead(II) Ions from aqueous solution using jatropha curcas L. Seed Husk Ash as a Biosorbent. J. Environ. Qual. 2016, 45, 984–992. [Google Scholar] [CrossRef]
- Mathew, B.B.; Jaishankar, M.; Biju, V.G.; Krishnamurthy Nideghatta, B. Role of bioadsorbents in reducing toxic metals. J. Toxicol. 2016, 2016, 4369604. [Google Scholar] [CrossRef] [Green Version]
- Reddad, Z.; Gerente, C.; Andres, Y.; Le Cloirec, P. Adsorption of several metal ions onto a low-cost biosorbent: Kinetic and Equilibrium Studies. Environ. Sci. Technol. 2002, 36, 2067–2073. [Google Scholar] [CrossRef]
- Xie, R.; Jin, Y.; Chen, Y.; Jiang, W. The importance of surface functional groups in the adsorption of copper onto walnut shell derived activated carbon. Water Sci. Technol. 2017, 76, 3022–3034. [Google Scholar] [CrossRef] [Green Version]
- Yang, X.; Wan, Y.; Zheng, Y.; He, F.; Yu, Z.; Huang, J.; Wang, H.; Ok, Y.S.; Jiang, Y.; Gao, B. Surface functional groups of carbon-based adsorbents and their roles in the removal of heavy metals from aqueous solutions: A critical review. Chem. Eng. J. 2019, 366, 608–621. [Google Scholar] [CrossRef]
- Yang, X.; Xu, G.; Yu, H. Removal of lead from aqueous solutions by ferric activated sludge-based adsorbent derived from biological sludge. Arab. J. Chem. 2019, 12, 4142–4149. [Google Scholar] [CrossRef] [Green Version]
- El-Naggar, I.M.; Ahmed, S.A.; Shehata, N.; Sheneshen, E.S.; Fathy, M.; Shehata, A. A novel approach for the removal of lead (II) ion from wastewater using Kaolinite/Smectite natural composite adsorbent. Appl. Water Sci. 2018, 9, 7. [Google Scholar] [CrossRef] [Green Version]
- Bala, T.; Prasad, B.L.V.; Sastry, M.; Kahaly, M.U.; Waghmare, U.V. Interaction of different metal ions with carboxylic acid group: A quantitative study. J. Phys. Chem. A 2007, 111, 6183–6190. [Google Scholar] [CrossRef] [PubMed]
- Hashem, M. Adsorption of lead ions from aqueous solution by okra wastes. Int. J. Phys. Sci. 2007, 2, 178–184. [Google Scholar]
- Zavvar Mousavi, H.; Seyedi, S. Kinetic and equilibrium studies on the removal of Pb(II) from aqueous solution using nettle ash. J. Chil. Chem. Soc. 2009, 55, 307–311. [Google Scholar] [CrossRef] [Green Version]
- Alghamdi, A.A.; Al-Odayni, A.-B.; Saeed, W.S.; Al-Kahtani, A.; Alharthi, F.A.; Aouak, T. Efficient Adsorption of Lead (II) from Aqueous Phase Solutions Using Polypyrrole-Based Activated Carbon. Materials (Basel) 2019, 12, 2020. [Google Scholar] [CrossRef] [PubMed] [Green Version]
Figure 1.
The current versus potential graph of Square Wave Anodic Stripping Voltammetry (SWASV) with standard addition of Pb2+.
Figure 1.
The current versus potential graph of Square Wave Anodic Stripping Voltammetry (SWASV) with standard addition of Pb2+.
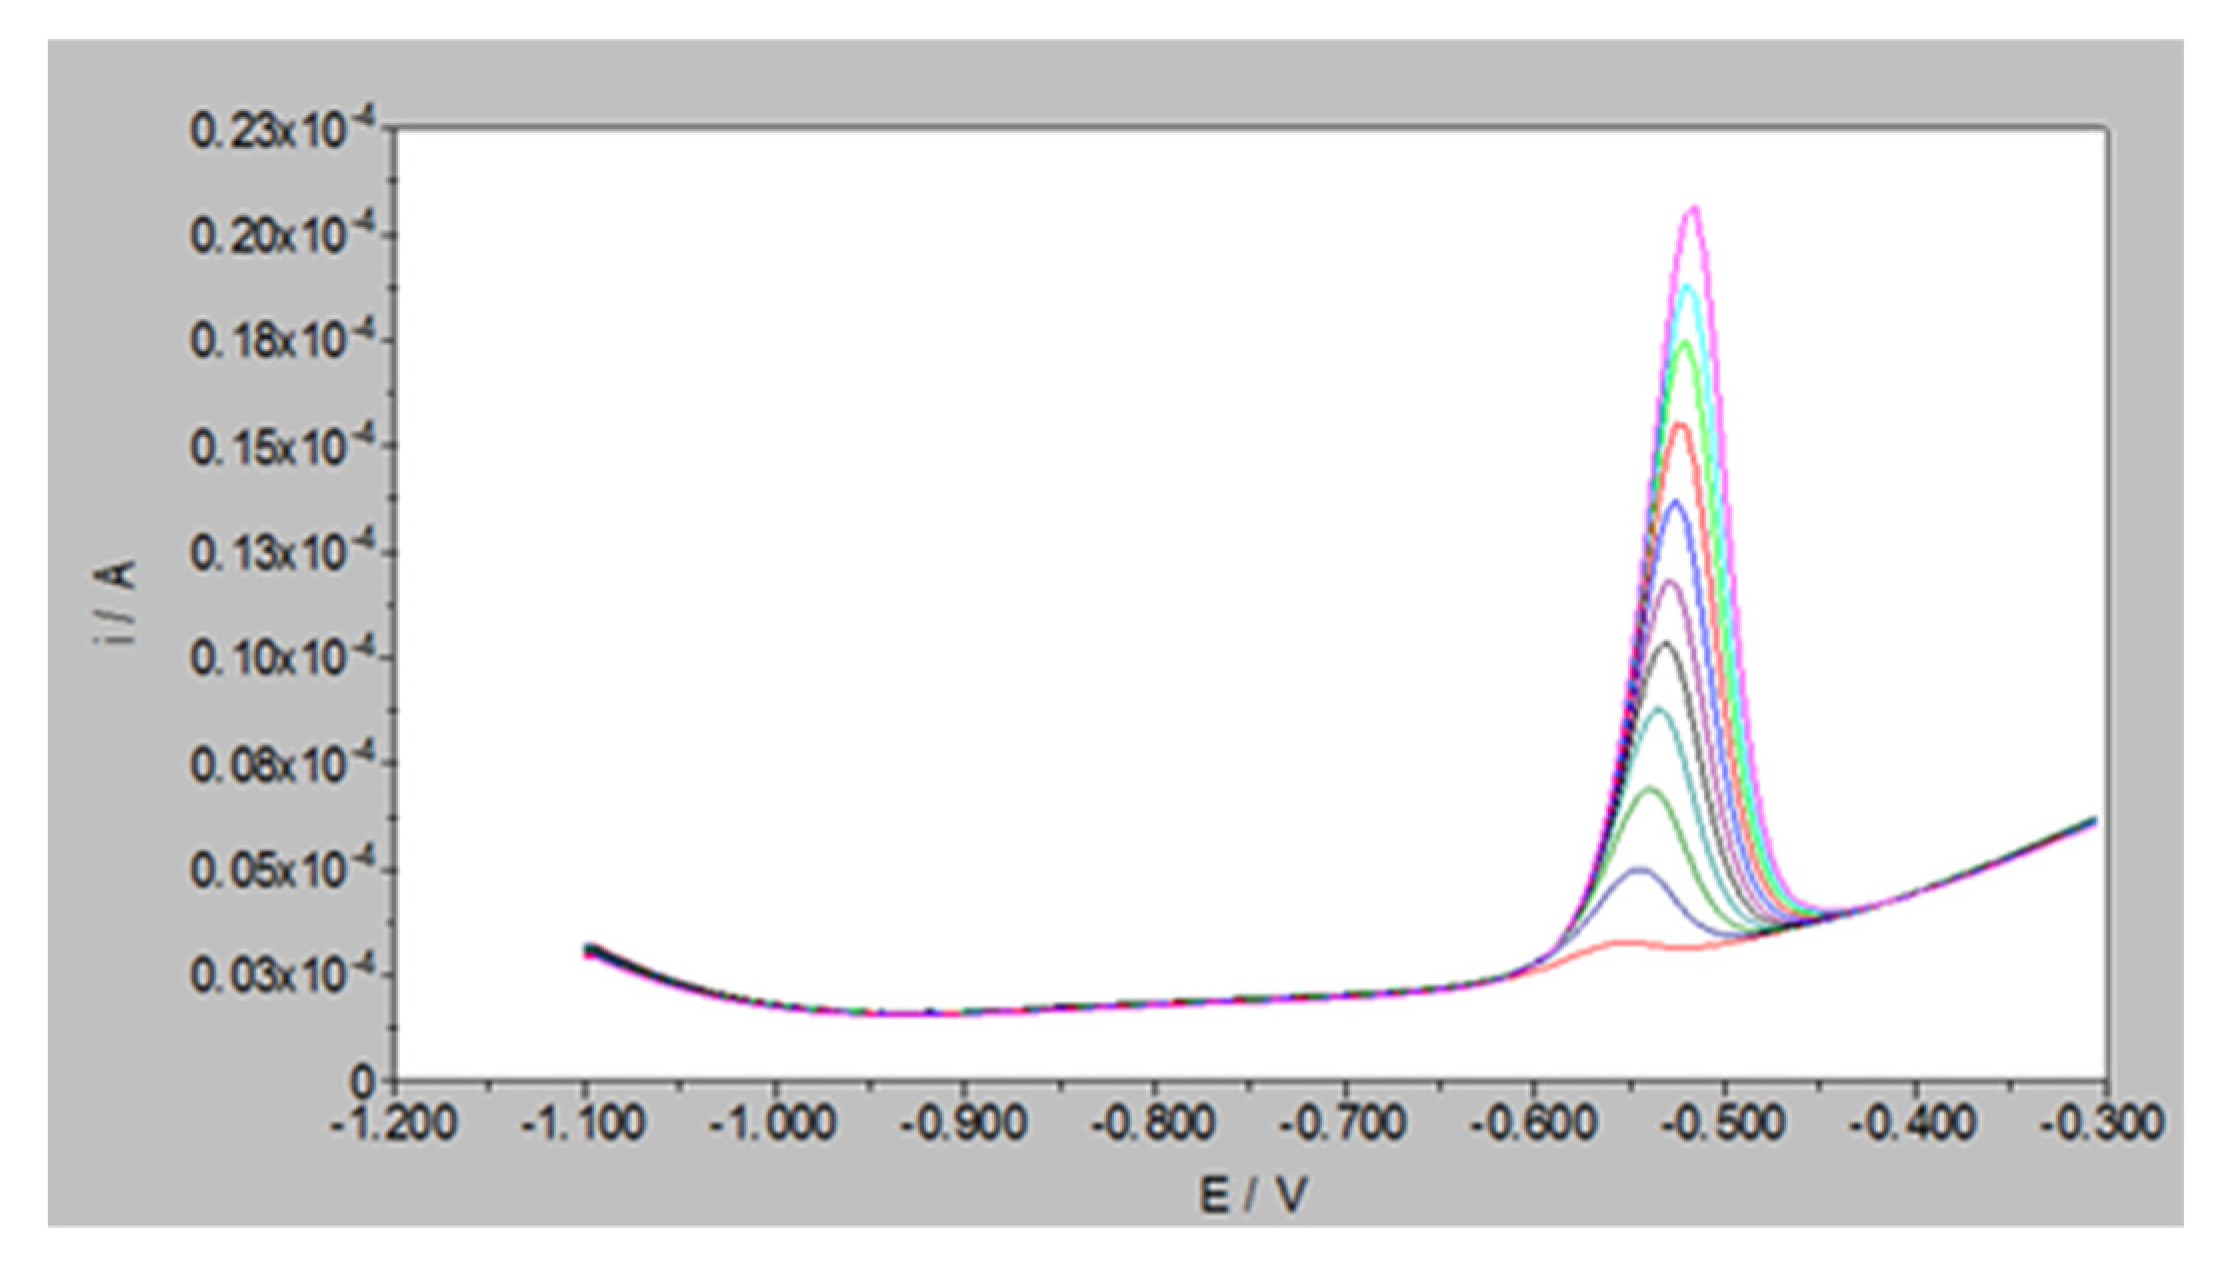
Figure 2.
Standard addition plot of peak area from Figure 1 against added Pb2+ ion concentration (1–14 µM).
Figure 2.
Standard addition plot of peak area from Figure 1 against added Pb2+ ion concentration (1–14 µM).

Figure 3.
XPS spectra of (a) blank graphite and (b) oxidized graphite in the range between 0 and 1200 eV.
Figure 3.
XPS spectra of (a) blank graphite and (b) oxidized graphite in the range between 0 and 1200 eV.
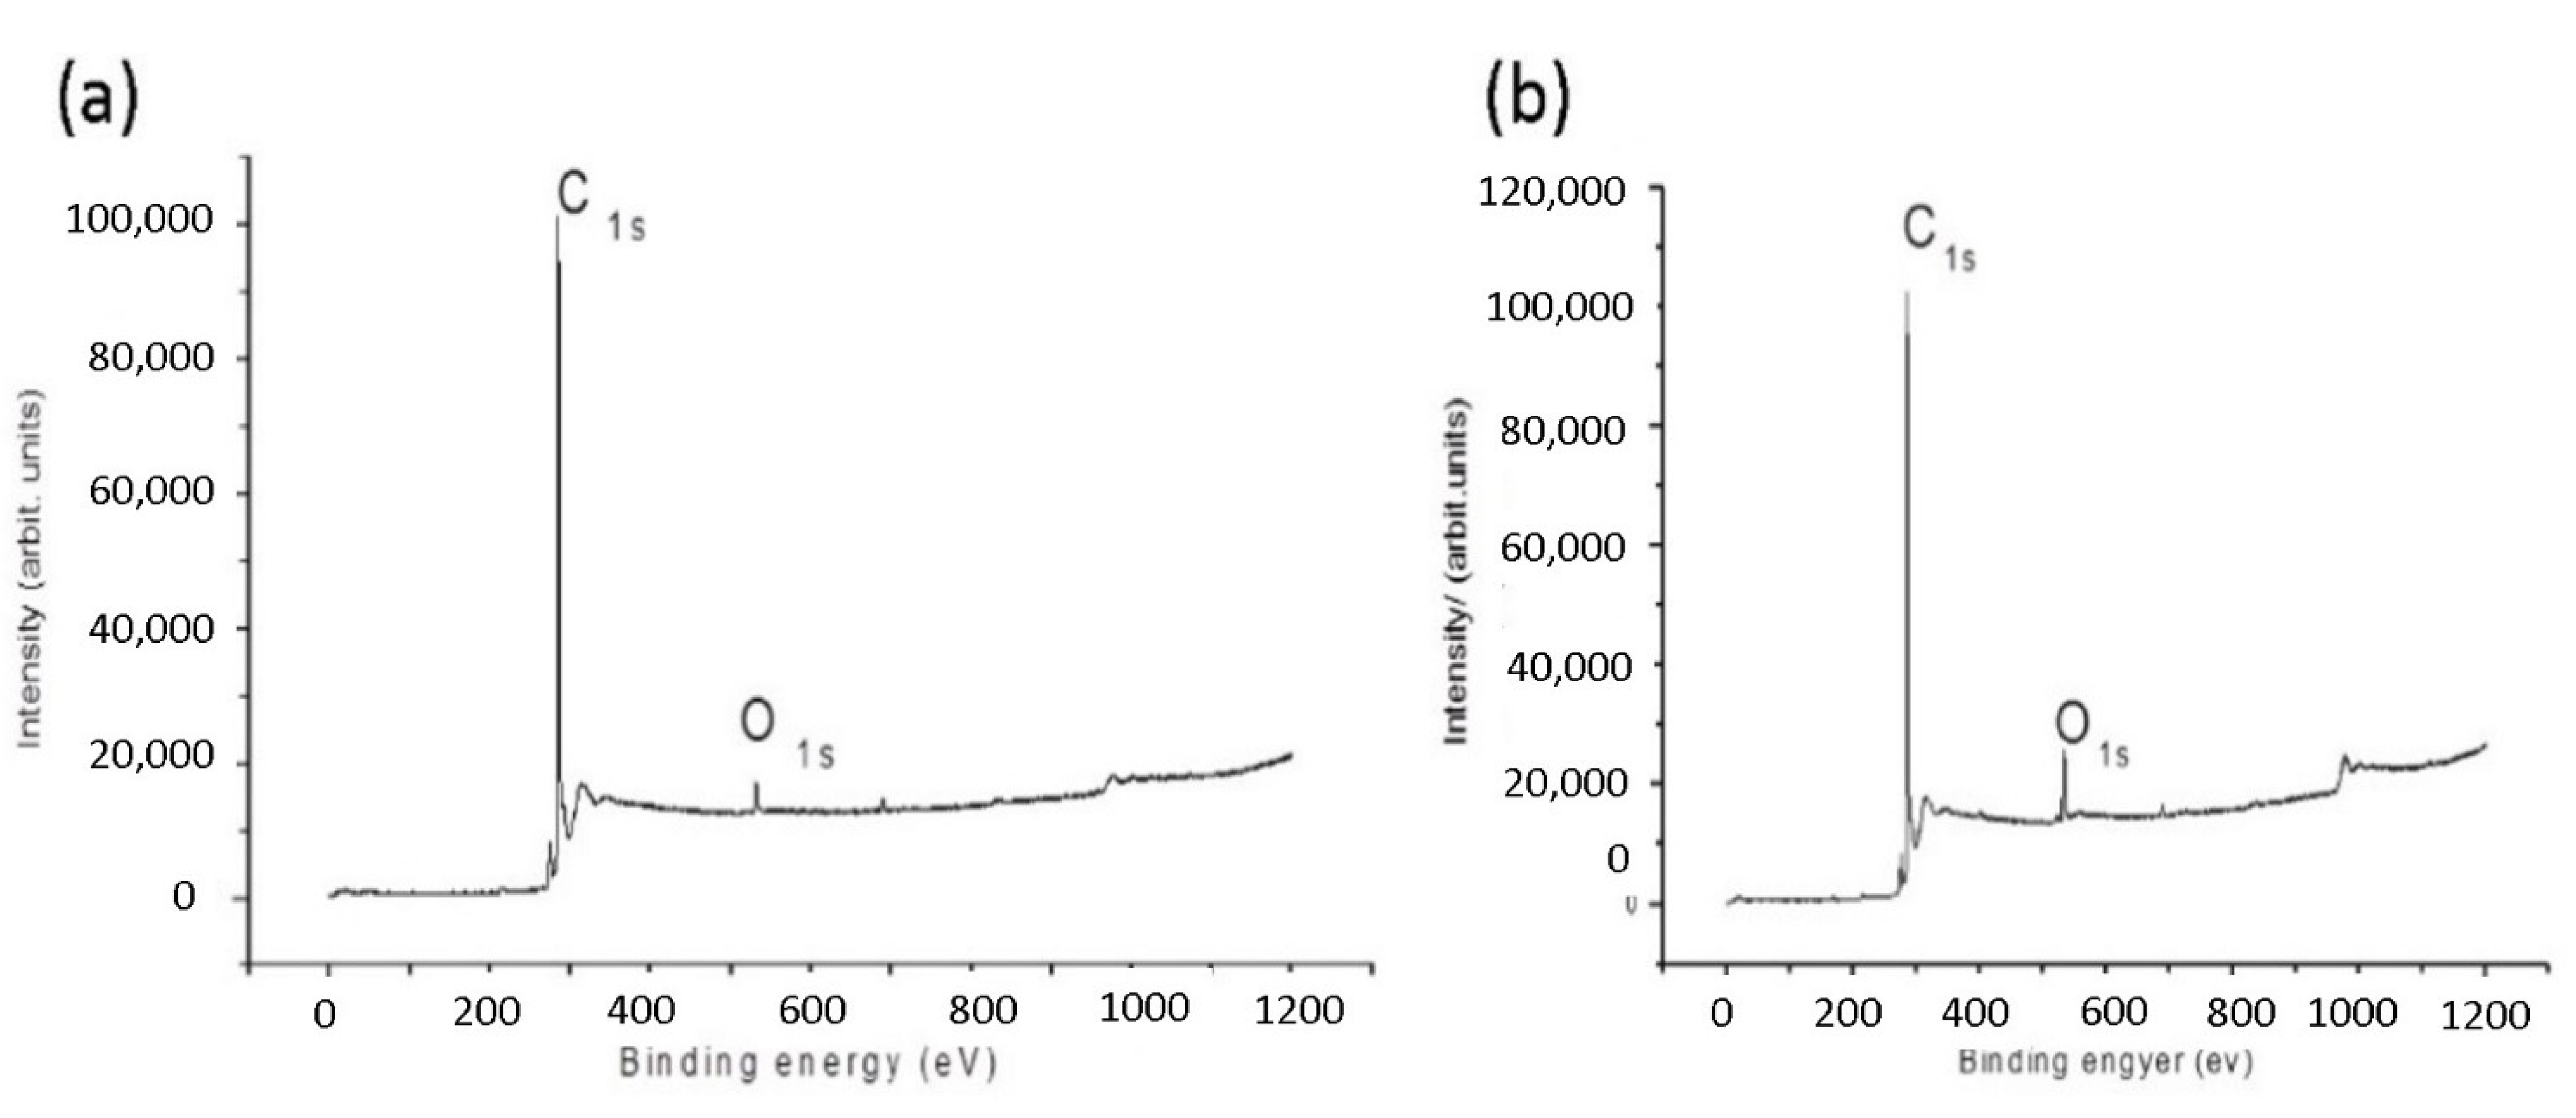
Figure 4.
XPS spectra of oxidized graphite powder after exposure to Pb2+ with the scan range of (a) 0–1200 eV and (b) 130–155 eV.
Figure 4.
XPS spectra of oxidized graphite powder after exposure to Pb2+ with the scan range of (a) 0–1200 eV and (b) 130–155 eV.


Table 1.
Average adsorbed moles of Pb2+ on the oxidized graphite (100 mg) with initial concentration of Pb2+ in the range between 50 µM and 500 µM.
Table 1.
Average adsorbed moles of Pb2+ on the oxidized graphite (100 mg) with initial concentration of Pb2+ in the range between 50 µM and 500 µM.
| Initial Concentration of Pb2+ Ion (Ci µM) | Average Adsorbed Moles of Pb2+ Ions in mol mg−1 (×10−10) |
|---|---|
| 50 | 44.863 |
| 100 | 73.333 |
| 200 | 80.806 |
| 300 | 82.313 |
| 400 | 85.816 |
| 500 | 84.400 |
Table 2.
Average adsorbed moles of Pb2+ ion (initial concentration of 100 µM) versus dosage of oxidized graphite (between 100.0 mg and 400.0 mg).
Table 2.
Average adsorbed moles of Pb2+ ion (initial concentration of 100 µM) versus dosage of oxidized graphite (between 100.0 mg and 400.0 mg).
| Dosage of Oxidised Graphite (mg) | Average Adsorbed Moles of Pb2+ Ions in mol mg−1 (×10−10) |
|---|---|
| 100 | 73.333 |
| 200 | 81.613 |
| 300 | 80.883 |
| 400 | 81.410 |
Publisher’s Note: MDPI stays neutral with regard to jurisdictional claims in published maps and institutional affiliations. |
© 2021 by the authors. Licensee MDPI, Basel, Switzerland. This article is an open access article distributed under the terms and conditions of the Creative Commons Attribution (CC BY) license (http://creativecommons.org/licenses/by/4.0/).
Share and Cite
MDPI and ACS Style
Selvanantharajah, N.; Iyngaran, P.; Abiman, P.; Kuganathan, N. Removal of Lead by Oxidized Graphite. C 2021, 7, 23. https://0-doi-org.brum.beds.ac.uk/10.3390/c7010023
AMA Style
Selvanantharajah N, Iyngaran P, Abiman P, Kuganathan N. Removal of Lead by Oxidized Graphite. C. 2021; 7(1):23. https://0-doi-org.brum.beds.ac.uk/10.3390/c7010023
Chicago/Turabian StyleSelvanantharajah, Namasivayam, Poobalasuntharam Iyngaran, Poobalasingam Abiman, and Navaratnarajah Kuganathan. 2021. "Removal of Lead by Oxidized Graphite" C 7, no. 1: 23. https://0-doi-org.brum.beds.ac.uk/10.3390/c7010023
Note that from the first issue of 2016, this journal uses article numbers instead of page numbers. See further details here.