
Impact of Graphene or Reduced Graphene Oxide on Performance of Thermoelectric Composites


1
TEMA-Center for Mechanical Technology and Automation, Department of Mechanical Engineering, University of Aveiro, 3810-193 Aveiro, Portugal
2
CICECO-Aveiro Institute of Materials, Department of Materials and Ceramic Engineering, University of Aveiro, 3810-193 Aveiro, Portugal
*
Author to whom correspondence should be addressed.
C 2021, 7(2), 37; https://0-doi-org.brum.beds.ac.uk/10.3390/c7020037
Submission received: 13 March 2021
/
Revised: 11 April 2021
/
Accepted: 19 April 2021
/
Published: 21 April 2021
(This article belongs to the Collection Feature Papers in the Science and Engineering of Carbons)
Abstract
:In recent years, worldwide research has been focused on clean and sustainable energy sources that can respond to the exponentially rising energy demands of humankind. The harvesting of unused heat in relation to automotive exhaustion, industrial processes, and home heating is one possible way of enabling the transformation from a fossil fuel-based society to a low-carbon socioeconomic epoch. Thermoelectric (TE) generators can convert heat to electrical energy thanks to high-performance TE materials that work via Seebeck effects when electricity appears between the cold part and the hot part of these materials. High figure of merit (ZT) TE material is characterized by high electrical conductivity and Seebeck coefficient, together with low thermal conductivity. This article aims to summarize ZT values reported for chalcogenides, skutterudites, and metal oxides with graphene (G) or reduced graphene oxide (rGO), and intends to understand the relationship between the addition of G-rGO to composites and ZT variation. In a majority of the publications, ZT value increases with the addition of G/rGO, although the relative growth of ZT varies for different material families, as well as inside the same group of materials, with it often being related not to a G/rGO amount but with the quality of the composite.
1. Introduction
In view of the current climate change problem, thermoelectric (TE) energy conversion is considered particularly attractive for harvesting electricity from solar heat or for recovering waste heat [1,2,3,4]. The use of waste heat as source of electrical energy in vehicles is also an attractive option for major automotive manufacturers, who actively pursue this technology to implement thermoelectric generators (TEGs) in car exhaust systems [5]. Moreover, it can significantly reduce the amount of CO2 in industrial production processes. Furthermore, silent, reliable, and versatile TEGs without moving parts [6] can be used to power portable electronic devices as additional sources of energy.
Thus, TEGs hold a tantalizing promise of greater energy efficiency by providing a robust and clean option for waste heat recovery and its conversion into useful electrical energy through the Seebeck effect [7,8,9,10]. Moreover, their size can be easily varied, since TEGs consist of TE modules, which include multiple n- and p-type semiconductor couples connected electrically in series and thermally in parallel [11]. Both types of TE materials are widely studied and characterized by the dimensionless figure of merit at the absolute temperature, T:
Accordingly, efficient TE materials should possess a great Seebeck coefficient, S, and a high electrical conductivity, σ, but a low thermal conductivity, k. Then, a high voltage related to the Seebeck coefficient can be generated by TE material placed in a temperature gradient. Electrical conductivity, σ, should be high to reduce the internal resistance of the material. Thermal conductivity of material, k, should be low to create a large temperature difference between the ends of the TE material.
However, σ is directly proportional to the carrier concentration, n, but Seebeck coefficient S, being proportional to n−2/3, according to the Pisarenko relation for doped semiconductors [12], depends on the carrier concentration in the opposite way. Moreover, there is a direct relationship between σ and the electronic contribution to thermal conductivity following from σ/k~T [13,14]. Thus, an enhancement of the conversion efficiency is a major challenge for the implementation of TE energy conversion. Moreover, TE materials should also be stable under operating conditions, as well as having long life cycles, greater cost efficiency, and compatibility with existing technologies.
Nowadays, both p- and n-type of TE materials can show a high value of ZT that strongly depends on the material properties, such as stoichiometry/doping level, charge carrier concentration, and prevailing scattering mechanisms, as well as on processing methods/conditions [15,16]. The top ZT values are up to ~2.8 at 773 K [17] and ~2.6 at 923 K [18], reported for n-type Br-doped and p-type nanostructured SnSe, respectively. ZT up to ~2.2 at 915 K for n-type PbTe [19] and ~1.9 at 320 K for n-type Bi0.5Sb1.5Te were also reported [20]. All these systems belong to the family of chalcogenide TE materials. However, typically, ZT reported for other chalcogenides such as Bi2Te3 and Sb2Te3 [21], or for skutterudites such as CoSb-family materials [22], or for metal oxides, which are promising for high-T applications due to their robustness, is lower (<1.8) [23]. Among them, metal oxide TE materials possess a considerably smaller figure of merit so far, but they are more cost-effective and high-T stable than heavy metal alloys [24,25,26].
From the other side, graphene (G), a one-atom-thick sheet of carbon with a high electron mobility of 230,000 cm2 V−1 s−1 and 125,000 cm2 V−1 s−1 at 4.2 K and room T, respectively [27], is widely considered as a functional additive [28]. Moreover, its composites with different TE materials, particularly with polyaniline, poly(3,4-ethylenedioxythiophene) and other polymers are also studied [28]. However, typically, much less agglomerative graphene oxide (GO) that can be easily reduced by chemical or heat treatment, or already reduced graphene oxide (rGO), are used in a majority of reported composites because they are cheaper and easier to prepare than high quality monolayer graphene.
Moreover, 3D network wrapping structures (or core-shell nanocomposites) with a shell layer of a few nm have been theoretically shown [29] and experimentally confirmed to strengthen the phonon scattering that could suppress thermal conductivity, and, thus, enhance ZT [30]. According to this model, if the secondary phase could be dispersed as a nanoscale shell layer on the grains of the matrix phase (core), the heat-carrying phonons would be effectively scattered; this is because of the enhanced interparticle and intraparticle boundary scattering with an increased number of interfaces [30]. An additional ZT enhancement is expected if the 3D network nanocomposite contains a wrapping phase that can scatter the phonons but maintain high electron transport. Furthermore, high electrical conductivity of the wrapping phase should be accompanied by a suitable band gap, matching with that of the matrix, to enhance the Seebeck coefficient, thus realizing an energy filtering effect in such a 3D wrapping structure. Zong et al. have shown that these demands can be satisfied using rGO as the wrapping phase because of its low thickness, high electrical conductivity (electron mobility), and band gap that can be tuned by the reduction degree (the oxygen ratio in rGO after chemical or/and thermal reduction of GO) [30]. In addition, besides the charge carrier mobility, a charge carrier density can also be enhanced in oxide TE materials by the carbon stimulated formation of oxygen vacancies [31]. Thus, a number of works were published over the last few years on G-rGO modified TE materials. In this article, a literature overview and discussion of TE performance on chalcogenides, skutterudites, and metal oxides with G-rGO additives are presented.
2. Current Achievements for Thermoelectric Materials with Graphene or Reduced Graphene Oxide
2.1. Chalcogenides
Among the chalcogenide family, Bi- and Te-based alloys are the most studied p- and n-type TE materials used in both bulk and thin film commercial applications [32]. That is because they possess a combination of relatively high Seebeck coefficient with great electrical conductivity and low thermal conductivity, which results in an elevated TE figure of merit (ZT).
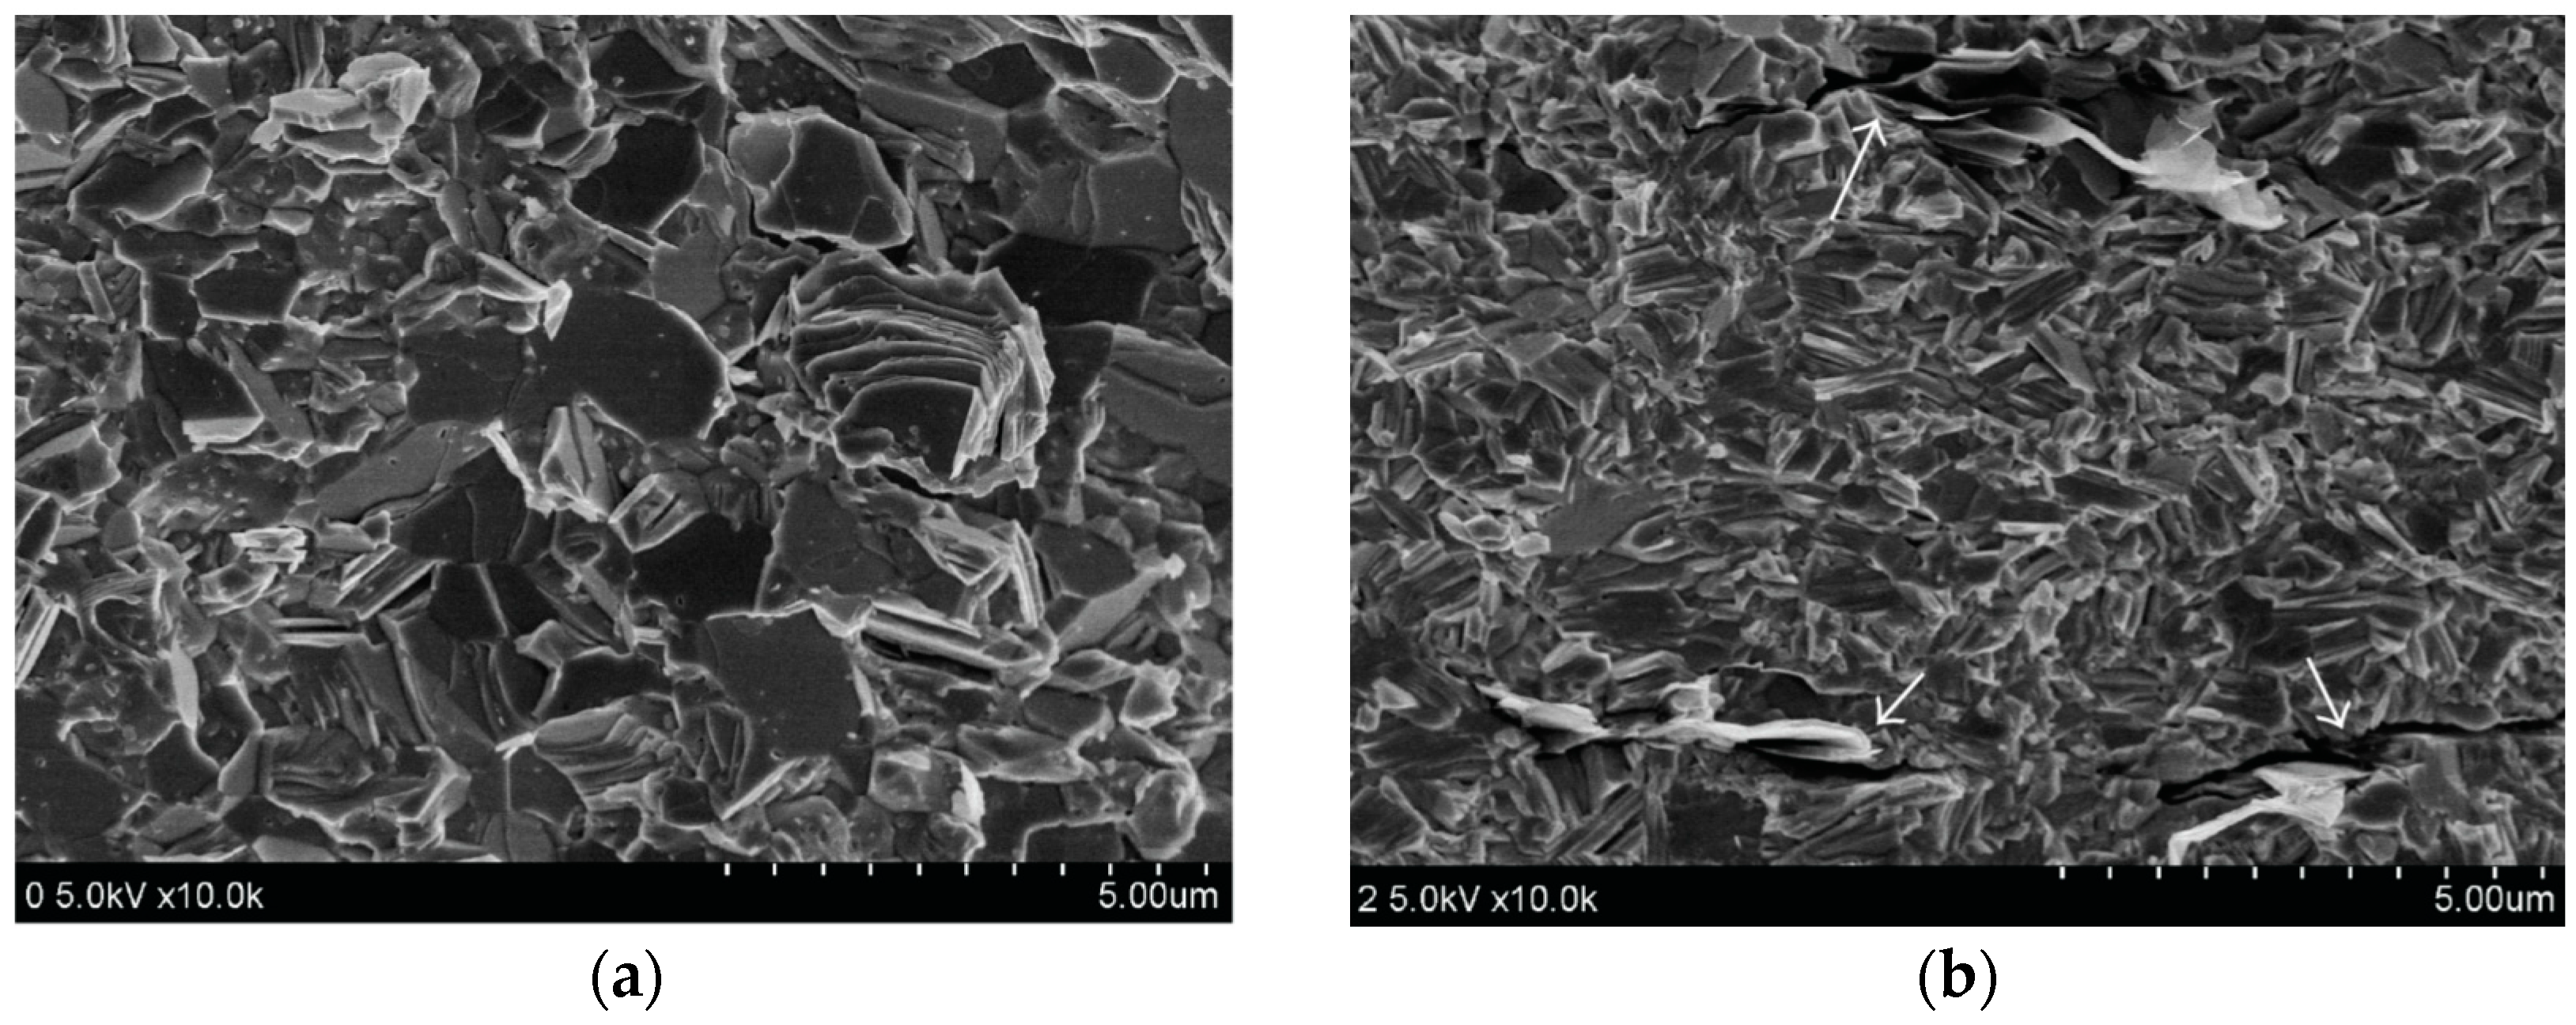
In 2013, Liang et al. [33] and Dong et al. [34] first fabricated chalcogenide Bi2Te3 with G, and PbTe with rGO. Both research groups used a spark plasma sintering (SPS) process for the densification of the obtained TE materials. Moreover, in both cases the studied composites presented slightly decreasing relative densities when the G or rGO contents increased. Moreover, the grain sizes of the pristine ceramics were found to be larger than those of the composites, as can be seen in the scanning electron microscopy (SEM) images in Figure 1 for Bi2Te3, without and with graphene [33]. At the same time, the decrease in the grain size enhances the grain boundary phonon scattering, which is beneficial for the reduction in thermal conductivity [33]. The maximum ZT values were reported to increase from 0.16 to 0.21 at 475 K, with 0.2 vol.% G addition to Bi2Te3 [33], and from 0.12 to 0.7 at 670 K, with 5 wt.% GO addition to PbTe [34].
At the same time, in 2013, Chen et al. first studied Cu-based chalcogenide TE material CuInTe2 in composite, with G obtained from expanded graphite with mass ratios of 80:1 and 40:1 [35]. The authors reported that, in incorporating G sheets into the CuInTe2 matrix, thermal conductivity was successfully decreased, thus leading to an enhanced ZT of 0.4 at 700 K for CuInTe2 composite, with G in 80:1 ratio, compared to 0.39 at 700 K for pristine CuInTe2 [35]. Further, two Cu-based chalcogenide TE materials such as Cu2SnSe3 [36] and Cu2ZnSnS4 [37] were modified by G with different concentrations. The lattice thermal conductivity of these chalcogenides decreased in composites with a low G amount, effectively resulting from the phonon scattering by the graphene interface, similar to Bi2Te3 with G [33] or PbTe with GO [34]. However, when the fraction of graphene exceeds a certain value, the thermal conductivity of the composites starts to increase; this is because of an increase in the interface thickness instead of interface area due to the tendency to aggregation of graphene nanosheets reported in both these works [36,37]. The maximum figure of merit for Cu2SnSe3 with 0.25 vol.% G was 0.44 at 700 K [36], and ZT of 0.5 at 623 K was obtained for Cu2ZnSnS4 with 0.75 wt.% G [37].
Besides the SPS Bi2Te3 reported in 2013 by Liang et al. [33], in 2016, Agarwal et al. used simple mixing and pressing of commercial Bi2Te3 with 0.05 wt.% commercial G without sintering or other processing [38]. Investigating obtained composites by nanoscale atomic force microscopy, conductive atomic force microscopy, Kelvin probe force microscopy and scanning thermal microscopy, ZT was reported to be up to 0.92 at 402 K according to these local technique studies [38].
In addition to pristine Bi2Te3, its alloys BixSbyTe3 (x = 0.36–0.5, y = 1.5–1.64) [39,40,41,42,43,44] and Bi2Te2.7Se0.3 [45] were also modified by G or rGO and studied. All of them have shown enhanced ZT after the addition of G or GO, up to certain concentrations. ZT values for chalcogenides with G or rGO are presented in Table 1 and in Figure 2 for comparison. Table 1 shows also their thermal and electrical conductivities, as well as their Seebeck coefficient values.
As it turned out, the method of TE material preparation can also affect the ZT value. Particularly, Bi0.5Sb1.5Te3 made using microwave-induced solvothermally synthesized Bi2Te3 and Sb2Te3 nanoplates with 0.1 vol.% G have shown a maximum ZT of 1.13 at 360 K, in comparison to ZT of 1.24 at 360 K for the same Bi0.5Sb1.5Te3 obtained by a ball-milling process with the same amount of G [39].
At the same time, the composite of Bi2Te3 nanowires (NW) fabricated by a wet-chemical synthetic route (WCSR) with rGO can have slightly higher room-temperature ZT of 0.4 than that of 0.3 for a composite made of Bi2Te3 powder with the same 1 wt.% rGO [46], as can be seen in Table 1. Performance enhancement was connected to higher electrical conductivity and lower thermal conductivity of G-rGO composites with nanowires. Smaller dimensions of the NWs, and, thereby, a higher interface/boundary number in Bi2Te3-NW composite with G than this number in the Bi2Te3-powder composite with G, was suggested as an explanation for the low thermal conductivity [46].
As can be seen from Figure 2, the highest ZT of 1.54 at 440 K was reported by Li et al. for Bi0.4Sb1.6Te3, with 0.4 vol.% exfoliated G [41]. Other p-type BixSbyTe3 chalcogenides with G-rGO have shown lower ZT values with a visible peak at a relatively low T, up to 400 K [39,40,42,43,44], in contrast to p-type composites of Cu-based chalcogenides (Cu2SnSe3, CuInTe2 and Cu2ZnSnS4) and G-rGO [35,36,37], with ZT continuously increasing up to the limit of the measured T range of 650–700 K. At the same time, reported n-type chalcogenide TE materials with G-rGO have also shown dissimilarities in the temperature variation of ZT. Evident low-T peak is detected for Bi2Te2.7Se0.3 [45] and for Bi2Te3 [38], while no peak is seen for SPS densified Bi2Te3 with G [33], or for PbTe with GO [34].
2.2. Skutterudites
Skutterudites with a general formula of MX3 (M = Co, Rh, or Ir; X = P, As, or Sb) have an open frame (“cagey”) structure with a body-centered cubic unit cell and a network of corner-sharing octahedra, each of which consists of one M atom in the center and six X atoms vertices [47,48]. Such a structure has motivated works on filling the cages with diverse atoms, in conjunction with the routine substitutional doping efforts, to tailor specific application functions described in many articles, including reviews [22,49]. Another strategy to enhance the TE performance of materials such as skutterudites involves the incorporation of a secondary phase, particularly 2D graphene or reduced graphene oxide, into the core-shell nanocomposites with 3D network wrapping structures [30]. Among the composites of skutterudites with G or rGO, materials such as pristine CoSb3 [50] and related Yb0.27Co4Sb12 [30], Ce0.85Fe3CoSb12 [51], and La0.8Ti0.1Ga0.1Fe3CoSb12 [52] were reported.
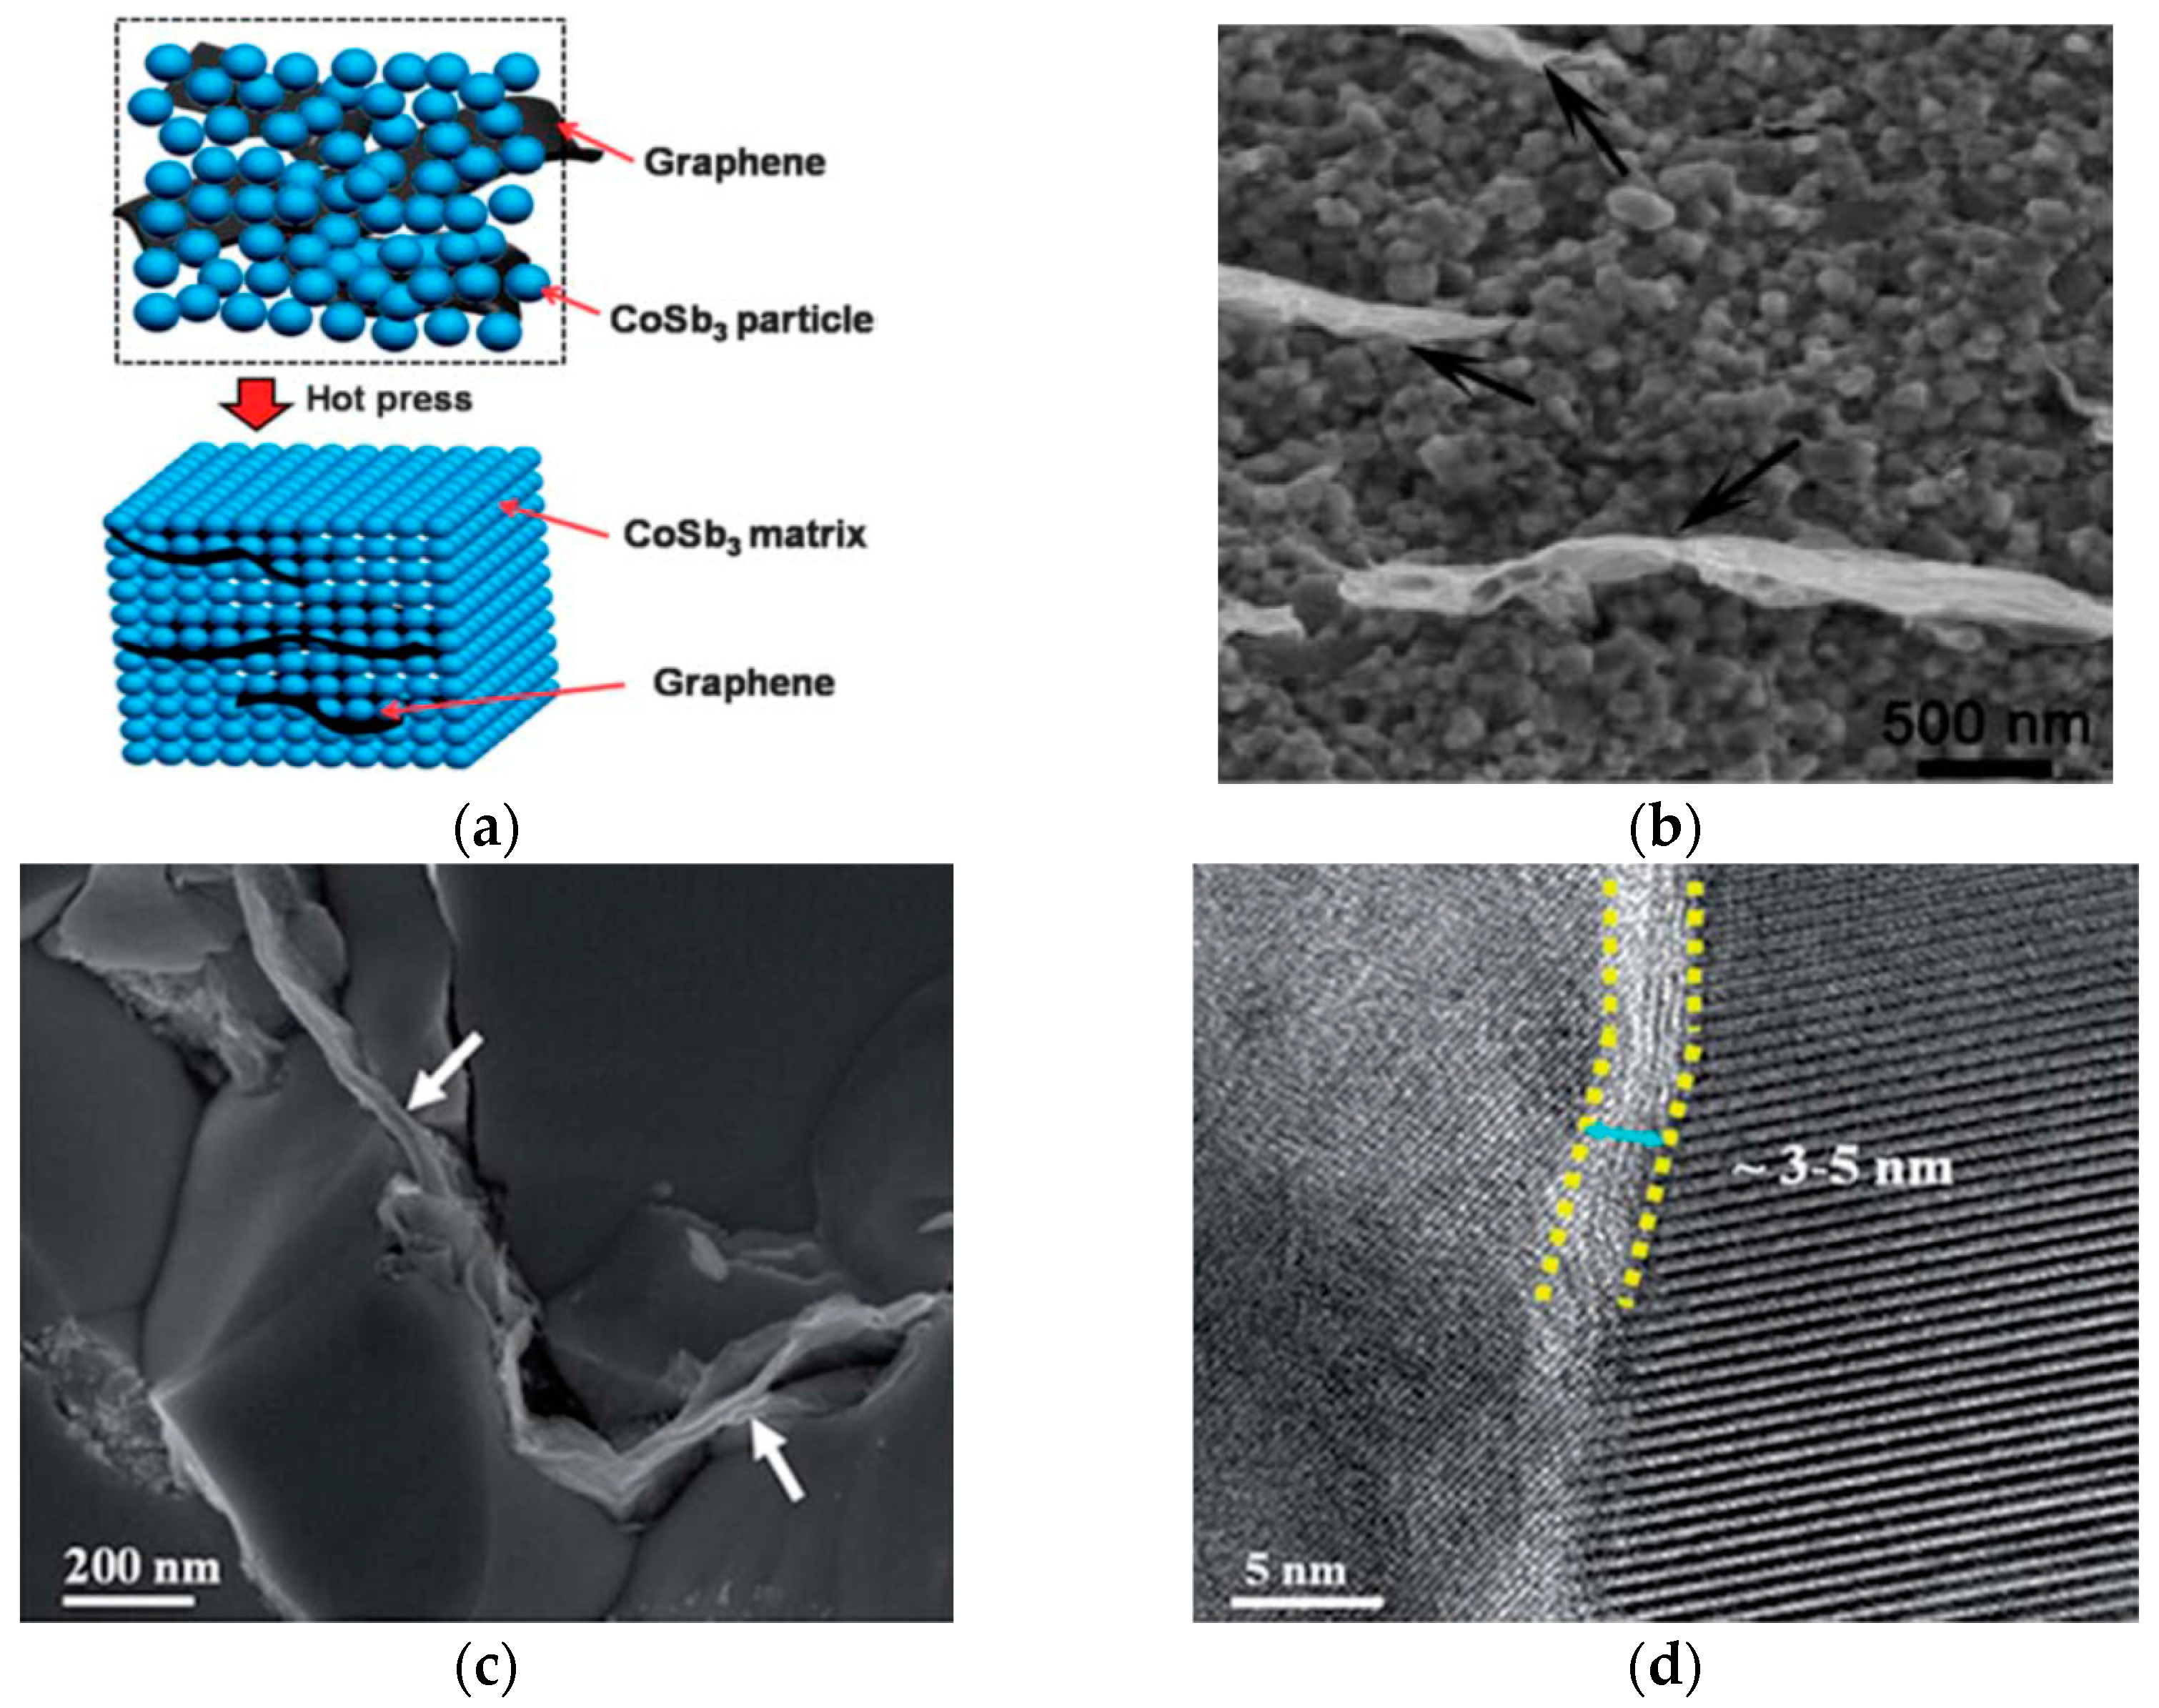
In 2013, Feng et al. first reported p-type nanocomposite with GO added to CoSb3 during the solvothermal process, performed at 290 °C for 12 h [50]. After hot pressing under 80 MPa at 600 °C for 2 h, the CoSb3 bulk hybrid with rGO has shown homogeneously embedded graphene in the nanostructured CoSb3 matrix (see Figure 3a,b). The obtained ZT value of 0.81 at 800 K for CoSb3 with 1.5 wt.% GO was found to be more than twice as high as that of bare CoSb3 [50]. Reported enhancement of ZT for CoSb3 with the addition of a small G amount was attributed to significantly increased carrier’s concentration and their mobility, and, thereby, electrical conductivity. Moreover, the well dispersed graphene in the nanostructured CoSb3 matrix prepared by solvothermal route also contributed to the diminished lattice thermal conductivity [50]. In addition, ZT ≈ 0.45 at 650 K was reported for CoSb3 also prepared by a solvothermal process with 1 wt.% commercial G, but at lower temperature of 240 °C during 24 h, with further sintering at 500 °C by Yadav et al. [53].
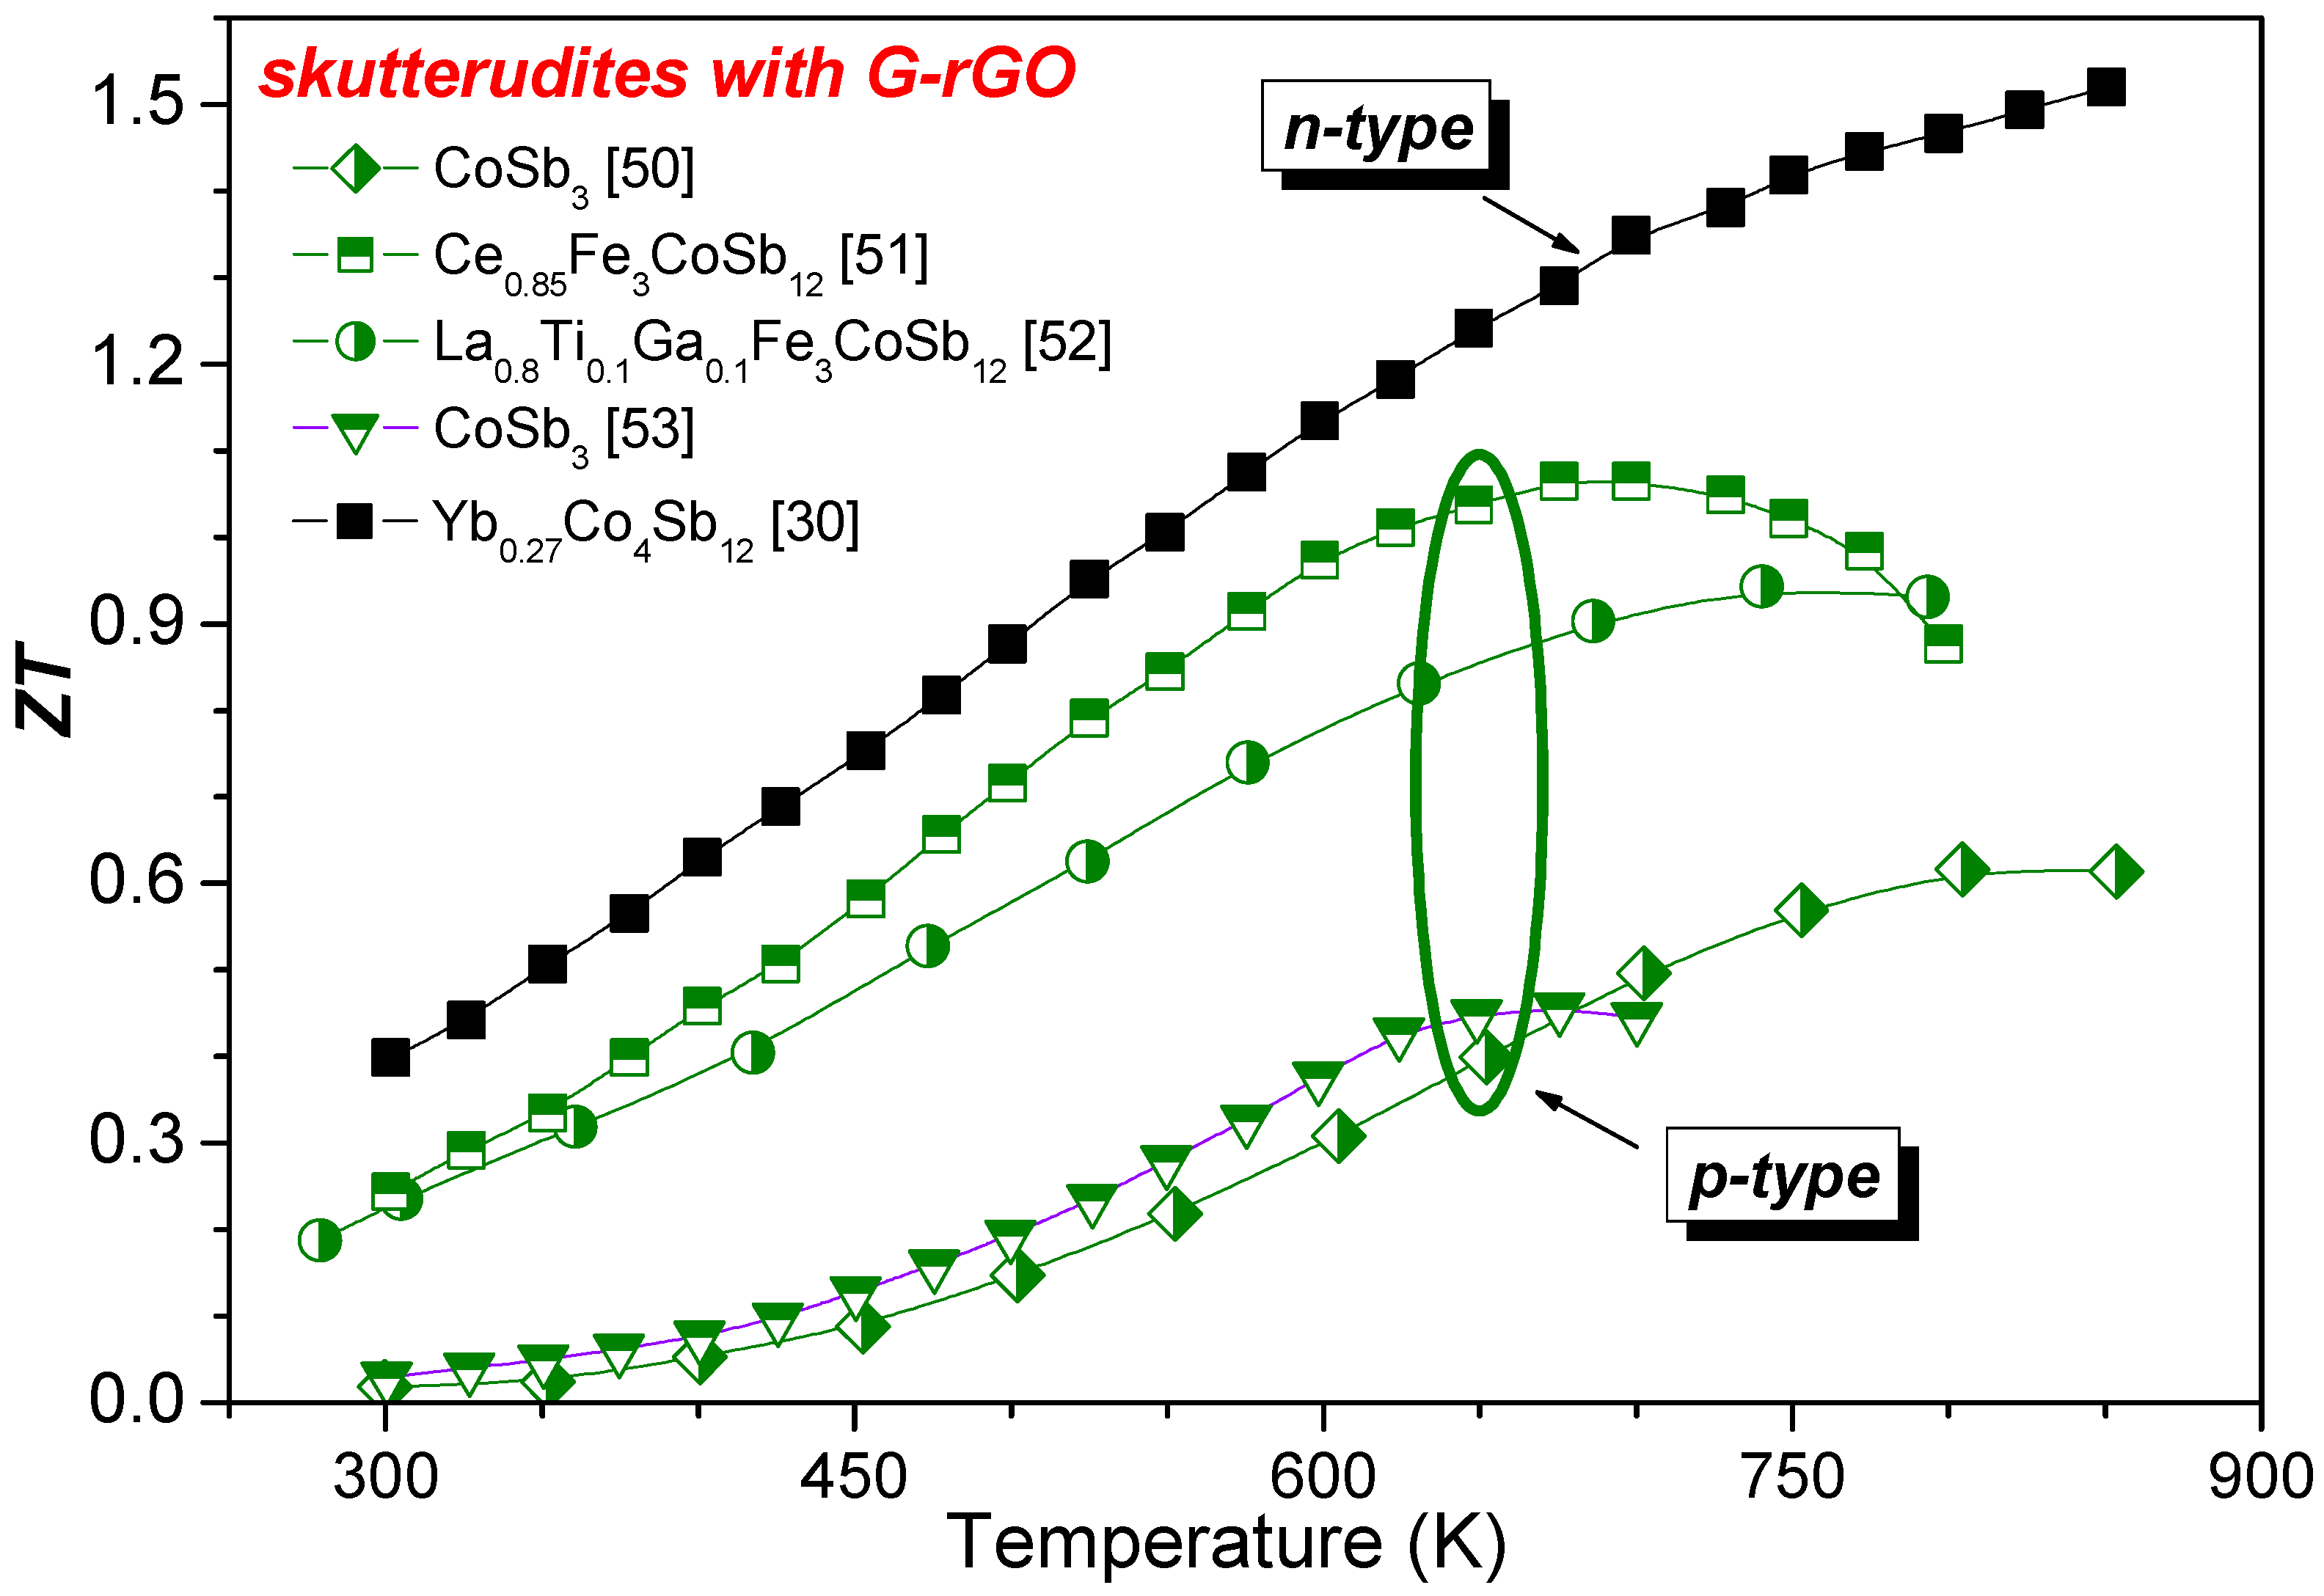
The highest ZT of 1.52 at 850 K was reported by Zong et al., for SPS densified composite of n-type Yb0.27Co4Sb12 skutterudite, prepared by conventional solid-state melting method and 0.72 vol.% GO [30]. SEM (see Figure 3c) and transmission electron microscopy (TEM) analysis (see Figure 3d) revealed that rGO embedded in boundaries of Yb0.27Co4Sb12 was wrapped and 3–5 nm thick. Thus, 3D-rGO network wrapping architecture dramatically reduced the lattice thermal conductivity due to enhanced interparticle and intraparticle phonon scattering effects, and simultaneously enhanced the Seebeck coefficient due to the energy filtering effect of the grain boundary semiconductive rGO layer with nanometer thickness, resulting in high ZT [30]. Moreover, both when GO was added to Ce0.85Fe3CoSb12 [51] and when G was grown in-situ by plasma-enhanced chemical vapor deposition (PECVD) in La0.8Ti0.1Ga0.1Fe3CoSb12 [52], the values of ZT increased in comparison to pure CoSb3 or CoSb3 with G or rGO, as can be seen in Table 2 and in Figure 4.
Figure 4 presents that all the reported skutterudite materials combined with G-rGO show increase of ZT with the temperature. Moreover, p-type materials can show a peak of ZT at 700–800 K in contrast to the only reported n-type skutterudite Yb0.27Co4Sb12 with rGO that presented no peak or saturation up to 850 K. In addition, the highest ZT reported for p-type (Ce,Fe)CoSb12 with rGO (ZT of 1.06 at 700 K for Ce0.85Fe3CoSb12 [51]) is very close to ZT obtained for more complex multicomponent p-type skutterudites without addition of G or rGO such as (La,Ce,Fe)CoSb12 (ZT of 1.15 at 748 K in La0.68Ce0.22Fe3.5Co0.5Sb12 [54]) or (Ca,Ce,Nb,Fe)CoSb12 (ZT of 1.1 at 748 K for Ca0.35Ce0.35Nd0.35Fe3.5Co0.5Sb12 [55]). Moreover, the highest ZT value of 1.52 at 850 K reported for unique n-type skutterudite Yb0.27Co4Sb12 with rGO [45] is not far from ZT of 1.8 at 823 K reported for the more complicated n-type (Sr,Ba,Yb)yCo4Sb12 with 0.91 wt.% In0.4Co4Sb12 [56]. Thus, TE performance similar to that of complex skutterudites can be obtained by adding G or rGO to simpler structures.
2.3. Metal Oxides
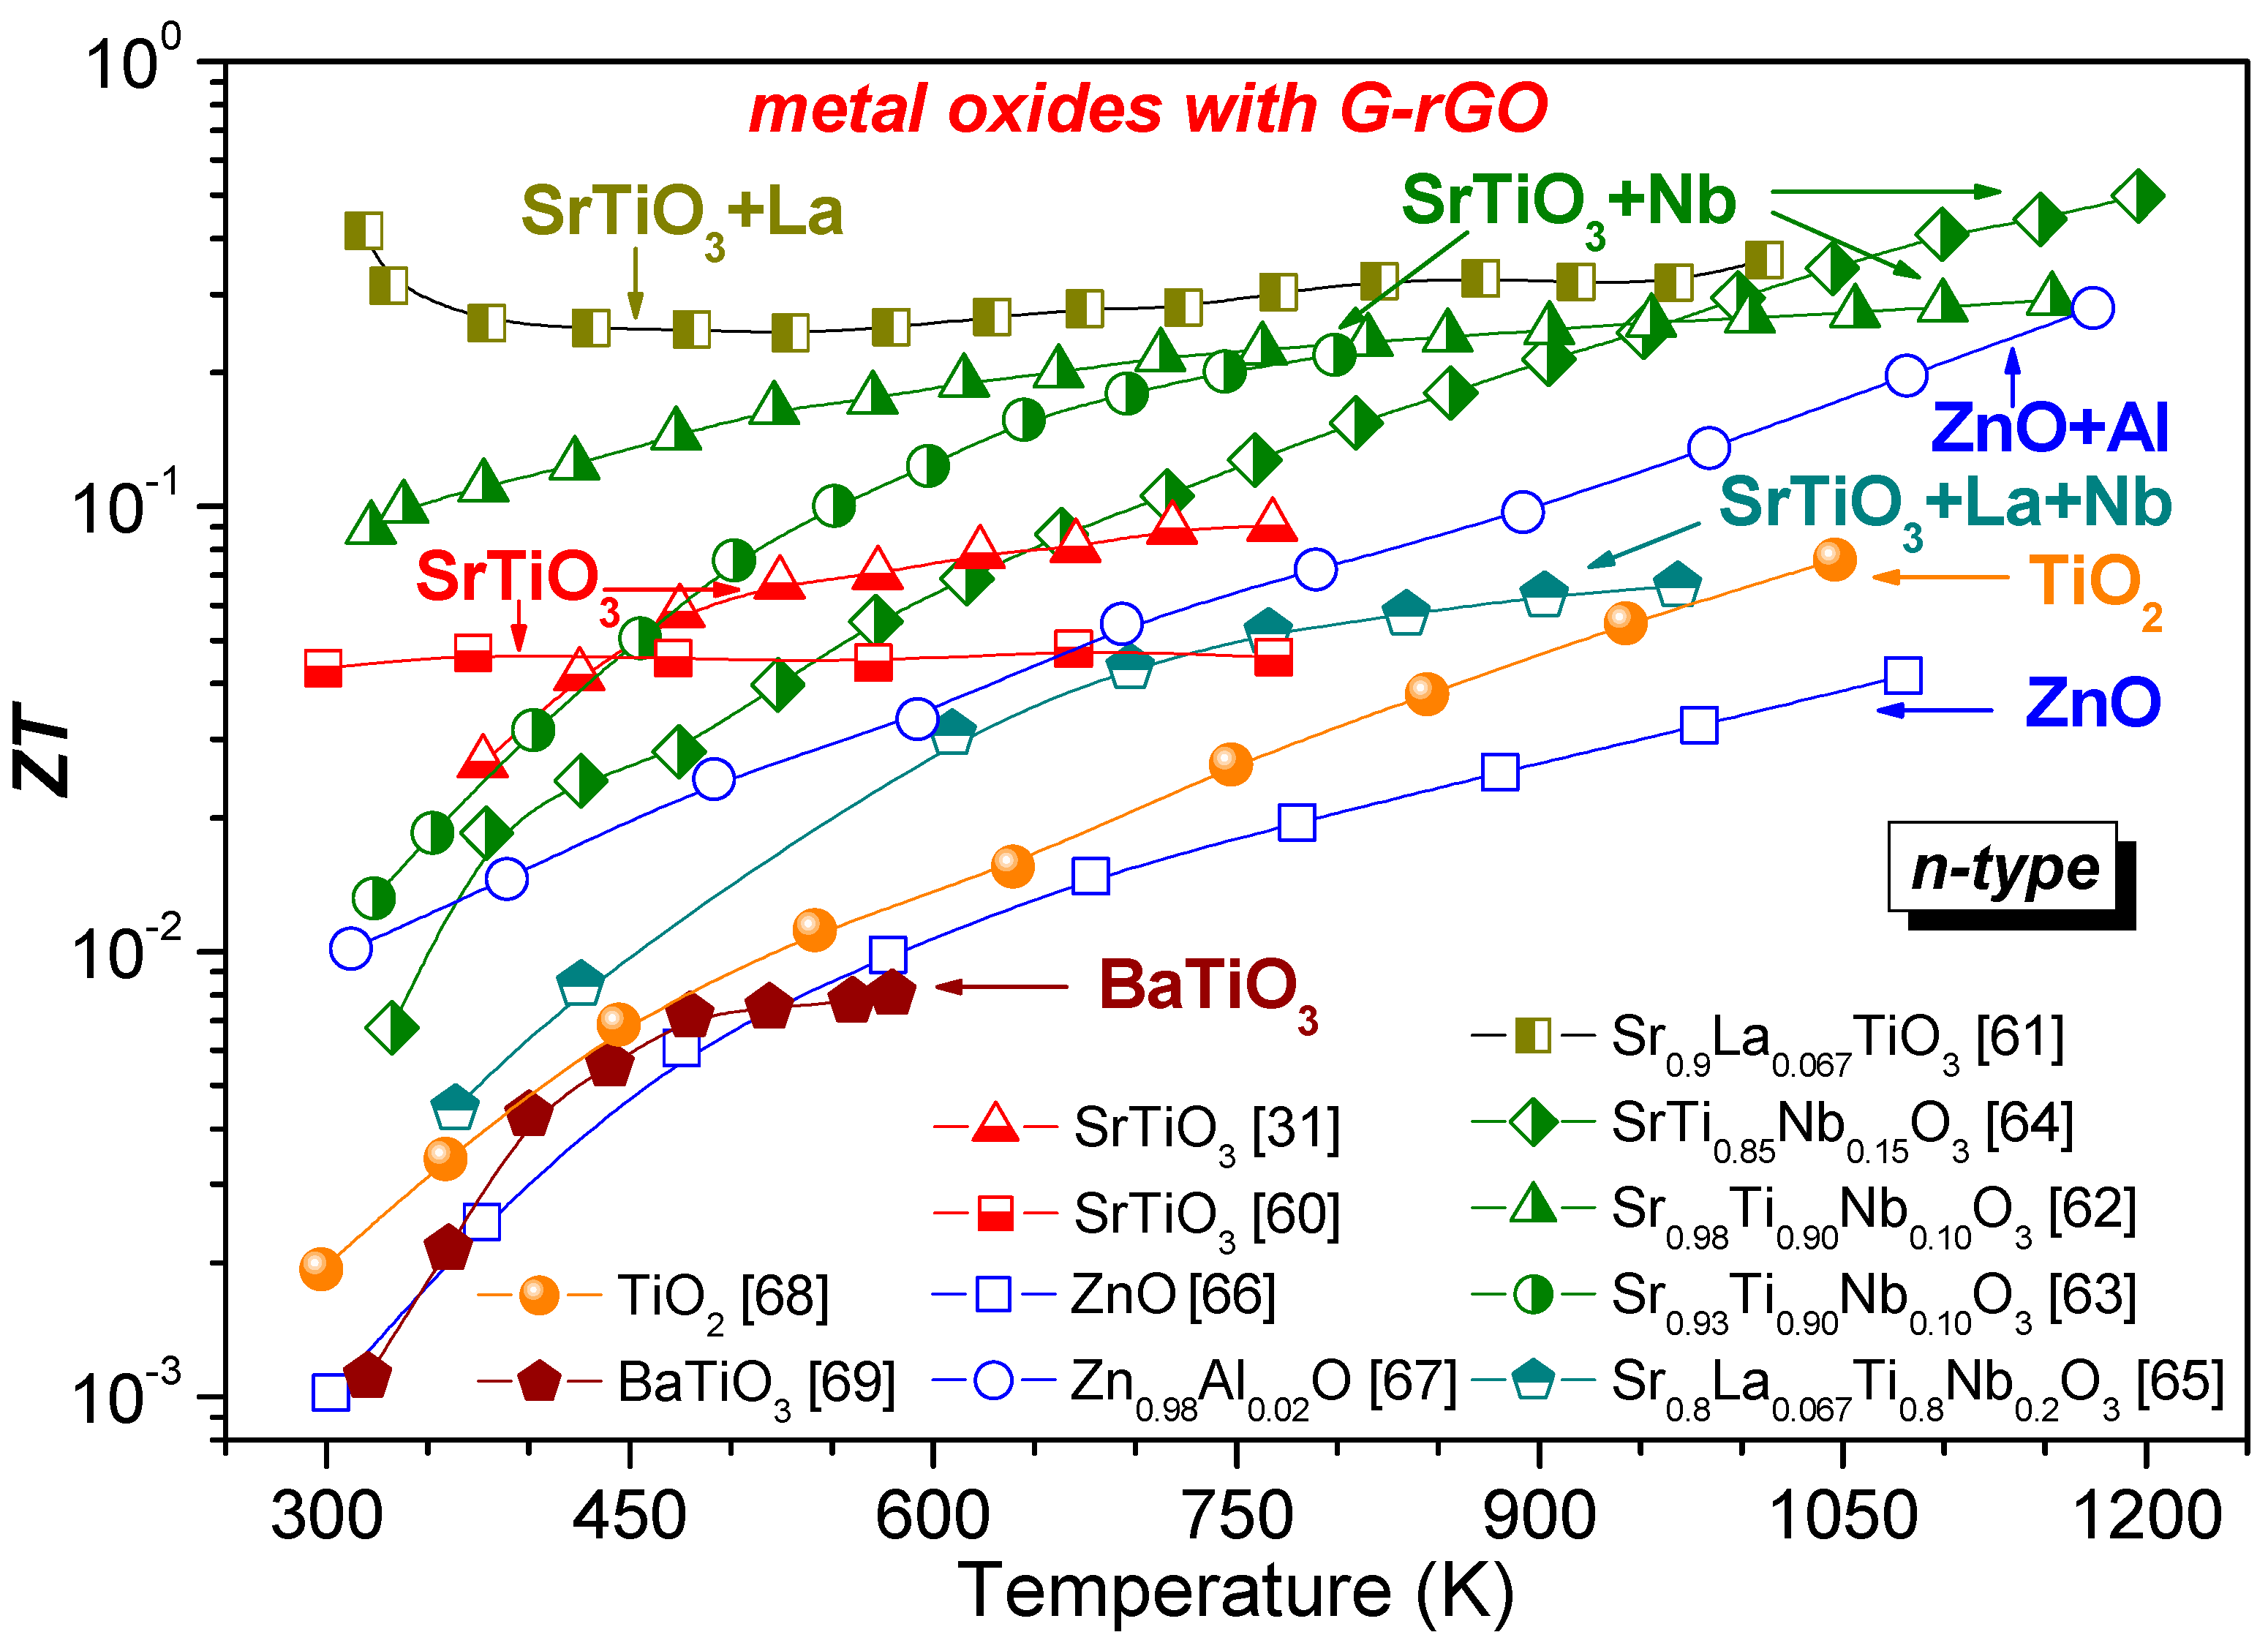
In contrast to chalcogenides, skutterudites or other TE materials, metal oxides are not so deeply studied yet and there are only few well known p-type materials such as NaxCoO2 and Ca3Co4O9+δ, which have been found very promising especially in high T range, benefiting from their layered structure. BiCuSeO as well as n-type CaMnO3- and SrTiO3-based materials are also among the most studied TE oxides [57,58,59]. There are several reports since 2015 on the influence of G-rGO on n-type SrTiO3- or ZnO-based materials, TiO2 or BaTiO3 [31,60,61,62,63,64,65,66,67,68,69], summarized in Table 3 and presented in Figure 5, but there is no available report on p-type metal oxide TEs modified by G-rGO.
A composite of commercial powder of pure SrTiO3 with rGO densified by SPS was studied by Feng et al., which reported a ZT value of 0.09 at 760 K for 0.64 vol.% GO [31]. That is higher than the ZT of 0.05 at 673 K reported for the similar composite densified by SPS, but with SrTiO3 powder obtained by conventional solid-state reaction method and mixed with 0.7 wt.% GO by Rahman et al. [60]. However, in both cases, the authors reported significantly enhanced ZT after the addition of GO. Feng et al. also reported that room-T electrical conductivity of SrTiO3 densified in vacuum by SPS increases from 18 S/m to 1633 S/m, after the addition of rGO and without any additional reducing process [31]. Based on electron energy-loss spectroscopy analysis and low-angle annular dark field imaging, Feng et al. concluded that rGO in composite with SrTiO3 serves as a carbon source that promotes the formation of oxygen vacancies via a mild reaction with oxygen atoms on the surface of SrTiO3 grains, and that is the reason behind the highly increased carrier density for SrTiO3 with rGO [31].
Moreover, although the pristine SrTiO3 was doped by many different elements, such as La, Nd, Sm, Gd, Dy, Y, Er Pr, Yb, Ta, Nb, etc., to enhance ZT [57,59], the G-rGO effect on ZT was studied only on SrTiO3 doped by La, incorporated at Sr-site [61], or by Nb in Ti-position [62,63], or simultaneously doped by La and Nb [65]. In general, the ZT of Nb- and simultaneously La,Nb-doped SrTiO3 composites with G-rGO were found to increase with the temperature, and the highest ZT values were reported at the highest measured T of these composites without an obvious peak (see Figure 5).
The addition of 0.6 wt.% GO to SrTi0.90Nb0.10O3, prepared by the conventional method, leads to ZT of 0.24 at 1160 K, as was reported by Okhay et al. [62]. At the same time, almost zero ZT was detected by Dey et al. for SPS SrTi0.85Nb0.15O3 with 0.5 wt.% GO; that was significantly enhanced, however, to 0.5 at 1200 K by further increase of GO amounts up to 1.5 wt.% [64]. Considering Sr vacancy as a defect that can serve for phonon scattering, and thus decrease thermal conductivity and increase ZT, Okhay et al. studied composites of rGO with nonstoichiometric Nb-doped SrTiO3 with 2 mol.% Sr vacancies, achieving the highest ZT of 0.29 at 1160 K for Sr0.98Ti0.90Nb0.10O3 with 0.6 wt.% GO [62]. Following that direction, Wu et al. increased Sr deficiency to 7 mol.%, thus obtaining a ZT of 0.22 at 800 K for Sr0.93Ti0.90Nb0.10O3 + 0.6 wt.% GO nominal composition [63]. However, such high Sr deficiency should result not only in the formation of Sr vacancies but in the segregation of the titanium oxide secondary phase [70].
On the other hand, a ZT of 0.36 at 1023 K was reported by Lin et al. for Sr-deficient La-doped strontium titanate La0.067Sr0.9TiO3 with 0.6 wt.% G, obtained by exfoliation of graphite [61]. The high ZT value is accompanied by the highest electrical conductivity and the lowest thermal conductivity in Table 3. The observed enhancement of electrical conductivity in La-doped SrTiO3 with graphene loading was explained by the formation of a percolation network and the graphene-facilitated reduction of La-doped SrTiO3 at the grain boundaries, resulting in faster electronic transport. Similar to other TE materials, Lin et al. also posited that the introduction of G lead to significant reduction in grain size of the nanocomposites from 2.2 μm for pristine La-doped SrTiO3 to 412 nm when 0.6 wt.% G was added. Such nanotexturing introduces significant lattice scattering and, hence, reduces the thermal conductivity of the composite [61]. However, the reason for the decrease in thermal conductivity on cooling below 500 K reported by Lin et al., for La0.067Sr0.9TiO3 with 0.6 wt.% G, and thereby for room temperature ZT with a value of 0.42, is still unclear, since no other report on graphene-modified SrTiO3-based TE materials, including that from the same group [65], has presented such variation.
Moreover, although both La-doped SrTiO3 and Nb-doped SrTiO3 with G-rGO present in Figure 5 and Table 3 rather high ZT, from 0.22 to 0.5, either the addition of solvent-derived flakes of graphene nanoplatelets to or the mixing GO prepared by the modified Hammer method with Sr0.8La0.067Ti0.8Nb0.2O3-δ composition, was reported to lead to ZT that does not exceed 0.07 at 1000 K [65].
In addition to the described above metal oxide TE materials, Chen et al. reported a ZT of 0.28 at 1173 K for Al-doped ZnO with 1.5 wt.% GO [67], which is much higher than 0.04 at 1073 K reported for pure ZnO with 1 wt.% G [66], or even 0.064 at 1050 K for TiO2 with 4 wt.% GO [68] and 0.08 at 600 K for BaTiO3 with 1.7 wt.% GO [69].
In summary, according to the aforementioned reports, the ZT of TE materials tends to be enhanced by G-rGO addition. However, the systematic studies of the G-rGO concentration influence on the TE performance of composite materials show that ZT decreases after the application of a certain concentration of G or rGO, for all material types. Such an optimal concentration of G-rGO, at which the highest ZT can be achieved, is individual for each composite and is reported to be between 0.1 and 1.4 vol.% (for chalcogenide Bi0.5Sb1.5Te3 [37] and for skutterudite Ce0.85Fe3CoSb12 [51], respectively) or from 0.05 to 4 wt.% (for chalcogenide Bi2Te2.7Se0.3 [45] or Bi0.48Sb1.52Te3 [40] and for metal oxide TiO2 [68], respectively). However, the trend is general, and it deserves a comparative consideration involving all ZT components in the next section.
3. Relationship between the Thermoelectric Performance of Materials and the Presence of Graphene or Reduced Graphene Oxide
According to Equation (1) for the dimensionless figure of merit, ZT depends on electrical and thermal conductivity, as well as on the value of the Seebeck coefficient. As it was described above, the Seebeck coefficient decreases with increase in charge carrier concentration. Thus, a high S can be observed in dielectric materials, such as undoped metal oxide, particularly SrTiO3. After the addition of G-rGO to insulating pure SrTiO3, its electrical conductivity increases and absolute value of S decreases as can be seen in Figure 6a, as reported by Rahman et al. [60] and supported by Wu et al. [63]. However, σ of SrTiO3 can be significantly increased not only by the addition of G-rGO but also by Nb or La doping process [61,62,64]. Then, the addition of G-rGO to an already semiconductive material, such as heavily doped SrTiO3, chalcogenides and skutterudites, does not lead to serious variations of S, as shown in Figure 6b–d, respectively, although they could be slightly enhanced in the case of Yb0.27Co4Sb12 skutterudite (see Figure 6d) due to the energy filtering effect [30].
In accordance with the abovementioned statements, the electrical conductivity σ of rather resistive metal oxides is significantly enhanced after G-rGO addition, as can be seen in Figure 7a, in comparison to less notable changes of σ for initially conductive chalcogenides or skutterudites, as shown in Figure 8a. Moreover, there are several studies on chalcogenides (Bi0.44Sb1.56Te3 [43], Bi0.5Sb1.5Te3 [44]) and skutterudites (Yb0.27Co4Sb12 [30], Ce0.85Fe3CoSb12 [51]), with a reported decrease in electrical conductivity after the addition of G-rGO. In these articles, the authors stressed that the G-rGO nm-layer located between the grains can grow and form agglomerates, with increasing rGO content that leads to decreased charge carrier mobility and, thereby, electrical conductivity because of the boundary scattering effect. At the same time, both the carrier concentration and its mobility were typically increased with the addition of G-rGO in the metal oxides (see Figure 7b,c, respectively). However, in the case of the chalcogenides or skutterudites, the carrier concentration was reported only to change insignificantly, while the mobility of the carriers was not strongly raised in general with the increase of rGO content (see Figure 8b).
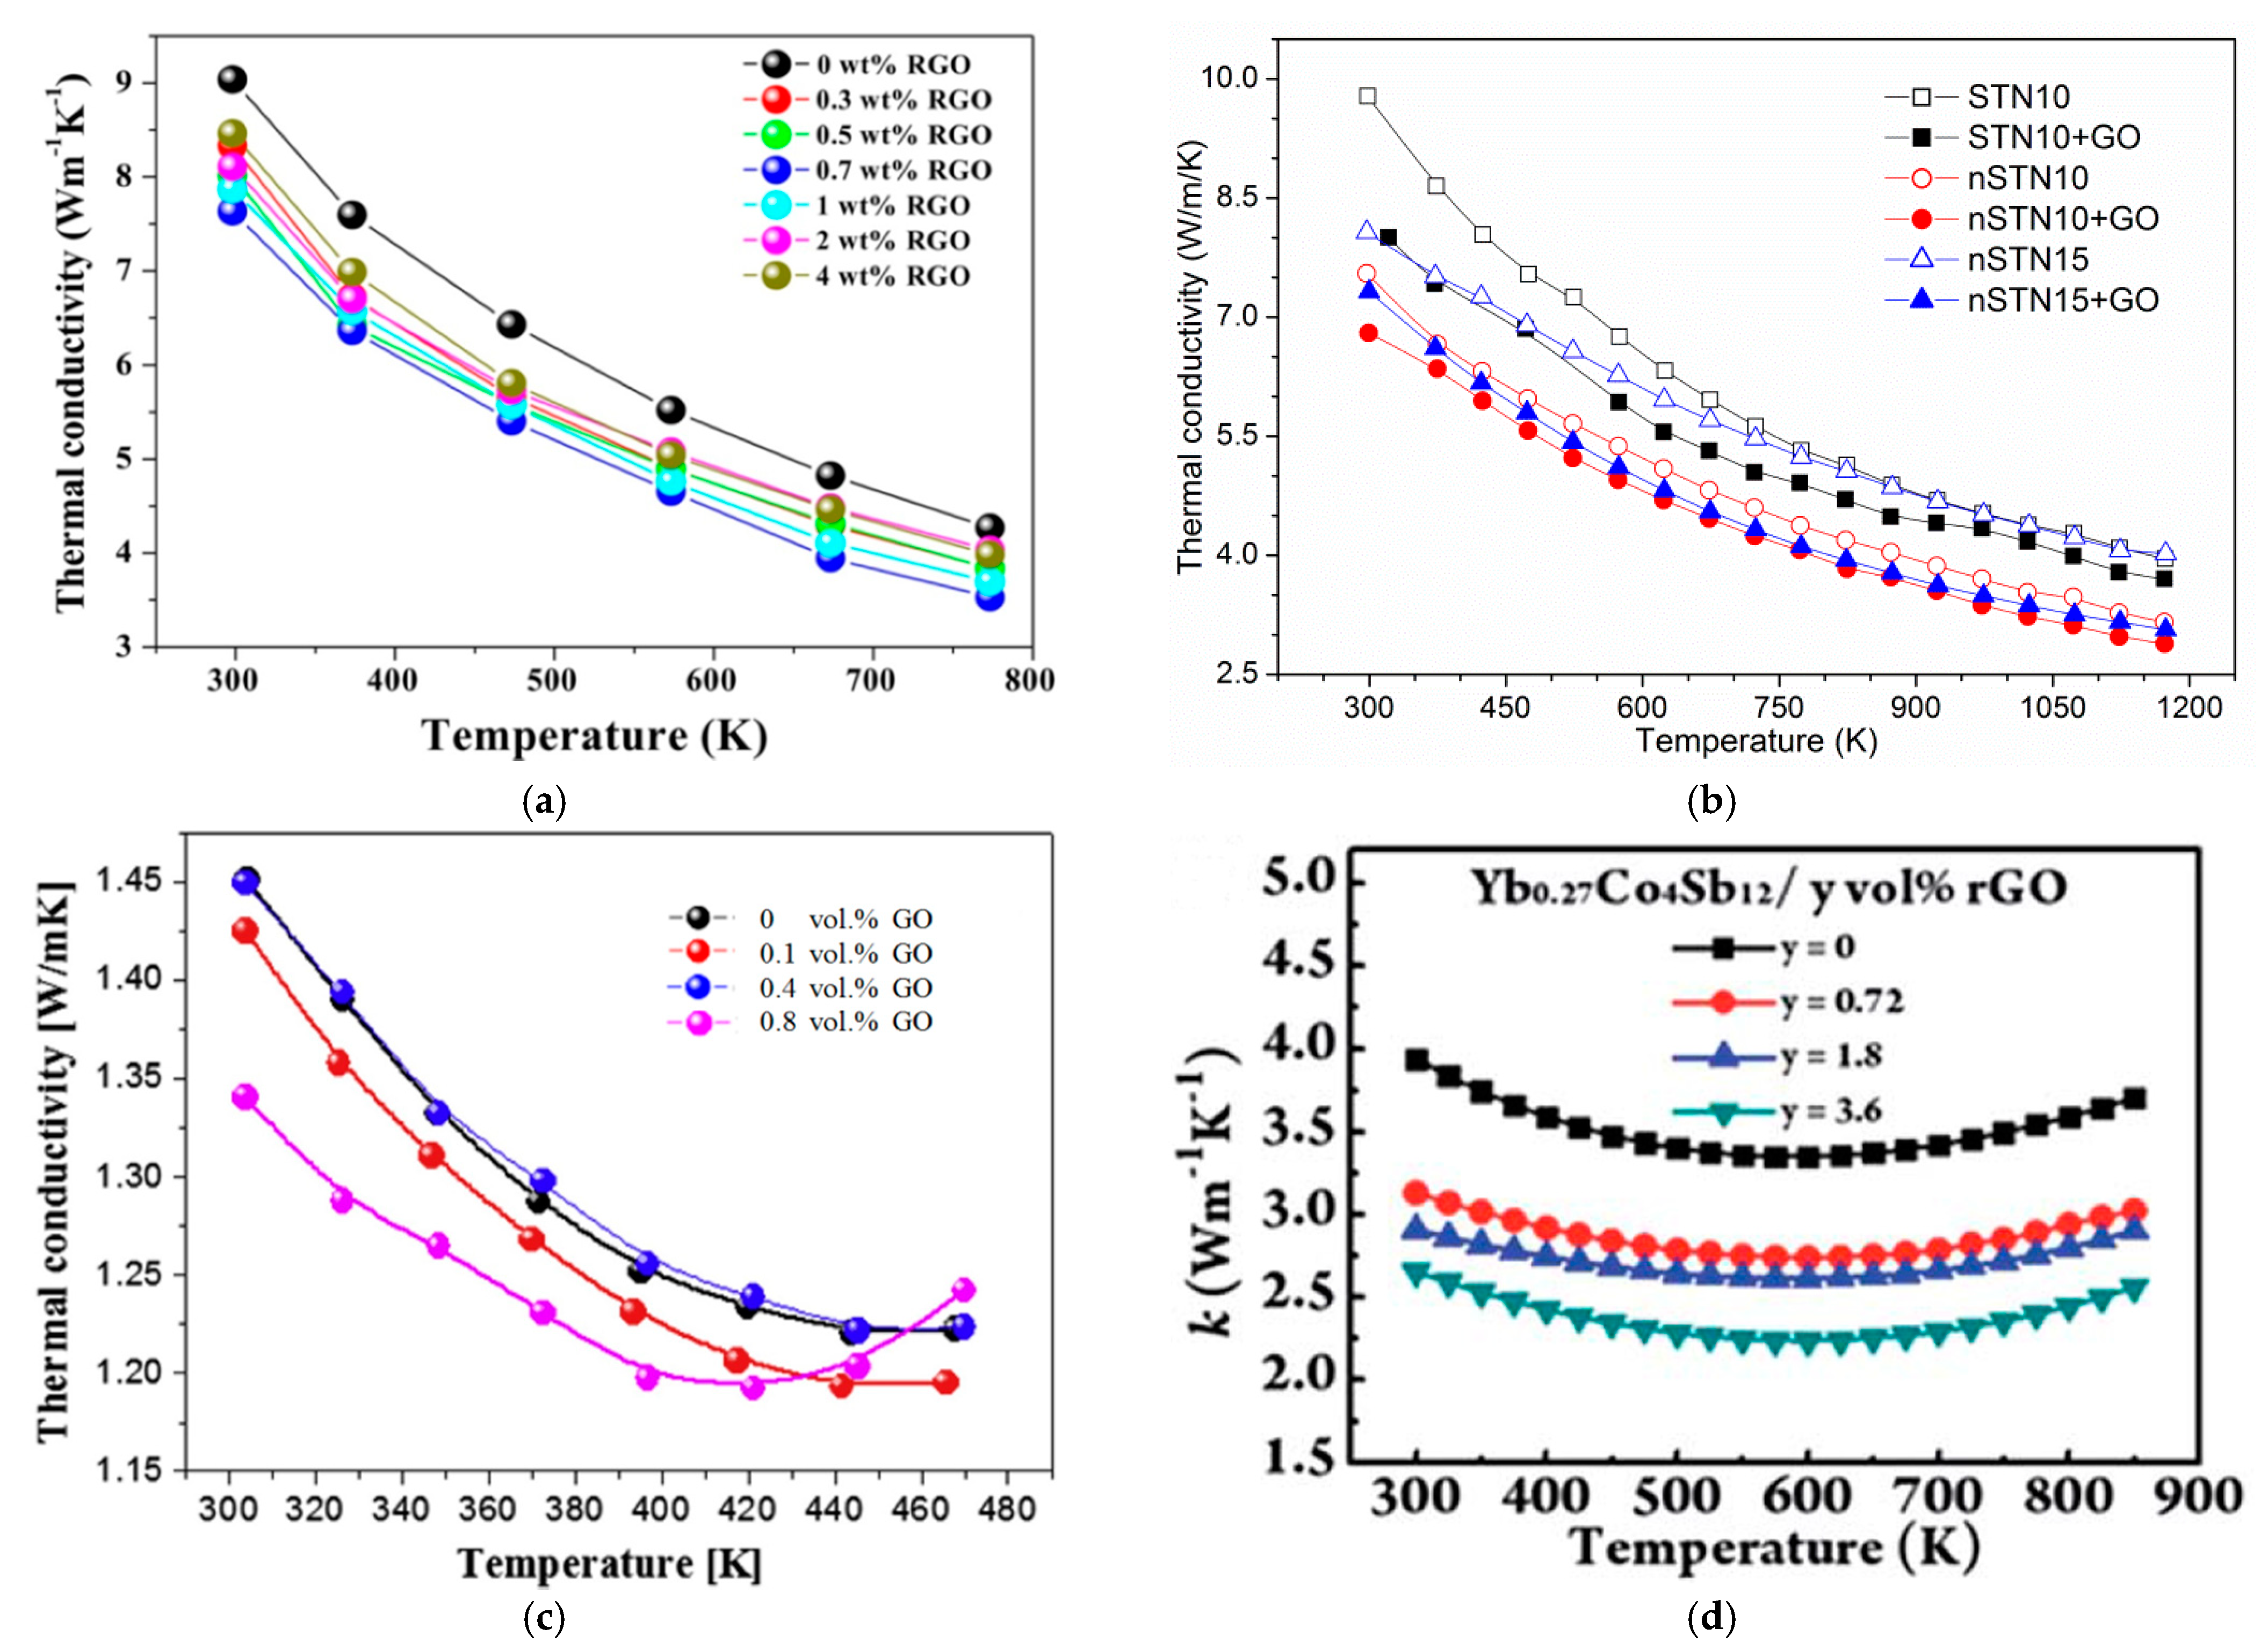
According to Figure 9, reported values of the thermal conductivity tend to decrease at least until a certain amount of G-rGO as for undoped SrTiO3 (see Figure 9a) [60] as for donor-doped SrTiO3 (see Figure 9b) [62], chalcogenide (see Figure 9c) [42] or skutterudite (see Figure 9d) [30] composites. Such a decrease can be related to the enhanced interface phonon scattering, which is due both to the secondary phase of G-rGO at the grain boundaries of TE materials and to the enlarged number of grain boundaries caused by grain growth inhibition by G-rGO addition. Thus, thermal conductivity shows rather common behavior with G-rGO addition for all three TE material systems overviewed here, in contrast to electrical conductivity and the Seebeck coefficient.
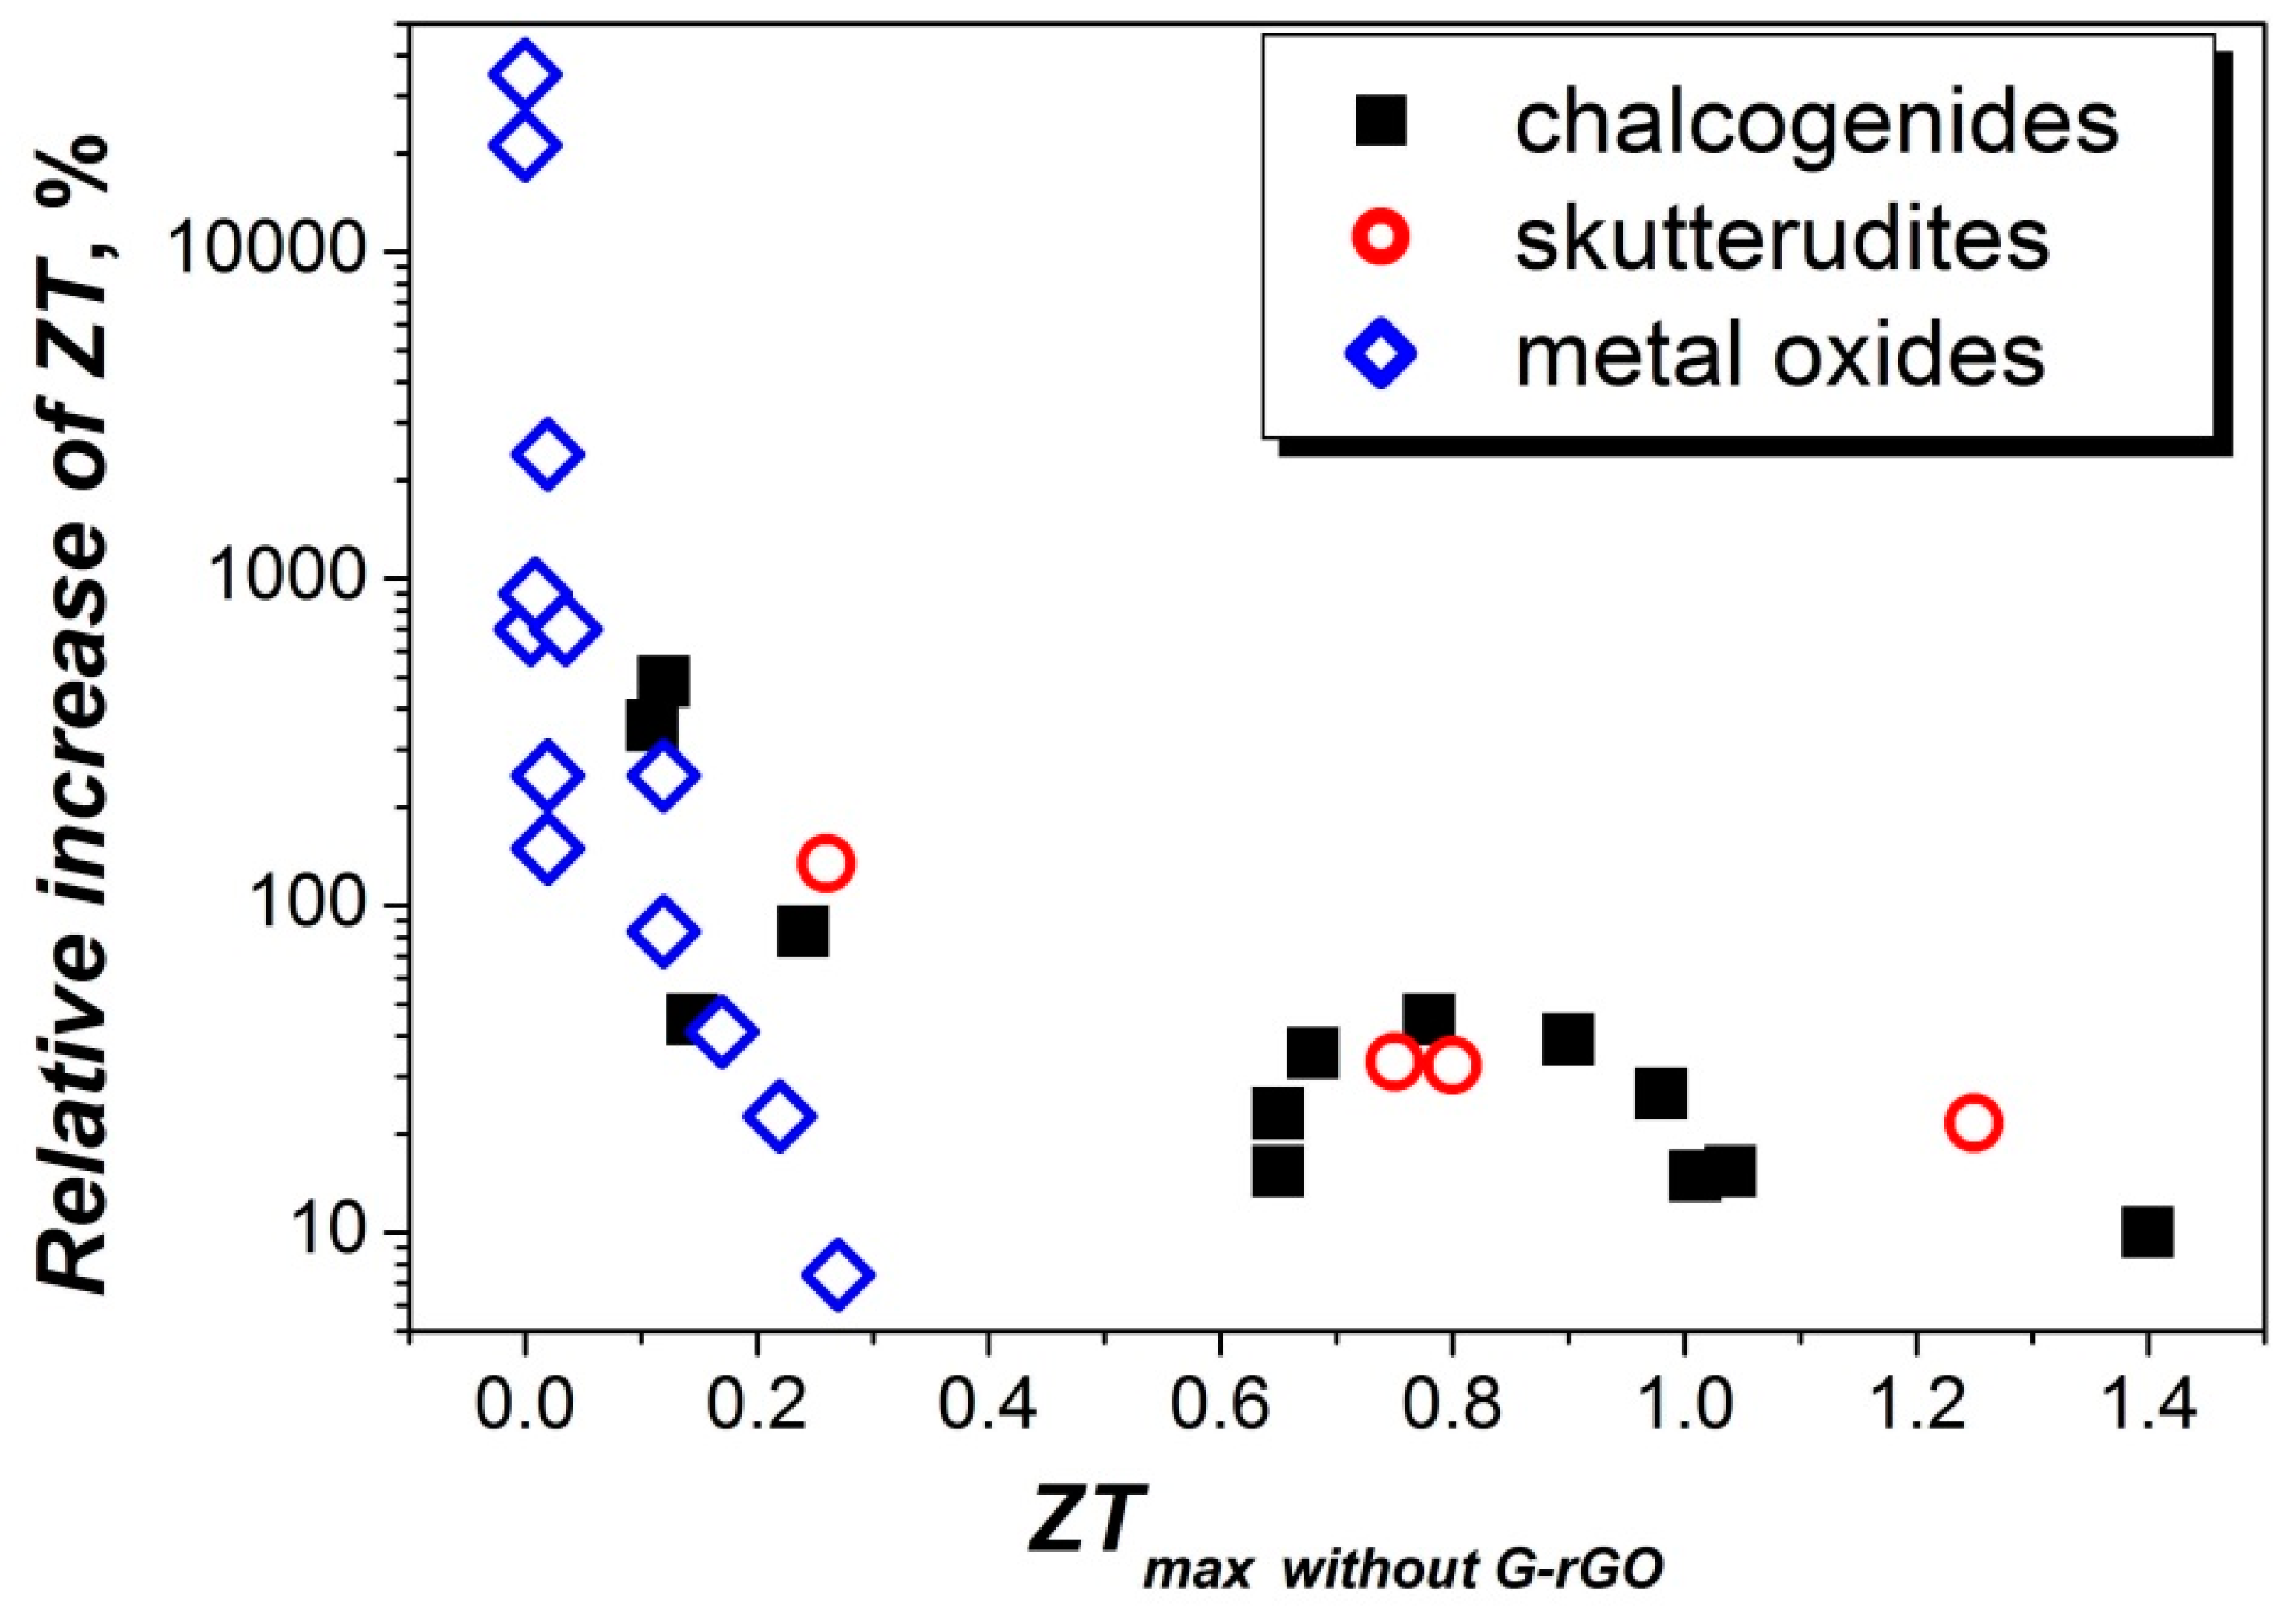
ZT was also found to be usually enhanced by G-rGO addition until a certain amount, as shown in Section 2. For further analysis, we have used the published data to calculate the relative increase of ZT as a ratio between the figure of merit difference for TE material without G-rGO (ZTmax without G-rGO), and its composite with G-rGO (ZTmax with G-rGO) in relation to ZTmax without G-rGO:
Calculated values of the increment of ZT for chalcogenide, metal oxide and skutterudite TE materials are presented in Table 4, Table 5 and Table 6 and summarized in Figure 10.
It is obviously seen in Figure 10 that the lowest relative increase of ZT is calculated for the composites with the highest initial ZT before the addition of G-rGO and vice versa. In the case that the materials have shown very low ZT before the addition of G-rGO, their composite with graphene or reduced graphene oxide can show a high increment of ZT. Moreover, such a tendency can be found in all chalcogenide, skutterudite or metal oxide TE materials (see Figure 10). Thus, the fabrication of TE composites using the addition of up to 5 wt.% or 1.4 vol.% G or rGO can be an alternative, but not incremental method, for the preparation of high-performance TE materials.
4. Conclusions
Analyzing the available data on chalcogenide-, skutterudite- and metal oxide-based composites with graphene or reduced graphene oxide, it is possible to conclude that the addition of rather low amount of G-rGO is able to increase their final ZT, mainly enhancing the phonon scattering at grain boundaries of all these materials and increasing the charge carrier concentration and mobility in some of them, particularly in oxide thermoelectrics. However, that is mainly valid in the case of TE materials with low initial ZT. When TE material is already nanostructured and possesses high electrical conductivity, such an addition does not enhance ZT significantly. Thus, G-rGO works mainly as an optimizer of the intrinsic performance of TE materials.
Author Contributions
Conceptualization, data curation, writing—original draft preparation, O.O.; writing—review and editing, A.T. All authors have read and agreed to the published version of the manuscript.
Funding
This article is funded by national funds, through FCT—Fundação para a Ciência e a Tecnologia, I.P., in the scope of the framework contract foreseen in the numbers 4–6 of the article 23 of the Decree-Law 57/2016, of 29 August, as well as UIDB/50011/2020, UIDP/50011/2020 and UID/EMS/00481/2019-FCT and by Centro 2020, through the European Regional Development Fund (ERDF), in the scope of the project CENTRO-01-0145-FEDER-022083.
Institutional Review Board Statement
Not applicable.
Data Availability Statement
No new data were created or analyzed in this study. Data sharing is not applicable to this article.
Conflicts of Interest
The authors declare no conflict of interest.
Glossary
| Com. | commercial |
| CS | chemical synthesis |
| CSM | conventional sintering method |
| EGt | expanded graphite |
| exf. | exfoliation |
| G | graphene |
| HFIHS | high frequency induction heated sintering |
| HM | Hummer’s method |
| HP | hot-pressing |
| HTS | hydrothermal synthesis |
| MW | microwave (synthesis) |
| NW | nanowire |
| PECVD | plasma-enhanced chemical vapor deposition |
| rGO | reduced graphene oxide |
| SEM | scanning electron microscopy |
| STS | solvothermal synthesis |
| SPS | spark plasma sintering |
| SSS | solid-state synthesis |
| TE | thermoelectric |
| TEG | thermoelectric generator |
| TEM | transmission electron microscopy |
| US | ultrasonication |
| WCSR | wet-chemical synthetic route |
References
- Zheng, X.F.; Liu, C.X.; Yan, Y.Y.; Wang, Q. A review of thermoelectrics research—Recent developments and potentials for sustainable and renewable energy applications. Renew. Sustain. Energy Rev. 2014, 32, 486–503. [Google Scholar] [CrossRef]
- Alghoul, M.A.; Shahahmadi, S.A.; Yeganeh, B.; Asim, N.; Elbreki, A.M.; Sopian, K.; Tiong, S.K.; Amin, N. A review of thermoelectric power generation systems: Roles of existing test rigs/ prototypes and their associated cooling units on output performance. Energy Convers. Manag. 2018, 174, 138–156. [Google Scholar] [CrossRef]
- Ding, L.C.; Tan, A. A review of power generation with thermoelectric system and its alternative with solar ponds. Renew. Sustain. Energy Rev. 2018, 81, 799–812. [Google Scholar] [CrossRef]
- Khan, M.Q.; Malarmannan, S.; Manikandaraja, G. Power generation from waste heat of vehicle exhaust using thermos electric generator: A review. Mater. Sci. Eng. 2018, 402, 012174. [Google Scholar] [CrossRef]
- Snyder, G.J. Small thermoelectric generators. Electrochem. Soc. Interface 2008, 17, 54–56. [Google Scholar] [CrossRef]
- Bensaid, S.; Brignone, M.; Ziggiotti, A.; Specchia, S. High efficiency thermo-electric power generator. Int. J. Hydrog. Energy 2012, 37, 1385–1398. [Google Scholar] [CrossRef]
- Zoui, M.A.; Bentouba, S.; Stocholm, J.G.; Bourouis, M. A review on thermoelectric generators: Progress and applications. Energies 2020, 13, 3606. [Google Scholar] [CrossRef]
- Seebeck, T.J. Magnetische Polarisation der Metalle und Erze durch Temperatur-Differenz (Magnetic Polarization of Metals and Minerals by Temperature Differences); Abhandlungen der Königlichen Akademie der Wissenschaften zu Berlin (Treatises of the Royal Academy of Sciences in Berlin): Berlin, Germany, 1825; pp. 265–373. [Google Scholar]
- Seebeck, T.J. Ueber die Magnetische Polarisation der Metalle und Erze durch Temperatur-Differenz (On the magnetic polarization of metals and minerals by temperature differences). Ann. Phys. Chem. 1826, 6, 1–20. [Google Scholar] [CrossRef] [Green Version]
- Snyder, G.J. Thermoelectric power generation: Efficiency and compatibility. In Thermoelectrics Handbook: Macro to Nano; Rowe, D.M., Ed.; CRC Press, Taylor & Francis Group: Boca Raton, FL, USA, 2006. [Google Scholar]
- Lv, S.; Qian, Z.; Hu, D.; Li, X.; He, W. A comprehensive review of strategies and approaches for enhancing the performance of thermoelectric module. Energies 2020, 13, 3142. [Google Scholar] [CrossRef]
- Ioffe, A.F. Physics of Semiconductors; Academic Press: New York, NY, USA, 1960. [Google Scholar]
- Zaitsev, V.K.; Fedorov, M.I. Thermal conductivity of semiconductors with complex crystal structure. In Thermoelectrics Handbook: Macro to Nano; Rowe, D.M., Ed.; CRC Press, Taylor & Francis Group: Boca Raton, FL, USA, 2006. [Google Scholar]
- Kim, H.S.; Gibbs, Z.M.; Tang, Y.; Wang, H.; Snyder, J. Characterization of Lorenz number with Seebeck coefficient measurement. APL Mater. 2015, 3, 41506. [Google Scholar] [CrossRef] [Green Version]
- Snyder, G.J.; Toberer, E.S. Complex thermoelectric materials. Nat. Mater. 2008, 7, 105–114. [Google Scholar] [CrossRef] [PubMed]
- Freer, R.; Powel, A.V. Realising the potential of thermoelectric technology: A Roadmap. J. Mater. Chem. C 2020, 8, 441–463. [Google Scholar] [CrossRef]
- Chang, C.; Wu, M.; He, D.; Pei, Y.; Wu, C.-F.; Wu, X.; Yu, H.; Zhu, F.; Wang, K.; Chen, Y.; et al. 3D charge and 2D phonon transports leading to high out-of-plane ZT in n-type SnSe crystals. Science 2018, 360, 778–783. [Google Scholar] [CrossRef] [Green Version]
- Zhao, L.-D.; Lo, S.-H.; Zhang, Y.; Sun, H.; Tan, G.; Uher, C.; Wolverton, C.; Pravid, V.P.; Kanatzidis, M.G. Ultralow thermal conductivity and high thermoelectric figure of merit in SnSe crystals. Nature 2014, 508, 373–377. [Google Scholar] [CrossRef] [PubMed]
- Biswas, K.; He, J.; Blum, I.D.; Wu, C.-I.; Hogan, T.P.; Seidman, D.N.; Dravid, V.P.; Kanatzidis, M.G. High-performance bulk thermoelectrics with all-scale hierarchical architectures. Nature 2012, 489, 414–418. [Google Scholar] [CrossRef]
- Kim, S.I.; Lee, K.H.; Mun, H.A.; Kim, H.S.; Hwang, S.W.; Roh, J.W.; Yang, D.J.; Shin, W.H.; Li, X.S.; Lee, Y.H.; et al. Dense dislocation arrays embedded in grain boundaries for high-performance bulk thermoelectrics. Science 2015, 348, 109–114. [Google Scholar] [CrossRef] [Green Version]
- Yu, Y.; Cagnoni, M.; Cojocaru-Mirédin, O.; Wuttig, M. Chalcogenide thermoelectrics empowered by an unconventional bonding mechanism. Adv. Funct. Mater. 2020, 30, 1904862. [Google Scholar] [CrossRef] [Green Version]
- Rogl, G.; Rogl, P. Skutterudites, a most promising group of thermoelectric materials. Curr. Opin. Green Sustain. Chem. 2017, 4, 50–57. [Google Scholar] [CrossRef]
- Beretta, D.; Neophytou, N.; Hodges, J.M.; Kanatzidis, M.G.; Narducci, D.; Martin-Gonzalez, M.; Beekman, M.; Balke, B.; Cerretti, G.; Tremel, W.; et al. Thermoelectrics: From history, a window to the future. Mater. Sci. Eng. R. Rep 2019, 138, 100501. [Google Scholar] [CrossRef]
- Wang, H.H.; Chen, F.; Dai, S.Y.; Zhao, T.; Lu, H.B.; Cui, D.F.; Zhou, Y.I.; Chen, Z.H.; Yang, G.Z. Sb-doped SrTiO3 transparent semiconductor thin films. Appl. Phys. Lett. 2001, 78, 1676. [Google Scholar] [CrossRef]
- Zhang, B.; Wang, J.; Zou, T.; Zhang, S.; Yaer, X.; Ding, N.; Liu, C.; Miao, L.; Lia, Y.; Wu, Y. High thermoelectric performance of Nb-doped SrTiO3 bulk materials with different doping levels. J. Mater. Chem. C 2015, 3, 11406–11411. [Google Scholar] [CrossRef]
- Muta, H.; Kurosaki, K.; Yamanaka, S. Thermoelectric properties of rare earth doped SrTiO3. J. Alloys Compd. 2003, 350, 292–295. [Google Scholar] [CrossRef]
- Zomer, P.J.; Dash, S.P.; Tombros, N.; Van Wees, B.J. A transfer technique for high mobility graphene devices on commercially available hexagonal boron nitride. Appl. Phys. Lett. 2011, 99, 232104. [Google Scholar] [CrossRef] [Green Version]
- Zong, P.; Liang, J.; Wan, C.; Wang, Y.; Koumoto, K. Graphene-based thermoelectrics. ACS Appl. Energy Mater. 2020, 3, 2224–2239. [Google Scholar] [CrossRef]
- Poon, S.J.; Petersen, A.S.; Wu, D. Thermal conductivity of core-shell nanocomposites for enhancing thermoelectric performance. Appl. Phys. Lett. 2013, 102, 173110. [Google Scholar] [CrossRef] [Green Version]
- Zong, P.; Chen, X.; Zhu, Y.; Liu, Z.; Zeng, Y.; Chen, L. Construction of a 3D-rGO network-wrapping architecture in a YbyCo4Sb12/rGO composite for enhancing the thermoelectric performance. J. Mater. Chem. A 2015, 3, 8643. [Google Scholar] [CrossRef]
- Feng, X.; Fan, Y.; Nomura, N.; Kikuchi, K.; Wang, L.; Jiang, W.; Kawasaki, A. Graphene promoted oxygen vacancies in perovskite for enhanced thermoelectric properties. Carbon 2017, 112, 169–176. [Google Scholar] [CrossRef]
- Gainza, J.; Serrano-Sánchez, F.; Gharsallah, M.; Funes, M.; Carrascoso, F.; Nemes, N.M.; Dura, O.J.; Martínez, J.L.; Alonso, J.A. Nanostructured thermoelectric chalcogenides. In Bringing Thermoelectricity into Reality; Aranguren, P., Ed.; IntechOpen: Rijeka, Croatia, 2017; p. 624. [Google Scholar] [CrossRef] [Green Version]
- Liang, B.; Song, Z.; Wang, M.; Wang, L.; Jiang, W. Fabrication and thermoelectric properties of graphene/Bi2Te3 composite materials. J. Nanomater. 2013, 210767. [Google Scholar] [CrossRef] [Green Version]
- Dong, J.; Liu, W.; Li, H.; Su, X.; Tang, X.; Uher, C. In-situ synthesis and thermoelectric properties of PbTe/graphene nanocomposites by utilizing a facile and novel wet chemical method. J. Mater. Chem. A 2013, 1, 12503. [Google Scholar] [CrossRef]
- Chen, H.; Yang, C.; Liu, H.; Zhang, G.; Wan, D.; Huang, G. Thermoelectric properties of CuInTe2/graphene composites. CrystEngComm 2013, 15, 6648–6651. [Google Scholar] [CrossRef]
- Zhao, D.; Wang, X.; Wu, D. Enhanced thermoelectric properties of graphene/Cu2SnSe3 composites. Crystals 2017, 7, 71. [Google Scholar] [CrossRef] [Green Version]
- Sharma, S.D.; Bayikadi, K.; Raman, S.; Neeleshwar, S. Synergistic optimization of thermoelectric performance in earth-abundant Cu2ZnSnS4 by inclusion of graphene nanosheets. Nanotechnology 2020, 31, 365402. [Google Scholar] [CrossRef]
- Agarwal, K.; Kaushik, V.; Varandani, D.; Dhar, A.; Mehta, B.R. Nanoscale thermoelectric properties of Bi2Te3/graphene nanocomposites: Conducting atomic force, scanning thermal and kelvin probe microscopy studies. J. Alloys Compd. 2016, 681, 394–401. [Google Scholar] [CrossRef]
- Suh, D.; Lee, S.; Mun, H.; Park, S.-H.; Lee, K.H.; Kim, S.W.; Choi, J.-Y.; Baik, S. Enhanced thermoelectric performance of Bi0.5Sb1.5Te3-expanded graphene composites by simultaneous modulation of electronic and thermal carrier transport. Nano Energy 2015, 13, 67–76. [Google Scholar] [CrossRef]
- Xie, D.; Xu, J.; Liu, G.; Liu, Z.; Shao, H.; Tan, X.; Jiang, J.; Jiang, H. Synergistic optimization of thermoelectric performance in p-type Bi0.48Sb1.52Te3/graphene composite. Energies 2016, 9, 236. [Google Scholar] [CrossRef] [Green Version]
- Li, C.; Qin, X.; Li, Y.; Li, D.; Zhang, J.; Guo, H.; Xin, H.; Song, C. Simultaneous increase in conductivity and phonon scattering in a graphene nanosheets/(Bi2Te3)0.2(Sb2Te3)0.8 thermoelectric nanocomposite. J. Alloys Compd. 2016, 661, 389–395. [Google Scholar] [CrossRef]
- Shin, W.H.; Ahn, H.; Jeong, M.; Yoon, J.S.; Song, J.M.; Lee, S.; Seo, W.S.; Lim, Y.S. Enhanced thermoelectric performance of reduced graphene oxide incorporated bismuth-antimony-telluride by lattice thermal conductivity reduction. J. Alloys Compd. 2017, 718, 342–348. [Google Scholar] [CrossRef]
- Hwang, U.G.; Kim, K.; Kim, W.; Shin, W.H.; Seo, W.-S.; Lim, Y.S. Thermoelectric transport properties of interface-controlled p-type bismuth antimony telluride composites by reduced graphene oxide. Electron Mater. Lett. 2019, 15, 605–612. [Google Scholar] [CrossRef]
- Ahmad, K.; Wan, C.; Zong, P. Thermoelectric properties of BiSbTe/graphene nanocomposites. J. Mater. Sci. 2019, 30, 11923–11930. [Google Scholar] [CrossRef]
- Kim, J.I.; Lee, E.S.; Kim, J.Y.; Choi, S.M.; Lee, K.H.; Seo, W.-S. Thermoelectric properties of unoxidized graphene/Bi2Te2.7Se0.3 composites synthesized by exfoliation/re-assembly method. Phys. Stat. Sol. (RRL) 2014, 8, 357–361. [Google Scholar] [CrossRef]
- Ju, H.; Kim, J. Preparation and structure dependent thermoelectric properties of nanostructured bulk bismuth telluride with graphene. J. Alloys Compd. 2016, 664, 639–647. [Google Scholar] [CrossRef]
- Hu, C.; Zeng, X.; Liu, Y.; Zhou, M.; Zhao, H.; Tritt, T.M.; He, J.; Jakowski, J.; Kent, P.R.C.; Huang, J.; et al. Effects of partial La filling and Sb vacancy defects on CoSb3 skutterudites. Phys. Rev. B 2017, 95, 165204. [Google Scholar] [CrossRef] [Green Version]
- Uher, C. Skutterudites: Prospective novel thermoelectrics. Semicond. Semimet. 2001, 69, 139–253. [Google Scholar] [CrossRef]
- Rull-Bravo, M.; Moure, A.; Fernández, J.F.; Martín-González, M. Skutterudites as thermoelectric materials: Revisited. RSC Adv. 2015, 5, 41653. [Google Scholar] [CrossRef]
- Feng, B.; Xie, J.; Cao, G.; Zhu, T.; Zhao, X. Enhanced thermoelectric properties of p-type CoSb3/graphene nanocomposite. J. Mater. Chem. A 2013, 1, 13111. [Google Scholar] [CrossRef]
- Zong, P.; Hanus, R.; Dylla, M.; Tang, Y.; Liao, J.; Zhang, Q.; Snyder, G.J.; Chen, L. Skutterudite with graphene-modified grain-boundary complexion enhances ZT enabling high-efficiency thermoelectric device. Energy Environ. Sci. 2016, 10, 183–190. [Google Scholar] [CrossRef]
- Qin, D.; Liu, Y.; Meng, X.; Cui, B.; Qi, Y.; Cai, W.; Sui, J. Graphene-enhanced thermoelectric properties of p-type skutterudites. Chin. Phys. B 2018, 27, 048402. [Google Scholar] [CrossRef]
- Yadav, S.; Chaudhary, S.; Pandya, D.K. Effect of 2D MoS2 and Graphene interfaces with CoSb3 nanoparticles in enhancing thermoelectric properties of 2D MoS2-CoSb3 and Graphene-CoSb3 nanocomposites. Ceram. Int. 2018, 44, 10628–10634. [Google Scholar] [CrossRef]
- Dahal, T.; Kim, H.S.; Gahlawat, S.; Dahal, K.; Jie, Q.; Liu, W.; Lan, Y.; White, K.; Ren, Z. Transport and mechanical properties of the double-filled p-type skutterudites La0.68Ce0.22Fe4−xCoxSb12. Acta Mater. 2016, 117, 13–22. [Google Scholar] [CrossRef] [Green Version]
- Dahal, T.; Jie, Q.; Liu, W.; Dahal, K.; Guo, C.; Lan, Y.; Ren, Z. Effect of triple fillers in thermoelectric performance of p-type skutterudites. J. Alloys Compd. 2015, 623, 104–108. [Google Scholar] [CrossRef] [Green Version]
- Rogl, G.; Grytsiv, A.; Yubuta, K.; Puchegger, S.; Bauer, E.; Raju, C.; Mallik, R.C.; Rogl, P. In-doped multifilled n-type skutterudites with ZT = 1.8. Acta Mater. 2015, 95, 201–211. [Google Scholar] [CrossRef]
- Wang, H.; Su, W.; Liu, J.; Wang, C. Recent development of n-type perovskite thermoelectrics. J. Mater. 2013, 2, 225–236. [Google Scholar] [CrossRef] [Green Version]
- Feng, Y.; Jiang, X.; Ghafari, E.; Kucukgok, B.; Zhang, C.; Ferguson, I.; Lu, N. Metal oxides for thermoelectric power generation and beyond. Adv. Compos. Hybrid. Mater. 2018, 1, 114–126. [Google Scholar] [CrossRef]
- Tkach, A.; Resende, J.; Diaz Chao, P.; Guilmeau, E.; Costa, M.E.; Vilarinho, P.M. Enhancement of thermoelectric performance in SrTiO3-based ceramics by processing conditions. In Strontium Titanate: Synthesis, Properties and Uses; Tkach, A., Vilarinho, P.M., Eds.; Nova Science Publishers: New York, NY, USA, 2019; p. 297. [Google Scholar]
- Rahman, J.U.; Du, N.V.; Nam, W.H.; Shin, W.H.; Lee, K.H.; Seo, W.-S.; Kim, M.H.; Lee, S. Grain boundary interfaces controlled by reduced graphene oxide in nonstoichiometric SrTiO3-δ thermoelectrics. Sci. Rep. 2019, 9, 8624. [Google Scholar] [CrossRef] [Green Version]
- Lin, Y.; Norman, C.; Srivastava, D.; Azough, F.; Wang, L.; Robbins, M.; Simpson, K.; Freer, R.; Kinloch, I.A. Thermoelectric power generation from lanthanum strontium titanium oxide at room temperature through the addition of graphene. ACS Appl. Mater. Interf 2015, 7, 15898–15908. [Google Scholar] [CrossRef]
- Okhay, O.; Zlotnik, S.; Xie, W.; Orlinski, K.; Hortiguela Gallo, M.J.; Otero-Irurueta, G.; Fernandes, A.J.S.; Pawlak, D.A.; Weidenkaff, A.; Tkach, A. Thermoelectric performance of Nb-doped SrTiO3 enhanced by reduced graphene oxide and Sr deficiency cooperation. Carbon 2019, 143, 215–222. [Google Scholar] [CrossRef]
- Wu, C.; Li, J.; Fan, Y.; Xing, J.; Gu, H.; Zhou, Z.; Lu, X.; Zhang, Q.; Wang, L.; Jiang, W. The effect of reduced graphene oxide on microstructure and thermoelectric properties of Nb-doped A-site-deficient SrTiO3 ceramics. J. Alloys Compd. 2019, 786, 884–893. [Google Scholar] [CrossRef]
- Dey, P.; Jana, S.S.; Anjum, F.; Bhattacharya, T.; Maiti, T. Effect of semiconductor to metal transition on thermoelectric performance in oxide nanocomposites of SrTi0.85Nb0.15O3 with graphene oxide. Appl. Mater. Today 2020, 21, 100869. [Google Scholar] [CrossRef]
- Srivastava, D.; Norman, C.; Azough, F.; Ekren, D.; Chen, K.; Reece, M.J.; Kinloch, I.A.; Freer, R. Anisotropy and enhancement of thermoelectric performance of Sr0.8La0.067Ti0.8Nb0.2O3-δ ceramics by graphene additions. J. Mater. Chem A 2019, 7, 24602. [Google Scholar] [CrossRef] [Green Version]
- Liang, X.; Yang, Y.; Dai, F.; Wang, C. Orientation dependent physical transport behavior and the micro-mechanical response of ZnO nanocomposites induced by SWCNTs and graphene: Importance of intrinsic anisotropy and interfaces. J. Mater. Chem. C 2019, 7, 1208–1221. [Google Scholar] [CrossRef]
- Chen, D.; Zhao, Y.; Chen, Y.; Wang, B.; Chen, H.; Zhou, J.; Liang, Z. One-step chemical synthesis of ZnO/graphene oxide molecular hybrids for high-temperature thermoelectric applications. ACS Appl. Mater. Interf. 2015, 7, 3224–3230. [Google Scholar] [CrossRef] [PubMed]
- Nam, W.H.; Lim, Y.S.; Kim, W.; Seo, H.K.; Dae, K.S.; Lee, S.; Seo, W.S.; Lee, J.Y. A gigantically increased ratio of electrical to thermal conductivity and synergistically enhanced thermoelectric properties in interface-controlled TiO2–RGO nanocomposites. Nanoscale 2017, 9, 7830. [Google Scholar] [CrossRef] [PubMed]
- Mallada, C.; Menéndeza, J.L.; Dura, O.J.; López de la Torre, M.A.; Menéndez, R.; Santamaría, R. Spark plasma sintered BaTiO3/graphene composites for thermoelectric applications. J. Eur. Ceram. Soc. 2017, 37, 3741–3746. [Google Scholar] [CrossRef]
- Kovalevsky, A.V.; Yaremchenko, A.A.; Populoh, S.; Weidenkaff, A.; Frade, J.R. Effect of A-site cation deficiency on the thermoelectric performance of donor-substituted strontium titanate. J. Phys. Chem. C 2014, 118, 4596–4606. [Google Scholar] [CrossRef]
Figure 1.
SEM images of bulk Bi2Te3 with 0 (a) and 2 vol.% (b) graphene addition [33].
Figure 1.
SEM images of bulk Bi2Te3 with 0 (a) and 2 vol.% (b) graphene addition [33].

Figure 2.
Figure of merit ZT of p- and n-type chalcogenide TE materials adapted from the references presented in Table 1.
Figure 2.
Figure of merit ZT of p- and n-type chalcogenide TE materials adapted from the references presented in Table 1.

Figure 3.
(a) Schematic illustration of the formation mechanism and SEM image of (b) CoSb3/G bulk sample after hot pressing (reprinted from [50] with permission from Royal Society of Chemistry). Morphology and structure of the YbyCo4Sb12/rGO composite: (c) SEM image of the fractured surface of the sintered skutterudite/rGO surface showing rGO embedded on boundaries, and (d) high magnification TEM image showing the rGO nanolayer of ~3–5 nm thickness for the 0.72 vol.% rGO sample (reprinted from [30] with permission from Royal Society of Chemistry).

Figure 4.
The figure of merit ZT of p- and n-type skutterudite TE materials adapted from the references presented in Table 2.
Figure 4.
The figure of merit ZT of p- and n-type skutterudite TE materials adapted from the references presented in Table 2.

Figure 5.
Figure of merit ZT of n-type metal oxide TE materials adapted from the References presented in Table 3.
Figure 5.
Figure of merit ZT of n-type metal oxide TE materials adapted from the References presented in Table 3.

Figure 6.
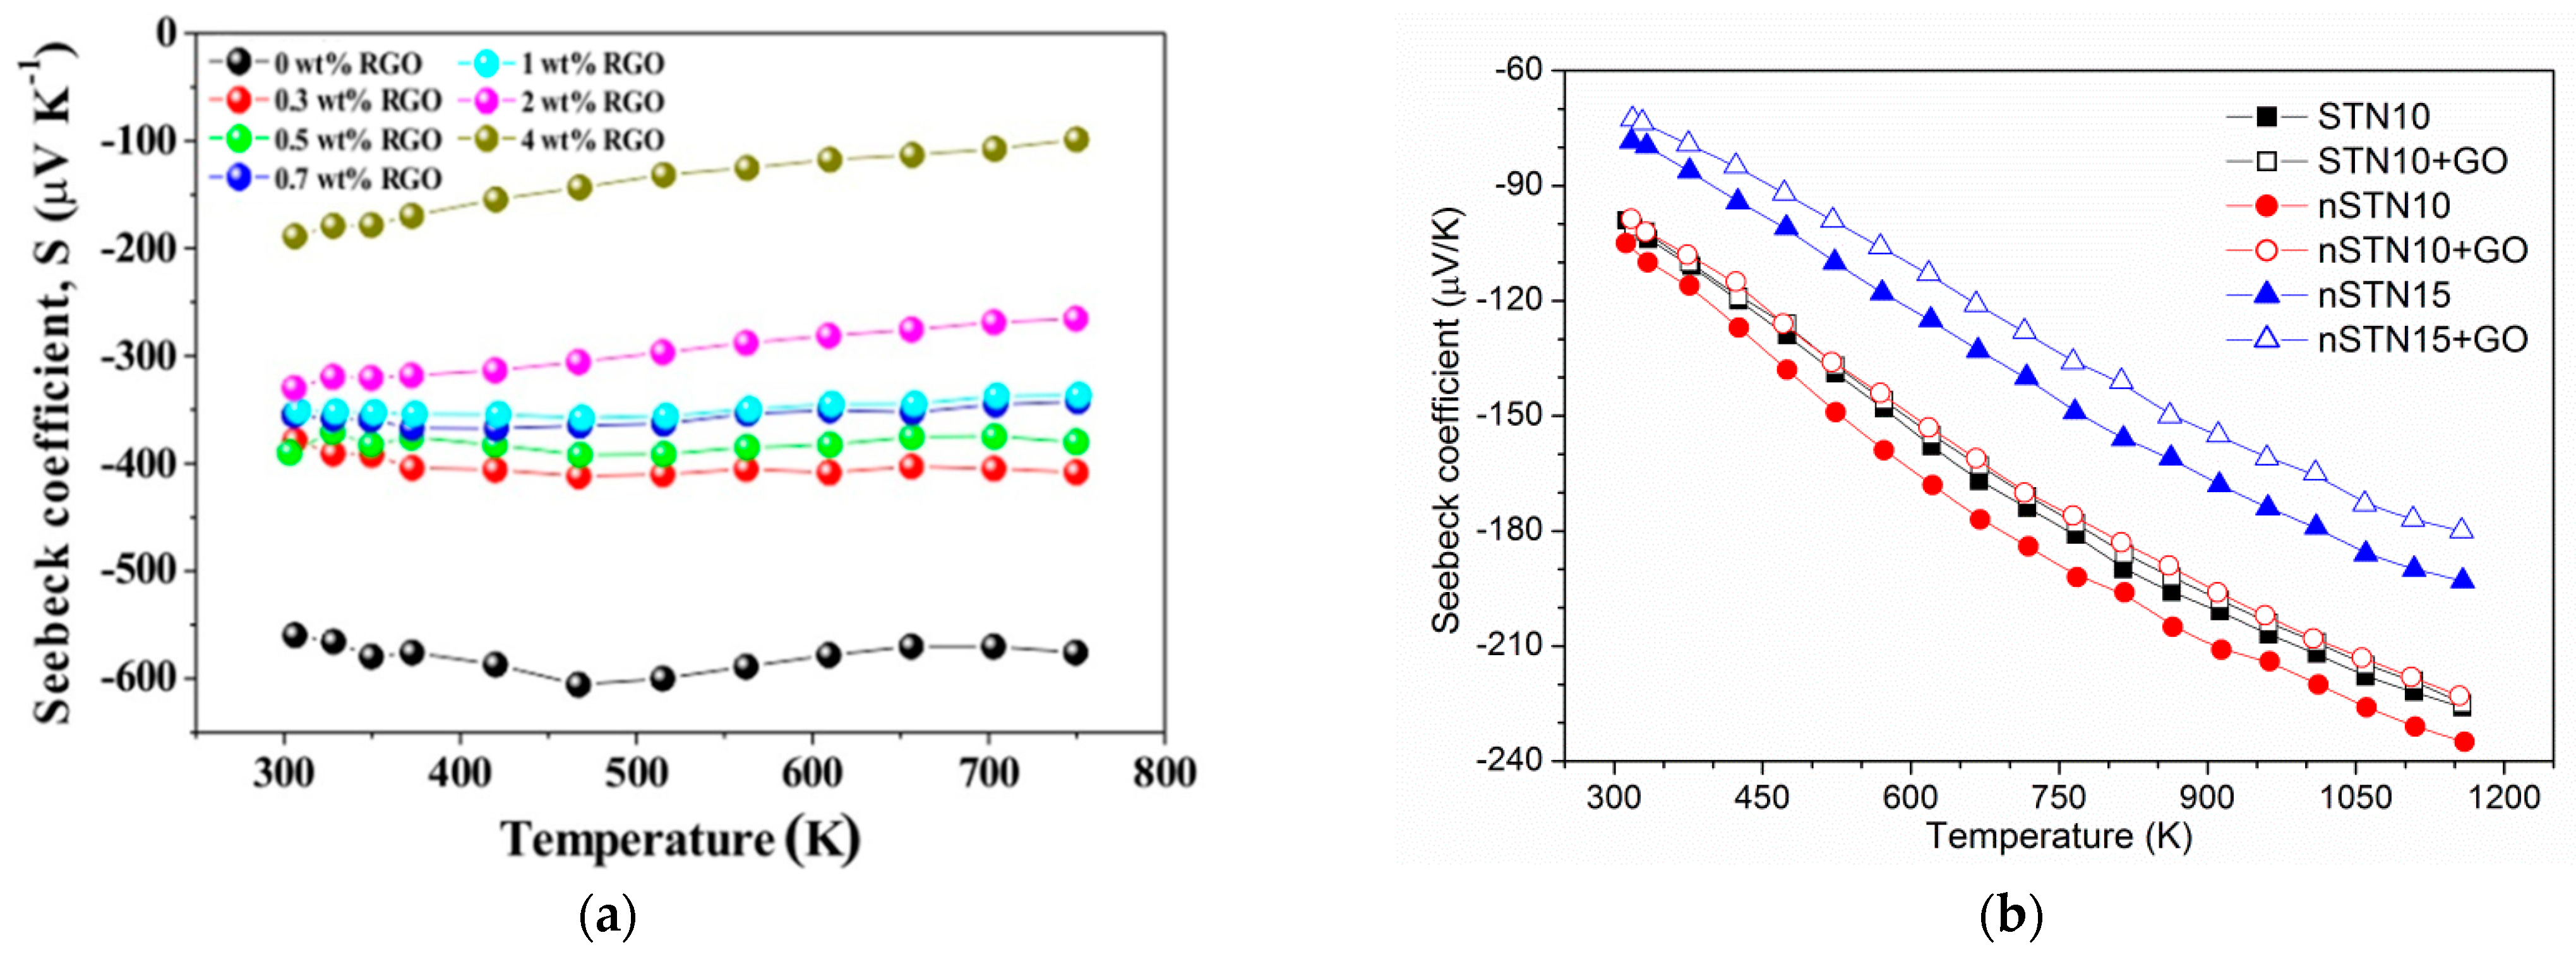
Seebeck coefficient S of (a) undoped SrTiO3 with 0, 0.3, 0.5, 0.7, 1, 2 and 4 wt.% rGO (from bottom to top) [60]; (b) SrTiO3 doped by Nb as SrTi0.90Nb0.10O3 (STN10), nonstoichiometric Sr0.98Ti0.90Nb0.10O3 (nSTN10) and Sr0.98Ti0.85Nb0.15O3 (nSTN15) and their composites with 0.6 wt.% GO, indicated, respectively, as STN10 + rGO, nSTN10 + rGO and nSTN15 + rGO (reprinted from [62] with permission from Elsevier); (c) Bi0.36Sb1.64Te3 with 0, 0.1, 0.4, 0.8 vol.% GO (black, red, blue, and magenta dots and lines, respectively) (reprinted from [42] with permission from Elsevier); and (d) Yb0.27Co4Sb12 with addition 0, 0.72, 1.8, and 3.6 vol.% rGO (reprinted from [30] with permission from Royal Society of Chemistry).
Figure 6.
Seebeck coefficient S of (a) undoped SrTiO3 with 0, 0.3, 0.5, 0.7, 1, 2 and 4 wt.% rGO (from bottom to top) [60]; (b) SrTiO3 doped by Nb as SrTi0.90Nb0.10O3 (STN10), nonstoichiometric Sr0.98Ti0.90Nb0.10O3 (nSTN10) and Sr0.98Ti0.85Nb0.15O3 (nSTN15) and their composites with 0.6 wt.% GO, indicated, respectively, as STN10 + rGO, nSTN10 + rGO and nSTN15 + rGO (reprinted from [62] with permission from Elsevier); (c) Bi0.36Sb1.64Te3 with 0, 0.1, 0.4, 0.8 vol.% GO (black, red, blue, and magenta dots and lines, respectively) (reprinted from [42] with permission from Elsevier); and (d) Yb0.27Co4Sb12 with addition 0, 0.72, 1.8, and 3.6 vol.% rGO (reprinted from [30] with permission from Royal Society of Chemistry).


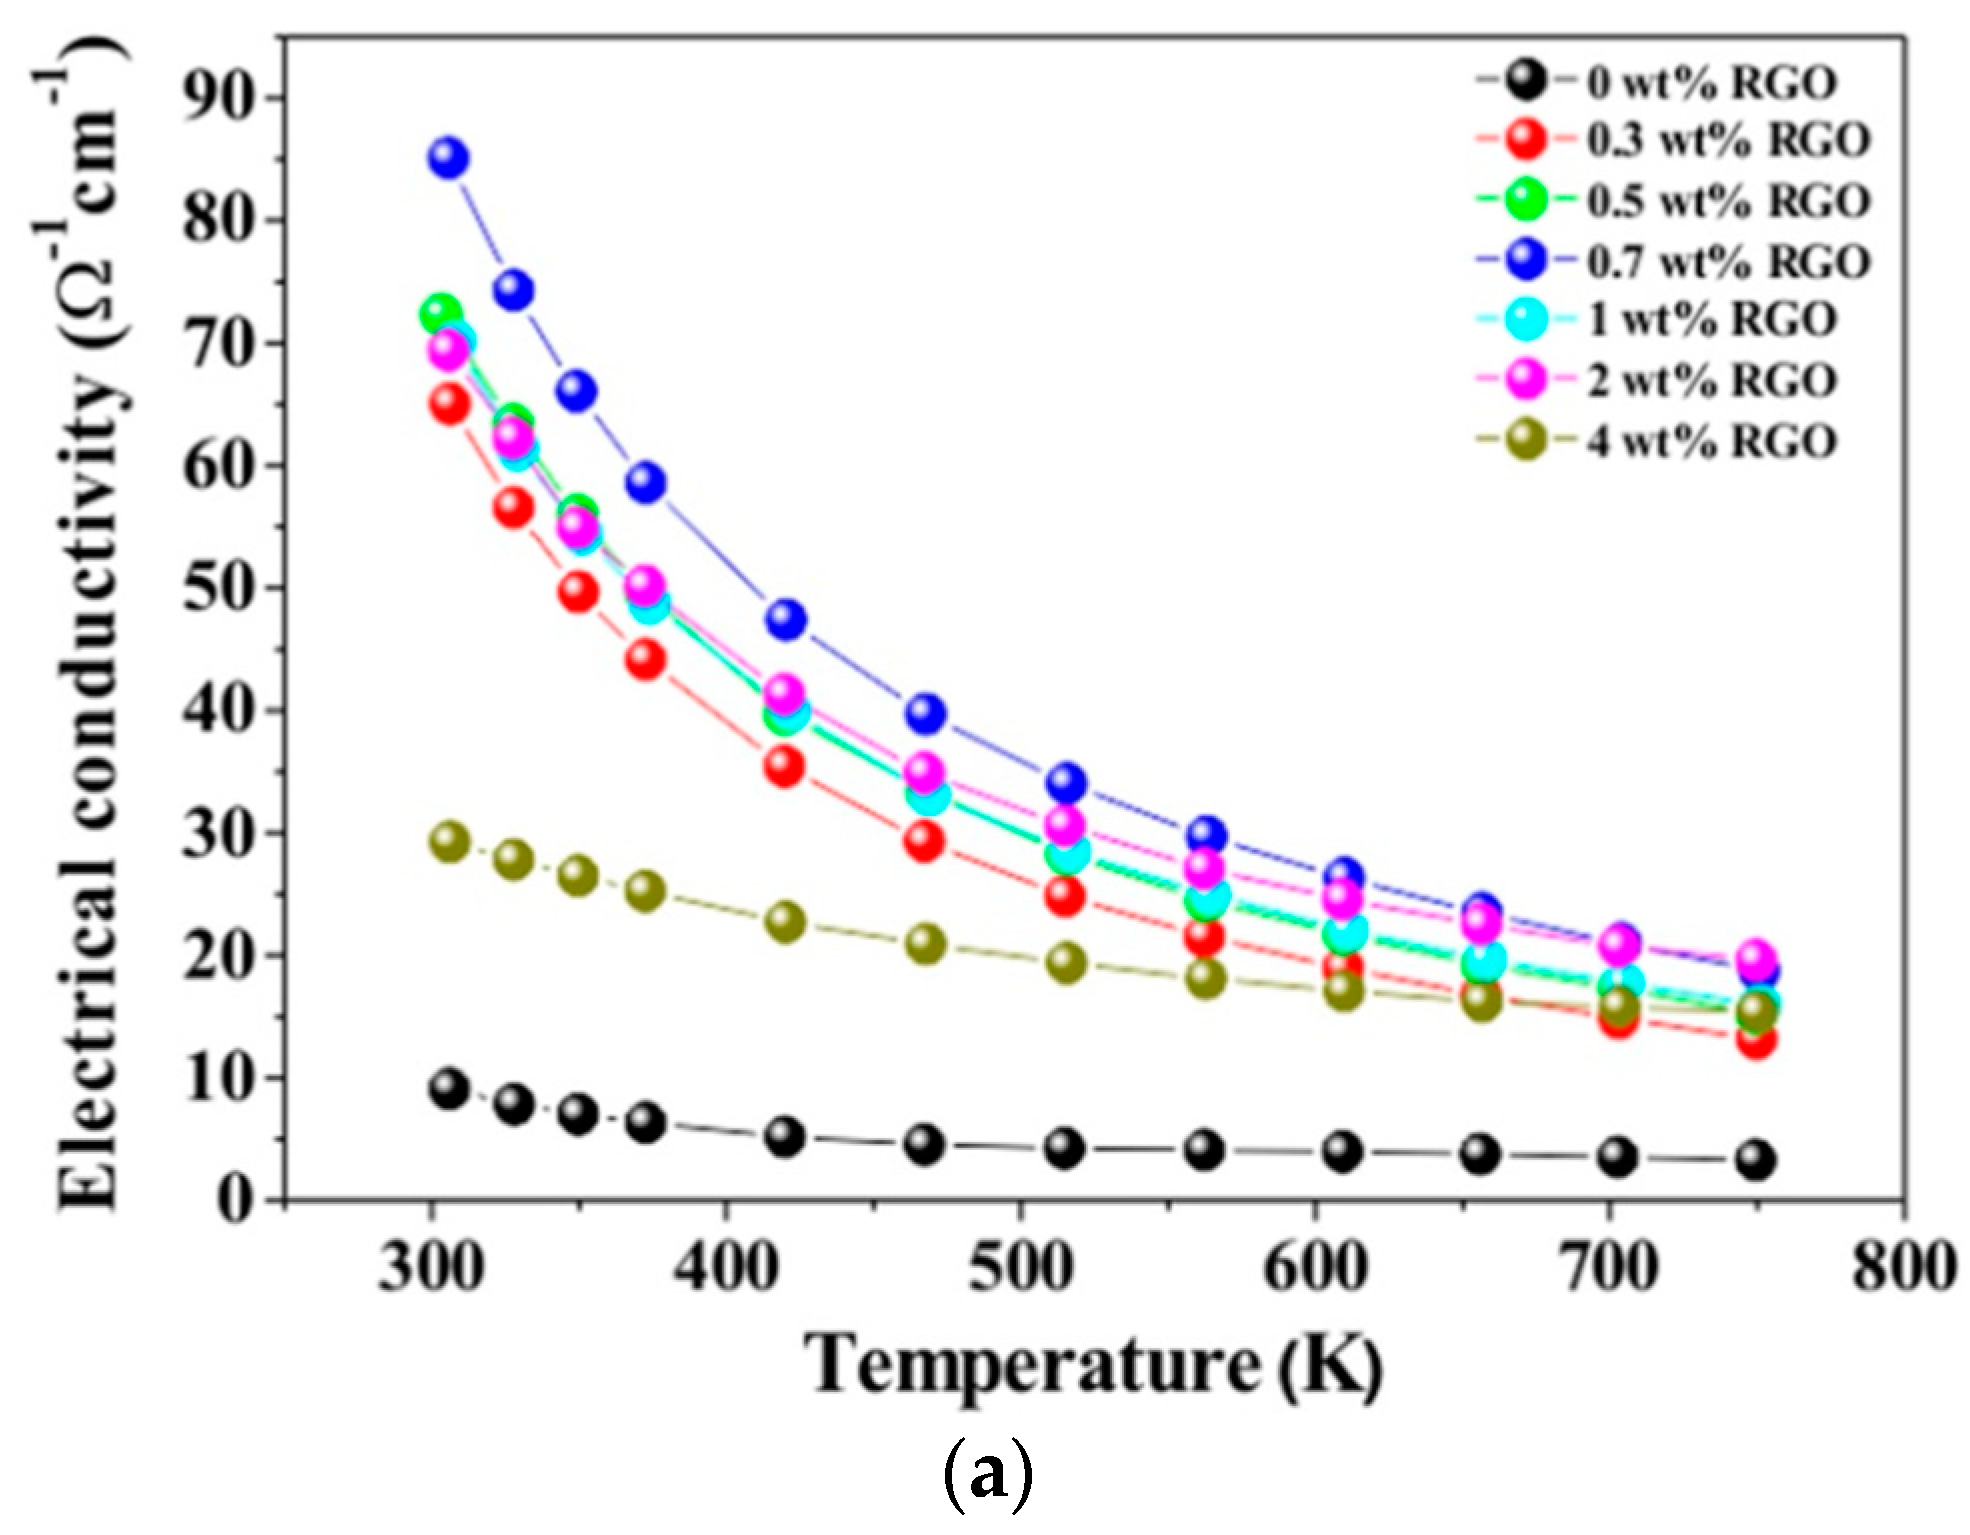
Figure 7.
Temperature dependent (a) electrical conductivity, (b) carrier concentrations, and (c) mobilities of the SrTiO3 composites with rGO [60].
Figure 7.
Temperature dependent (a) electrical conductivity, (b) carrier concentrations, and (c) mobilities of the SrTiO3 composites with rGO [60].


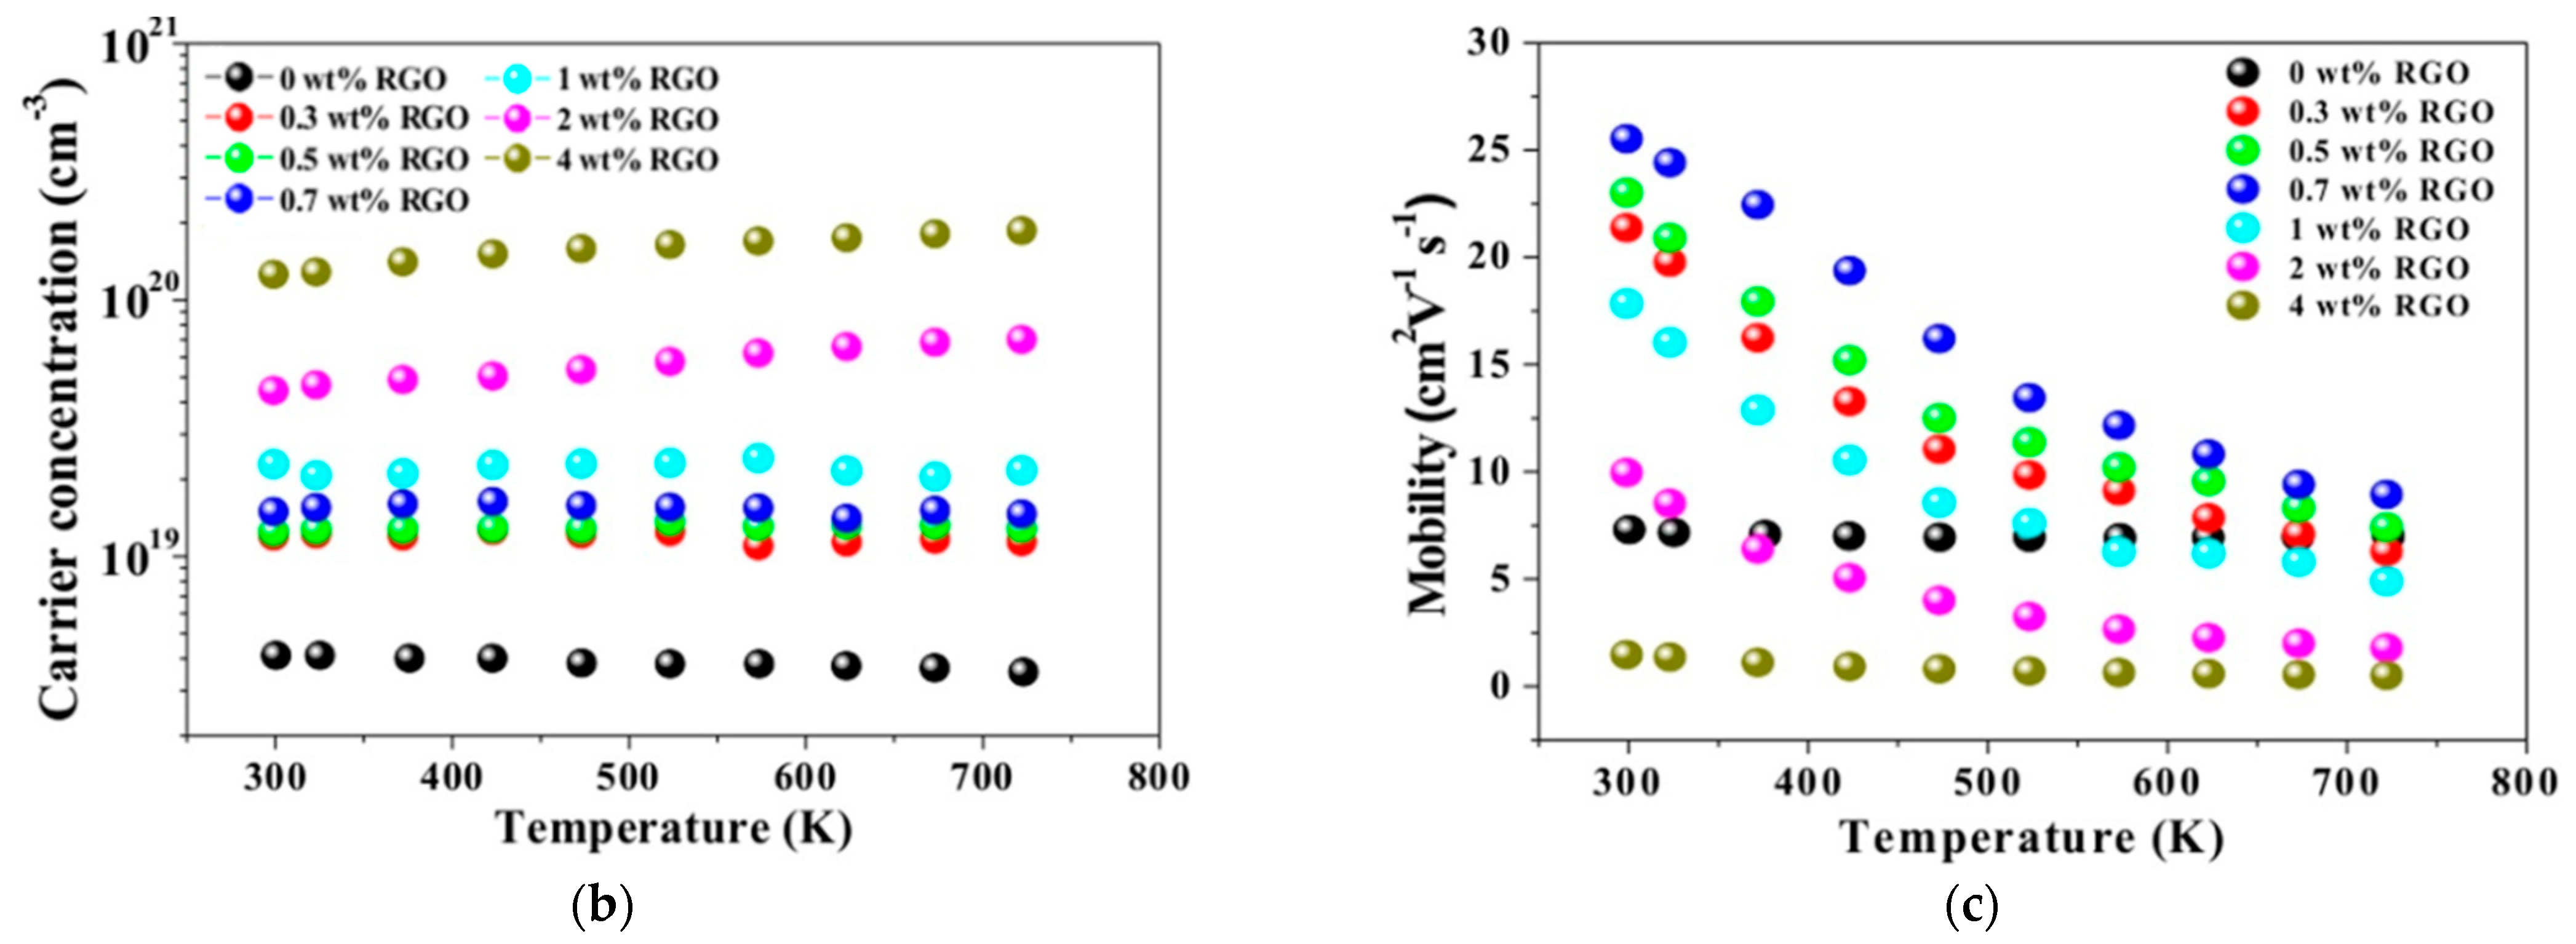
Figure 8.
(a) Temperature dependence of the electrical conductivity of Bi0.36Sb1.64Te3, with 0, 0.1, 0.4, 0.8 vol.% rGO (black, red, blue, and magenta dots and lines, respectively). (b) Dependency of carrier concentrations and mobilities on graphene amount in Bi0.36Sb1.64Te3 composites with rGO (reprinted from [42] with permission from Elsevier).

Figure 9.
Thermal conductivity of (a) undoped SrTiO3, with 0, 0.3, 0.5, 0.7, 1, 2 and 4 wt.% rGO (from bottom to top) [60]; (b) SrTiO3 doped by Nb as SrTi0.90Nb0.10O3 (STN10), nonstoichiometric Sr0.98Ti0.90Nb0.10O3 (nSTN10) and Sr0.98Ti0.85Nb0.15O3 (nSTN15) and their composites with 0.6 wt.% GO, indicated, respectively, as STN10 + rGO, nSTN10 + rGO and nSTN15 + rGO (reprinted from [62] with permission from Elsevier); (c) Bi0.36Sb1.64Te3 with 0, 0.1, 0.4, 0.8 vol.% GO (black, red, blue, and magenta dots and lines, respectively) (reprinted from [42] with permission from Elsevier); and (d) Yb0.27Co4Sb12 with addition 0, 0.72, 1.8, and 3.6 vol.% rGO (reprinted from [30] with permission from Royal Society of Chemistry).

Figure 10.
Relative increase of ZT for the chalcogenides, skutterudites, and metal oxides (adapted from the references presented in Table 4, Table 5 and Table 6), calculated following Equation (2) versus initial ZT values of the corresponding TE materials before the addition of G-rGO.


Table 1.
The composite preparation methods and conditions. The highest value of ZT (ZTmax) at the corresponding temperature (TZTmax), as well as the thermal conductivity (k), electrical conductivity (σ) and Seebeck coefficient (S) at that temperature reported for composites of chalcogenide TE materials with graphene or reduced graphene oxide.
| TE Material | G or rGO, | Method | T Range, | ZTmax (at TZTmax, K) | k at TZTmax, | σ at TZTmax, | S at TZTmax, | Ref. |
|---|---|---|---|---|---|---|---|---|
| Used Amount | K | /Used G-rGO Amount | W/(m × K) | × 103 S/m | μV/K | |||
| Bi2Te3 ingots | G com. | SPS 350 °C | 300–472 | 0.21 (472)/0.2 vol.% | 2.2 | 75 | −114 | [33] |
| 0–2 vol.% | 6 min 80 MPa | |||||||
| Bi2Te3 beads | GO by HM | HP 350 °C | RT | 0.3 (RT)/1 wt.% | 0.56 | 33 | −160 | [46] |
| 0–10 wt.% | 10 min 50 MPa | |||||||
| Bi2Te3 NWs by WCSR | GO by HM | HP 350 °C | RT | 0.4 (RT)/1 wt.% | 0.48 | 41 | −180 | [46] |
| 0–10 wt.% | 10 min 50 MPa | |||||||
| Bi2Te3 com. | G com. | Mix, press | 300–480 | 0.92 (402)/0.05 wt.% | 0.95 | 80 | −145 | [38] |
| 0, 0.05 wt.% | 7 min, 2 MPa | |||||||
| Bi2Te2.7Se0.3 by exf. | G | SPS 420 °C | 300–523 | 0.75 (360)/0.05 wt.% | 1.1 | 75 | −170 | [45] |
| 0–0.1 wt.% | 2 min, 30 MPa | |||||||
| Bi2Te2.7Se0.3 by US | G | SPS 420 °C | 300–523 | 0.8 (400)/0.05 wt.% | 0.95 | 60 | −170 | [45] |
| 0–0.1 wt.% | 2 min, 30 MPa | |||||||
| Bi0.36Sb1.64Te3 ingots | rGO com. | SPS 480 °C | 300–473 | 1.16 (393)/0.4 vol.% | 1.26 | 1 | 195 | [42] |
| 0–0.8 vol.% | 3 min, 60 MPa | |||||||
| Bi0.4Sb1.6Te3 ingots | G by exf. | HP 350 °C | 293–498 | 1.54 (440)/0.4 vol.% | 0.8 | 74 | 200 | [41] |
| 0–0.4 vol.% | 1 h, 600 MPa | |||||||
| Bi0.44Sb1.56Te3 ingots | GO com. | SPS 480 °C | 300–480 | 1.0 (400)/0.1 wt.% | 1.1 | 75 | 190 | [43] |
| 0–0.2 wt.% | 5 min, 50 MPa | |||||||
| Bi0.48Sb1.52Te3 com. | G com. | HFIHS 370 °C | 300–500 | 1.2 (375)/0.5 vol.% | 0.7 | 55 | 215 | [44] |
| 0–1 vol.% | 35 MPa | |||||||
| Bi0.48Sb1.52Te3 ingots | G com. | SPS 420 °C | 300–550 | 1.25 (320)/0.05 wt.% | 1.1 | 100 | 230 | [40] |
| 0–0.15 wt.% | 10 min, 60 MPa | |||||||
| Bi0.5Sb1.5Te3 by MW-STS | G by MW-EGt, | SPS 390 °C | 300–473 | 1.13 (360)/0.1 vol.% | 0.7 | 55 | 200 | [39] |
| 0–0.5 vol.% | 3 min, 70 MPa | |||||||
| Bi0.5Sb1.5Te3 ingots | G by MW-EGt | SPS 480 °C | 300–473 | 1.24 (360)/0.1 vol.% | 0.8 | 57.5 | 230 | [39] |
| 0, 0.1 vol.% | 3 min, 70 MPa | |||||||
| Cu2SnSe3 ingots | GO com. | SPS 587 °C | 300–700 | 0.44 (700)/0.25 vol.% | 1.0 | 0.125 | 220 | [36] |
| 0–1 vol.% | 8min, 50 MPa | |||||||
| CuInTe2 ingots | G from EGt | SPS 500 °C | 300–700 | 0.40 (700)/1.2 wt.% | 1.25 | 13.5 | 225 | [35] |
| 1.2, 2.4 wt.% | 10 min, 60 MPa | |||||||
| Cu2ZnSnS4 by MW | G com. | HP 350 °C | 300–700 | 0.5 (623)/0.75 wt.% | 0.5 | 30 | 120 | [37] |
| 0–1 wt.% | 15 min, 80 MPa | |||||||
| PbTe in-situ | GO by HM | SPS 580 °C | 300–670 | 0.7 (670)/5 wt.% | 0.7 | 1.25 | −250 | [34] |
| 0–10 wt.% | 5 min, 30 MPa |
Here WCSR—wet-chemical synthetic route; com.—commercial; exf.—exfoliation; US—ultrasonication; MW—microwave (synthesis); STS—solvothermal synthesis; HM—Hummer’s method; Get—expanded graphite; SPS—spark plasma sintering; HP—hot-pressing; HFIHS—high frequency induction heated sintering.
Table 2.
The composite preparation method and conditions, the highest value of ZT (ZTmax) at the corresponding temperature (TZTmax), as well as the thermal conductivity (k), electrical conductivity (σ) and Seebeck coefficient (S) at that temperature reported for composites of skutterudite TE materials with graphene or reduced graphene oxide.
| TE Material | G-rGO, | Method | T Range, | ZTmax (at TZTmax, K) | k at TZTmax, | σ at TZTmax, | S at TZTmax, | Ref. |
|---|---|---|---|---|---|---|---|---|
| Used Amount | K | /Used G-rGO Amount | W/m × K | ×103 S/m | μV/K | |||
| CoSb3 by STS | GO by HM | HP, 600 °C | 300–850 | 0.61 (800)/1.5 wt.% | 1 | 4.5 | 100 | [50] |
| 0, 1.5 wt.% | 2 h, 80 MPa | |||||||
| CoSb3 by STS | G | CSM, 500 °C | 300–700 | 0.45(650)/2 wt./% | 1.75 | 11.9 | 45 | [53] |
| 1 wt.% | 5 h, 10−5 Torr | |||||||
| Ce0.85Fe3CoSb12 ingots | GO by HM | SPS 600 °C | 300–800 | 1.06 (700)/1.4 vol.% | 1.85 | 80 | 180 | [51] |
| 0–2.8 vol.% | 15 min, 55 MPa | |||||||
| La0.8Ti0.1Ga0.1Fe3CoSb12 ingots | G by PECVD | HP 650 °C | 300–800 | 1 (723)/ - | 2 | 70 | 190 | [52] |
| 1 h, 90 MPa | ||||||||
| Yb0.27Co4Sb12 ingots | Wrapped rGO | SPS 627 °C | 300–850 | 1.52 (850)/0.72 vol.% | 3 | 150 | −195 | [30] |
| 0–3.6 vol.% | 10 min, 60 MPa |
Here STS—solvothermal synthesis; CS—chemical synthesis; HM—Hummer’s method; PECVD—plasma-enhanced chemical vapor deposition; HP—hot-pressing; CSM—conventional sintering method; SPS—spark plasma sintering.
Table 3.
The composite preparation method and conditions. The highest value of ZT (ZTmax) at the corresponding temperature (TZTmax), as well as the thermal conductivity (k), electrical conductivity (σ) and Seebeck coefficient (S) at that temperature, reported for composites of metal oxide TE materials with graphene or reduced graphene oxide.
| TE Material | G-rGO, | Method | T Range, | ZTmax (at TZTmax, K) | k at TZTmax, | σ at TZTmax, | S at TZTmax, | Ref. |
|---|---|---|---|---|---|---|---|---|
| Used Amount | K | /Used G-rGO Amount | W/m × K | ×103 S/m | μV/K | |||
| SrTiO3 com. | GO by HM | SPS 1200 °C | 300–760 | 0.09 (760)/0.64 vol.% | 3 | 3 | −375 | [31] |
| 0, 0.64 vol.% | 5 min, 60 MPa | |||||||
| SrTiO3 by SSS | GO | SPS 1300 °C | 300–723 | 0.05 (673)/0.7 wt.% | 3.5 | 2.5 | −350 | [60] |
| 0–4 wt.% | 15 min, 60 MPa | |||||||
| La0.067Sr0.9TiO3 by SSS | G by exf. | CSM 1437 °C | 273–1033 | 0.42 (273)/0.6 wt.% | 1.8 | 200 | −120 | [61] |
| 0–1 wt.% | 24 h | |||||||
| SrTi0.90Nb0.10O3 by SSS | GO by HM | CSM 1570 °C | 315–1160 | 0.24 (1160)/0.6 wt.% | 3.5 | 5 | −200 | [62] |
| 0, 0.6 wt.% | 10 h | |||||||
| Sr0.98Ti0.90Nb0.10O3 by SSS | GO by HM | CSM 1570 °C | 315–1160 | 0.29 (1160)/0.6 wt.% | 3 | 5 | −200 | [62] |
| 0, 0.6 wt.% | 10 h | |||||||
| Sr0.98Ti0.85Nb0.15O3 by SSS | GO by HM | CSM 1570 °C | 315–1160 | 0.27 (1160)/0.6 wt.% | 3.1 | 10 | −180 | [62] |
| 0, 0.6 wt.% | 10 h | |||||||
| Sr0.93Ti0.90Nb0.10O3 by HTS | GO by HM | SPS 1300 °C | 300–800 | 0.22 (800) /0.6 wt.% | 3 | 0.2 | −200 | [63] |
| 0–1 wt.% | 80 MPa | |||||||
| SrTi0.85Nb0.15O3 by SSS | GO by HM | SPS 1427 °C | 300–1200 | 0.5 (1200)/1.5 wt.% | 3.5 | 45 | −190 | [64] |
| 0–2 wt.% | 7 min, 50 MPa | |||||||
| Sr0.8L0.67Ti0.8Nb0.2O3 by SSS | G by exf. | SPS 1200 °C | 300–1000 | 0.07 (1000)/1 wt.% | 2.2 | 2 | −220 | [65] |
| 0–1 wt.% | 5 min, 50 MPa | |||||||
| ZnO com. | G com. | SPS 900 °C | 273–1073 | 0.04 (1073)/1 wt.% | 7 | 4 | −220 | [66] |
| 0–2 wt.% | 5 min, 70 MPa | |||||||
| Zn0.98Al0.02O by CS | GO by HM | HP 900 °C | 273–1173 | 0.28 (1173)/1.5 wt.% | 2.5 | 75 | −95 | [67] |
| 0–3.5 wt.% | 2 h, 75MPa | |||||||
| TiO2 com. | GO com. | SPS 900 °C | 300–1100 | 0.064 (1050)/4 wt.% | 1.2 | 5 | −100 | [68] |
| 0–4 wt.% | 5 min, 50 MPa | |||||||
| BaTiO3 com. | GO by HM | SPS 1100 °C | 300–600 | 0.08 (600)/1.7 wt.% | 2.5 | 0.25 | −380 | [69] |
| 1.5–4 wt.% | 1 min, 80 MPa |
Here com.—commercial; SSS—solid-state synthesis; HTS—hydrothermal synthesis; CS—chemical synthesis; HM—Hummer’s method; exf.—exfoliation; SPS—spark plasma sintering; CSM—conventional sintering method; HP—hot-pressing.
Table 4.
The highest ZT values of chalcogenide materials before and after G-rGO addition, ordered from the lowest to highest ZT values of TE materials without G-rGO, and calculated relative increase of ZT.
Table 4.
The highest ZT values of chalcogenide materials before and after G-rGO addition, ordered from the lowest to highest ZT values of TE materials without G-rGO, and calculated relative increase of ZT.
| TE Material | ZTmax | Relative Increase of ZT, % | Ref. | |
|---|---|---|---|---|
| without G-rGO | with G-rGO | |||
| Cu2ZnSnS4 | 0.11 | 0.5 | 355 | [37] |
| PbTe | 0.12 | 0.7 | 483 | [34] |
| Bi2Te3 | 0.145 | 0.21 | 44 | [33] |
| Cu2SnSe3 | 0.24 | 0.44 | 83 | [36] |
| Bi2Te3 | 0.68 | 0.92 | 23 | [38] |
| Bi2Te2.7Se0.3 | 0.65 | 0.8 | 15 | [45] |
| Bi2Te2.7Se0.3 | 0.65 | 0.75 | 35 | [45] |
| Bi0.5Sb1.5Te3 | 0.78 | 1.13 | 45 | [39] |
| Bi0.48Sb1.52Te3 | 0.9 | 1.25 | 39 | [40] |
| Bi0.5Sb1.5Te3 | 0.98 | 1.24 | 27 | [39] |
| Bi0.44Sb1.56Te3 | 1.0 | 1.0 | 0 | [43] |
| Bi0.36Sb1.64Te3 | 1.01 | 1.16 | 15 | [42] |
| Bi0.4Sb1.6Te3 | 1.4 | 1.54 | 15 | [41] |
| Bi0.48Sb1.52Te3 | 1.04 | 1.2 | 10 | [44] |
Table 5.
The highest ZT values of skutterudite materials before and after G-rGO addition, ordered from the lowest to highest ZT values of TE materials without G-rGO, and calculated relative increase of ZT.
Table 5.
The highest ZT values of skutterudite materials before and after G-rGO addition, ordered from the lowest to highest ZT values of TE materials without G-rGO, and calculated relative increase of ZT.
| TE Material | ZTmax | Relative Increase of ZT, % | Ref. | |
|---|---|---|---|---|
| without G-rGO | with G-rGO | |||
| CoSb3 | 0.26 | 0.61 | 135 | [50] |
| La0.8Ti0.1Ga0.1Fe3CoSb12 | 0.75 | 1 | 33 | [52] |
| Ce0.85Fe3CoSb12 | 0.8 | 1.06 | 33 | [51] |
| Yb0.27Co4Sb12 | 1.25 | 1.52 | 22 | [30] |
Table 6.
The highest ZT values of metal oxide materials before and after G-rGO addition, ordered from the lowest to highest ZT values of TE materials without G-rGO, and calculated relative increase of ZT.
Table 6.
The highest ZT values of metal oxide materials before and after G-rGO addition, ordered from the lowest to highest ZT values of TE materials without G-rGO, and calculated relative increase of ZT.
| TE Material | ZTmax | Relative Increase of ZT, % | Ref. | |
|---|---|---|---|---|
| without G-rGO | with G-rGO | |||
| SrLa0.67Ti0.8Nb0.2O3 | 0.0002 | 0.07 | 34900 | [65] |
| TiO2 | 0.0003 | 0.064 | 21233 | [68] |
| ZnO | 0.005 | 0.04 | 700 | [66] |
| SrTiO3 | 0.009 | 0.09 | 900 | [31] |
| SrTiO3 | 0.02 | 0.05 | 150 | [60] |
| Sr0.8L0.67Ti0.8Nb0.2O3 | 0.02 | 0.07 | 250 | [65] |
| SrTi0.85Nb0.15O3 | 0.02 | 0.5 | 2400 | [64] |
| Zn0.98Al0.02O | 0.035 | 0.28 | 700 | [67] |
| Sr0.93Ti0.9Nb0.1O3 | 0.12 | 0.22 | 83 | [63] |
| La0.067Sr0.9TiO3 | 0.12 | 0.42 | 250 | [61] |
| SrTi0.90Nb0.10O3 | 0.17 | 0.24 | 41 | [62] |
| Sr0.98Ti0.85Nb0.15O3 | 0.22 | 0.27 | 23 | [62] |
| Sr0.98Ti0.90Nb0.10O3 | 0.27 | 0.29 | 7 | [62] |
Publisher’s Note: MDPI stays neutral with regard to jurisdictional claims in published maps and institutional affiliations. |
© 2021 by the authors. Licensee MDPI, Basel, Switzerland. This article is an open access article distributed under the terms and conditions of the Creative Commons Attribution (CC BY) license (https://creativecommons.org/licenses/by/4.0/).
Share and Cite
MDPI and ACS Style
Okhay, O.; Tkach, A. Impact of Graphene or Reduced Graphene Oxide on Performance of Thermoelectric Composites. C 2021, 7, 37. https://0-doi-org.brum.beds.ac.uk/10.3390/c7020037
AMA Style
Okhay O, Tkach A. Impact of Graphene or Reduced Graphene Oxide on Performance of Thermoelectric Composites. C. 2021; 7(2):37. https://0-doi-org.brum.beds.ac.uk/10.3390/c7020037
Chicago/Turabian StyleOkhay, Olena, and Alexander Tkach. 2021. "Impact of Graphene or Reduced Graphene Oxide on Performance of Thermoelectric Composites" C 7, no. 2: 37. https://0-doi-org.brum.beds.ac.uk/10.3390/c7020037
Note that from the first issue of 2016, this journal uses article numbers instead of page numbers. See further details here.