Article

Polyamide 12/Multiwalled Carbon Nanotube and Carbon Black Nanocomposites Manufactured by 3D Printing Fused Filament Fabrication: A Comparison of the Electrical, Thermoelectric, and Mechanical Properties

by
Nectarios Vidakis
1,
Markos Petousis
1,*,
Lazaros Tzounis
2,
Emmanuel Velidakis
1,
Nikolaos Mountakis
1 and
Sotirios A. Grammatikos
3
1
Mechanical Engineering Department, Hellenic Mediterranean University, 71410 Heraklion, Greece
2
Department of Materials Science and Engineering, University of Ioannina, 45110 Ioannina, Greece
3
Department of Manufacturing & Civil Engineering, NTNU-Norwegian University of Science and Technology, Building B’, Teknologivegen 22, 2815 Gjøvik, Norway
*
Author to whom correspondence should be addressed.
Submission received: 28 March 2021 / Revised: 21 April 2021 / Accepted: 21 April 2021 / Published: 23 April 2021
(This article belongs to the Collection Feature Papers in the Science and Engineering of Carbons)

Abstract

:
In this study, nanocomposites with polyamide 12 (PA12) as the polymer matrix and multiwalled carbon nanotubes (MWCNTs) and carbon black (CB) at different loadings (2.5, 5.0, and 10.0 wt.%) as fillers, were produced in 3D printing filament form by melt mixing extrusion process. The filament was then used to build specimens with the fused filament fabrication (FFF) three-dimensional (3D) printing process. The aim was to produce by FFF 3D printing, electrically conductive and thermoelectric functional specimens with enhanced mechanical properties. All nanocomposites’ samples were electrically conductive at filler loadings above the electrical percolation threshold. The highest thermoelectric performance was obtained for the PA12/CNT nanocomposite at 10.0 wt.%. The static tensile and flexural mechanical properties, as well as the Charpy’s impact and Vickers microhardness, were determined. The highest improvement in mechanical properties was observed for the PA12/CNT nanocomposites at 5.0 wt.% filler loading. The fracture mechanisms were identified by fractographic analyses of scanning electron microscopy (SEM) images acquired from fractured surfaces of tensile tested specimens. The nanocomposites produced could find a variety of applications such as; 3D-printed organic thermoelectric materials for plausible large-scale thermal energy harvesting applications, resistors for flexible circuitry, and piezoresistive sensors for strain sensing.

1. Introduction

Additive manufacturing (AM) is currently considered as one of the most prominent manufacturing technologies with several recent developments and applications in diverse fields ranging from construction and buildings [1] and advanced polymer composites with electrical and thermoelectric properties [2] to the fabrication of electronic devices [3] and antimicrobial biomedical equipment based on thermoplastic materials [4]. Three-dimensional (3D) printing, which belongs to the AM technologies family, has experienced radical development and adoption over the last 20 years in both academia and various industrial sectors. Currently, 3D printing constitutes a cutting-edge and one of the most extensively used AM technologies [5]. This is attributed to the fact that 3D printing, among other manufacturing technologies, allows for the creation of 3D objects with more complex structures, compared to conventionally machined parts [6].
From the ever-increasing number of 3D printing AM approaches, fused filament fabrication (FFF) has been the most prominent technology, both for academia and science, as well as for home use and industrial applications. Typically, thermoplastic polymeric materials in the form of filaments are used as feedstock. The filament is being heated above its melting point (Tm) and extruded with a movable nozzle in the X–Y direction to form a 3D structure via a layer-by-layer addition [7].
To date, 3D-printed part quality and final object properties have been considerably improved in FFF 3D printing, but the main limitation is the dearth of appropriate thermoplastic functional materials. Specifically, the physicochemical properties of the feedstock filament material could affect a great number of multifunctional properties of the final object, giving an added value to the final product. This could lead to higher FFF 3D-printed product quality, higher production yield, and rate. Functional and novel thermoplastic materials (i.e., electrically conductive) with carbon nanotubes (CNTs) and graphene (which have been utilized in this study to endow both electrically conductive and thermoelectrically properties to filaments) [8], mechanical reinforcement [9], enhanced flexibility and stretchability [10], antimicrobial properties based on PLA/Ag nanocomposites realized via melt-mixed silver salts, and in situ reduction reactive extrusion filament production [11], magnetic properties [12], etc. have been used as filaments for FFF 3D printing toward the production of 3D objects with on-demand geometries and complex architectures.
Polyamide 12 (PA12) is a thermoplastic engineering polymer known for its toughness, tensile strength, impact strength, and ability to flex without easily fractured [13]. Relatively, there are only a few articles [14,15] available reporting on the PA12 processing via FFF 3D printing. One of them is our recent article, focusing on the mechanical properties of PA12 in consecutive recycling cycles and observation of the knock-down mechanisms on the 3D-printed objects’ mechanical properties [16]. Additionally, we have also recently reported the effect of strain rate on its tensile mechanical properties [17]. PA12 has been extensively studied for multi-jet fusion and selective laser sintering (SLS) AM 3D printing processes, in a recent study that highlighted the properties of 3D-printed parts as a function of the applied process parameters [18]. Moreover, PA12 properties, in combination with its market price, could promote it as a fundamental material for AM FFF processes, and therefore, thorough investigations are necessary to elucidate the process–structure–property relationship.
Carbon nanotubes (CNTs) and carbon black (CB) nanoallotrope fillers are very commonly used with glass fibers [19] and polymer matrices to increase specific properties such as tensile strength [20], fracture toughness [21], electrical [22], thermal conductivity [23], etc. The resulting nanocomposites, defined as conductive polymer composites (CPCs) could offer a variety of functional properties, such as sensing functionalities, i.e., chemical and/or electrochemical sensors, temperature, piezo-resistive and piezoelectric touch/pressure sensors, etc. [24]. CPC filaments have been fabricated and utilized for fused deposition modeling (FDM) 3D printing [8] toward biomedical sensors [25], resistors for Joule-heating electrothermal effect [26], actuators [27], and piezoresistive strain sensors [28]. In a recent study, the authors reported on the effect of MWCNTs and SWCNTs as two different nanofillers (up to 10.0 wt.% filler loading) on the mechanical and electrical properties of melt mixed processed ABS nanocomposites [29]. Thermoelectric materials are known for their ability to generate an electric potential, known as thermoelectric voltage, upon being exposed to a temperature gradient (the so-called Seebeck effect) [30]. For an efficient thermoelectric material, high electrical conductivity (σ), combined with high Seebeck coefficient (S = ∆V/∆T) and low thermal conductivity (κ), is required, resulting in a high-power factor (PF = σ × S2). Polymer/carbon nanoparticulate thermoelectric nanocomposites have attracted significant attention over the last decade as lightweight and flexible materials capable of converting waste thermal energy into usable electricity [31,32]. Moreover, rare and high toxicity elements that conventional thermoelectric materials consist, e.g., Bi2Te3 [33], PbTe [34], GeTe [35], etc., hinder their widespread application for energy harvesting on a large scale. Polycarbonate (PC)/SWCNT CPCs prepared via solvent mixing showed an electrical conductivity of ~1000 S/m and Seebeck coefficient S = +60 µV/K at 30 wt.% SWCNT loading [36]. In another study, melt-mixed PC/MWCNT nanocomposites with pristine as well as carboxyl (–COOH) and hydroxyl (–OH) functionalized MWCNTs at 2.5 wt.% exhibited the highest Seebeck coefficient (S) of +11.3 μV/K for the composite containing carboxyl functionalized MWCNTs. Polyetherimine (PEI)/SWCNT nanocomposites with PEI functioning as the matrix and concomitant n-doping of the incorporated SWCNTs resulted in Seebeck coefficients of −21.5 µV/K [37]. In a previous work by our group, polyetherimide–SWCNT CPCs produced by solvent mixing showed capability of operating as a thermoelectric material up to 200 °C and exhibited electrical conductivity of 20 S/m and Seebeck coefficients +55µV/K at 10wt.% SWCNT loading [38]. Nanocomposites of PC with carboxyl functionalized MWCNTs (MWCNT-COOH), prepared by melt mixing processed at 270 °C, exhibited the following values of electrical conductivity; σ = 0.05 S/m, Seebeck coefficient; S = 13.55 μV/K and power factor; PF = 7.60 × 10⁻⁶ μW/m K−2 at 2.5 wt.% filler loading [39]. A detailed review article recently highlighted the novelty of CPCs based on polymer/carbon nanoparticle systems as emerging thermoelectric materials [40]. Use of CPC filaments for FFF 3D printing and 3D objects have been reported [4]. Electrically conductive 3D-printed thermoplastic polyurethane (TPU)/CNT thermoelectric nanocomposites have also been thoroughly investigated for their mechanical properties and reinforcement mechanisms [2].
In this study, electrically conductive PA12 nanocomposites with MWCNTs and CB as mechanical reinforcing fillers were prepared by melt mixing extrusion process in filament form. Nanocomposite filaments with filler percentage of 2.5, 5.0 and 10.0 wt.% were produced in order to be further processed via FFF 3D printing AM technology, to manufacture 3D printing specimens. Mechanical, electrical, and thermoelectric properties were investigated to elaborate the filler’s effect on the 3D-printed nanocomposites’ properties. Raman spectroscopy revealed the graphitic nature of carbon nanoallotropes and the corresponding PA12 nanocomposites at 2.5 wt.% filler loading. The 3D-printed specimens exhibited an anisotropic electrical conductivity in the through layer and cross layer printing directions, whereas they exhibited an identical Seebeck coefficient in both layers. 5.0 wt.% filled CNT and CB 3D-printed nanocomposites exhibited the highest tensile, flexural and impact properties among the nanocomposites tested in this work. Albeit a slight knock-down effect in the impact properties was observed for the CNT and CB nanocomposites at 2.5, 5.0 and 10.0 wt.%, compared to neat PA12 polymer matrix.

2. Materials and Methods

2.1. Materials

A polyamide 12 (PA12) thermoplastic material in the form of fine granules with the specific grade AESNO TL (Rilsamid PA12 AESNO TL) was received from Arkema (Colombes, France) and utilized as the matrix of the nanocomposites in this study. According to the supplier’s technical data sheet, the PA12 has a density of 1.01 g/cm2 (according to ISO 1183), melt volume-flow rate (MVR) of 8.0 cm3/10min (according to ISO 1133) at 235 °C/5.0kg, Vicat softening temperature at 142 °C (according to ISO 306/B50) and melting temperature at 180 °C (according to ISO 11357-3). Moreover, the PA12, according to the supplier specifications, contains some additives for heat stabilization, lubrication, and UV stabilization. Commercially available MWCNTs, namely, the NC7000 type, were purchased from Nanocyl S.A. (Sambreville, Belgium). According to the supplier specifications, MWCNTs exhibit purity >90% with average diameters of 9.5 nm and average lengths of 1.5 μm. A highly conductive carbon black (CB) grade (C-NERGY Super P Conductive Carbon Black) was received from Nanografi Nanotechnology AS (Tallinn, Estonia). Both MWCNTs and CB conductive fillers have been used as additives for the conductive polymer nanocomposites (CPCs) fabricated in this study.

2.2. Fabrication of Filaments and FFF 3D Printing Process of PA12, PA12/CNT, and PA12/CB Nanocomposite

The PA12 granules were left initially to dry at 80 °C for 24 h (predetermined quantities for each filament extrusion batch). The granules were extruded through a single screw extruder (3D Evo Composer 450, 3D Evo B.V., NL), in order to produce a 1.75 mm diameter filament appropriate for FFF 3D printing. Heat zone 1 (closer to extruder’s nozzle) was set to 210 °C, heat zone 2 was set to 220 °C, heat zone 3 was set to 220 °C, and finally, heat zone 4 (closer to extruder’s hopper) was set to 185 °C. The extruder’s screw rotational speed was set to 8.5 rpm, while the cooling fans after the nozzle were set to 50% speed. For the filament production in all cases studied (neat PA12, PA12/CNT, and PA12/CB nanocomposites at 2.5, 5.0, and 10.0 wt.% loadings), the extrusion parameters were kept constant. The extruded filament diameter was measured to be in all cases 1.68 mm ± 0.07 mm, which is adequate for consistent 3D printing. The filaments produced were then dried at the same conditions, and parts of them were used to produce 3D-printed specimens. The filament diameter was inserted in the slicer program to calculate the necessary feed rate that should be automatically used during the whole 3D printing process.
Fused filament fabrication (FFF) was selected to manufacture the neat PA12 as well as the PA12/CNT and PA12/CB nanocomposite specimens using a Craftbot Plus (Craftbot ltd, HU) FFF technology 3D printer, with the all-metal 3D printing head (hot end) in its setup. Initial trials were performed to obtain the optimum FFF 3D printing parameters (set of parameters) for processing the PA12 and the PA12 nanocomposite systems in this study. Consequently, the following 3D printing conditions were determined to be the optimum employed for all the 3D printing processes in this study; nozzle temperature: 220 °C, 3D print nozzle diameter: 0.8 mm, bed temperature: 60 °C, layer height: 0.20 mm, 3D print infill: 100% and 3D print speed: 20 mm/s (Figure 1). It should be mentioned that in order to reduce the wrapping effect on the PA12 manufactured specimens, a masking tape (3M 101+) was used over the 3D printer’s aluminum heat bed. Finally, the 3D printer nozzle’s fans were set to 0%. For the mechanical characterization, electrical conductivity, and thermoelectric measurements, all 3D models for the 3D printing have been designed using the 3D design Autodesk® Fusion 360™ (Autodesk®, Inc., San Rafael, CA, USA) software, and finally exported to Standard Tessellation Language (STL) files.
Figure 2 illustrates schematically the flow chart demonstrating the methodology followed in this work to produce the PA12, as well as PA12/CNT and PA12/CB nanocomposites utilized for the different measurements. Figure 2 summarizes the 3D printing parameters employed for the manufacturing of the different specimens with different geometries in this study.

2.3. Characterization Techniques

Raman spectroscopy was performed using a Labram HR-Horiba (Horiba Scientific, Kyoto, Japan) micro-Raman system, while all spectra were acquired in the backscattering geometry with a 514.5 nm line of an Ar+ ion laser operating at 1.5 mW (with a laser spot diameter of ~3 μm).
Scanning electron microscopy (SEM) microstructural analysis was performed using a JEOL JSM 6362LV (Jeol Ltd., Peabody, MA, USA) electron microscope in high-vacuum mode at 20 kV acceleration voltage on sputtered-gold coated samples.
The through-thickness (through-layer) and in-plane (cross-layer) electrical conductivities of 3D-printed samples were determined using square-shaped samples of 10.0 × 10.0 mm2 and 3.2 mm thickness. Ag paste (room temperature, fast curing, curing/drying silver paste received from Agar Scientific, Germany) was applied on the appropriate surfaces to contact the samples for the respective through-layer and cross-layer conductivity determination, as illustrated in Figure 3a. Then, two-point probe electrical resistance measurements were performed with an Agilent Multimeter (Agilent 34401A6½, Agilent, Santa Clara, CA, USA) in order to determine electrical resistivity (ρ) and conductivity (σ), respectively, based on the specific sample dimensions.
A self-made custom setup was employed to determine the Seebeck coefficient for all conductive 3D-printed nanocomposites in this work at 0 wt.%, 2.5 wt.%, 5.0 wt.%, and 10.0 wt.% filler loading, respectively, with dimensions 15.0 (length) × 10.0 (width) mm2 and 3.2 mm thickness (Figure 3b). The full experimental details, i.e., the method to contact the sample, measurement of the temperature gradient (∆T), and the voltage potential (∆V) generated by the samples have been previously reported [41,42]. Briefly, the different samples were exposed to a temperature gradient stage during which one block was maintained at room temperature (~298 K), while the other one was heated up to 373 K using a heating controller in 10 K steps. The thermoelectric voltage (ΔV) was measured using a digital multimeter (DMM)—voltmeter (Agilent 34401A6½, Agilent, Santa Clara, USA). K-type thermocouples were placed onto the two blocks to continuously measure the temperature and precisely determine the temperature gradient (ΔT). The Seebeck coefficient was derived from ΔV vs. ΔT curve’s slope by linear fitting.
Specimens were tested for the determination of their mechanical properties at room temperature (23 °C). Tensile experiments were carried out according to the ASTM D638-02a international standard. According to the standard, a type V specimen of 3.2 mm thickness was chosen, and a total of six specimens were manufactured and tested. An Imada MX2 (Imada inc., Northbrook, IL, USA) tensile/flexure test apparatus in tensile mode using standardized grips was utilized to carry out the tensile test experiments at a strain rate of 10 mm/min.
Impact tests were performed according to the ASTM D6110-04 international standard. Specimens were 3D printed with the following dimensions: 80.0 mm (length) × 8.0 mm (width) × 10.0 mm (thickness). Six specimens in total were tested using a Terco MT 220 (Terco, Sweden) Charpy’s impact apparatus. The release height of the apparatus hammer was the same for all the experiments (367 mm).
Microhardness measurements were conducted according to the ASTM E384-17 international standard. The specimens’ surface was fully polished before each set of measurements. An Innova Test 300- Vickers (Innovatest Europe BV, Maastricht, the Netherlands) apparatus was employed, while the applied force was set to 100 gF, and a duration of 10s was selected for indentation. Imprints were measured on six different specimens for each one of the PA12 and PA/12 nanocomposites.

3. Results and Discussion

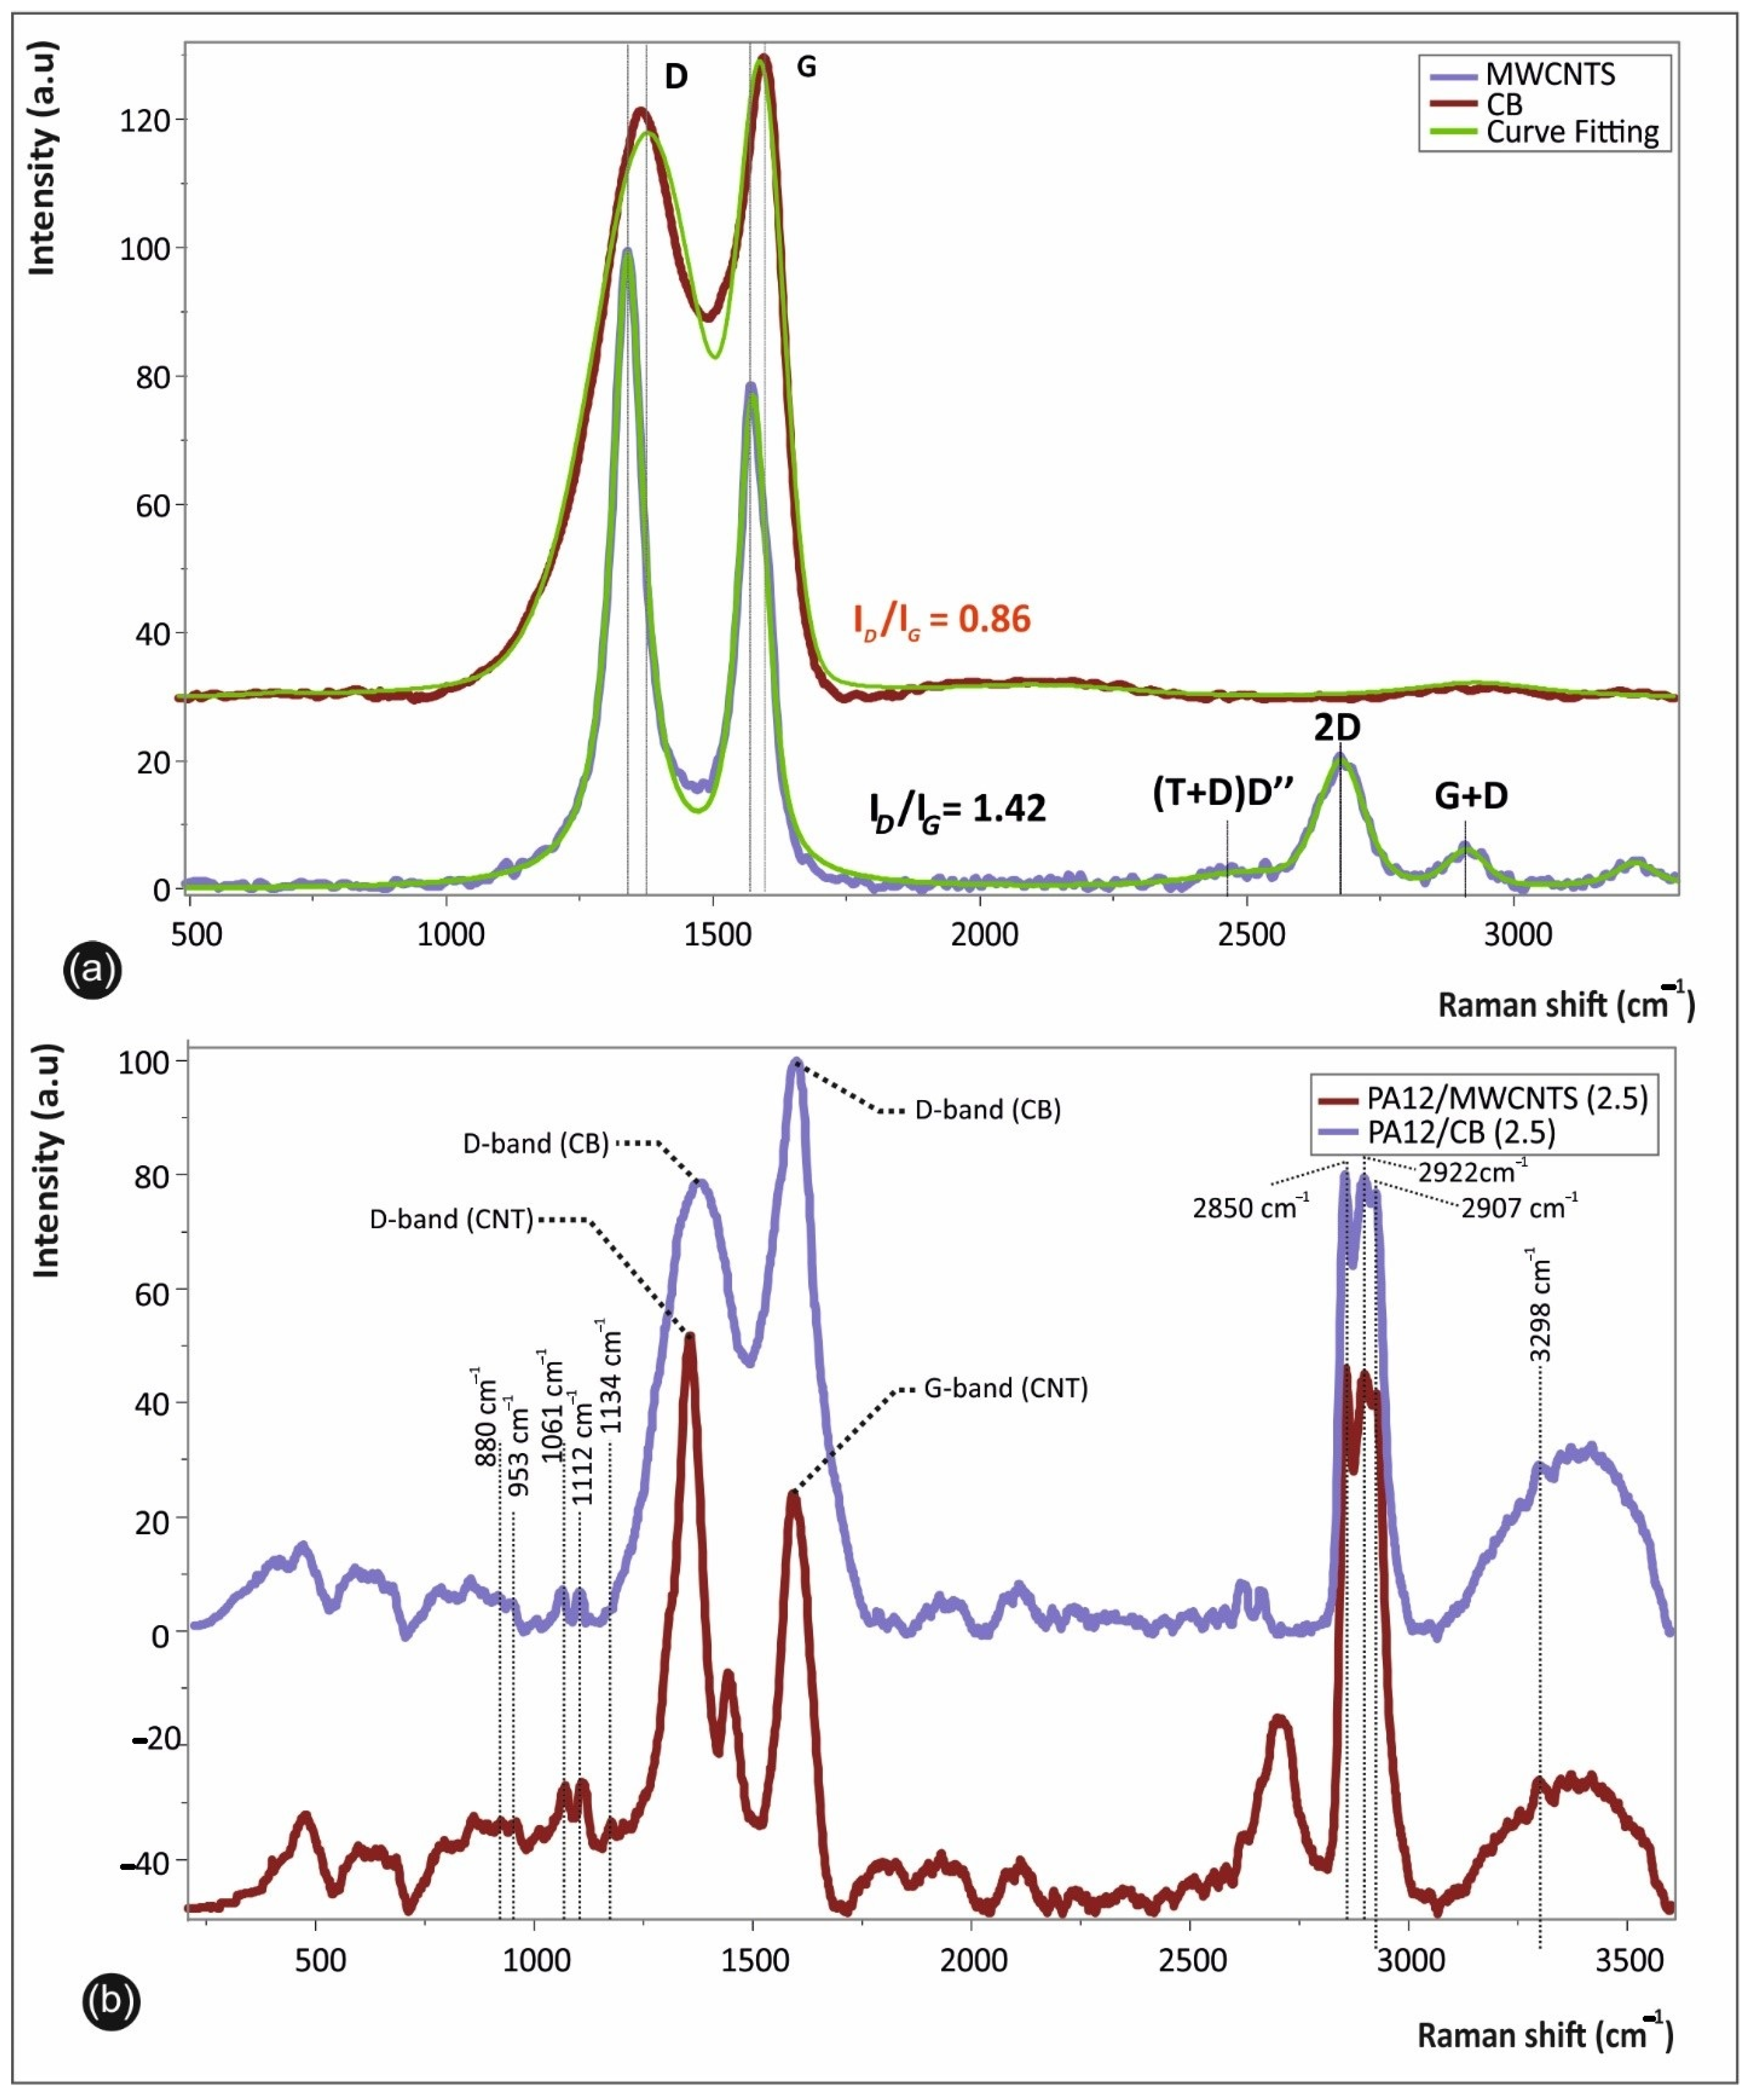
3.1. Raman Analysis of MWCNTs, CB, and PA12 Nanocomposites

Figure 4a shows the Raman spectra of MWCNTs and the highly graphitized CB carbon nanoallotrope fillers utilized in this work. Both curves are depicted in the spectral region of 500–3300 cm−1, together with the corresponding fitting curves. Two distinct spectral regions can be observed: one at 1000 and 2000 cm−1 and the second one between 2300 and 3300 cm−1. Two broad bands can be observed in the first region, namely, the G-band (G stands for “graphitic”) between 1500 and 1600 cm−1, and the D-band (D stands for “defects” or disorder) at 1300–1400 cm−1 resulting from a disorder-induced double resonant process [43]. In the second-order region, three main bands could be observed, i.e., the (T + D)D″ (2450 cm−1), 2D (2675 cm−1), and the G + D (2900 cm−1), which are assigned to overtones and combinations of the bands arising from the first order region.
The D-band and G-band peaks, characteristic of graphitic carbon allotrope materials, were centered at ca. 1345 cm−1 and 1565 cm−1, respectively, with the D- and G-bands of CB slightly shifted to higher wavenumbers, compared to the MWCNTs’ spectrum [44]. Curve fitting analysis was performed to appropriately define the Lorentzian D and G-peaks’ characteristics of the Raman spectra. The 2D-band for the MWCNT spectrum (~2675 cm−1) confirms that the nanotubes are of MWCNT type [31]. The graphitization and degree of crystallinity of carbon nanoallotropes have been correlated to the relative intensity ratio of the corresponding D and G-bands (ID/IG) [45]. Specifically, the D and G band intensity ratio (ID/IG) is 1.42 for the MWCNTs and 0.86 for the CB (highly crystalline CB grade used in this study). This can be explained by a larger number of defects and existing sp3-hybridized carbons in the nanotube framework, compared to the CB graphitized structure.
Figure 4b shows the Raman spectra of PA12/MWCNT and PA12/CB nanocomposites at 2.5 wt.% of filler at the spectral region 200–3600 cm−1. In both spectra, there are characteristic peaks attributed to the PA12 matrix, as well as the graphitic fingerprints of MWCNTs and CB present (previously identified and assigned in Figure 4a). It is worth mentioning that the Raman spectra of both nanocomposites at higher filler loadings, namely, at 5.0 and 10.0 wt.%, were governed by the carbon nanoadditive “characteristic” spectroscopic responses without any visible peak arising from the PA12 polymeric matrix and therefore have not been shown. Specifically, the bands at 611 cm−1 (N-H out-of-plane bending), 633 cm−1 (assigned to Amide IV (d CO), 715 cm−1 (CH2 rocking), 880 cm−1 (CH2 rocking), 953 cm−1 (C-CO stretch), 1061 cm−1 (C-C stretch), 1083 cm−1 (C-C stretch), 1112 cm−1 (C-C stretch), 1134 cm−1 (C-C stretch), several primary peaks at around 950–1200 cm−1 (CH2 stretching mode), 2850 cm−1 (CH2 symmetric. stretching), 2907 cm−1 (CH2 symmetric. stretching), 2922 cm−1 (CH2 asymmetric. stretching), and 3298 cm−1 (N-H stretch) are all attributed to PA12, being in good agreement with previously published data for the characteristic peaks of PA12 Raman spectra [46].

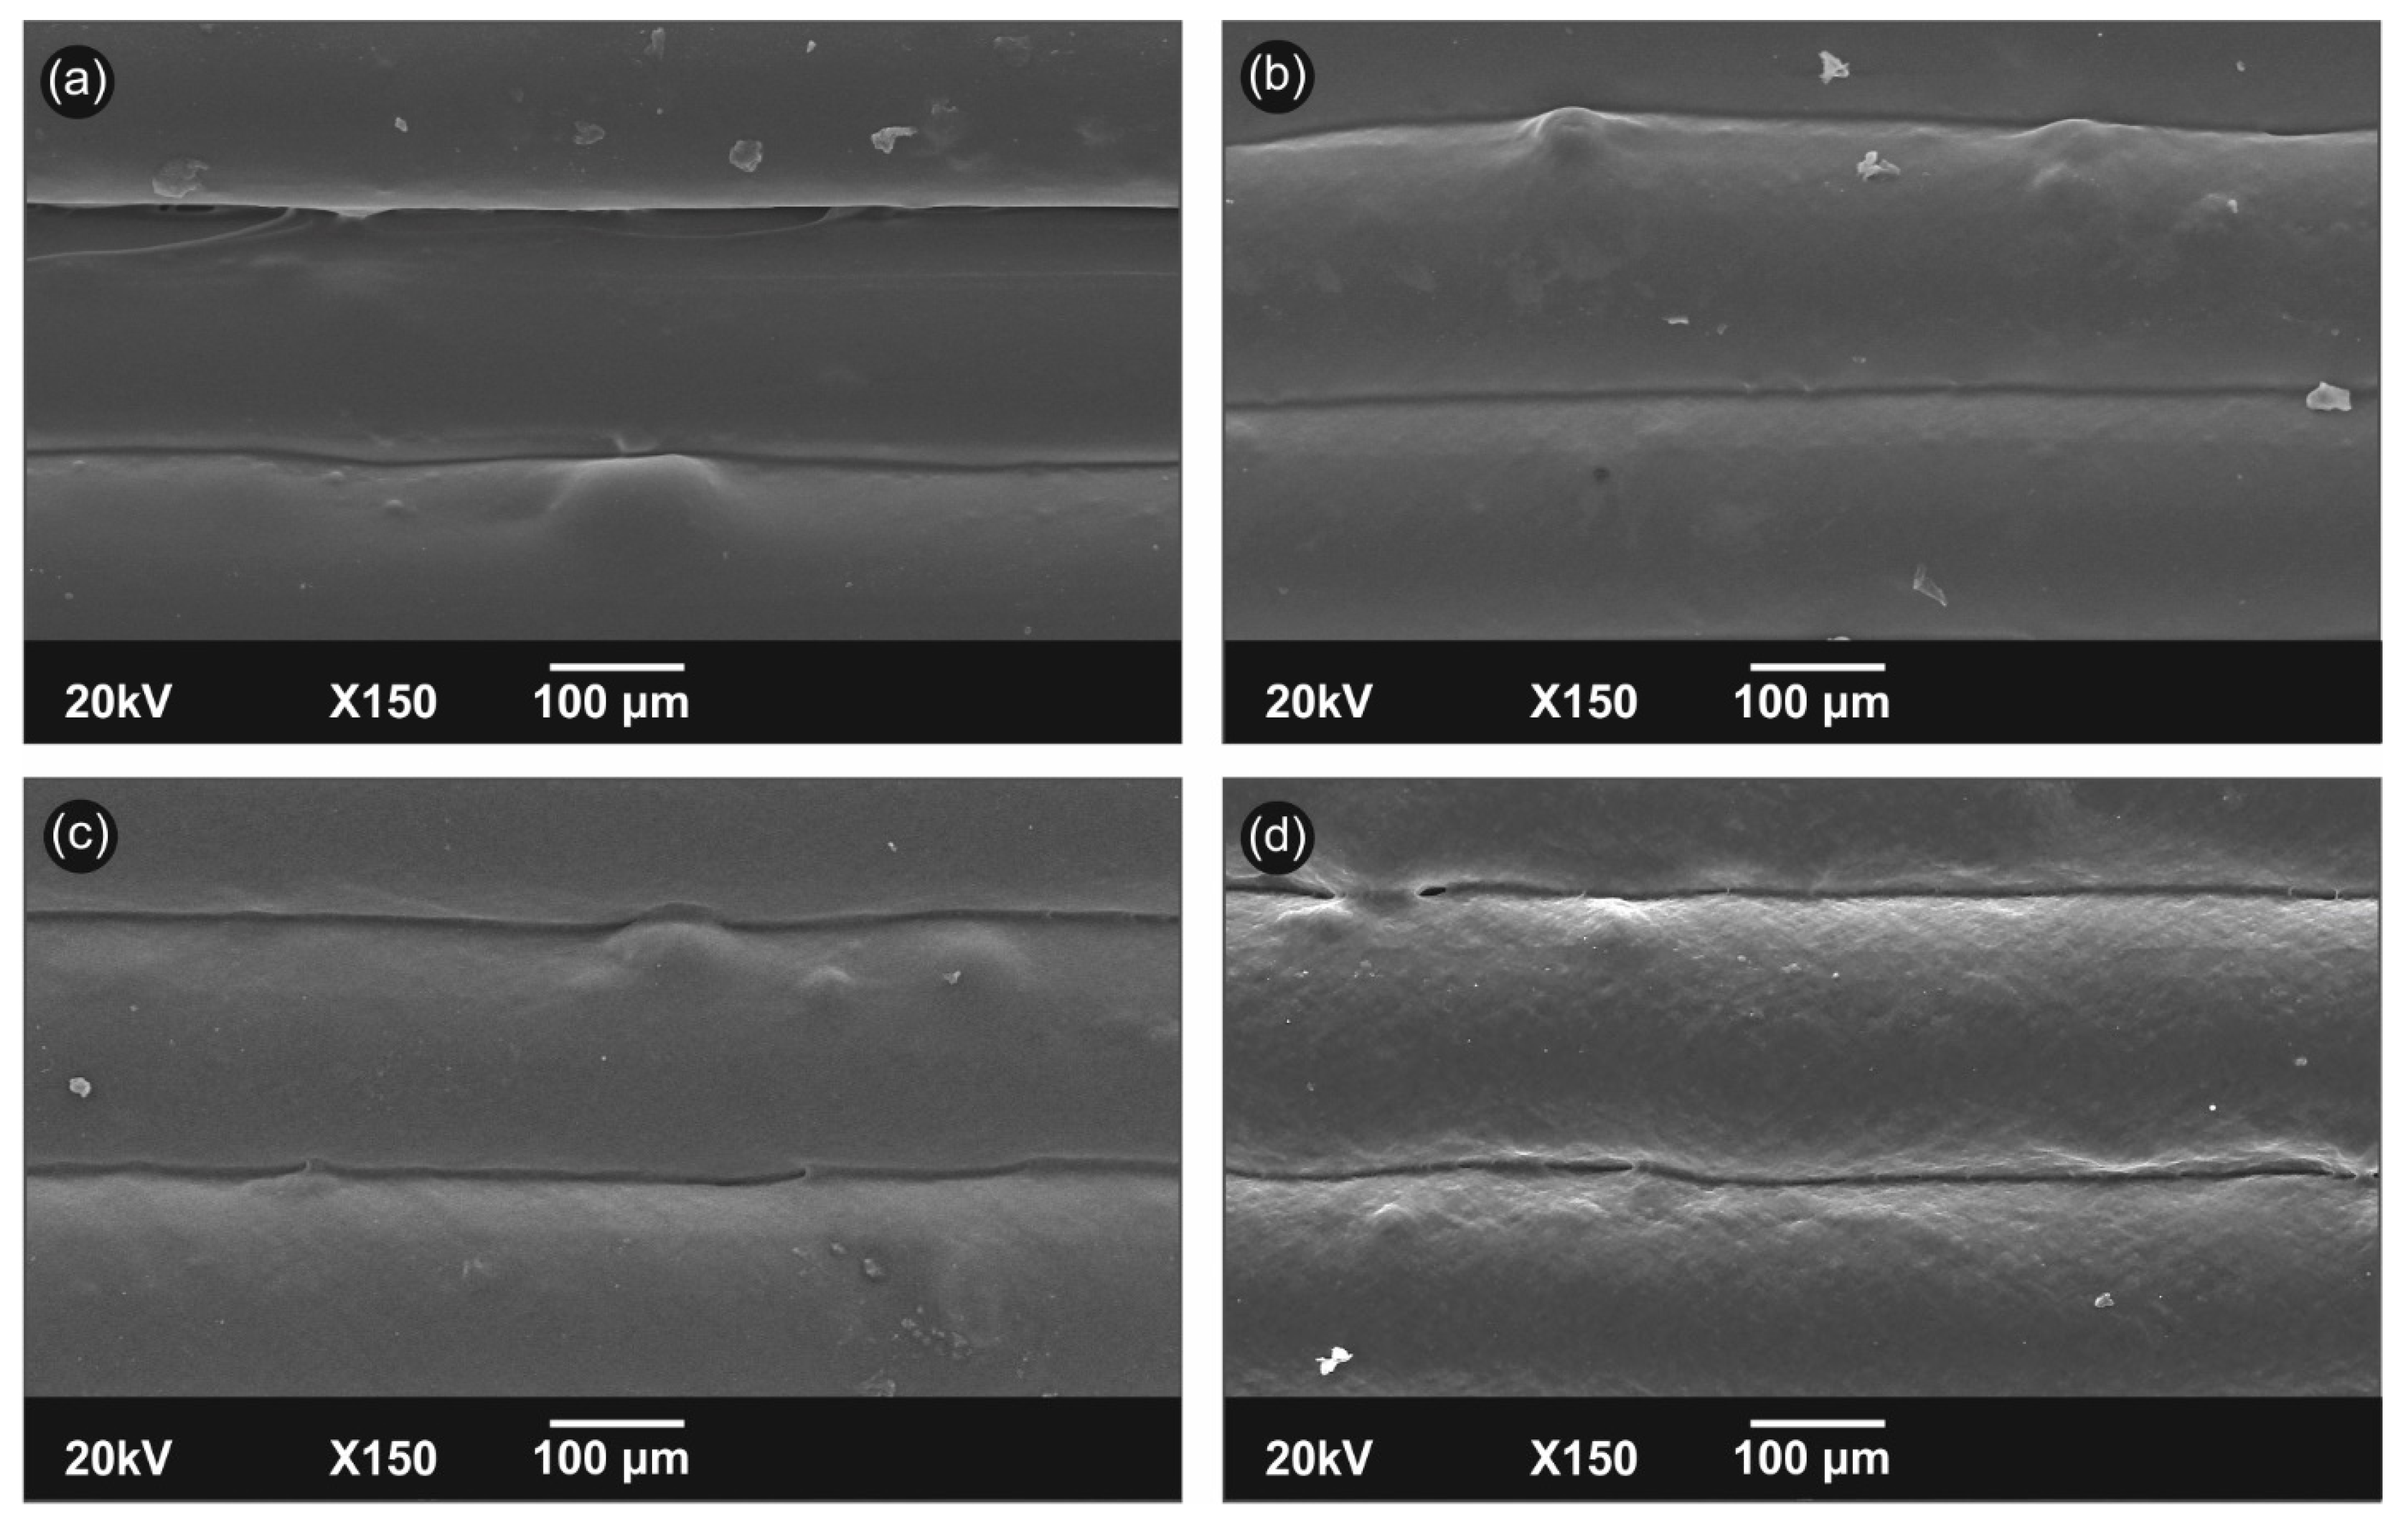
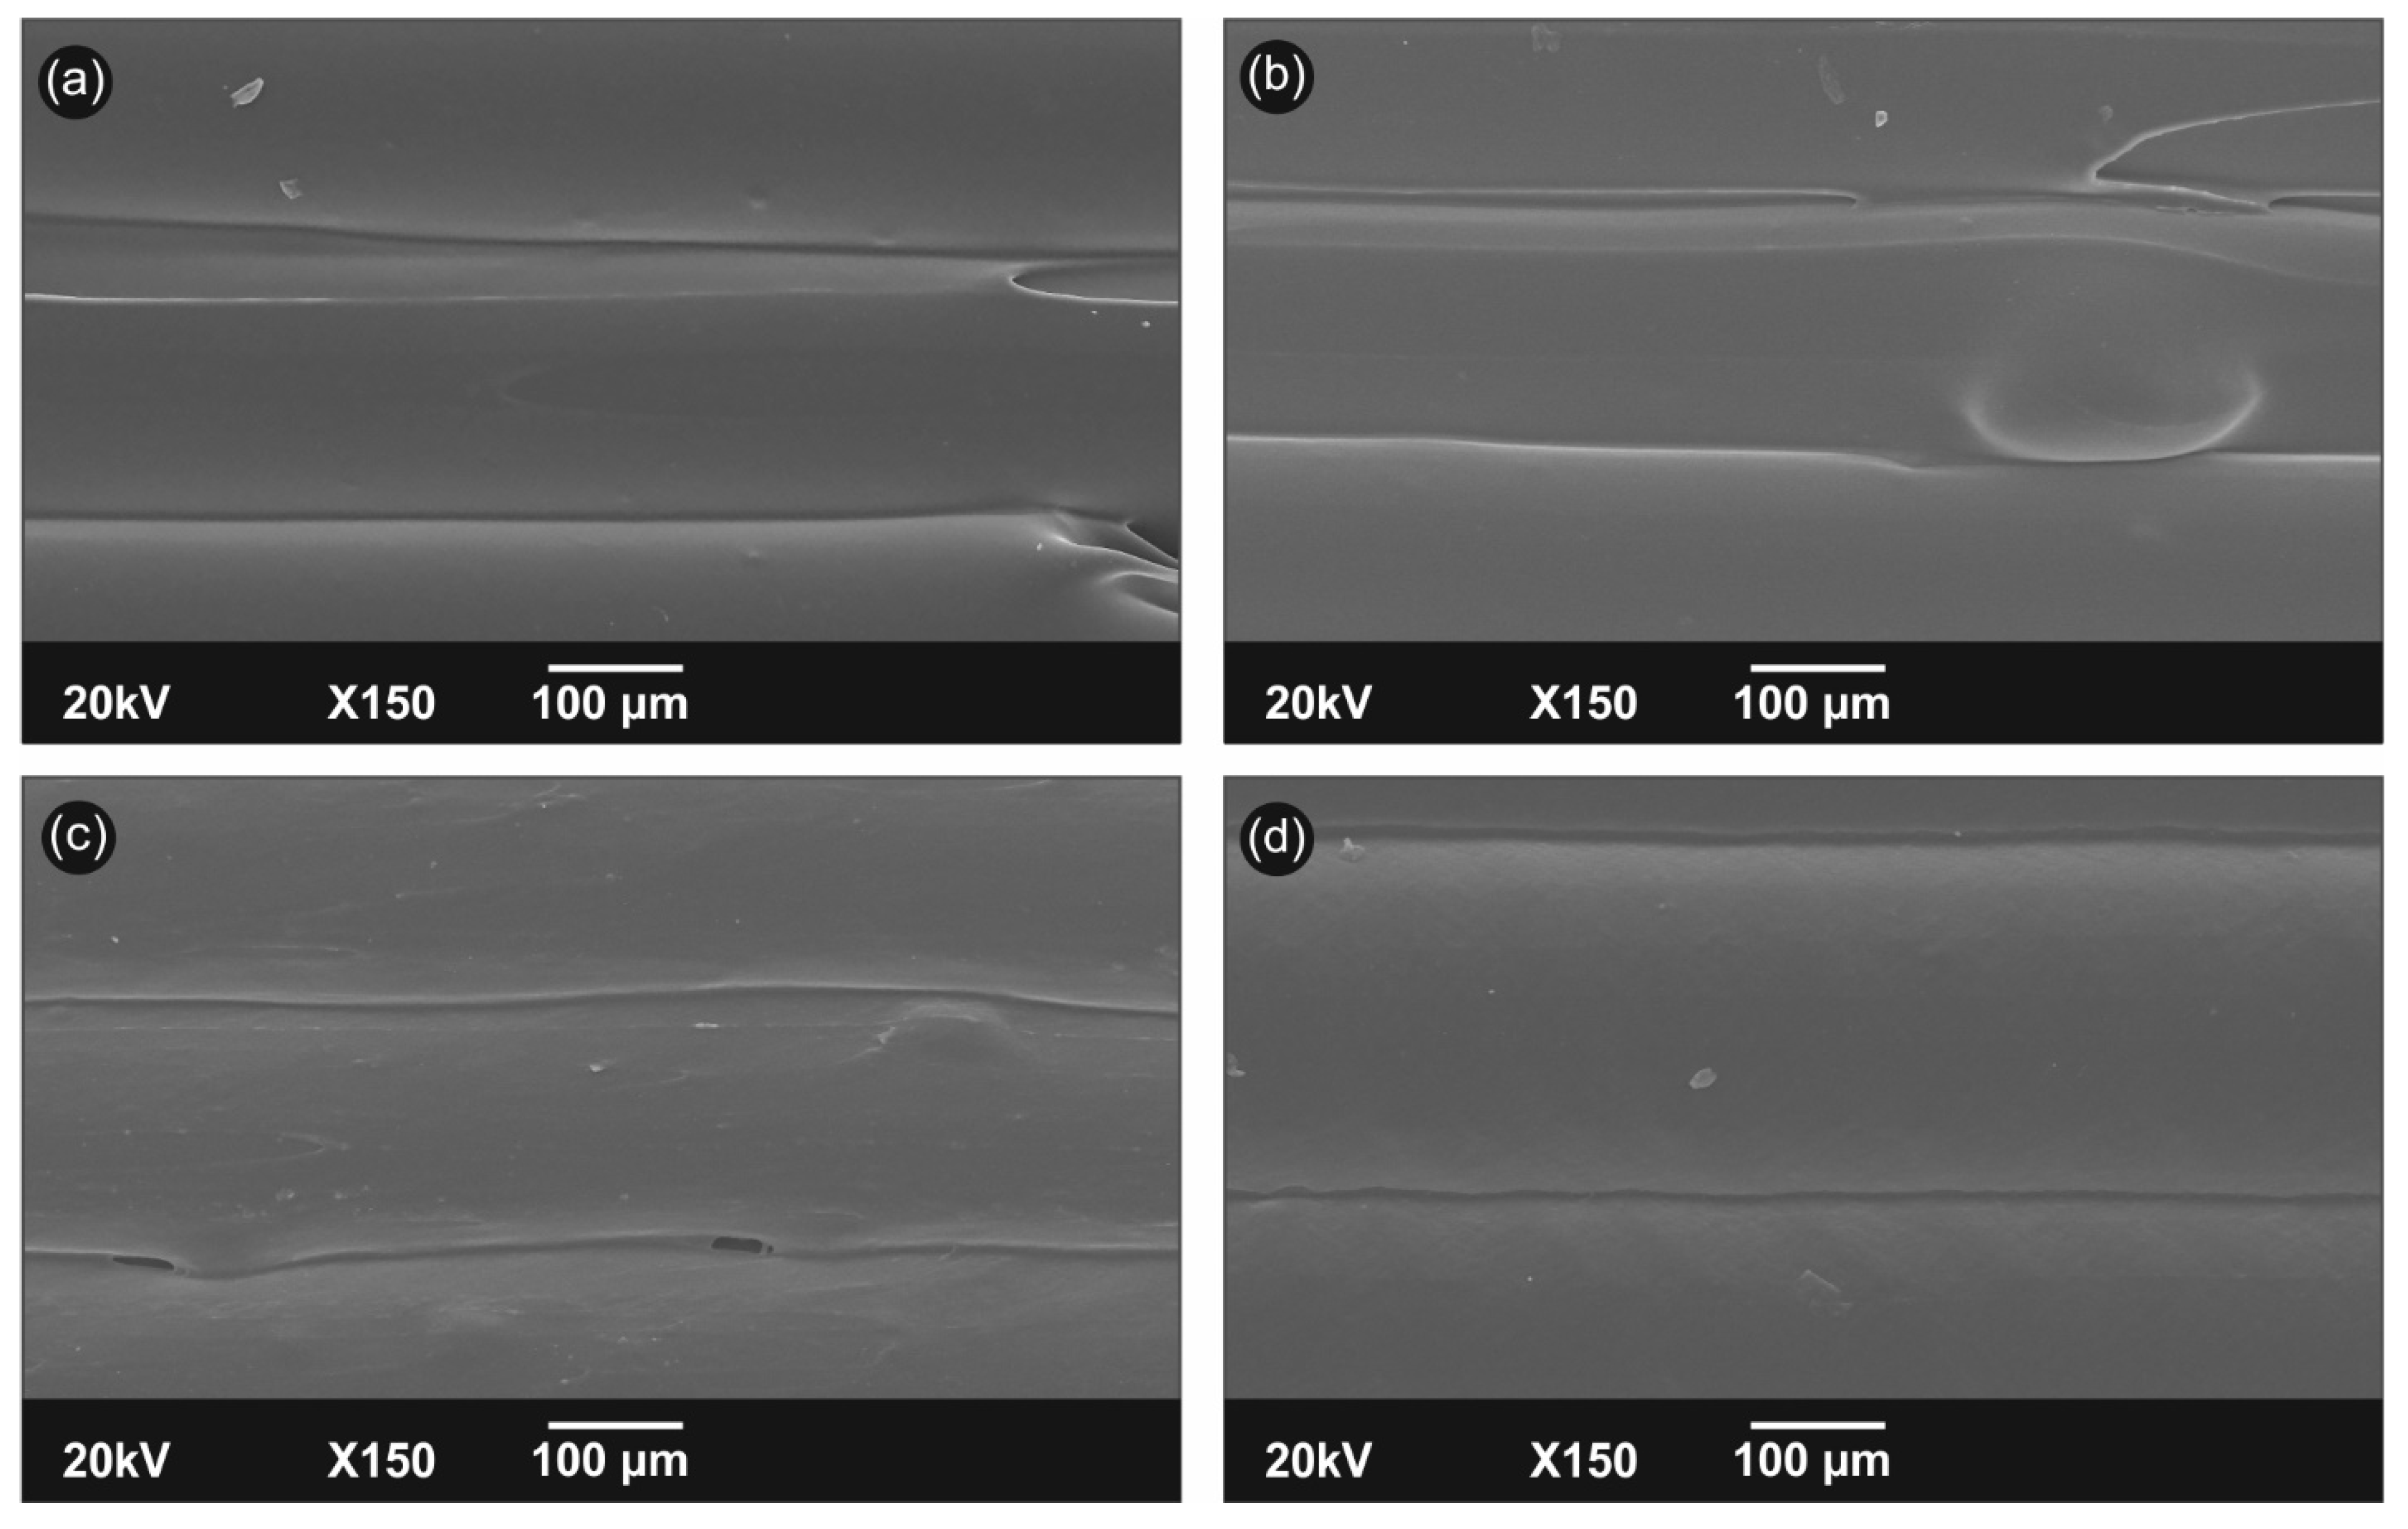
3.2. Scanning Electron Microscopy Microstructure Analysis of the 3D-Printed Samples Layer Fusion

The 3D-printed specimens’ internal/external structure and interlayer fusion has been characterized via scanning electron microscopy (SEM) of the 3D-printed samples’ side surface morphology and microstructure. Figure 5 shows the side surface morphology of PA12/CNT 3D-printed nanocomposites without filler (Figure 5a), as well as 2.5 (Figure 5b), 5.0 (Figure 5c), and 10.0 wt.% (Figure 5d), respectively. On the other hand, Figure 6 depicts the side surface morphology of PA12/CB 3D-printed nanocomposites: no filler—neat PA12 (Figure 6a), 2.5 (Figure 6b), 5.0 (Figure 6c), and 10.0 wt.% (Figure 6d), respectively. In all cases, an excellent interlayer fusion can be observed between the additively manufactured layers, which most likely could result in high interfacial shear strength of the layers and the filaments of the bulk parts. Moreover, this could result in high mechanical performance 3D-printed nanocomposite parts with potential enhancement and reinforcement of their mechanical properties due to the introduced nanofillers. Finally, the high quality of interlayer fusion indirectly proves (i) the optimum 3D printing parameters found initially and employed in this study to manufacture all the specimens, as well as (ii) plausibly homogeneously dispersed CNT and CB nanofillers in the PA12 produced filaments; filler aggregation in the utilized filament as feedstock could significantly affect the printing quality by introducing inhomogeneities, defects, discontinuities, etc. The above structural defects are introduced in 3D-printed samples since the existence of microaggregates can cause nozzle clogging and affect the polymer melt rheological properties and the final 3D-printed object quality.

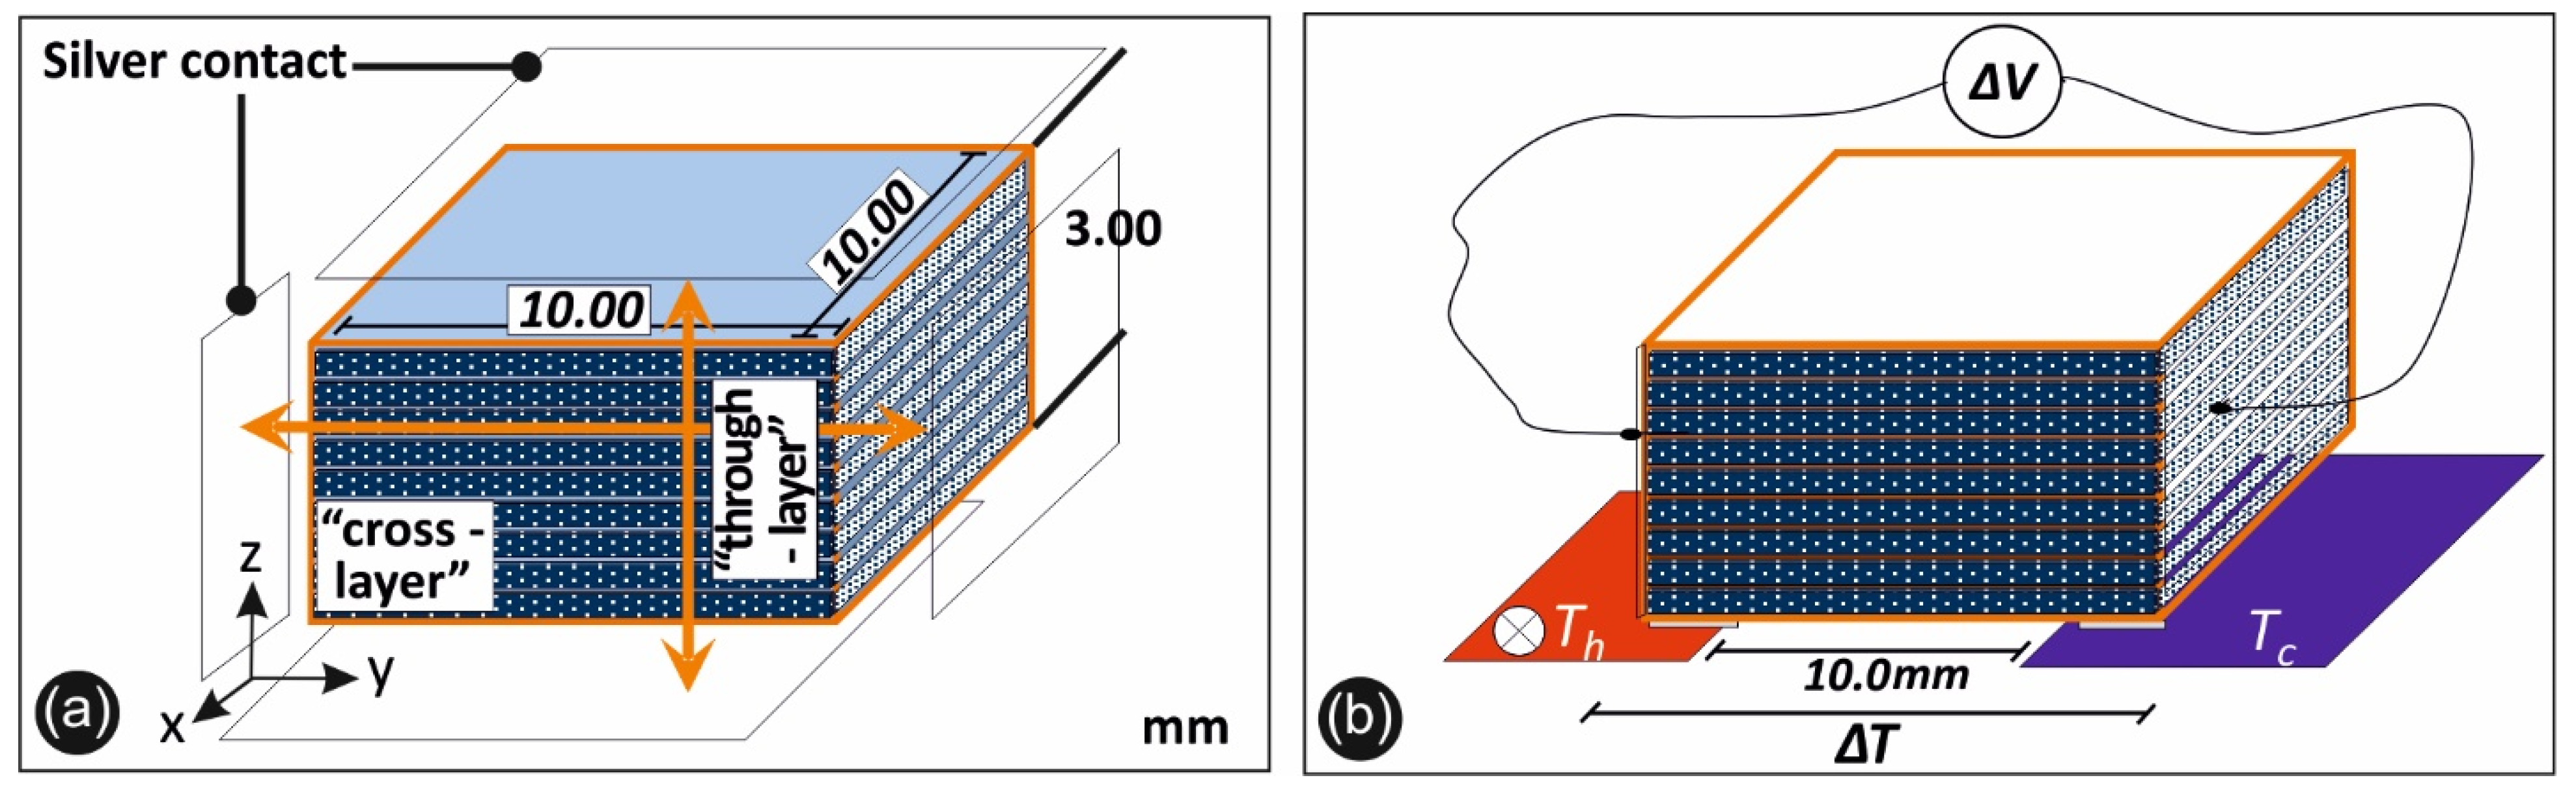
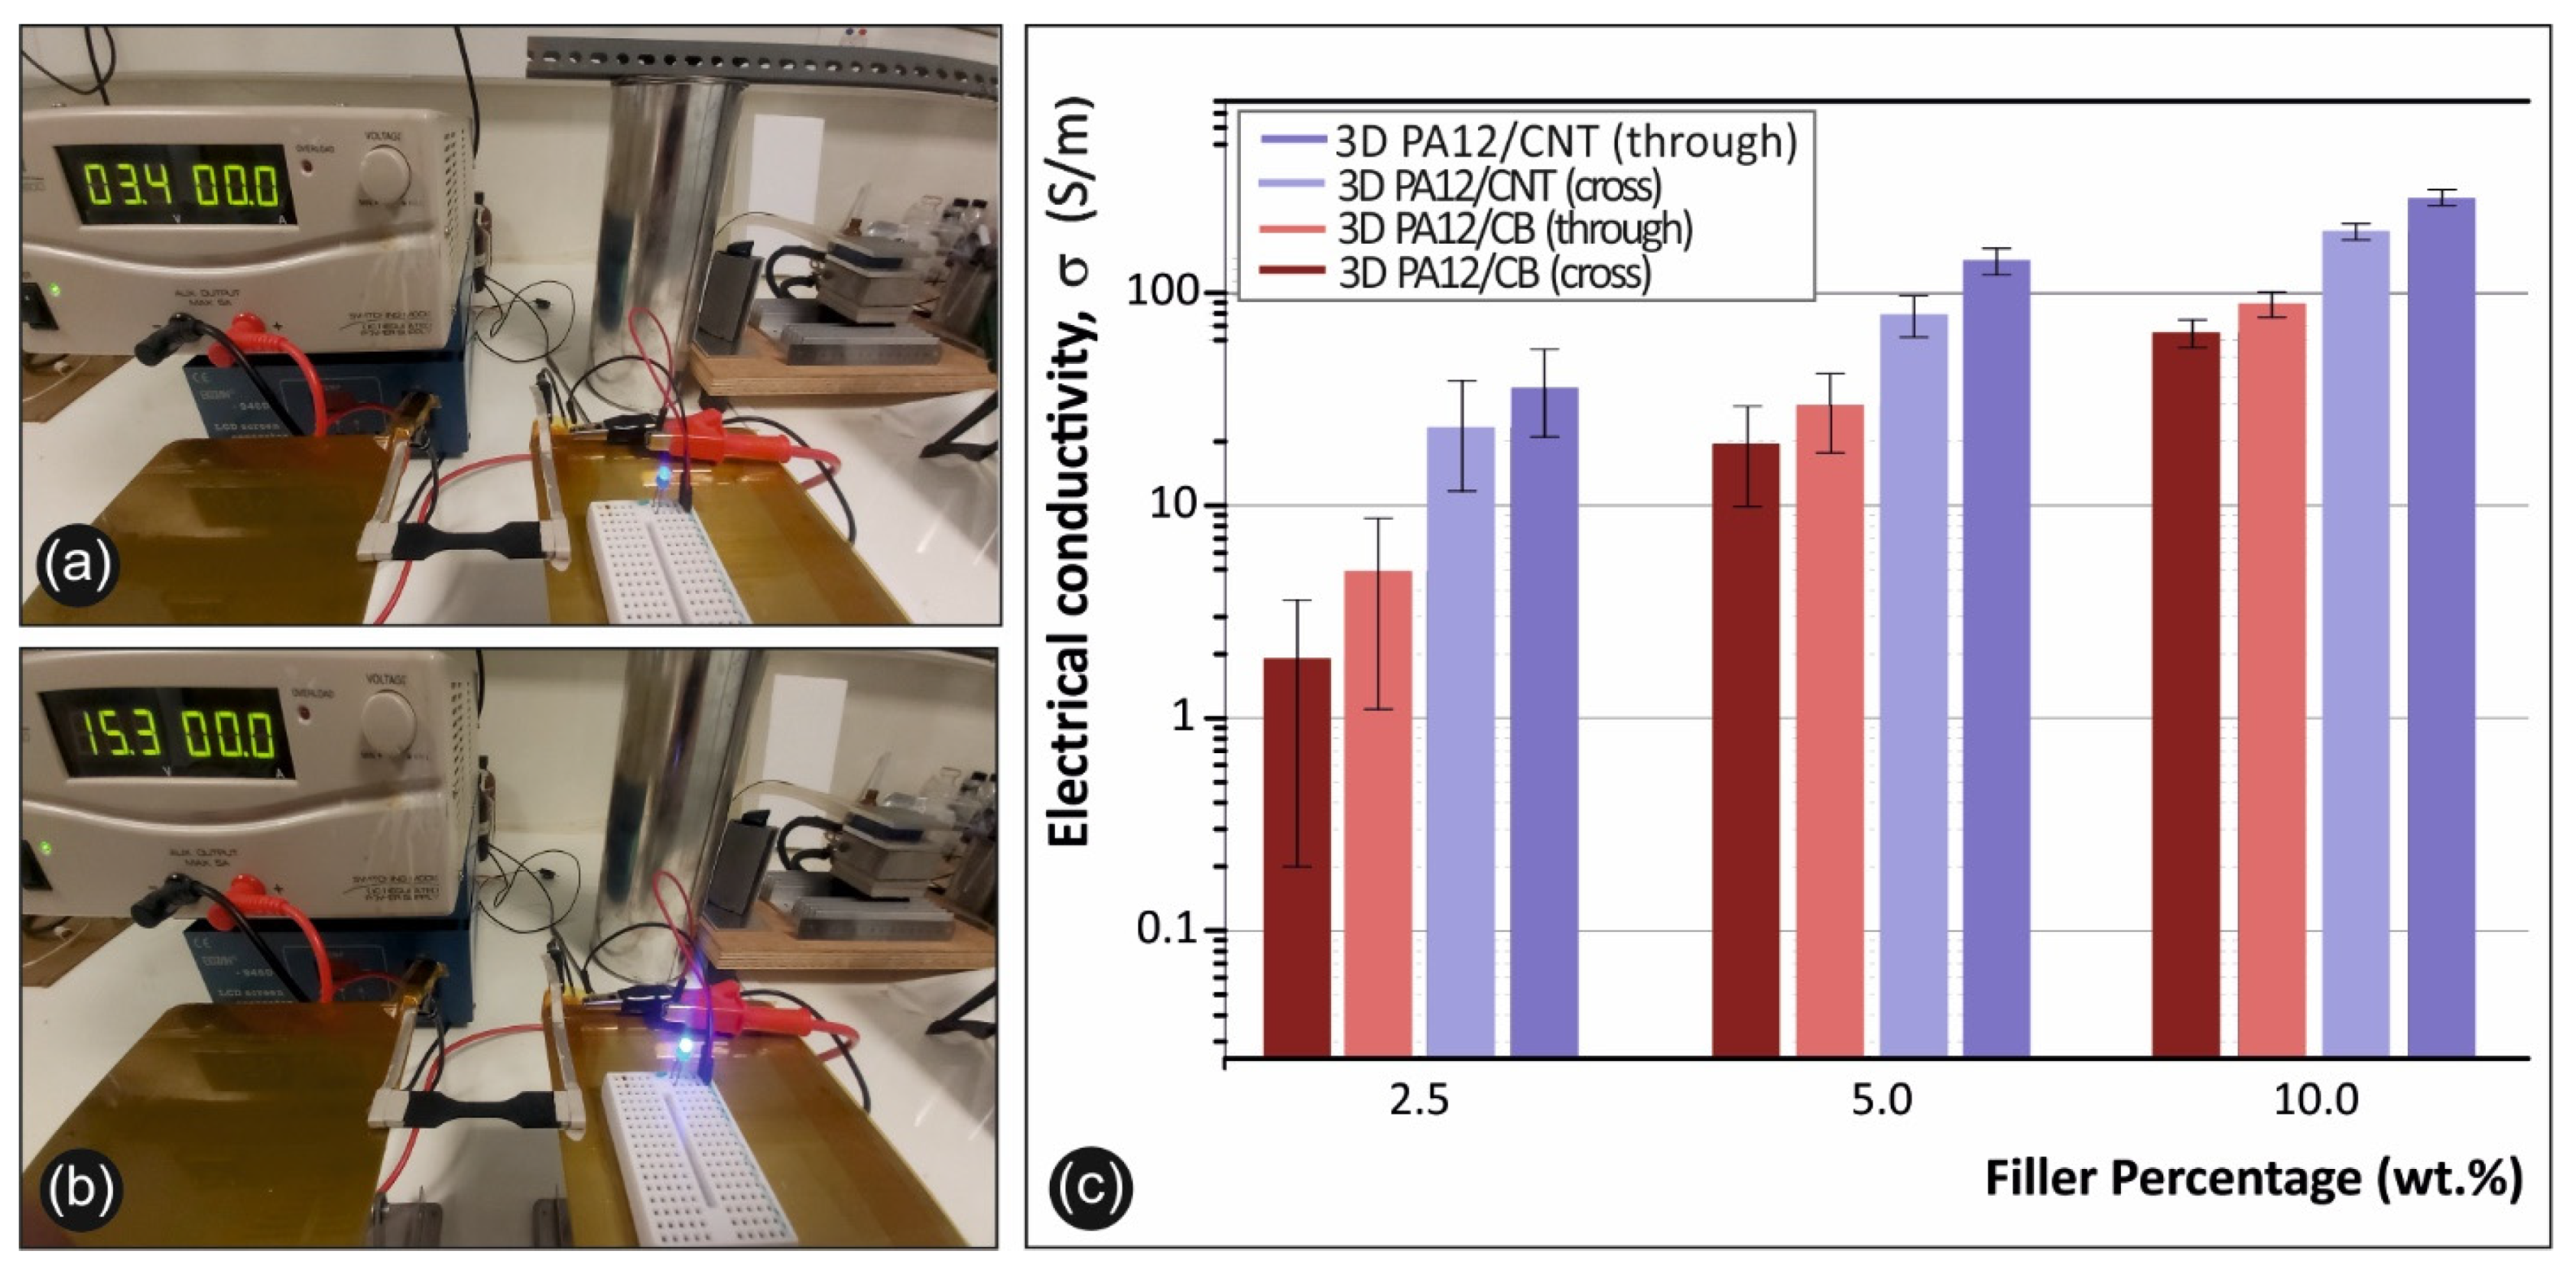
3.3. Electrical Conductivity and Thermoelectric Properties of PA12/CNT and PA12/CB Nanocomposites

The electrical conductivity of PA12/CNT and PA12/CB nanocomposites was measured in two different directions with respect to the 3D printing direction. This was performed to elucidate any plausible anisotropic electrical conductivity behavior due to the FFF 3D printing manufacturing technology process. Figure 3a,b illustrates schematically the approach employed in carrying out the electrical conductivity and the Seebeck coefficient (thermoelectric) measurements for the 3D-printed CPC specimens, while more experimental details could be found in the experimental Section 2.3.
Figure 7c shows the electrical conductivity of the 3D-printed PA12 conductive nano-composites at 2.5, 5.0, and 10.0 wt.% MWCNT and CB contents, respectively, at two different measurement directions, namely, the “through layer,” i.e., thorough thickness, as well as the “cross layer,” i.e., the in-plane of the 3D-printed object. It can be observed that for all 3D-printed PA12 CPCs at different CNT and CB conductive filler contents, the cross-layer conductivity values were a bit higher than the through-layer ones. In other words, this reveals an “anisotropic” behavior of the nanocomposites’ electrical properties induced by the FFF process. This has been also previously reported in another study related to FFF 3D-printed CPCs [29]. Specifically, the most plausible explanation behind this finding is that the 3D printing process endows some measure of CNT orientation in the 3D printing AM direction, thus resulting in a slightly higher “bulk” electrical conductivity in the cross-layer direction. The highest conductivities were determined for the 10.0 wt.% PA12 CPC nanocomposites, namely, 278.2 ± 19.5 S/m for the PA12/MWCNT and 89.5 ± 12.1 S/m for the PA12/CB, both at the cross-layer direction. An interesting finding to point out is that the scattering of the conductivity values, represented by the corresponding standard deviation error bars in Figure 7c, becomes less significant for the 5.0 and 10.0 wt.% nanocomposites since the samples are reaching well above their electrical percolation threshold. Moreover, the higher conductivity values of the PA12/CNT nanocomposites at all filler loadings may be attributed to the fact that CNTs are 1D nanomaterials with a great tendency to create interconnected networks in a polymer matrix in which charge carriers can move through the CNT-CNT extensive junctions via a plausible “hoping” or “tunneling” mechanism [47]. Figure 7a,b represents the operation of an LED device when current is passing through a 5.0 wt.% filled PA12/MWCNT nanocomposite in a closed circuit, upon applying two different magnitudes of voltage bias (Vbias), namely, 3.4 (Figure 7a) and 15.3 V (Figure 7b). This is a representative demonstration of the multifunctional 3D-printed PA12 conductive nanocomposites manufactured herein, which could enable practical future applications such as flexible circuitry, flexible wires, etc. expanding further the well-known and emerging field of 3D-printed electronics. Specifically, higher Vbias results in higher current flowing through the LED. This causes a more radiative transition to take place, and hence, more photons will result, ultimately increasing the optical output power and hence the luminosity of the LED.
The experimentally measured Seebeck coefficient for the PA12/CNT nanocomposites at the different filler loadings was quite identical (S = 8.9 ± 1.1 µV/K). These values are in good agreement with previously reported values of the Seebeck coefficient for TPU/CNT thermoelectric nanocomposites [2]. The PA12/CB nanocomposites also exhibited similar Seebeck values for the different filler’s content. However, values were lower, compared to the CNT nanocomposites and about 4.5 ± 1.2 µV/K. It is quite reasonable that CNT and CB nanocomposites exhibited similar Seebeck coefficient values at the different filler loadings since the Seebeck coefficient is an inherent property of the semiconductor material (in our case, the CNTs and the CB nanoinclusions, respectively) related to the charge carrier density and charge carrier mobility, as more specifically described by the well-known Mott’s equation from which the Seebeck coefficient could be determined [48].
The highest power factor (PF) value derived from calculations (PF = σ × S2) was found for the 10 wt.% filled PA12/CNT nanocomposite with PF = 2.2 × 10⁻² μW/mK2, considering the nanocomposite’s cross-layer electrical conductivity. This PF value is slightly lower than values previously reported for PEI/SWCNT nanocomposites at 10 vol.% SWCNT content (PF = 3.7 × 10⁻² μW/mK2) prepared by solvent mixing [39]. Relatively, it should be mentioned that to date solvent mixed single-walled carbon nanotubes (SWCNTs) with relatively high filler loadings (>>50 wt.%) in poly(3,4-ethylenedioxythiophene): poly(styrene sulfonate) (PEDOT:PSS) have reached the highest ever reported PF value of 140 μW/mK2 amongst polymer/CNT nanocomposites [49]. However, such materials could not be applied in engineering and high-temperature applications since PEDOT:PSS is not stable above 100°C and is also known to be highly sensitive to humidity [50]. Polycarbonate/MWCNT melt mixed nanocomposites have also been reported to possess PF values of ~8 × 10⁻⁴ μW/mK2 at 2.5 wt.% MWCNT loading [51]. Moreover, when using low-molecular-weight polyethylene glycol (PEG) during melt mixing in polypropylene-based composites with fixed SWCNT (2 wt.%) and copper oxide (5 wt.%), p-type composites convert into n-type with the highest PF value achieved in the range of ~5 × 10⁻³ μW/mK2 [52].

3.4. Mechanical Properties

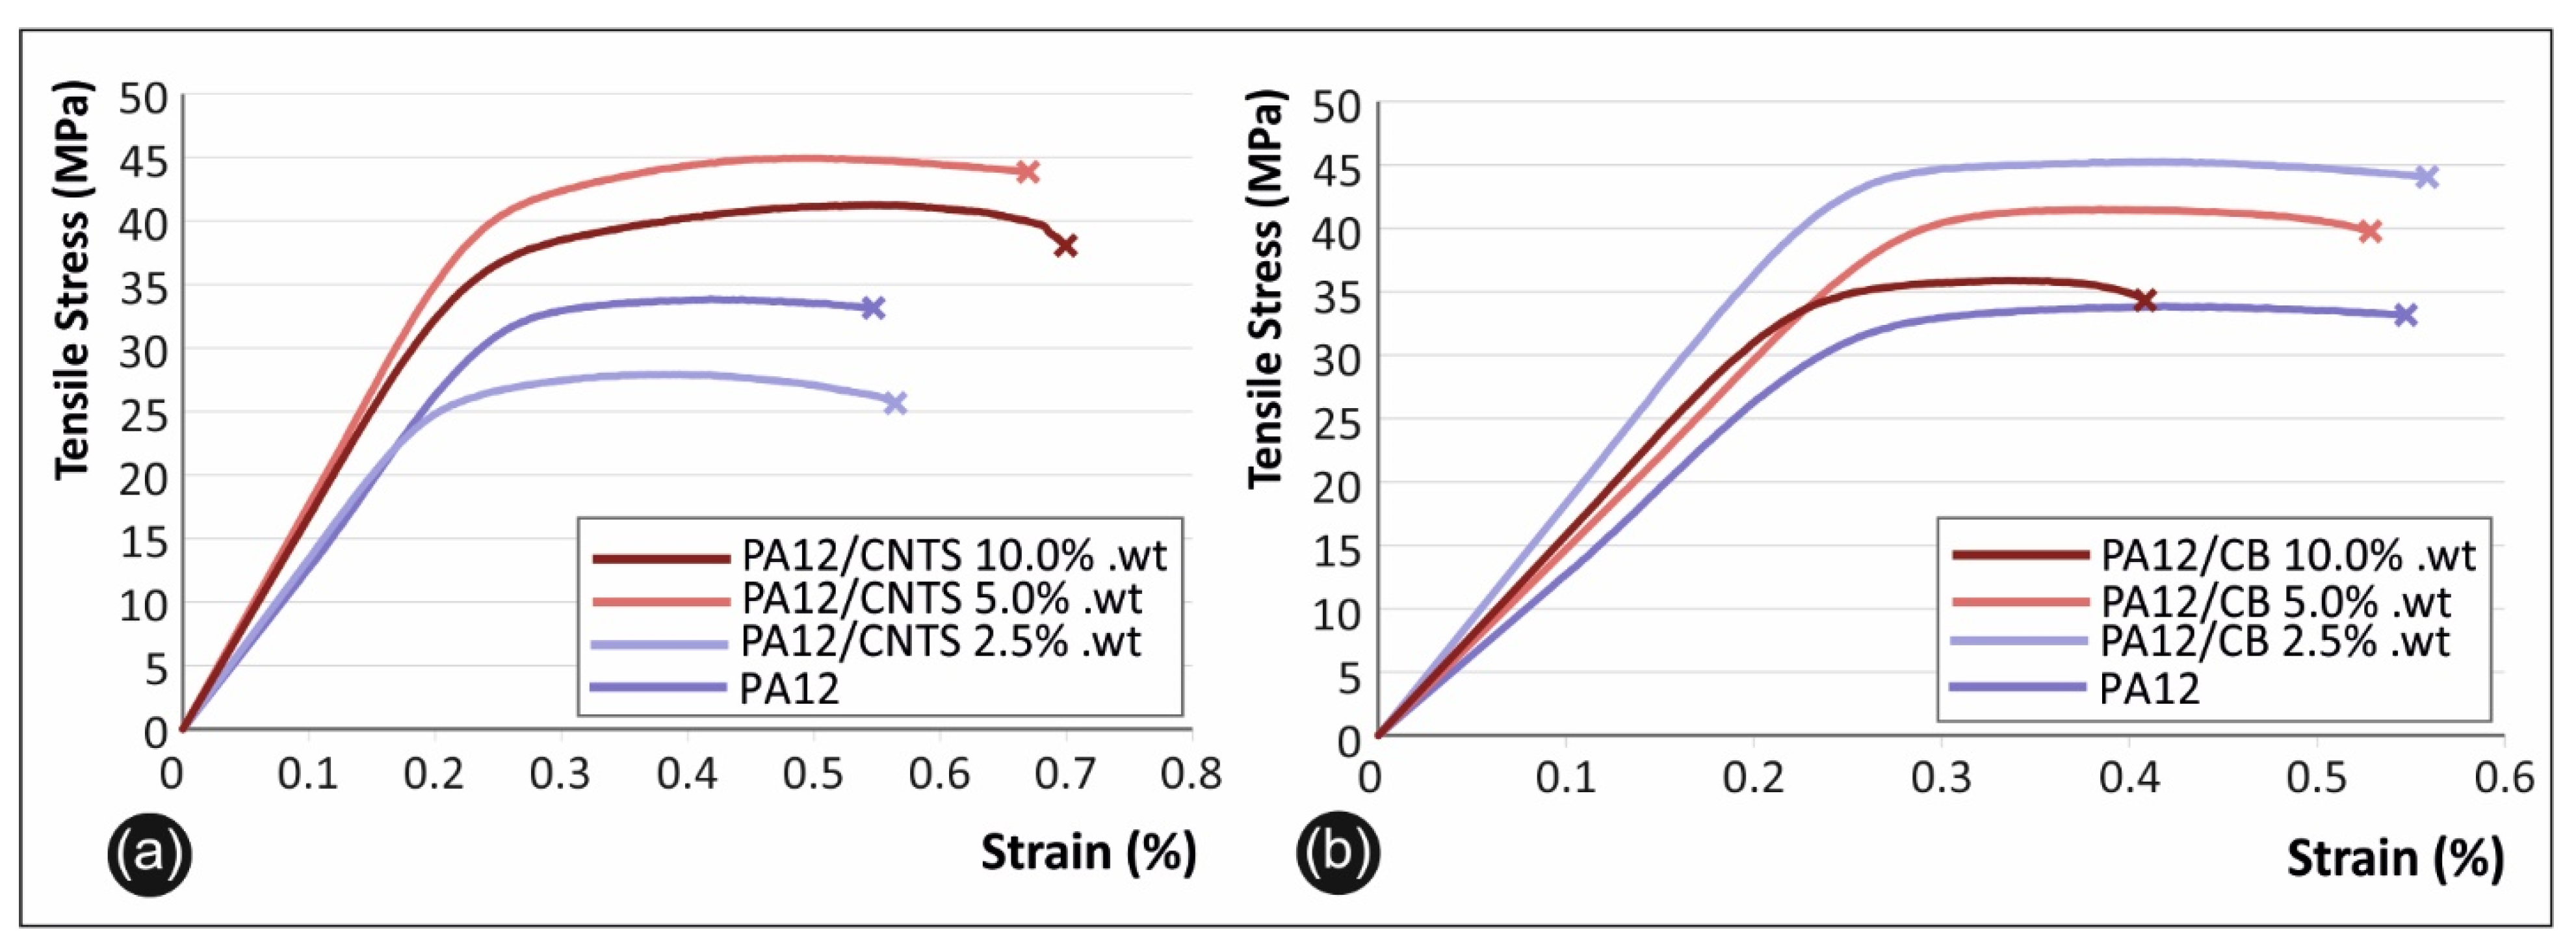
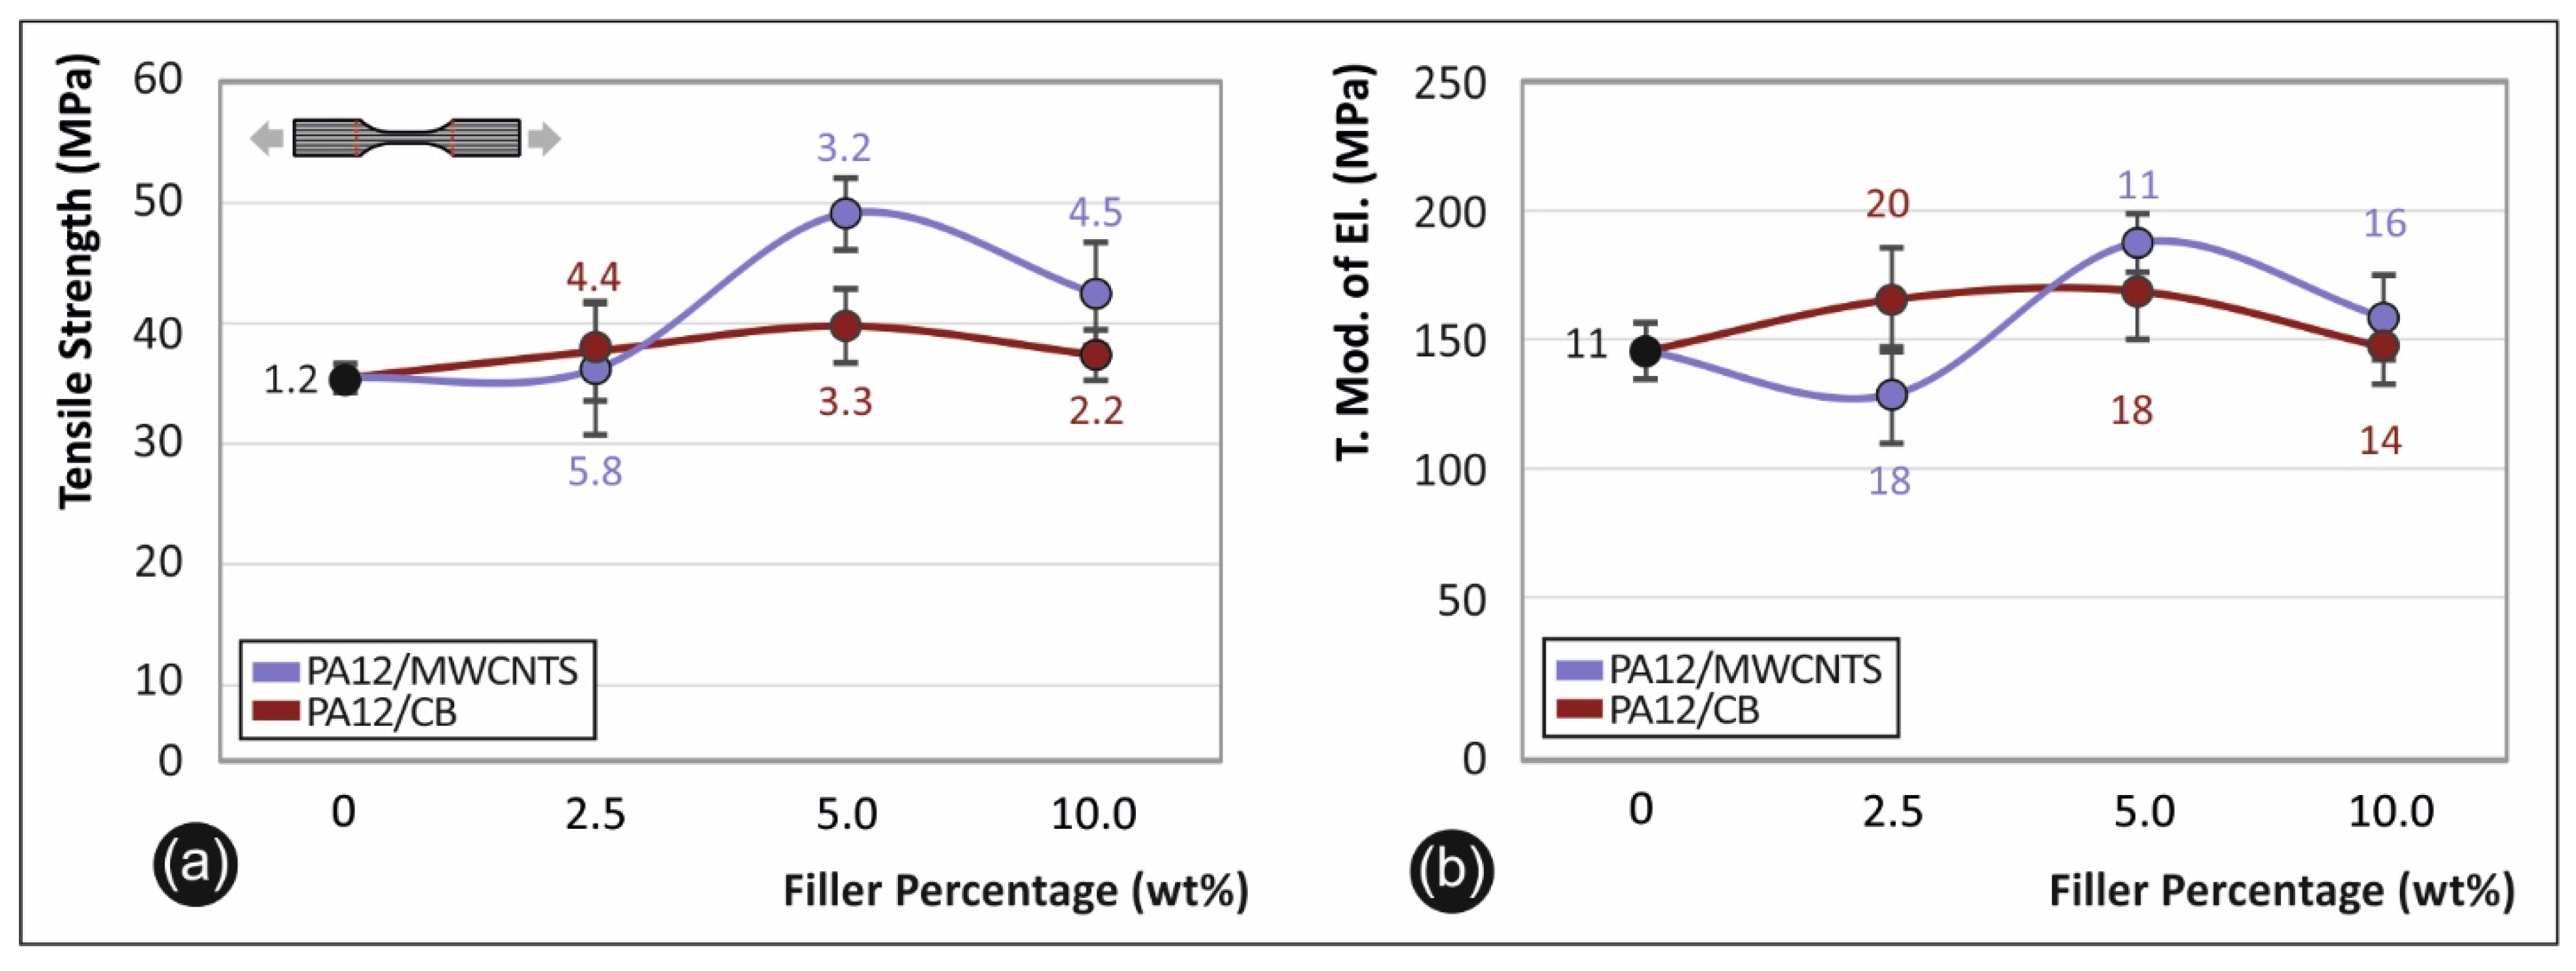
3.4.1. Tensile Test Results and SEM Fractography Microstructural Analysis

In Figure 8, the comparative stress–strain curves for the PA12/CNT (Figure 8a) and PA12/CB (Figure 8b) nanocomposites are shown. More representatively, Figure 9a depicts the comparison of the averaged tensile test values along with the calculated standard deviation for the different filler loadings of the PA12/MWCNT and PA12/CB nanocomposites. Figure 9b shows the tensile modulus of elasticity (average value and standard deviation) as a function of the filler loading for the PA12/MWCNT and PA12/CB nanocomposites, respectively. As it can be observed, the CNTs display a more prominent reinforcement mechanism with the strength and modulus remaining stable at the 2.5 wt.% filer loading (modulus slightly decreases compared to neat PA12), while showing a remarkable increase for both 5.0 and 10.0 wt.% loadings with the 5.0 wt.% being the optimum in terms of tensile properties mechanical reinforcement (approx. 33% increase of strength and 25% of modulus). On the other hand, the CB showed a marginal increase in both the tensile strength and modulus at the different filler loading (approx. max. 10% increase for the tensile strength at 5.0 wt.% and 10% increase for the modulus at 2.5 wt.% filler loadings). It is worth mentioning that for all filler loadings, a knock-down effect was not observed, indicating a high quality of interlayer fusion, i.e., no dramatic increase in interlayer voids due to filler agglomerates, etc. However, CNTs show promising results for tensile properties reinforcement, especially at 5.0 wt.% filler loading.

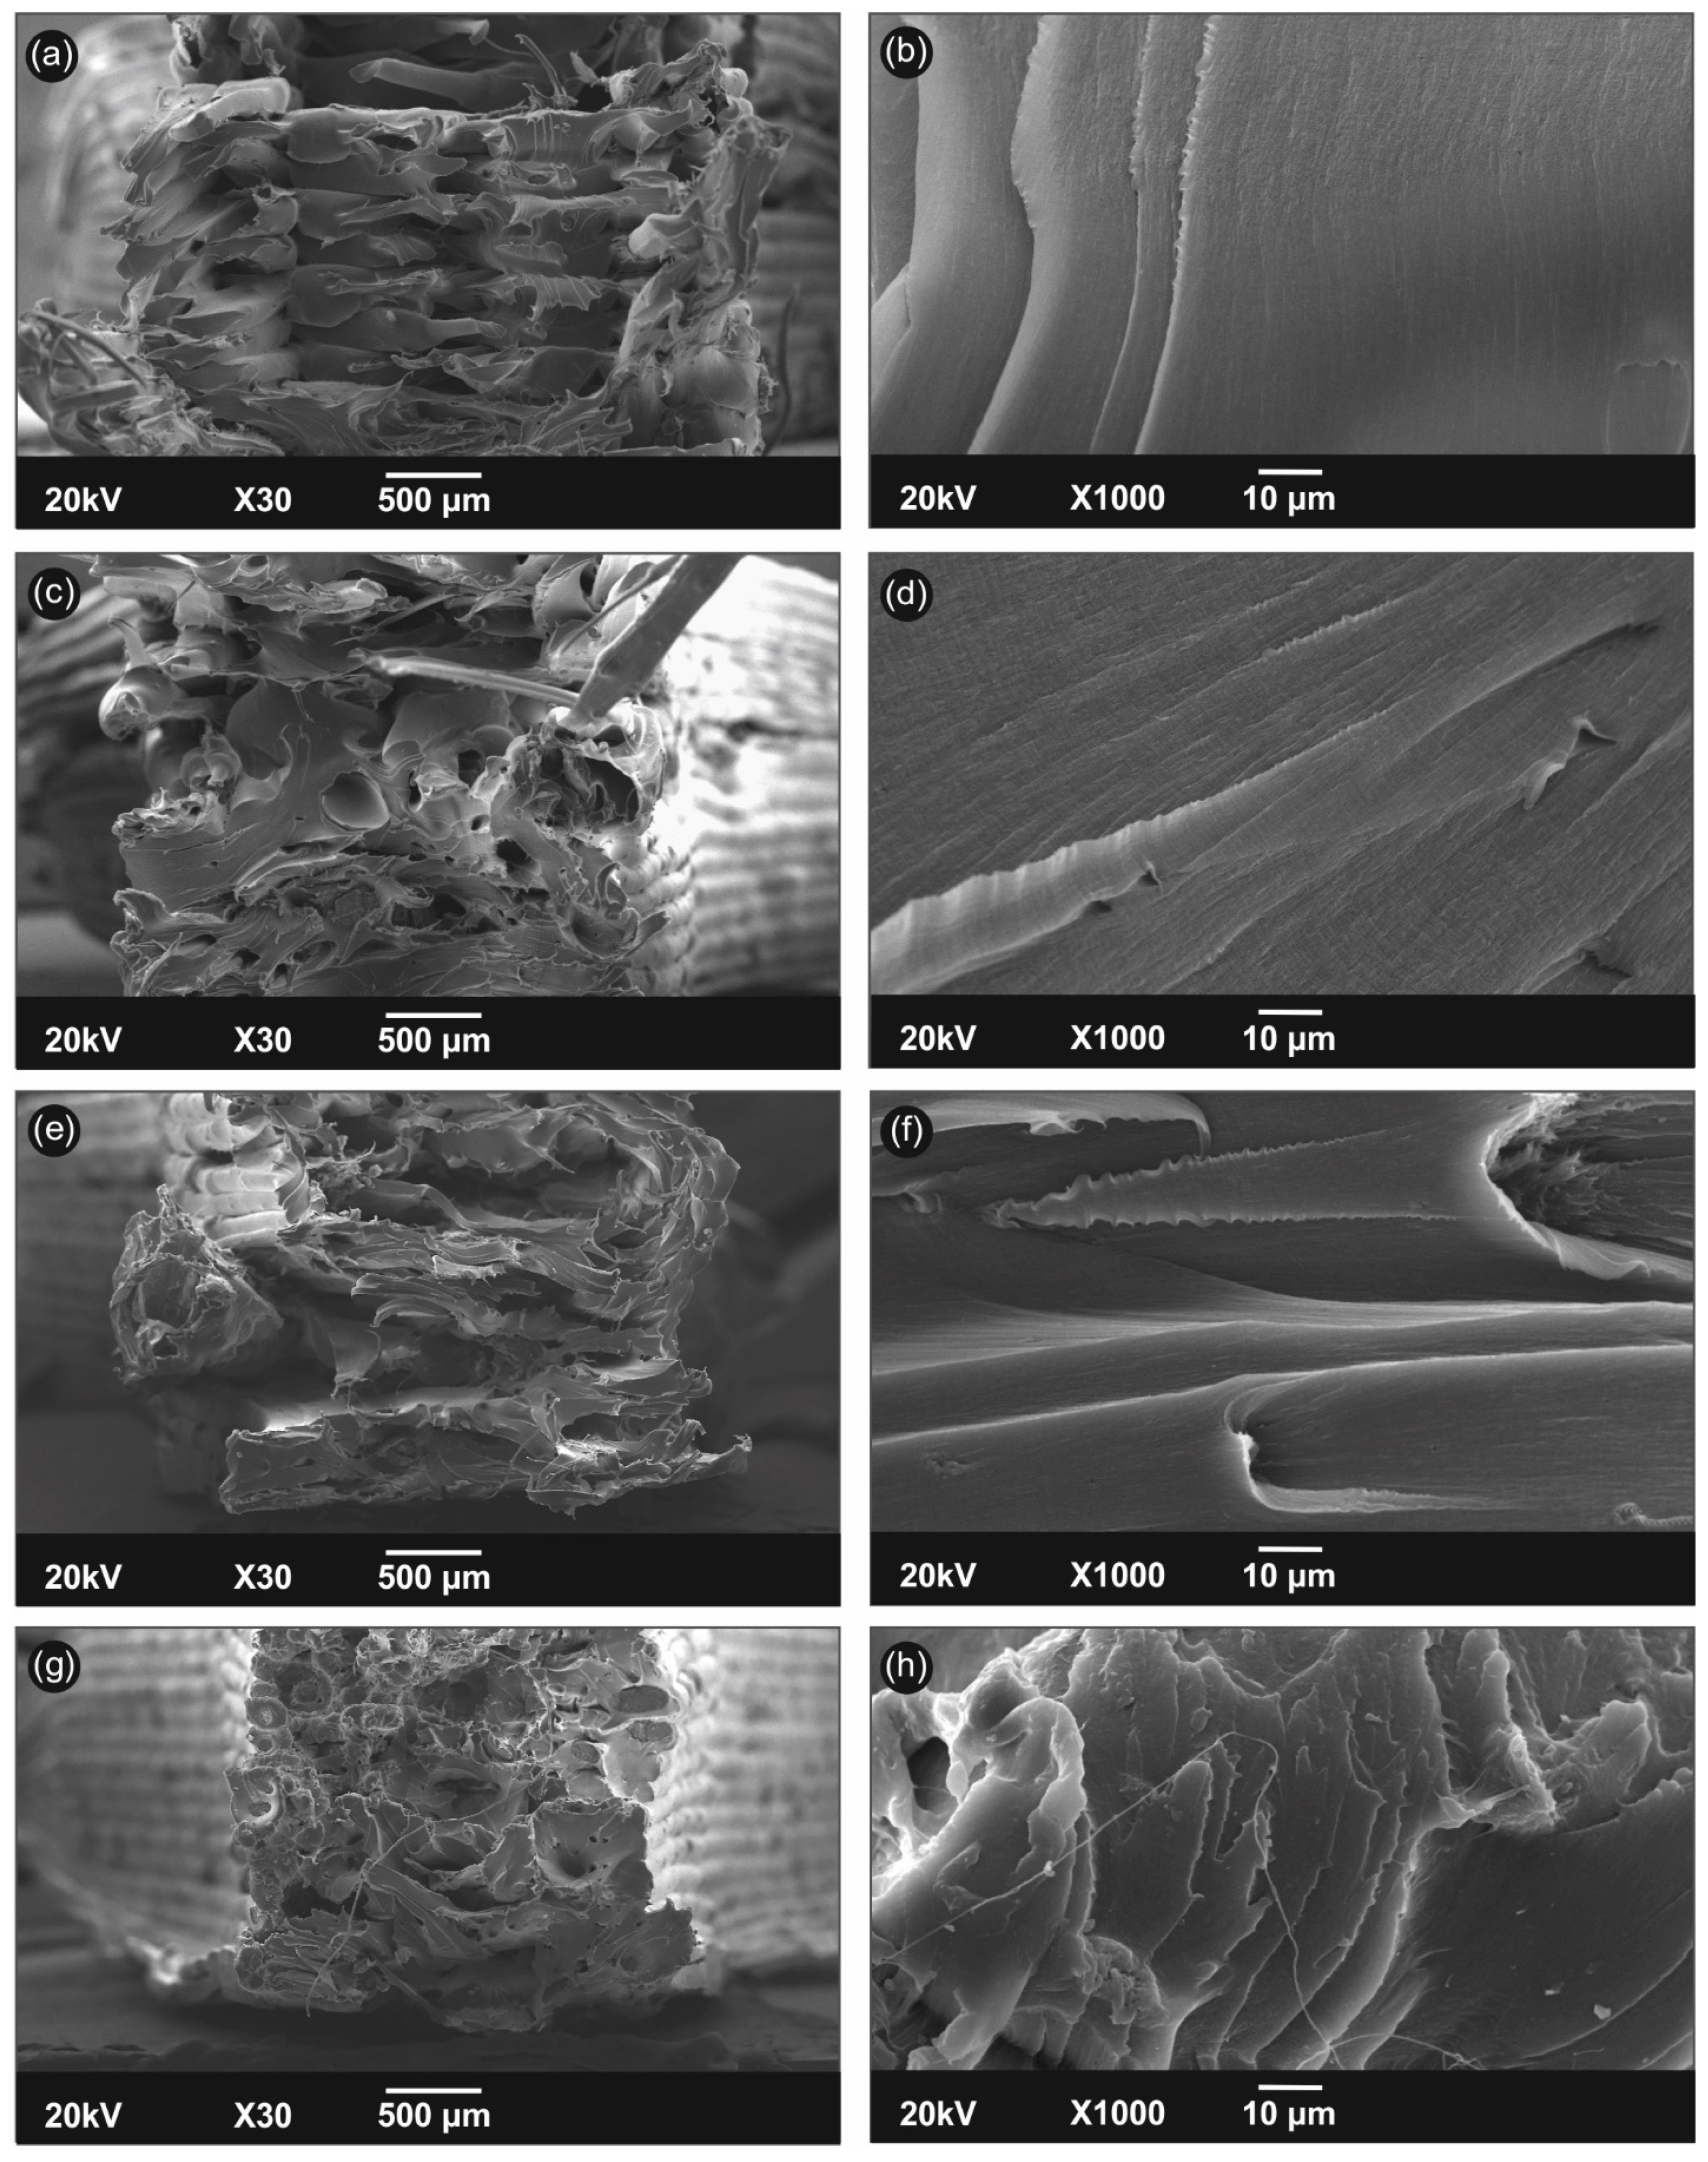
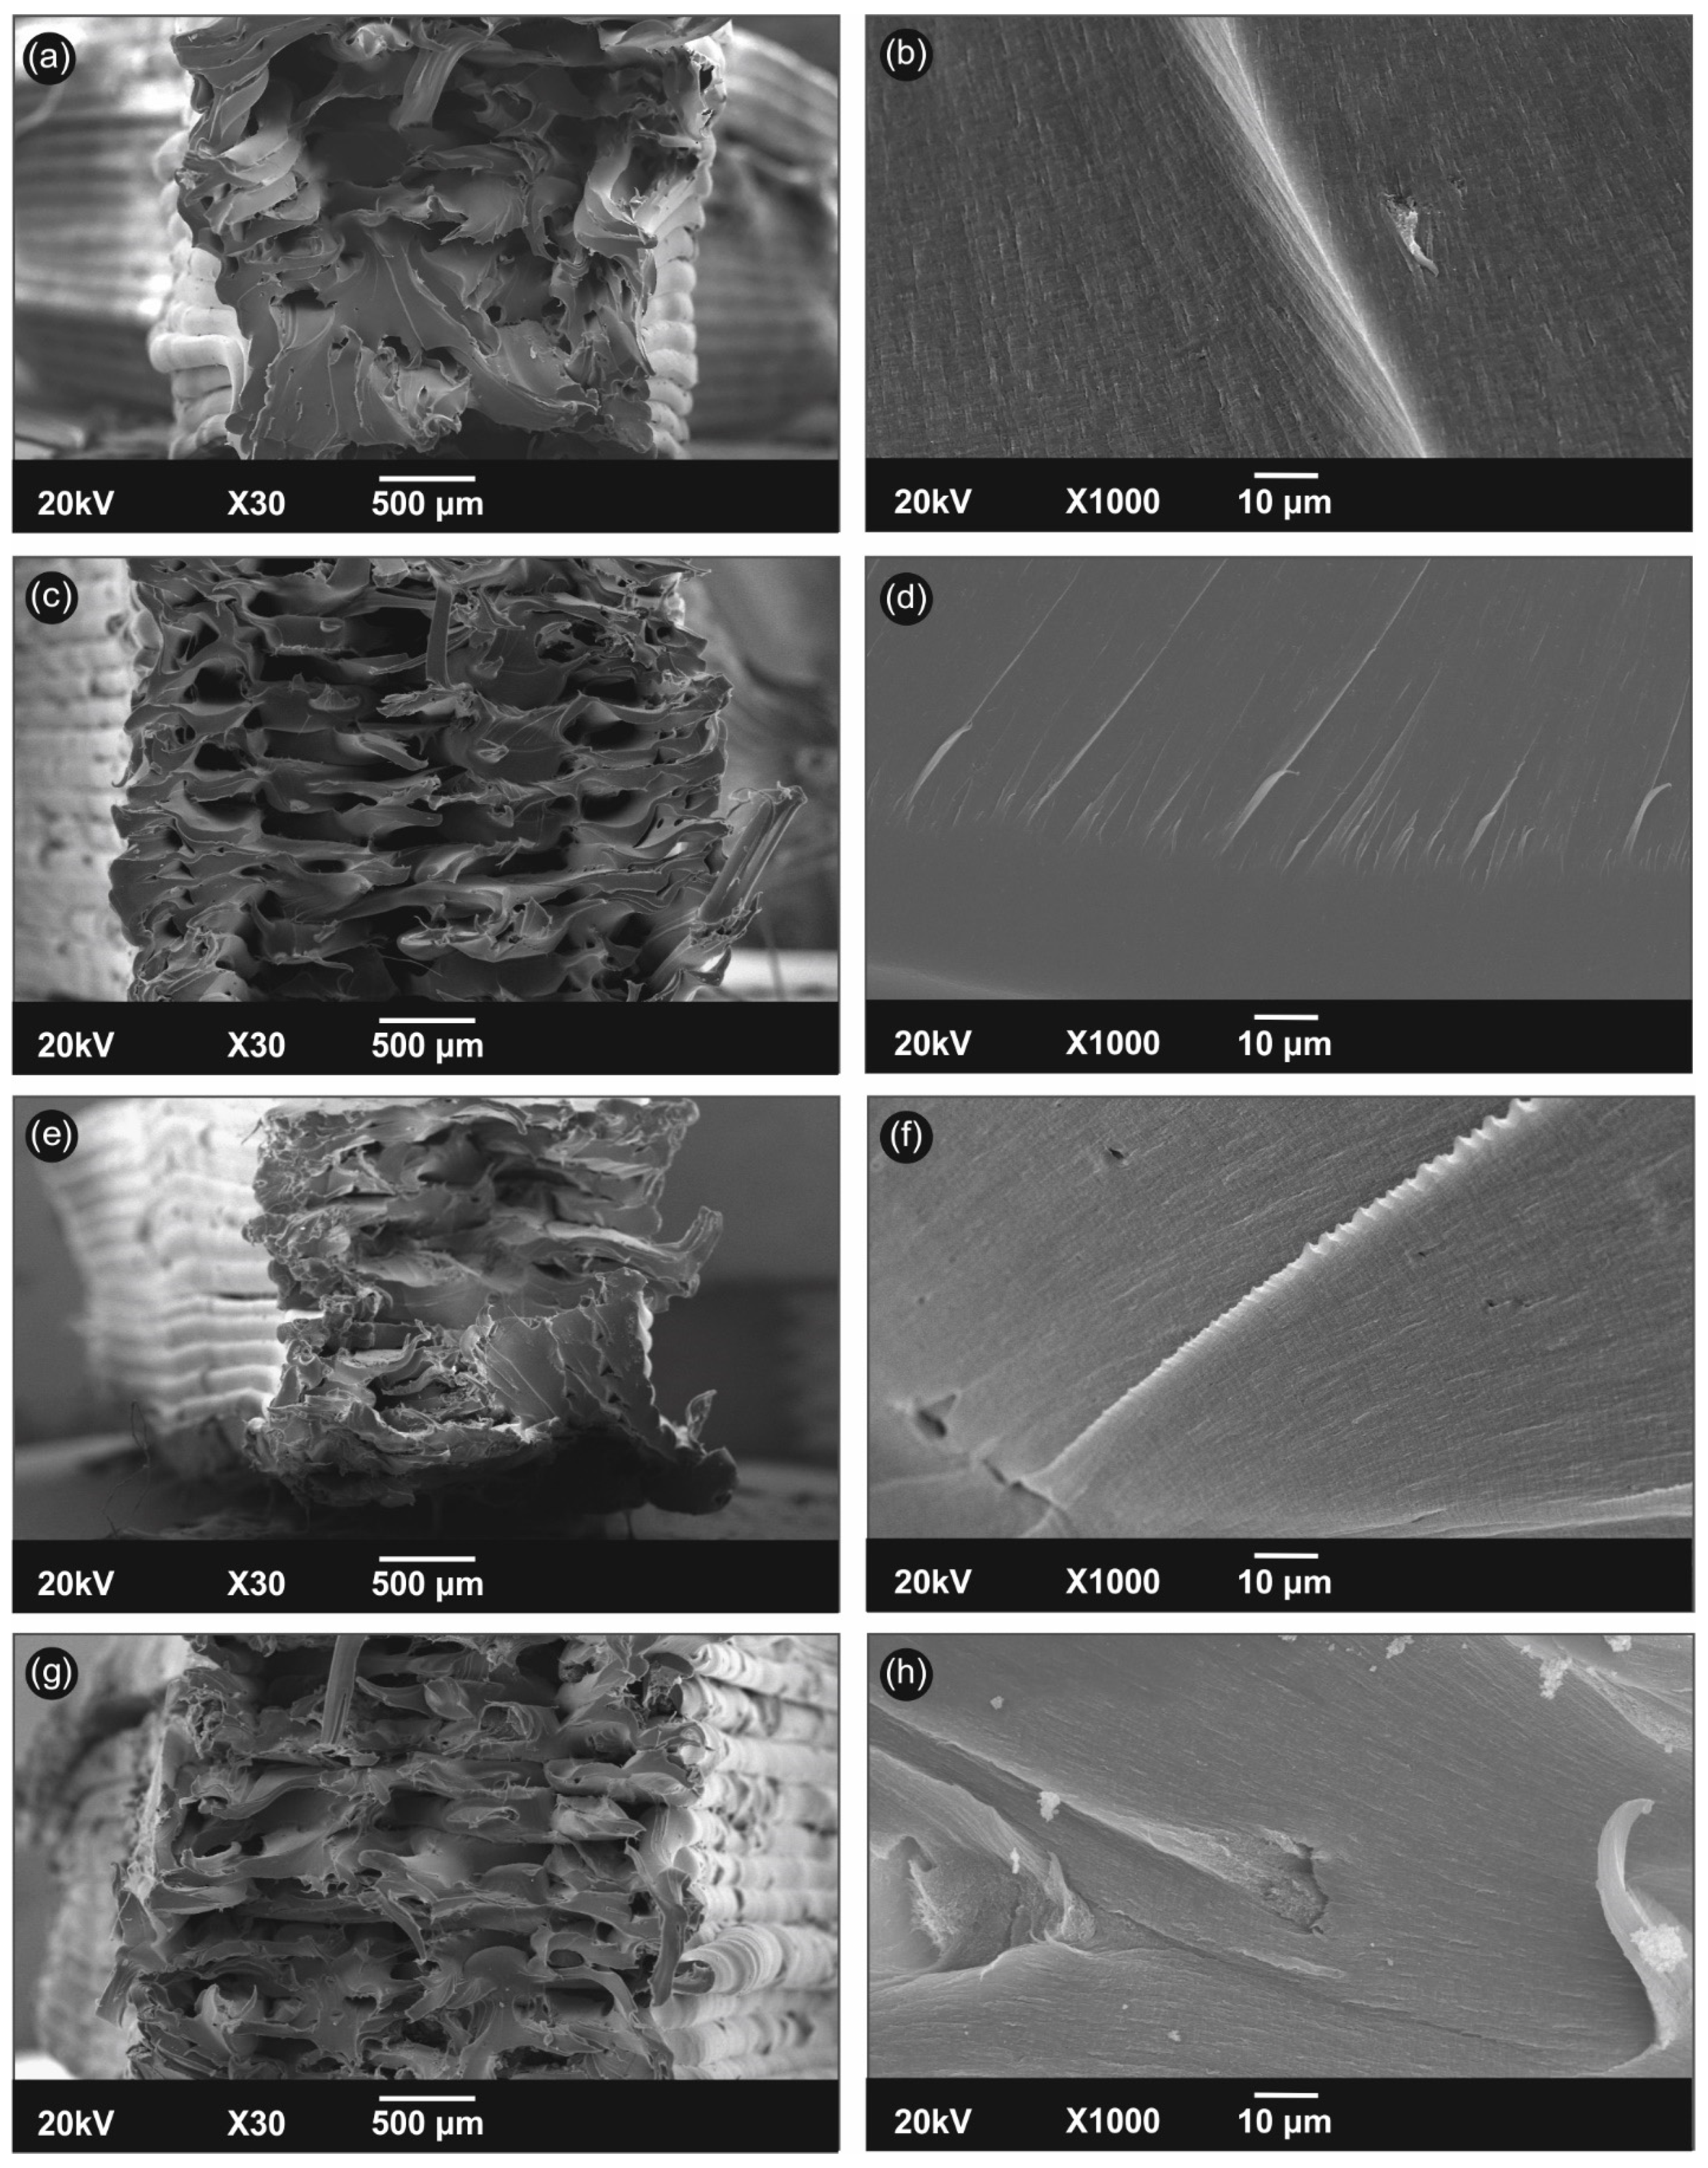
3.4.2. SEM Fractography Microstructural Analysis

Results of microstructural investigations of FFF 3D-printed neat PA12 and PA12 nanocomposites fractured surfaces after the tensile test experiments are shown in Figure 10 (PA12/CNT) and Figure 11 (PA12/CB), respectively.
More specifically, neat PA12 (Figure 10a,b), compared to 2.5 wt.% (Figure 10c,d), 5.0 wt.% (Figure 10e,f), and 10.0 wt.% (Figure 10g,h) CNT filler loadings, are depicted at two different magnifications. The low magnification images show relatively similar characteristics, i.e., quite rough surfaces with filaments pulled out from the fractured surface, indicating, in general, a relatively “ductile” fracture mechanism in all cases. On the other hand, the high magnification images very interestingly reveal much higher roughness of the fractured surfaces for the samples with higher CNT filler loading. This is related to a more pronounced ductile fracturing due to much more energy being elastically stored by the samples at high CNT filler loading, which is released by the fracture and results in much more rough surfaces. This is in good agreement with trends observed in the tensile modulus of elasticity and tensile strength results experimentally measured and analyzed in the previous section.
Neat PA12 (Figure 11a,b), compared to 2.5 wt.% (Figure 11c,d), 5.0 wt.% (Figure 11e,f), and 10.0 wt.% (Figure 11g,h) CB filler fractured surfaces, are also shown at two different magnifications. Similar to the previous fractographic features observed at low magnification, quite rough surfaces with filaments pulled out from the fractured surface could be detected in all cases, indicating a “ductile” fracture mechanism. However, in the high magnification images the fractured surfaces show quite similar characteristics for the neat PA12 and the PA12/CB nanocomposites, just marginally increased roughness and observed fractured planes for the CB nanocomposites. This is an opposite behavior, compared to the PA12/CNT nanocomposites, and corroborates the tensile modulus and tensile strength results experimentally measured for the PA12/CB nanocomposites.

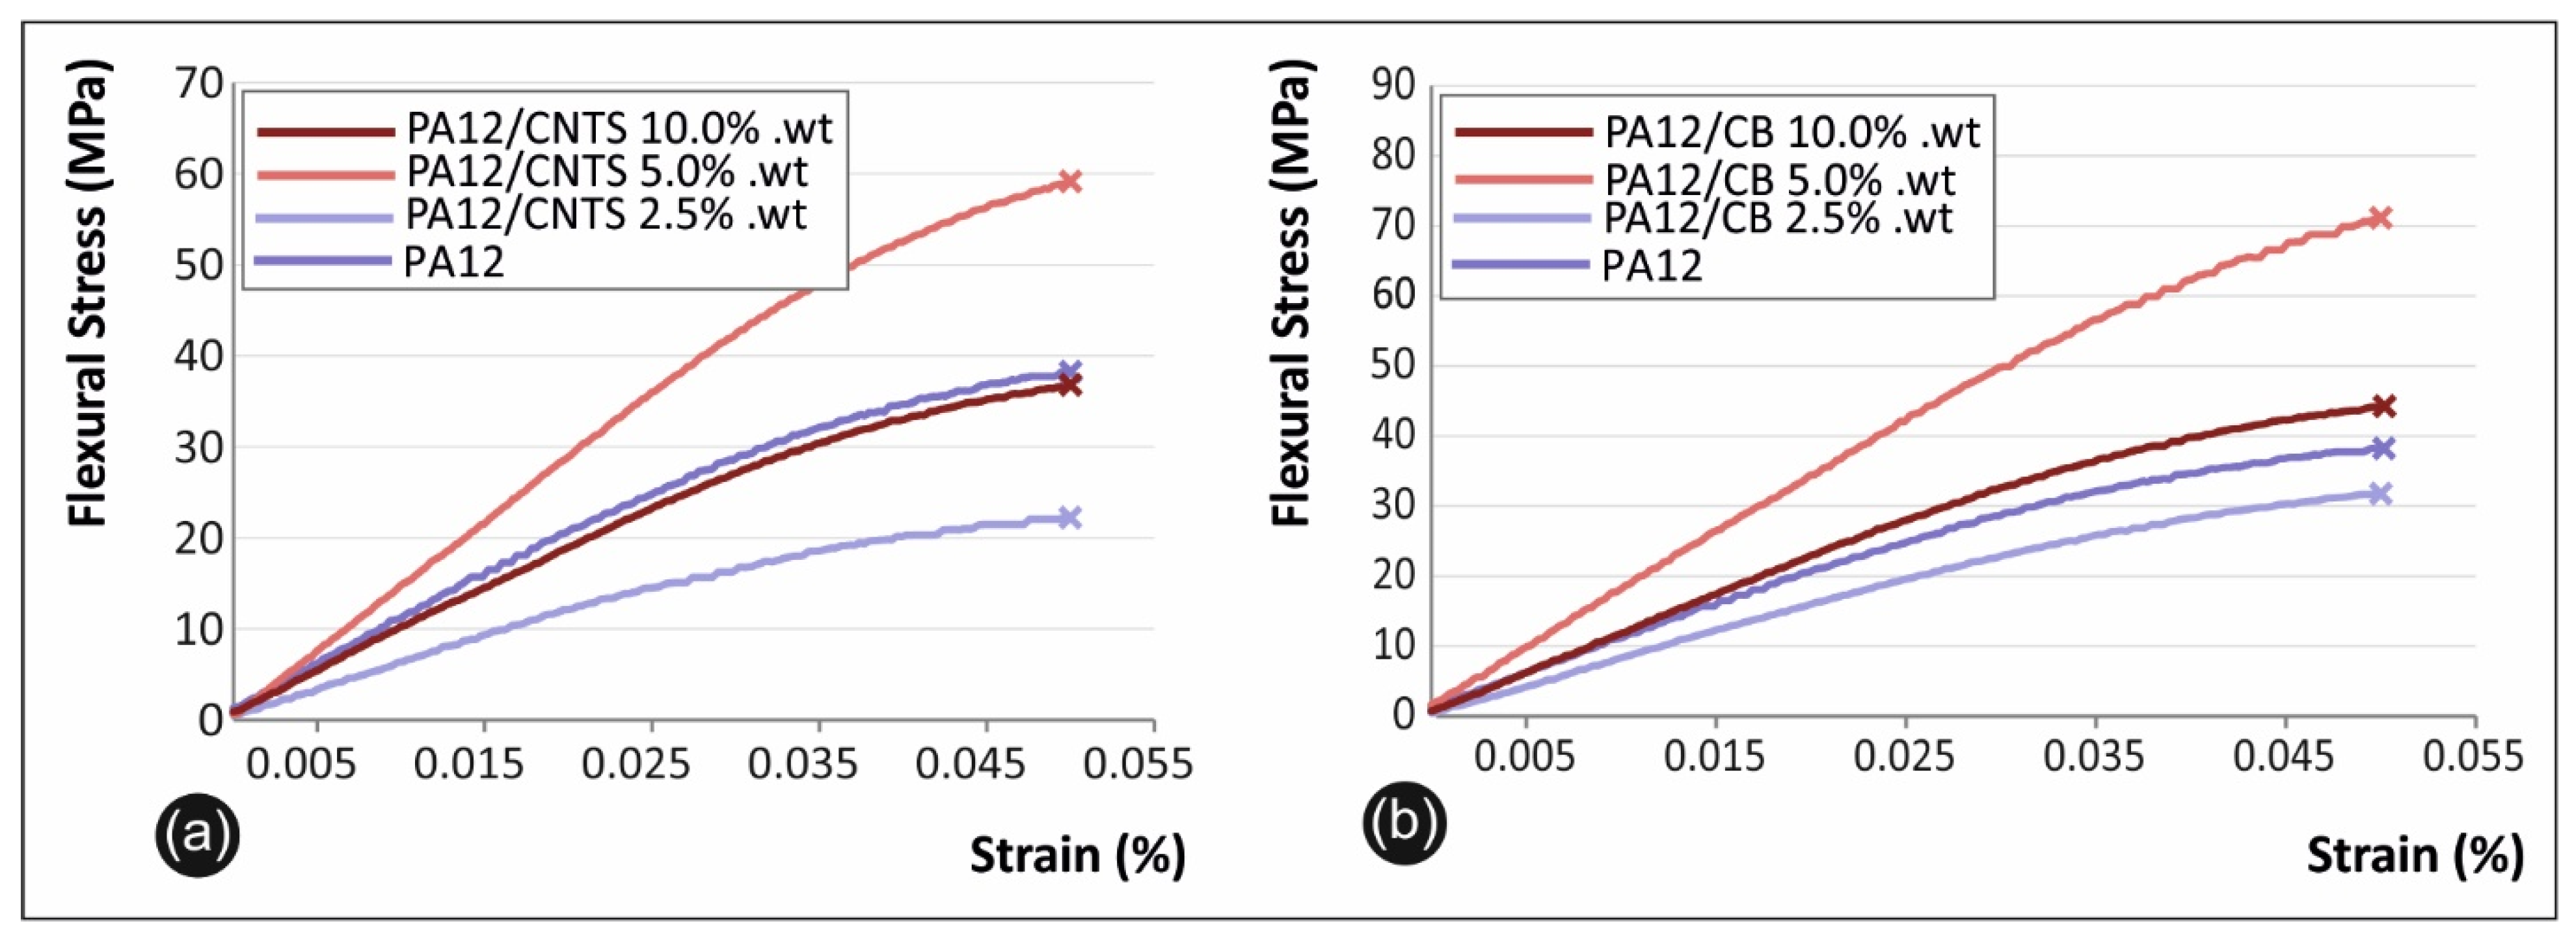
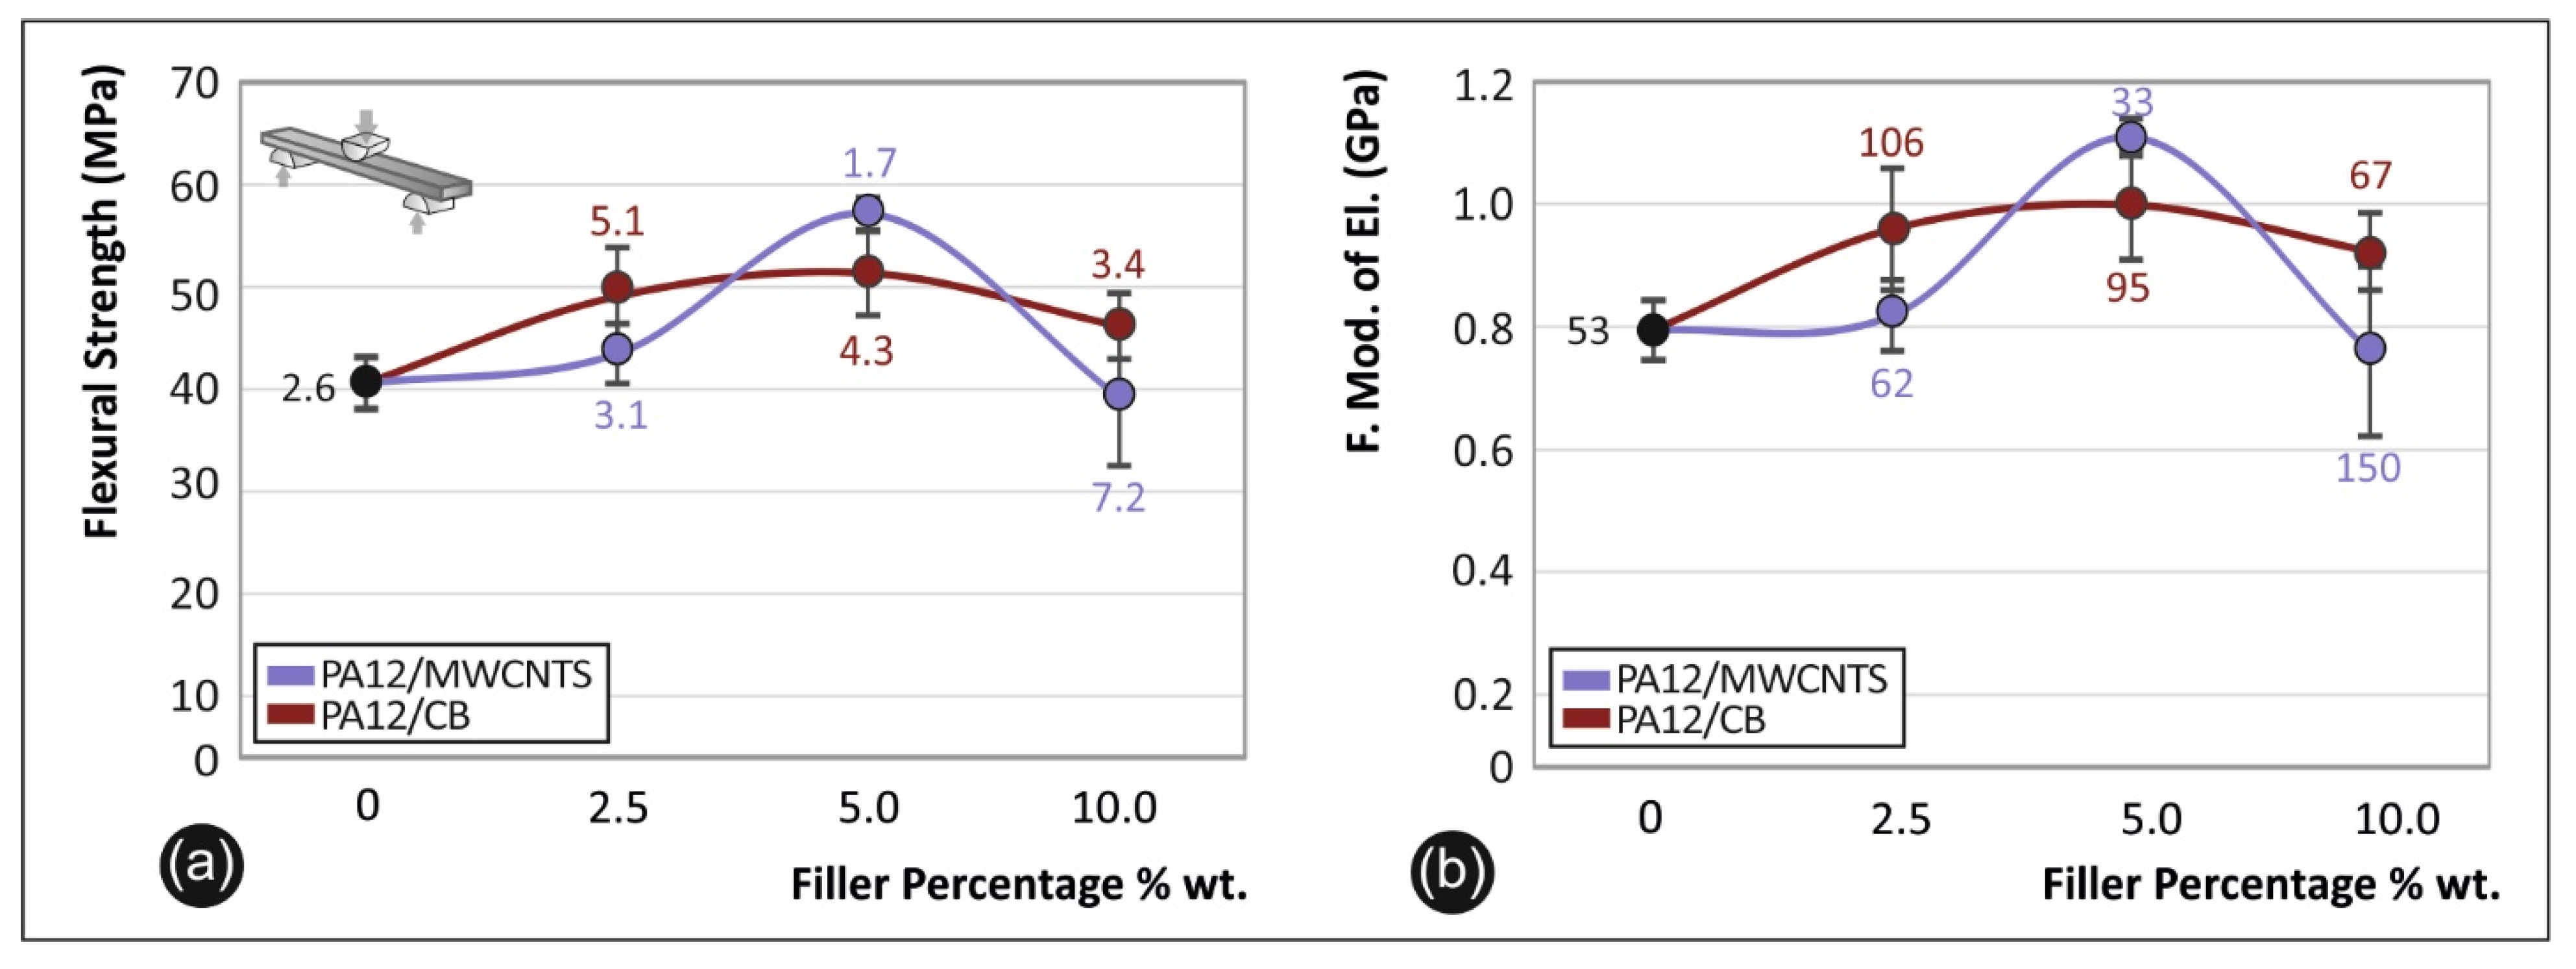
3.4.3. Flexural Properties

In Figure 12 below, representative flexural stress–strain curves for PA12/CNT (Figure 12a) and PA12/CB (Figure 12b) nanocomposites are shown. Figure 13a depicts the comparison of the averaged flexural strength values along with the calculated standard deviation for the different filler loadings of the PA12/MWCNT and PA12/CB nanocomposites. Figure 13b shows the average value and standard deviation of the flexural modulus of elasticity as a function of the filler loading for the PA12/MWCNT and PA12/CB nanocomposites, respectively. The flexural properties are in good agreement with the previously presented tensile properties. Specifically, CNTs are found to induce a more prominent reinforcement mechanism with the flexural strength and modulus remaining almost the same as the reference PA12 at the 2.5 wt.% filler loading while showing a remarkable increase only for the 5.0 wt.% filler loading and not the 10 wt.% loading, as found for the tensile stress results. For 10 wt.% filler loading, a small knock-down effect was observed on the flexural properties of the PA12/CNT nanocomposites. From calculations, approx. 45% increase in flexural strength and 39% increase in the flexural modulus were the highest enhancements observed for the 5.0 wt.% PA12/CNT nanocomposites. On the other hand, CB showed a less pronounced flexural property reinforcement, compared to CNTs. Quite remarkable enhancements were observed for nanocomposites of 2.5 wt.% (~25% increase in flexural strength and ~18% increase in flexural modulus) and 5.0 wt.% (~29% increase in flexural strength and ~23% increase in flexural modulus). For the 10.0 wt.% filled PA12/CB nanocomposites, no significant improvements in their flexural properties were observed. CNT-filled nanocomposites show quite promising reinforcement mechanisms for the flexural properties of the PA12/CNT nanocomposites at 5.0 wt.% filler loading.

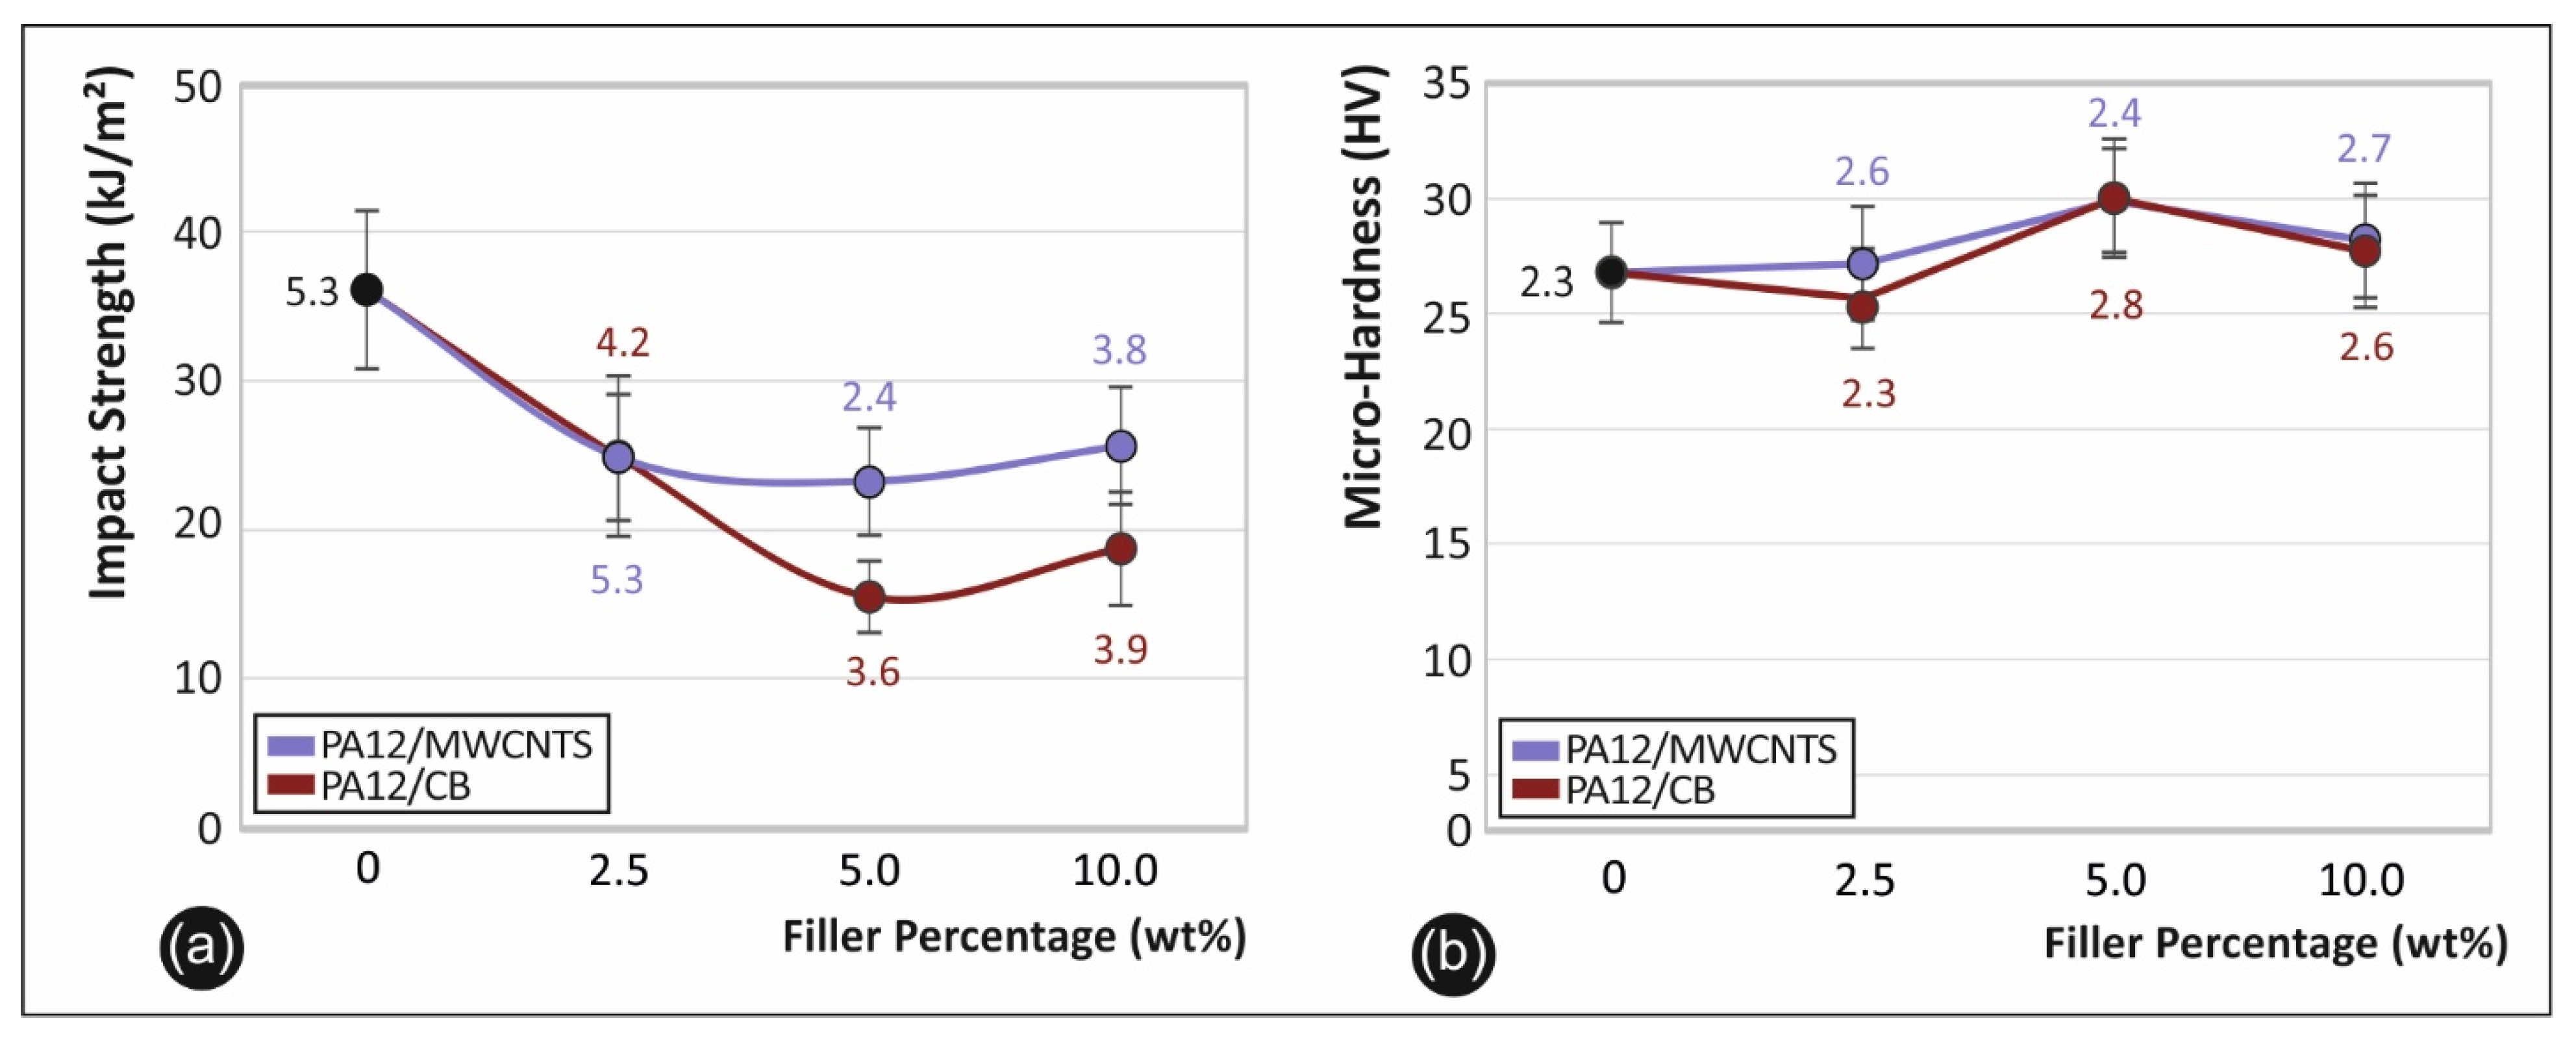
3.4.4. Impact and Microhardness Results

The final mechanical property investigations of the 3D-printed PA12/CNT and PA12/CB nanocomposites are related to their impact response (Figure 14a: Charpy’s notched impact test results (kJ/m2) and microhardness (Figure 14b: Vickers (HV) performance. Specifically, in Figure 14a, the calculated means, together with the standard deviations of measured impact strength values, are presented for the PA12/CNT and PA12/CB nanocomposites. For all the filler loadings, there is a knock-down effect on the samples’ impact properties, slightly more pronounced for the PA12/CB nanocomposites, which is most likely associated with the stiffening of the material with the CNT and CB nanoinclusions that makes the material a bit more brittle, not allowing thus to absorb impact energy. Regarding the microhardness properties, the samples exhibit a marginal improvement by the different CNT and CB loadings, even up to 10.0 wt.% contents, which could be attributed to the stiffening of the polymeric chains by the addition of fillers and the fillers’ nature, which are both much stiffer materials, compared to the polymeric matrix.

4. Conclusions

In this study, 3D-printed PA12 electrically conductive and thermoelectric polymer nanocomposite materials with enhanced mechanical properties were fabricated, with a thermomechanical extrusion melt mixing process, for the first time in the literature. The nanocomposites were fully characterized regarding their electrical, thermoelectric, and mechanical properties. Two different fillers, namely, CNTs and CB with different graphitization degrees and nanofiller geometries, have been utilized to demonstrate the effect of the different filler content on the electrical, thermoelectric, and mechanical properties. It is worth mentioning that the 3D-printed CPCs exhibited an anisotropic electrical conductivity in the through-layer and cross-layer printing direction but no difference in the Seebeck coefficient since it is an inherent material property induced in the nanocomposites by the CNT and CB properties, respectively.
The 3D-printed PA12 CPCs manufactured herein can be the building blocks for the fabrication of organic thermoelectric generators (TEGs). The 3D-printed thermoelectric PA12/CNT nanocomposites showed the best thermoelectric performance at 10.0 wt.% (σ = 278.2 S/m, S = 8.9µV/K, PF = 0.02 μW/mK2), while the highest enhancement in the static tensile and flexural mechanical properties was achieved at 5.0 wt.% filler loading (~33% increase in the tensile strength and ~25% in the tensile modulus of elasticity; ~45% increase in flexural strength and ~39% increase in the flexural modulus of elasticity).
It could be envisaged that the proposed multifunctional 3D manufactured nanocomposites could create the seeds for future 3D-produced energy harvesting devices and conductors, using home 3D printers that could be possibly utilized where complex 3D architectures and customizability are required, i.e., low-power demanding applications such as wearables, IoT sensors, etc.
Overall, it should be made clear that the PF for such CPC nanocomposites has to be significantly increased in the future, i.e., by at least two orders of magnitude, in order to enable the commercialization of the proposed materials and fabrication of thermoelectric generator (TEG) power generating devices. Future research could be devoted to melt-mixed thermoplastics with (i) higher CNT loadings and (ii) differently functionalized/doped CNTs; moreover, iii) nanocomposites of SWCNTs known to be more conductive, compared to MWCNTs and CB employed in this work.
The overall results especially related to the mechanical performance of the 3D-printed nanocomposites manufactured and tested in this study, summarized in Figure 15, indicate that the respective optimum filler loading of CNT and CB for the highest mechanical reinforcement of PA12 is at 5.0wt.% filler loading for both cases.

Author Contributions

Conceptualization, N.V. and L.T.; methodology, N.M., M.P. and E.V.; software, E.V. and N.M.; validation, N.V., S.A.G. and M.P.; formal analysis, E.V. and N.M.; investigation, M.P., S.A.G. and N.V.; resources, N.V., M.P. and S.A.G.; data curation, E.V., N.M. and L.T.; writing—original draft preparation, E.V. and L.T.; writing—review and editing, M.P. and L.T.; visualization, E.V. and N.M.; supervision, N.V. and L.T.; project administration, N.V. and M.P.; funding acquisition, N.V. All authors have read and agreed to the published version of the manuscript.

Funding

This research received no external funding.

Institutional Review Board Statement

Not applicable.

Informed Consent Statement

Not applicable.

Data Availability Statement

The data presented in this study are available in the article.

Acknowledgments

Authors would like to thank Aleka Manousaki from the University of Crete for taking the SEM images presented in this work.

Conflicts of Interest

The authors declare no conflict of interest.

References

  1. Zhang, J.; Wang, J.; Dong, S.; Yu, X.; Han, B. A review of the current progress and application of 3D printed concrete. Compos. Part A Appl. Sci. Manuf. 2019, 125, 105533. [Google Scholar] [CrossRef]
  2. Tzounis, L.; Petousis, M.; Grammatikos, S.; Vidakis, N. 3D printed thermoelectric polyurethane/multiwalled carbon nanotube nanocomposites: A novel approach towards the fabrication of flexible and stretchable organic thermoelectrics. Materials 2020, 13, 2879. [Google Scholar] [CrossRef] [PubMed]
  3. Kapnopoulos, C.; Mekeridis, E.D.; Tzounis, L.; Polyzoidis, C.; Zachariadis, A.; Tsimikli, S.; Gravalidis, C.; Laskarakis, A.; Vouroutzis, N.; Logothetidis, S. Fully gravure printed organic photovoltaic modules: A straightforward process with a high potential for large scale production. Sol. Energy Mater. Sol. Cells 2016, 144, 724–731. [Google Scholar] [CrossRef]
  4. Tzounis, L.; Bangeas, P.I.; Exadaktylos, A.; Petousis, M.; Vidakis, N. Three-dimensional printed polylactic acid (PLA) surgical retractors with sonochemically immobilized silver nanoparticles: The next generation of low-cost antimicrobial surgery equipment. Nanomaterials 2020, 10, 985. [Google Scholar] [CrossRef] [PubMed]
  5. Takagishi, K.; Umezu, S. Development of the improving process for the 3D printed structure. Sci. Rep. 2017, 7, 39852. [Google Scholar] [CrossRef] [PubMed]
  6. Gnanasekaran, K.; Heijmans, T.; van Bennekom, S.; Woldhuis, H.; Wijnia, S.; de With, G.; Friedrich, H. 3D printing of CNT and graphene-based conductive polymer nanocomposites by fused deposition modeling. Appl. Mater. Today 2017, 9, 21–28. [Google Scholar] [CrossRef]
  7. Tian, X.; Liu, T.; Yang, C.; Wang, Q.; Li, D. Interface and performance of 3D printed continuous carbon fiber reinforced PLA composites. Compos. Part A Appl. Sci. Manuf. 2016, 88, 198–205. [Google Scholar] [CrossRef]
  8. Vidakis, N.; Maniadi, A.; Petousis, M.; Vamvakaki, M.; Kenanakis, G.; Koudoumas, E. Mechanical and electrical properties investigation of 3D-printed acrylonitrile–butadiene–styrene graphene and carbon nanocomposites. J. Mater. Eng. Perform. 2020, 29, 1909–1918. [Google Scholar] [CrossRef]
  9. Vidakis, N.; Petousis, M.; Maniadi, A.; Koudoumas, E.; Liebscher, M.; Tzounis, L. Mechanical properties of 3D-printed acrylonitrile–butadiene–styrene TiO2 and ATO nanocomposites. Polymers 2020, 12, 1589. [Google Scholar] [CrossRef]
  10. Le, T.; Song, B.; Liu, Q.; Bahr, R.A.; Moscato, S.; Wong, C.; Tentzeris, M.M. A novel strain sensor based on 3D printing technology and 3D antenna design. In Proceedings of the 2015 IEEE 65th Electronic Components and Technology Conference (ECTC), San Diego, CA, USA, 26–29 May 2015; pp. 981–986. [Google Scholar]
  11. Vidakis, N.; Petousis, M.; Velidakis, E.; Liebscher, M.; Tzounis, L. Three-dimensional printed antimicrobial objects of polylactic acid (PLA)-Silver nanoparticle nanocomposite filaments produced by an in-situ reduction reactive melt mixing process. Biomimetics 2020, 5, 42. [Google Scholar] [CrossRef]
  12. Taylor, A.P.; Cuervo, C.V.; Arnold, D.P.; Velásquez-García, L.F. Fully 3D-printed, monolithic, mini magnetic actuators for low-cost, compact systems. J. Microelectromech. Syst. 2019, 28, 481–493. [Google Scholar] [CrossRef]
  13. Brydson, J.A. (Ed.) 18–polyamides and polyimides. In Plastics Materials, 7th ed.; Butterworth-Heinemann: Oxford, UK, 1999; pp. 478–530. [Google Scholar]
  14. Slapnik, J.; Pulko, I.; Rudolf, R.; Anžel, I.; Brunčko, M. Fused filament fabrication of Nd-Fe-B bonded magnets: Comparison of PA12 and TPU matrices. Addit. Manuf. 2021, 38, 101745. [Google Scholar] [CrossRef]
  15. Zhang, X.; Fan, W.; Liu, T. Fused deposition modeling 3D printing of polyamide-based composites and its applications. Compos. Commun. 2020, 21, 100413. [Google Scholar] [CrossRef]
  16. Vidakis, N.; Petousis, M.; Tzounis, L.; Maniadi, A.; Velidakis, E.; Mountakis, N.; Kechagias, J.D. Sustainable additive manufacturing: Mechanical response of polyamide 12 over multiple recycling processes. Materials 2021, 14, 466. [Google Scholar] [CrossRef] [PubMed]
  17. Vidakis, N.; Petousis, M.; Velidakis, E.; Liebscher, M.; Mechtcherine, V.; Tzounis, L. On the strain rate sensitivity of fused filament fabrication (FFF) processed PLA, ABS, PETG, PA6, and PP thermoplastic polymers. Polymers 2020, 12, 2924. [Google Scholar] [CrossRef] [PubMed]
  18. Rosso, S.; Meneghello, R.; Biasetto, L.; Grigolato, L.; Concheri, G.; Savio, G. In-depth comparison of polyamide 12 parts manufactured by Multi Jet Fusion and Selective Laser Sintering. Addit. Manuf. 2020, 36, 101713. [Google Scholar] [CrossRef]
  19. Petousis, M.; Tzounis, L.; Papageorgiou, D.; Vidakis, N. Decoration of SiO2 and Fe3O4 nanoparticles onto the surface of MWCNT-grafted glass fibers: A simple approach for the creation of binary nanoparticle hierarchical and multifunctional composite interphases. Nanomaterials 2020, 10, 2500. [Google Scholar] [CrossRef]
  20. Papageorgiou, D.G.; Tzounis, L.; Papageorgiou, G.Z.; Bikiaris, D.N.; Chrissafis, K. β-nucleated propylene–ethylene random copolymer filled with multi-walled carbon nanotubes: Mechanical, thermal and rheological properties. Polymer 2014, 55, 3758–3769. [Google Scholar] [CrossRef]
  21. Foteinidis, G.; Tsirka, K.; Tzounis, L.; Baltzis, D.; Paipetis, A.S. The role of synergies of MWCNTs and carbon black in the enhancement of the electrical and mechanical response of modified epoxy resins. Appl. Sci. 2019, 9, 3757. [Google Scholar] [CrossRef] [Green Version]
  22. Tzounis, L.; Pegel, S.; Zafeiropoulos, N.E.; Avgeropoulos, A.; Paipetis, A.S.; Stamm, M. Shear alignment of a poly(styrene-butadiene-styrene) triblock copolymer/MWCNT nanocomposite. Polymer 2017, 131, 1–9. [Google Scholar] [CrossRef]
  23. Zhou, B.; Luo, W.; Yang, J.; Duan, X.; Wen, Y.; Zhou, H.; Chen, R.; Shan, B. Thermal conductivity of aligned CNT/polymer composites using mesoscopic simulation. Compos. Part A Appl. Sci. Manuf. 2016, 90, 410–416. [Google Scholar] [CrossRef]
  24. Tzounis, L.; Zappalorto, M.; Panozzo, F.; Tsirka, K.; Maragoni, L.; Paipetis, A.S.; Quaresimin, M. Highly conductive ultra-sensitive SWCNT-coated glass fiber reinforcements for laminate composites structural health monitoring. Compos. Part B Eng. 2019, 169, 37–44. [Google Scholar] [CrossRef]
  25. Han, T.; Kundu, S.; Nag, A.; Xu, Y. 3D printed sensors for biomedical applications: A review. Sensors 2019, 19, 1706. [Google Scholar] [CrossRef] [PubMed] [Green Version]
  26. Jaksic, N.I.; Desai, P.D. Characterization of resistors created by fused filament fabrication using electrically-conductive filament. Procedia Manuf. 2018, 17, 37–44. [Google Scholar] [CrossRef]
  27. Haghiashtiani, G.; Habtour, E.; Park, S.-H.; Gardea, F.; McAlpine, M.C. 3D printed electrically-driven soft actuators. Extrem. Mech. Lett. 2018, 21, 1–8. [Google Scholar] [CrossRef] [PubMed]
  28. Christ, J.F.; Aliheidari, N.; Ameli, A.; Pötschke, P. 3D printed highly elastic strain sensors of multiwalled carbon nanotube/thermoplastic polyurethane nanocomposites. Mater. Des. 2017, 131, 394–401. [Google Scholar] [CrossRef]
  29. Gutierrez, B.J.A.; Dul, S.; Pegoretti, A.; Alvarez-Quintana, J.; Fambri, L. Investigation of the effects of multi-wall and single-wall carbon nanotubes concentration on the properties of ABS nanocomposites. J. Carbon Res. 2021, 7, 33. [Google Scholar] [CrossRef]
  30. Tzounis, L.; Gravalidis, C.; Vassiliadou, S.; Logothetidis, S. Fiber yarns/CNT hierarchical structures as thermoelectric generators. Mater. Today Proc. 2017, 4, 7070–7075. [Google Scholar] [CrossRef]
  31. Tzounis, L.; Liebscher, M.; Fuge, R.; Leonhardt, A.; Mechtcherine, V. P- and n-type thermoelectric cement composites with CVD grown p- and n-doped carbon nanotubes: Demonstration of a structural thermoelectric generator. Energy Build. 2019, 191, 151–163. [Google Scholar] [CrossRef]
  32. Tzounis, L. Chapter 9–Synthesis and processing of thermoelectric nanomaterials, nanocomposites, and devices. In Nanomaterials Synthesis; Beeran Pottathara, Y., Thomas, S., Kalarikkal, N., Grohens, Y., Kokol, V., Eds.; Elsevier: Amsterdam, The Netherlands, 2019; pp. 295–336. [Google Scholar]
  33. Madan, D.; Wang, Z.; Chen, A.; Juang, R.-C.; Keist, J.; Wright, P.K.; Evans, J.W. Enhanced performance of dispenser printed MA n-type Bi2Te3 composite thermoelectric generators. ACS Appl. Mater. Interfaces 2012, 4, 6117–6124. [Google Scholar] [CrossRef]
  34. Liang, D.; Yang, H.; Finefrock, S.W.; Wu, Y. Flexible nanocrystal-coated glass fibers for high-performance thermoelectric energy harvesting. Nano Lett. 2012, 12, 2140–2145. [Google Scholar] [CrossRef]
  35. Srinivasan, B.; Berthebaud, D.; Mori, T. Is LiI a potential dopant candidate to enhance the thermoelectric performance in Sb-free GeTe systems? A prelusive study. Energies 2020, 13, 643. [Google Scholar] [CrossRef] [Green Version]
  36. Piao, M.; Kim, G.; Kennedy, G.P.; Roth, S.; Dettlaff-Weglikowska, U. Thermoelectric properties of single walled carbon nanotube networks in polycarbonate matrix. Phys. Status Solidi 2013, 250, 1468–1473. [Google Scholar] [CrossRef]
  37. Piao, M.; Na, J.; Choi, J.; Kim, J.; Kennedy, G.P.; Kim, G.; Roth, S.; Dettlaff-Weglikowska, U. Increasing the thermoelectric power generated by composite films using chemically functionalized single-walled carbon nanotubes. Carbon 2013, 62, 430–437. [Google Scholar] [CrossRef]
  38. Tzounis, L.; Hegde, M.; Liebscher, M.; Dingemans, T.; Pötschke, P.; Paipetis, A.S.; Zafeiropoulos, N.E.; Stamm, M. All-aromatic SWCNT-Polyetherimide nanocomposites for thermal energy harvesting applications. Compos. Sci. Technol. 2018, 156, 158–165. [Google Scholar] [CrossRef]
  39. Tzounis, L.; Liebscher, M.; Mäder, E.; Pötschke, P.; Stamm, M.; Logothetidis, S. Thermal energy harvesting for large-scale applications using MWCNT-grafted glass fibers and polycarbonate-MWCNT nanocomposites. AIP Conf. Proc. 2015, 1646, 138–148. [Google Scholar]
  40. Gao, C.; Chen, G. Conducting polymer/carbon particle thermoelectric composites: Emerging green energy materials. Compos. Sci. Technol. 2016, 124, 52–70. [Google Scholar] [CrossRef]
  41. Karalis, G.; Tzounis, L.; Lambrou, E.; Gergidis, L.N.; Paipetis, A.S. A carbon fiber thermoelectric generator integrated as a lamina within an 8-ply laminate epoxy composite: Efficient thermal energy harvesting by advanced structural materials. Appl. Energy 2019, 253, 113512. [Google Scholar] [CrossRef]
  42. Tzounis, L.; Petousis, M.; Liebscher, M.; Grammatikos, S.; Vidakis, N. Three-dimensional (3D) conductive network of CNT-modified short jute fiber-reinforced natural rubber: Hierarchical CNT-enabled thermoelectric and electrically conductive composite interfaces. Materials 2020, 13, 2668. [Google Scholar] [CrossRef]
  43. Ferrari, A.C.; Basko, D.M. Raman spectroscopy as a versatile tool for studying the properties of graphene. Nat. Nanotechnol. 2013, 8, 235–246. [Google Scholar] [CrossRef] [Green Version]
  44. Li, Z.; Zabihi, O.; Wang, J.; Li, Q.; Wang, J.; Lei, W.; Naebe, M. Hydrophilic PAN based carbon nanofibres with improved graphitic structure and enhanced mechanical performance using ethylenediamine functionalized graphene. RSC Adv. 2017, 7, 2621–2628. [Google Scholar] [CrossRef] [Green Version]
  45. Felisberto, M.; Tzounis, L.; Sacco, L.; Stamm, M.; Candal, R.; Rubiolo, G.H.; Goyanes, S. Carbon nanotubes grown on carbon fiber yarns by a low temperature CVD method: A significant enhancement of the interfacial adhesion between carbon fiber/epoxy matrix hierarchical composites. Compos. Commun. 2017, 3, 33–37. [Google Scholar] [CrossRef]
  46. Xu, F.; Yan, C.; Shyng, Y.-T.; Chang, H.; Xia, Y.; Zhu, Y. Ultra-toughened nylon 12 nanocomposites reinforced with IF-WS2. Nanotechnology 2014, 25, 325701. [Google Scholar] [CrossRef]
  47. Gong, S.; Zhu, Z.H.; Li, Z. Electron tunnelling and hopping effects on the temperature coefficient of resistance of carbon nanotube/polymer nanocomposites. Phys. Chem. Chem. Phys. 2017, 19, 5113–5120. [Google Scholar] [CrossRef] [PubMed]
  48. Sun, P.; Wei, B.; Zhang, J.; Tomczak, J.M.; Strydom, A.M.; Søndergaard, M.; Iversen, B.B.; Steglich, F. Large Seebeck effect by charge-mobility engineering. Nat. Commun. 2015, 6, 7475. [Google Scholar] [CrossRef] [PubMed]
  49. Moriarty, G.P.; De, S.; King, P.J.; Khan, U.; Via, M.; King, J.A.; Coleman, J.N.; Grunlan, J.C. Thermoelectric behavior of organic thin film nanocomposites. J. Polym. Sci. Part B Polym. Phys. 2013, 51, 119–123. [Google Scholar] [CrossRef]
  50. Mytafides, C.K.; Tzounis, L.; Karalis, G.; Formanek, P.; Paipetis, A.S. High-power all-carbon fully printed and wearable SWCNT-based organic thermoelectric generator. ACS Appl. Mater. Interfaces 2021, 13, 11151–11165. [Google Scholar] [CrossRef] [PubMed]
  51. Tzounis, L.; Gärtner, T.; Liebscher, M.; Pötschke, P.; Stamm, M.; Voit, B.; Heinrich, G. Influence of a cyclic butylene terephthalate oligomer on the processability and thermoelectric properties of polycarbonate/MWCNT nanocomposites. Polymer 2014, 55, 5381–5388. [Google Scholar] [CrossRef]
  52. Luo, J.; Cerretti, G.; Krause, B.; Zhang, L.; Otto, T.; Jenschke, W.; Ullrich, M.; Tremel, W.; Voit, B.; Pötschke, P. Polypropylene-based melt mixed composites with singlewalled carbon nanotubes for thermoelectric applications: Switching from p-type to n-type by the addition of polyethylene glycol. Polymer 2017, 108, 513–520. [Google Scholar] [CrossRef]
Figure 1. The optimum FFF 3D printing parameters followed in this study to manufacture the different specimens.
Carbon 07 00038 g001
Figure 2. Flow chart illustrating the different steps to manufacture the filaments and the 3D-printed specimens in this study.
Carbon 07 00038 g002
Figure 3. (a) Schematic illustration of the cross-layer and through layer two-probe electrical resistance derived conductivity measurements and (b) the setup employed for the Seebeck coefficient measurements of the 3D-printed conductive nanocomposites.
Carbon 07 00038 g003
Figure 4. Raman spectra of (a) MWCNTs and highly graphitized CB carbon nanoallotrope fillers, together with the corresponding fitting lines; and (b) PA12/MWCNT and PA12/CB nanocomposites at 2.5 wt.% filler loading.
Carbon 07 00038 g004
Figure 5. Side surface morphology of PA12/CNT 3D-printed nanocomposites: neat PA12 (a), compared to 2.5 (b), 5.0 (c), and 10.0 wt.% (d) filler loading.
Carbon 07 00038 g005
Figure 6. Side surface morphology of PA12/CB 3D-printed nanocomposites: neat PA12 (a), compared to 2.5 (b), 5.0 (c), and 10.0 wt.% (d) filler loading.
Carbon 07 00038 g006
Figure 7. (a,b) Operation of an LED device when current is passing through a 5.0 wt.% filled PA12/MWCNT nanocomposite in a closed circuit, upon applying two different magnitudes of Vbias, namely, 3.4 V and 15.3 V.; (c) electrical conductivity of the 3D-printed PA12 conductive nanocomposites at 2.5, 5.0, and 10.0 wt.% MWCNT and CB contents, at two different measurement directions, namely, the “through layer” and the “cross layer” of the 3D-printed object.
Carbon 07 00038 g007
Figure 8. Stress–strain curves for (a) PA12 and PA12/CNT, as well as (b) PA12 and PA12/CB nanocomposites.
Carbon 07 00038 g008
Figure 9. (a) Tensile strength average values along with the calculated standard deviation and (b) average tensile modulus of elasticity values; both as a function of the different filler loadings for the PA12/MWCNT and PA12/CB nanocomposites, respectively.
Carbon 07 00038 g009
Figure 10. Fractured surface morphology of PA12/CNT 3D-printed nanocomposites after tensile tests: neat PA12 (a,b) compared to 2.5 wt.% (c,d), 5.0 wt.% (e,f), and 10.0 wt.% (g,h) filler loading.
Carbon 07 00038 g010
Figure 11. Fractured surface morphology of PA12/CNT 3D-printed nanocomposites after tensile tests: neat PA12 (a,b) compared to 2.5 wt.% (c,d), 5.0 wt.% (e,f), and 10.0 wt.% (g,h) filler loading.
Carbon 07 00038 g011
Figure 12. Flexural (representative and comparative) stress–strain curves for (a) PA12 and PA12/CNT, as well as (b) PA12 and PA12/CB nanocomposites.
Carbon 07 00038 g012
Figure 13. (a) Flexural strength average values along with the calculated standard deviation and (b) average flexural modulus of elasticity values; both as a function of the different filler loadings for the PA12/MWCNT and PA12/CB nanocomposites, respectively.
Carbon 07 00038 g013
Figure 14. (a) Charpy’s notched impact test results (kJ/m2), and (b) microhardness (Vickers (HV)) performance of the PA12/CNT and PA12/CB nanocomposites (both properties are shown as the calculated mean values, together with the corresponding standard deviation).
Carbon 07 00038 g014
Figure 15. Overall results on the mechanical properties and performance of neat PA12, compared to (a) PA12/CB and (b) PA12/CNT 3D-printed nanocomposites.
Carbon 07 00038 g015
Publisher’s Note: MDPI stays neutral with regard to jurisdictional claims in published maps and institutional affiliations.

