
Poly(Vinylamine) Derived N-Doped C-Dots with Antimicrobial and Antibiofilm Activities
by
 , ,
, ,
Semiha Duygu Sutekin
1 ,
,
Mehtap Sahiner
2,
Selin Sagbas Suner
3,
Sahin Demirci
3,
Olgun Güven
1 and
Nurettin Sahiner
3,4,5,* 1
Department of Chemistry, Hacettepe University, Beytepe, 06800 Ankara, Turkey
2
Department of Fashion Design, Faculty of Canakkale School of Applied Science, Canakkale Onsekiz Mart University Terzioglu Campus, Canakkale, 17100 Kepez, Turkey
3
Department of Chemistry, Faculty of Sciences & Arts, and Nanoscience and Technology Research and Application Center (NANORAC), Canakkale Onsekiz Mart University Terzioglu Campus, Canakkale, 17100 Kepez, Turkey
4
Department of Chemical & Biomedical Engineering, and Materials Science and Engineering Program, University of South Florida, Tampa, FL 33620, USA
5
Department of Ophthalmology, University of South Florida, Tampa, FL 33620, USA
*
Author to whom correspondence should be addressed.
C 2021, 7(2), 40; https://0-doi-org.brum.beds.ac.uk/10.3390/c7020040
Submission received: 30 March 2021
/
Revised: 19 April 2021
/
Accepted: 24 April 2021
/
Published: 27 April 2021
(This article belongs to the Special Issue Graphene and Carbon Quantum Dots, and Related 2D Quantum Dots)
Abstract
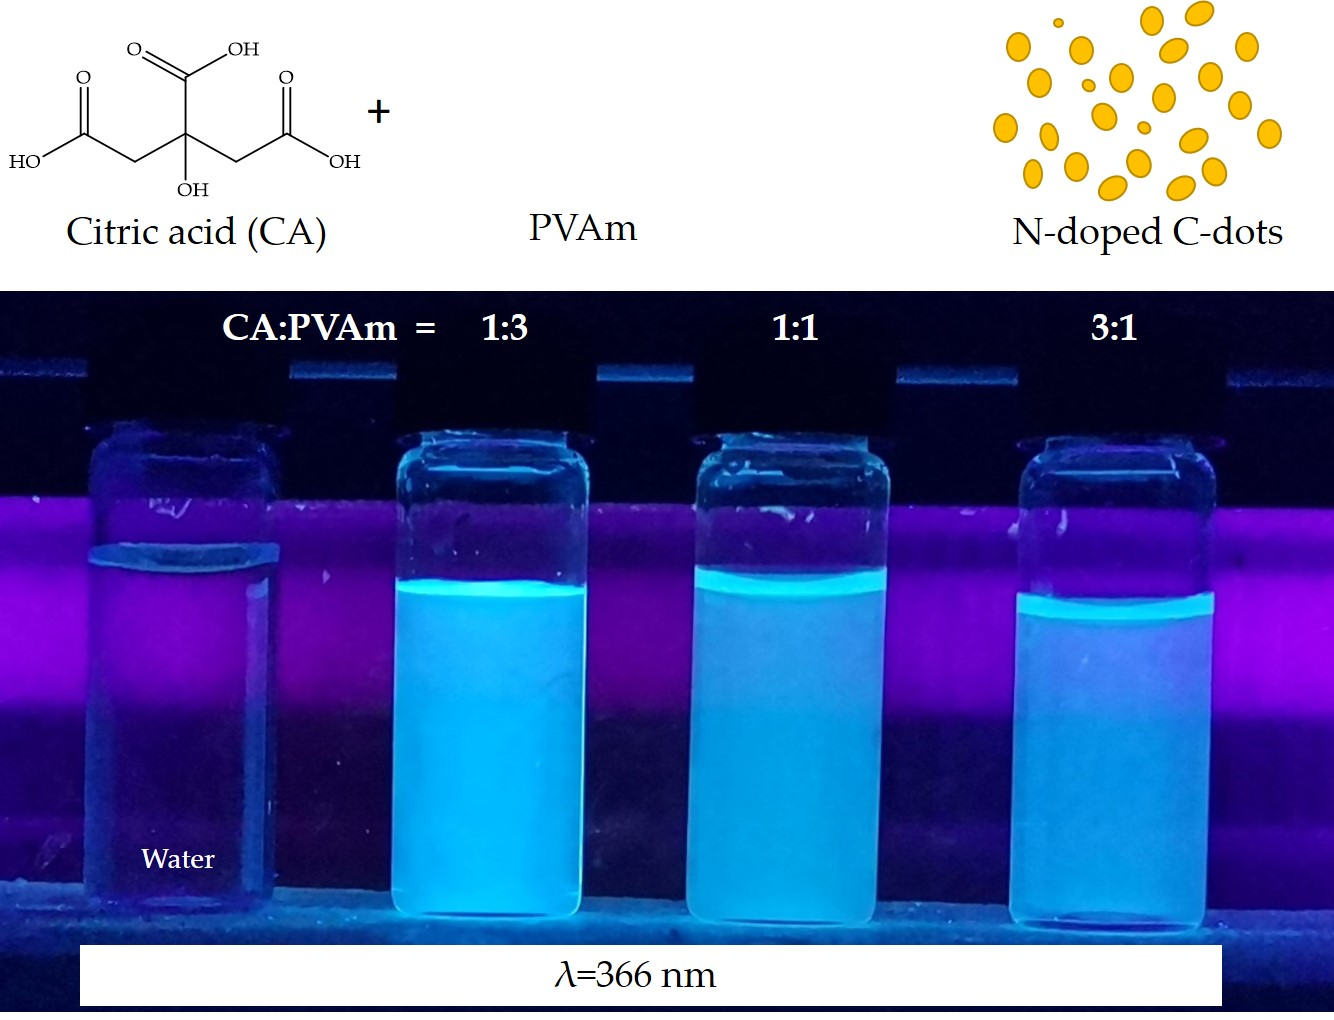
:Nitrogen-doped carbon dots (N-doped C-dots) was synthesized by using poly(vinyl amine) (PVAm) as a nitrogen source and citric acid (CA) as a carbon source via the hydrothermal method. Various weight ratios of CA and PVAm (CA:PVAm) were used to synthesize N-doped C-dots. The N-doped C-dots revealed emission at 440 nm with excitation at 360 nm and were found to increase the fluorescence intensity with an increase in the amount of PVAm. The blood compatibility studies revealed no significant hemolysis for N-doped C-dots that were prepared at different ratios of CA:PVAm for up to 500 μg/mL concentration with the hemolysis ratio of 1.96% and the minimum blood clotting index of 88.9%. N-doped C-dots were found to be more effective against Gram-positive bacteria than Gram-negative bacteria, with the highest potency on Bacillus subtilis (B. subtilis). The increase in the weight ratio of PVAm in feed during C-dots preparation from 1 to 3 leads to a decrease of the minimum bactericidal concentration (MBC) value from 6.25 to 0.75 mg/mL for B. subtilis. Antibiofilm ability of N-doped C-dots prepared by 1:3 ratio of CA:PVAm was found to reduce %biofilm inhibition and eradication- by more than half, at 0.78 mg/mL for E. coli and B. subtilis generated biofilms and almost destroyed at 25 mg/mL concentrations.

1. Introduction
Carbon dots (C-dots) are zero-dimensional nanomaterials with intriguing optical and biological properties [1]. Low toxicity, small size, good biocompatibility, water solubility/dispersibility, high quantum yield, cost efficiency, and good stability make them attractive for many applications [2,3]. The properties of C-dots, e.g., their fluorescence, colorimetric and electrochemical features are much more different from their source materials [1]. Due to the optical properties of C-dots, they can be used as optic devices, sensors, and as diagnostic and multifunctional materials in many different fields. For example, using a 3D printer, fluorescent C-dots containing structures can be used to detect chlorine in water samples [4]. Florescent C-dots from fructose and aniline were synthesized to detect glucose [5]. C-dots from L-arginine as a fluorescent probe were used to detect the neurotransmitter, dopamine from human urine [6]. C-dots with antiplatelet properties, prepared from garlic, have potential as a therapeutic agent in the treatment of arterial thromboembolic disease [7].
Microorganisms are small beings that exist in nature in various sizes and forms that are responsible for many diseases for humans. Additionally, the excess and unnecessary use of drugs may lead to the development of resistance of bacteria (such as antibiotic resistance), and this is becoming a progressively major problem in some chronic diseases [8]. Biofilms are generated by microorganism states, which lead to major resistance to multiple drugs [9]. More than 60% of human infectious bacteria create biofilm [10]. The biofilms are created by bacteria as well as fungi and viruses [11,12]. C-dots derived from different sources, e.g., polyethyleneimine, was reported as having effective antimicrobial and biofilm inhibiting properties [13]. Additionally, polyamine-derived C-dots were also reported with potent antimicrobial materials [14]. Moreover, C-dots containing m-phenylenediamine were shown antimicrobial properties against various microorganisms [15]. Therefore, C-dots can be considered promising biomaterials to be used as antibacterial materials capable of destroying biofilm and even preventing bacterial infections.
N-Vinyl formamide (NVF) is an isomer of acrylamide [16]. It has vinyl functionality for polymerization or copolymerization to render amine functionality to attain poly(Vinylamine) (PVAm) upon acid and alkali treatments. PVAm has the highest primary amine group-containing polymer, compared to other well-known amine-containing polymers, e.g., poly(ethyleneimine) (PEI) [17]. Additionally, the synthesis of PVAm from direct polymerization of vinyl amine (VAm) cannot be carried out because of the nonexistence of free VAm as a monomer [18]. However, there are various techniques reported in the literature to synthesize PVAm, such as Hoffman rearrangement of polyacrylamide and acidic/basic hydrolysis of poly(N-Vinyl acetamide) or PNVF [19,20,21]. The hydrolysis in an alkaline medium is more efficient than the acid treatment of PNVF to prepare PVAm [22]. Due to its cationic structure, PVAm has potential antibacterial properties [23]. Studies were reported on the use of PVAm on nonleaching surfaces or in the coating of some biomedical materials due to the antibacterial effect of PVAm [24,25].
In this study, poly(N-Vinyl formamide) (PNVF) was synthesized in accord with the literature, and PVAm was prepared by hydrolysis of PNVF in a basic medium [26]. Here, for the first time in the literature, the highest number of primary amine group-containing polymer per repeating unit, PVAm, was used as a nitrogen source, along with citric acid as the carbon source to synthesize C-dots at different weight ratios using Teflon-lined autoclave at 250 °C via a hydrothermal method. The characterization was carried out by using dynamic light scattering (DLS), zeta potential measurements, Fourier transform infrared spectrometer (FT–IR), thermal gravimetric analyzer (TGA), X-ray diffraction, and fluorescence spectrometer. Additionally, the blood compatibility of CA:PVAm C-dots was investigated via hemolysis% and blood clotting index studies. Furthermore, the antimicrobial and antibiofilm activities of CA:PVAm C-dots were also investigated against Escherichia coli (E. coli) ATCC 8739, Pseudomonas aeruginosa (P. aeruginosa) ATCC 10145, Bacillus subtilis (B. subtilis) ATCC 6633, and Staphylococcus aureus (S. aureus) ATCC 6538 bacteria stains.
2. Materials and Methods
2.1. Materials
N-Vinylformamide (NVF, 98%, Aldrich, St. Louis, MO, USA) as the monomer and 2,2′-Azobis(2-methylpropionamidine) dihydrochloride (AMPD, 97%, Aldrich, USA) as the initiator and ultra-pure distilled water (DI, 18.2 MΩ cm, Millipore-Direct Q UV3) were used to synthesize poly(N-vinyl formamide) (PNVF). Acetone (99.75%, Sigma-Aldrich) was used for the precipitation of PNVF and its hydrolysis products. Sodium hydroxide (NaOH, pellets ACS/Reag. Ph. Eur., VWR Chemicals) was used for the basic hydrolysis reaction of PNVF polymers to prepare PVAm.
Citric acid monohydrate (Carlo Erba, CA, 99%) was used as the carbon source in the synthesis of N-doped C-dots. Quinine (suitable for fluorescence, anhydrous, 98%, Sigma-Aldrich, St. Louis, MO, USA) was used as a fluorescence standard for the calculation of quantum yield%. Quinine was dissolved into Sulfuric acid (H2SO4, 99%, Sigma Aldrich, USA) solution to prepare a fluorescence standard.
Bacteria growth media as nutrient agar (NA, Fisher Scientific, Hampton, NH, USA), nutrient broth (NB, Fisher Scientific), and RPMI-1640 medium (with 20 mM HEPES and L-glutamine, Sigma) were purchased and used as received. E. coli ATCC 8739 (KWIK-STIK™), P. aeruginosa ATCC 10145 (KWIK-STIK™), B. subtilis ATCC 6633 (KWIK-STIK™), and S. aureus ATCC 6538 (KWIK-STIK™) were obtained from Microbiologics Inc., (St. Cloud, MN, USA). Gentamicin sulfate (>590 IU/mg gentamycin) as an antibiotic was purchased from Acros Organics. Acetic acid (100%, glacial, Riedel-de-Haen) and crystal violet (CV, for analysis Carlo Erba) were purchased and used as received.
2.2. Synthesis of PVAm
The synthesis of poly(Vinyl amine) (PVAm) was performed via basic hydrolysis of poly(N-Viny formamide) (PNVF) [26]. In brief, PNVF was prepared via free-radical polymerization in accordance with the literature [27]. A total of 5 mL NVF monomer was added into 40 mL of water in a 100 mL round bottom flask and placed into an oil bath at 70 °C. After that, the 1% mole ratio of AMPD solution, with respect to the used amount of NVF monomer in 5 mL water, was added into monomer solution and stirred at 800 rpm mixing rate at 70 °C for 2 h. Finally, PNVF solution was added drop by drop into the excess amount of acetone (2 L) while stirring at 1000 rpm to precipitate PNVF. The final product was dried in a vacuum oven at 50 °C for 24 h to a constant weight.
A total of 5.0 g of prepared PNVF was placed in 45 mL of 2 M of NaOH solution and stirred at 500 rpm mixing rate at room temperature for 10 min to dissolve PNVF. Next, PNVF solution in 45 mL 1.5 M NaOH was placed in a temperature-controlled oil bath at 70 °C and stirred at 800 rpm for 4 h. The prepared PVAm solution was also added drop by drop into the excess amount of acetone while stirring at 1000 rpm to precipitate PVAm. The final product was dried in a vacuum oven at 50 °C for 24 h to constant weight.
2.3. Synthesis f CA:PVAm C-Dots
The various ratios of CA and PVAm were used for the synthesis of C-dots via Teflon-lined autoclave by the hydrothermal method as reported in the literature [28,29]. Weight ratios of 3:1, 1:1, and 1:3 (w/w) of CA and PVAm (total weight is 2.0 g of material) were used. In brief, 1.0 g of CA was dissolved into a Teflon-lined autoclave with 25 mL of water, and then 1.0 g PVAm was added into CA containing the solution and stirred for 5 min at room temperature. Then, the Teflon-lined autoclave was placed into a furnace and heated to 250 °C with a 10 °C/min heating rate. The Teflon-lined autoclave was kept in autoclave at 250 °C for 4 h. The final solution was placed into 500 mL water within a dialysis membrane (molecular weight cut off ≥12,000 Da) to wash the prepared CA:PVAm C-dots (1:1) for 3 h by changing the washing water every 30 min.
The same procedure was also applied for the synthesis of 3:1 and 1:3 ratio of CA and PVAm N-doped C-dots. The prepared CA:PVAm N-doped C-dots were defined as the ratio of precursors 3:1, 1:1, and 1:3, in which the first number is the weight of CA, and the second number denotes the weight of PVAm. After the dialysis, the N-doped C-dots were collected in a 250 mL round bottom flask and evaporated to remove the excess amount of water.
2.4. Characterization
Dynamic light scattering (DLS, Zetasizer Nano-ZS, Malvern, Worcestershire, UK) technique was used to determine the hydrodynamic diameter and polydispersity of CA:PVAm C-dots and CA:PVAm CPs. Measurements were carried out at an angle of 173° by using a 4 mW He-Ne laser operating at 633 nm wavelength. Zeta potential (ZP) was calculated using the Zetasizer software at 25 °C. For particle size and ZP measurements, samples were freshly prepared in DI water at a concentration of 1 mg/mL and ZP values were followed in the pH range from 2 to 11. DLS and ZP measurements were performed in triplicates to assess the accuracy.
The shape and size of C-Dots were examined by high contrast transmission electron microscope (CTEM, TecnaiTM G2 Spirit Biotwin, FEI) operating at 120 kV. Before the analysis, diluted samples were sonicated and quickly dropped on the carbon-coated grid to overcome any agglomerations.
Fourier transform infrared (FT–IR, Spectrum, PerkinElmer, Waltham, MA, USA) spectra of N-doped C-dots and CPs were recorded between 4000 and 650 cm−1 wavenumberss with 4 cm−1 resolution using ATR technique as the average of four scans.
The thermogravimetric (TG) measurements were conducted using -thermogravimetric analyzer (TGA, Pyris 1, PerkinElmer). Prior to measurements, samples were heated to 100 °C for 10 min to remove the moisture. Thermal decomposition properties of N-doped C-dots were analyzed at a heating rate of 10 °C/min by ramping from 100 to 840 °C under a nitrogen atmosphere with a 20 mL/min flow rate.
X-ray powder diffraction patterns of N-doped C-dots were recorded by a PANalytical X’Pert Pro MPD diffractometer equipped with CuKα radiation and the X’Celerator detector on diffracted beam. The XRD data were collected in a Bragg Brentano (θ/θ) vertical geometry operating in flat reflection mode between 3° and 70° (2θ) in steps of 0.02° 2θ with 1 s step-counting time. The X-ray tube operating at 45 kV and 40 mA was used and a 1/2° divergence slit, a 0.04 rad Soller slit and a 10 mm fixed mask was placed in the incident beam pathway. The High Score Plus (v.4.6.0) software was used for peak identification and automated search–match to analyze diffraction patterns.
The fluorescence emission spectra of N-doped C-dots and CPs were recorded between 300 and 650 nm wavelengths by using a fluorescence spectrophotometer (Thermo Scientific, Lumina, USA) under 360 nm excitation wavelength at 700 V PMT voltage.
Quantum yield% (QY%) values for N-doped C-dots and CPs were calculated by using Equation (1) via Quinine sulfate solution as a standard. Quinine dissolved in 0.5 M H2SO4 was used as a standard with a known quantum yield% value of 54% at 345 nm excitation wavelength for quinine sulfate.
where “QY” is fluorescence quantum yield, “I” is the integrated fluorescence intensity, “OD” is the UV–Vis absorbance, and “ŋ” is the refractive index of the solvent for C-dots suspension solution as water (ŋ = 1.33) and 0.5 M H2SO4 in water (ŋ = 1.76).
QY% = QYStd% (I/IStd) (ODStd/OD) (ŋ2/ŋ2Std)
2.5. Blood Compatibility Analysis
Blood compatibility of N-doped C-dots was investigated by hemolysis and blood clotting analysis according to the method proposed by Zamani et al., with some modification [30]. For the analysis, fresh blood was taken from the healthy volunteer by approval from the Human Research Ethics Committee of Canakkale Onsekiz Mart University (011-KAEK-27/2020-E.2000045671) and placed into EDTA-containing tubes immediately; the details are provided in Supplementary Materials.
2.6. Antimicrobial Susceptibility of N-Doped C-Dots
Antibacterial activity of N-doped C-dots was evaluated by disc diffusion and microtiter broth dilution assays against E. coli ATCC 8739 and P. aeruginosa ATCC 10145, as Gram-negative bacteria, and S. aureus ATCC 6538 and B. subtilis ATCC 6633, as Gram-positive bacteria, based on the procedure described by Sun et al., with some modifications [31]; the details are provided in Supplementary Materials.
2.7. Biofilm Assays
Biofilm biomass analysis by crystal violet (CV) staining was applied to determine the biofilm eradication and inhibition% of N-doped C-dots prepared at 1:3 ratio of CA:PVAm on B. subtilis and E. coli strains. These processes were performed according to the procedure proposed by Ran et al., with some modification [32]; the details are given in Supporting Information.
3. Results and Discussion
3.1. Synthesis and Characterization of CA:PVAm C-Dots
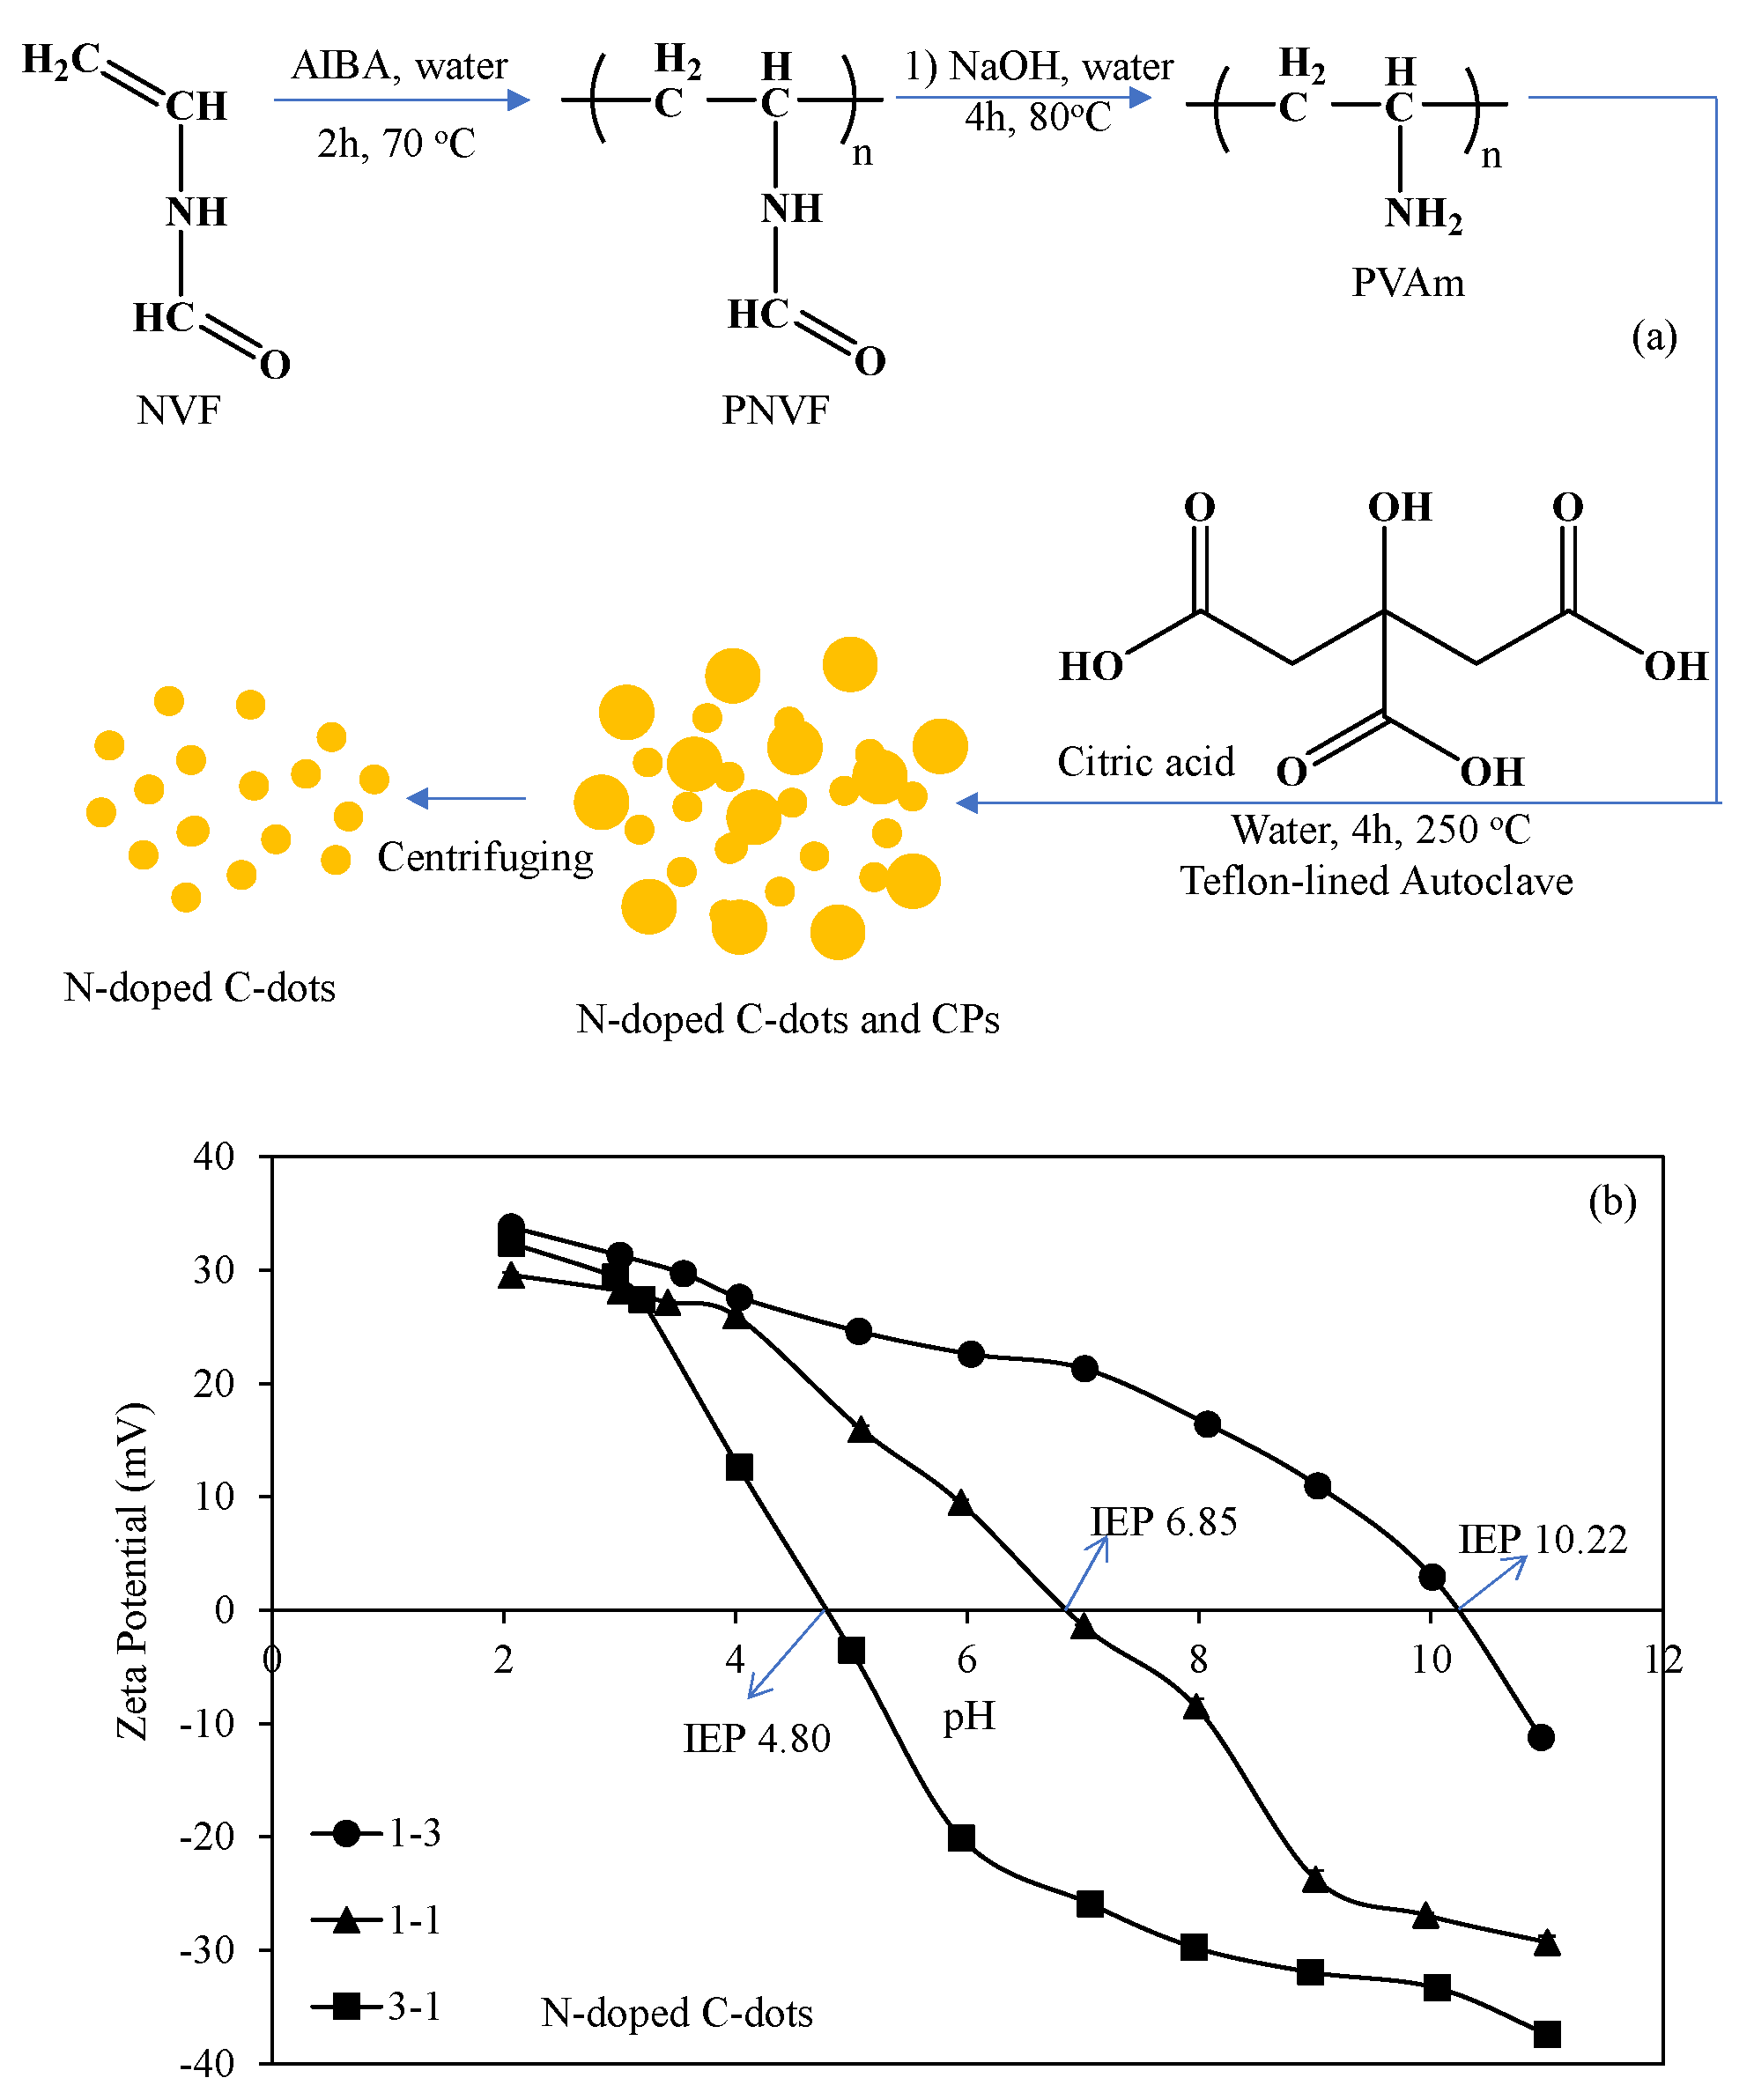
In this study, the synthesis of PVAm was accomplished via basic hydrolysis of PNVF. In Figure 1, the schematic presentation of synthesis of PVAm was demonstrated, and the related FT–IR spectra of NVF, PNVF, and PVAm were compared in Figure S1a to confirm the synthesis of PVAm from PNVF via basic hydrolysis. The FT–IR spectrum of NVF monomer yielded characteristic bands at 1666 cm−1 for vinyl groups, at 1638 cm−1 for C=O stretching in formamide groups, and at 1509 cm−1 for N–H bending of amide groups. As expected, the vinyl peaks at 1666 cm−1 disappeared after the course of polymerization in the FT–IR spectrum of PNVF. On the other hand, it was clearly observed that the C=O peaks at 1638 cm−1 from amide groups almost disappeared, and N–H stretching peaks from NH2 groups were observed after 4 h hydrolysis in basic conditions. These results show that most of the amide groups have been converted to amine groups, resulting in PVAm with an insignificant amount of PNVF units after 4 h of basic hydrolysis of PNVF. Moreover, in recent years, there are many reports on the use of PEI as a nitrogen (N) source for the synthesis of N-doped C-dots in the literature [33,34,35,36]. Therefore, this is the first report on the use of PVAm as an N source in the preparation of N-doped C-dots in which CA was used as a carbon source via a one-pot hydrothermal method in Teflon-lined autoclave at 250 °C. The schematic presentation of the synthesis of N-doped C-dots is given in Figure 1. As reported in the literature, N-doped C-dots prepared from citric acid and any amine sources were composed of graphitic structure upon the hydrothermal process [37,38]. The possible chemical structure of N-doped C-dots based on the mentioned mechanism from the synthesis of CA and PVAm is provided in Figure S2. The progress of the carbonization step in the presence of PVAm chains promotes the formation of N-doped C-dots since the presence of a large number of functional groups coming from the precursors, PVAm and CA, and the carbonization of the polymerized network at a high temperature can further elevate the N-doping of C-dots [20]. Amide linkages resulting from the thermal dehydration of the ammonium carboxylate moieties were used to covalently bond large amounts of PVAm molecules [32]. Various functional groups such as hydroxyl, epoxides, carboxylic acids, and amine were observed on synthesized N-doped C-dots according to reported studies [39]. Therefore, to investigate the effect of the amount PVAm, 3:1, 1:1, and 1:3 ratios of CA:PVAm were used in the preparation of N-doped C-dots. It was observed that from the reaction of CA and PVAm in Teflon-lined autoclave at 250 °C, both C-dots and carbon particles (CPs) in large sizes are formed. The formed N-doped CPs were separated from N-doped C-dots by 10 min centrifugation at 10,000 rpm.
Dynamic light scattering technique was employed to investigate the impact of CA:PVAm ratio in N-doped C-dots and CPs on their zeta potential, size, and polydispersity (PDI). As summarized in Table 1, the change in the ratio of PVAm did not cause a significant change in the zeta potential of CA:PVAm C-dots.
In contrast, the zeta potential values of 26.4 ± 0.4, 8.4 ± 0.1, and 35 ± 0.5 mV were obtained for CA:PVAm CPs at the ratio of 3:1, 1:1, and 1:3, respectively. The pH values of CA:PVAm C-dots at the ratio of 3:1, 1:1, and 1:3 were 3.2, 3.4, and 3.55, respectively. As expected, an increase in solution pH was observed with a decrease in citric acid ratio used during synthesis, which corroborates the presence of carboxylic acid functionality in C-dots that is imparted to the C-dot structure in direct relation with the amount of used CA. Particle sizes are also presented in Table 1, for both for CA:PVAm C-dots and CPs. In general, smaller particle sizes were obtained both for N-doped C-dots and CPs with 1:1 ratio, whereas CA:PVAm C-dots and CPs with 3:1 ratio yielded the largest particle size.
Zeta potential (ZP) measurements were conducted to evaluate the effect of pH on the surface charge of N-doped C-dots and to determine their isoelectric points (IEP), as shown in Figure 1b. Both carboxyl groups (e.g., –COOH/–COO−) of CA and amino groups (e.g., –NH3+/–NH2) of PVAm in the CA:PVAm structure are highly affected by the solution pH. CA is a tricarboxylic acid with three dissociable carboxylic acid protons with pKa1 = 3.13, pKa2 = 4.76, pKa3 = 6.40 [40]. Protonated PVAm has an average dissociation constant of 8.0 [21]. As a result, both carboxyl groups of CA and amino groups of PVAm were highly protonated and all N-doped C-dots and CPs presented net positive ZP values ranging from 29.6 to 32.4 mV at pH ≤ 3. At pH values higher than pKa1 = 3.13 of CA, the effect of structural differences on the ZP values and IEPs were distinctive. C-dots bearing an equal amount of CA and PVAm (1:1) yielded an IEP value of 6.85, which is likely due to the ionization balance of the deprotonated carboxyl groups (–COO−) in CA and partially protonated amino groups (–NH3+) in PVAm. For the C-dots with the highest amount of CA (3:1), the IEP shifted to the acidic region (IEP = 4.80). In addition, the high amount of CA resulted in a sharp decrease in ZP values from 32.4 mV to −37.4 mV between pH 2 and 11 due to the highly acidic character of CA. For C-dots with the highest amount of PVAm (1:3), ZP values showed a more moderate change between −33.8 and −11.2 mV with the change of pH 2 to 11, due to the dominance of partially protonated primary amino groups providing a positive charge. Moreover, the lesser amount of CA resulted in a shift toward more basic IEP as 10.22. Overall, it is evident that the presence of carboxylic acid functionality related to the initial amount of CA strongly affects the surface charge and isoelectric point of C-dots. Hence, the stability range of C-dots may be altered by the change in CA:PVAm ratio in a wide pH range.
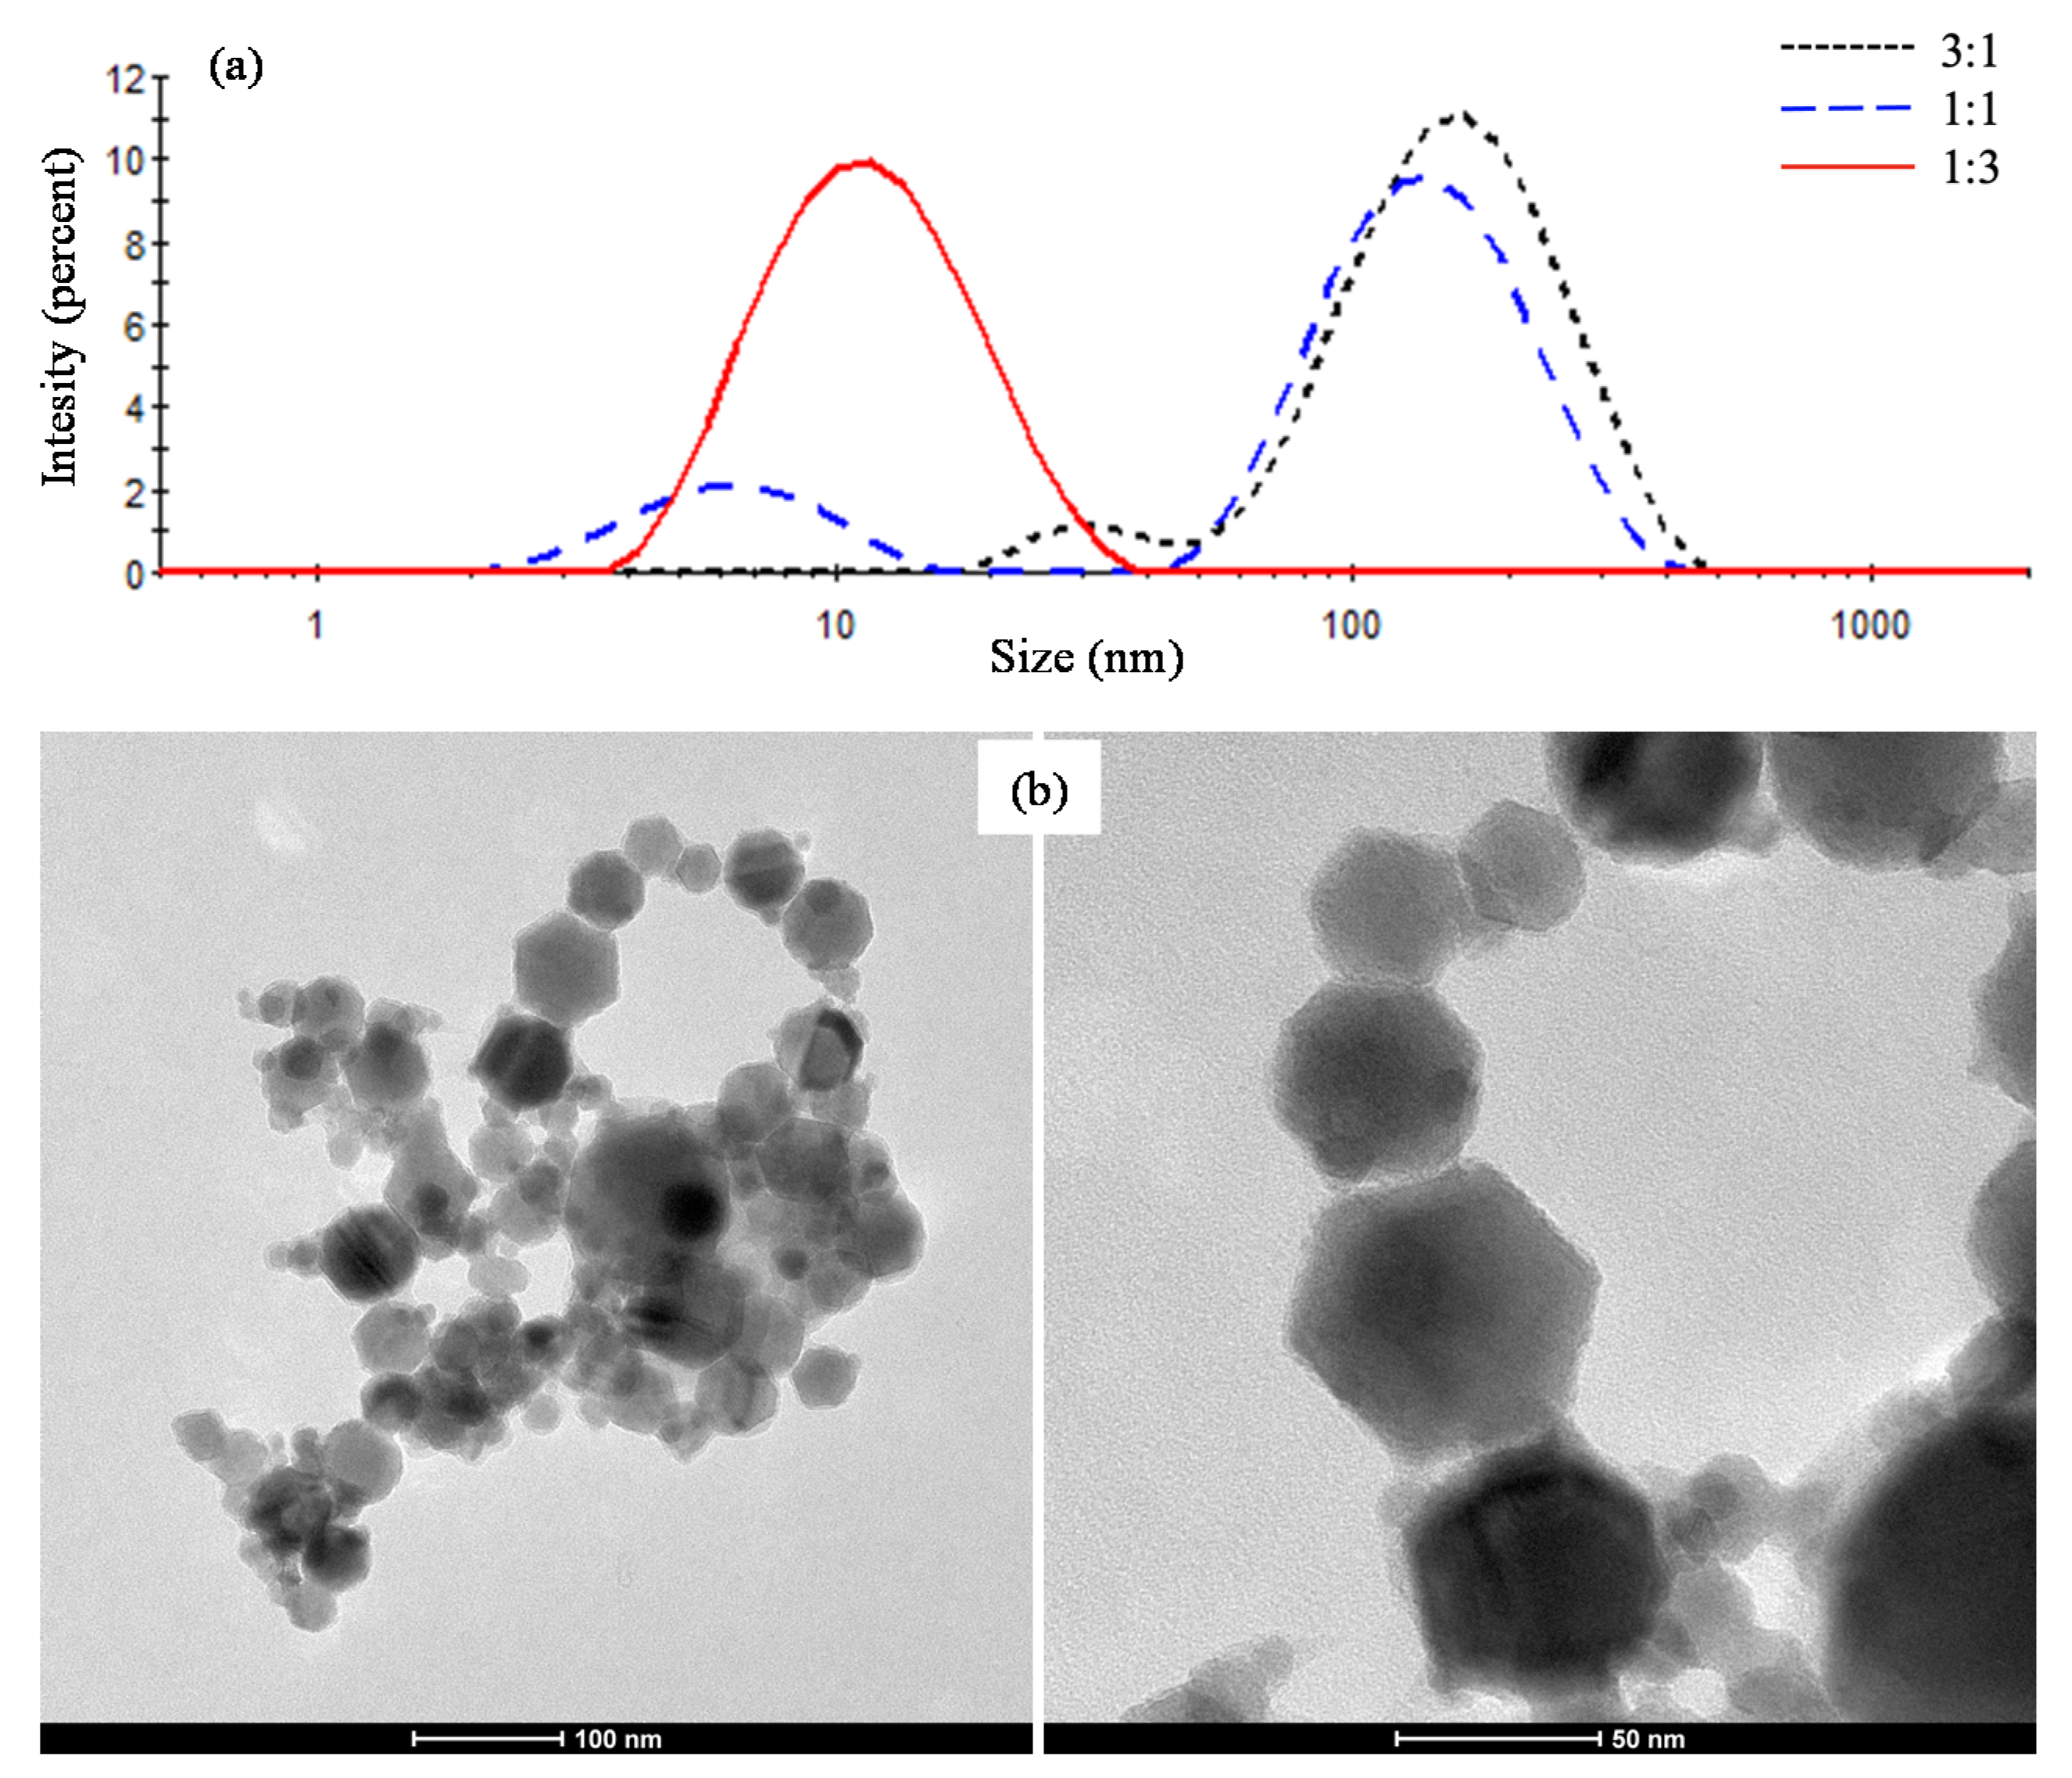
Particle sizes from DLS measurements of CA:PVAm C-dots are given in Table 1 and Figure 2a. CA:PVAm C-dots prepared at 3:1 ratio resulted in bimodal sizes of particles, 168 ± 10 nm with 91.6% intensity of the peak and 31.8 ± 7 nm with 8.4% intensity, showing that most of the particles were present in agglomerated form, as illustrated in Figure 2a. CA:PVAm C-dots prepared with the 1:1 ratio gave different particle size distributions than individual CA:PVAm C-dots (6.6 ± 3 nm, 19.9% intensity) and agglomerated forms (148 ± 10 nm, 80.1% intensity). The best results were obtained for CA:PVAm C-dots prepared with the 1:3 ratio in which a monodisperse particle size distribution was obtained for CA:PVAm C-dots with the sizes of 12.6 ± 6 nm.
The size and shape of N-doped C-dots were analyzed by TEM. Figure 2b shows the TEM images of the C-dot sample prepared from CA:PVAm at 1:3 ratio, which is both in spherical and hexagonal shapes in the size ranges of 10–50 nm.
The FT–IR spectra of both CA:PVAm C-dots and CPs are also compared in Figure 3a and Figure S1b, respectively. Almost similar structures were observed for both CA:PVAm C-dots and CPs. The most striking differences in FT–IR spectra are that the C=O peak decreases at around 1700 cm−1, and the amine peak (NH2 stretching and N–H bending) increases at around 1650, 1540, and 1350 cm−1, as the PVAm ratio increases. Additionally, the C–N–H peaks at 790 cm−1 increased with the increasing PVAm ratio in structure.
Thermogravimetric analysis was administered to follow the thermal stability of CA:PVAm C-dots. Figure 3b represents the thermogravimetric analysis (TGA) and differential thermogravimetric (DTA) curves of CA:PVAm C-dots recorded between 100 °C and 840 °C at the heating rate of 10 °C/min. Minor differences were observed in the degradation profile of CA:PVAm C-dots at the ratio of 3:1 and 1:3 up to around 570 °C. Three-step intervals were displayed in the degradation profile of both CA:PVAm (3:1) and CA:PVAm (1:3) C-dots. The first degradation step occurred in the range of 100–439 °C with weight loss of 34.2% for CA:PVAm (3:1) C-dots and 100–419 °C with weight loss of 31.6% for CA:PVAm (1:3) C-dots. The second degradation continued at two-step intervals: 439–509 °C with 4.8% weight loss and 509–840 °C with 34.9% weight loss for CA:PVAm (3:1) C-dots, 419–481 °C with 4.6% weight loss and 482–840 °C with 46.9% weight loss for CA:PVAm (1:3) C-dots. Additionally, the final weight % at 840 °C was 26.1% for CA:PVAm (3:1) C-dots and 16.9% for CA:PVAm (1:3) C-dots.
The three-step degradation profile of CA:PVAm (1:1) C-dots slightly differed from other C-dots. At the first step of degradation, there is a negligible loss of volatile material between 100 and 168 °C with 1.3% weight loss. The second degradation step took place between 168 and 542 °C with a weight loss of 44.3% in a distinguishable manner. The final degradation step was observed between 544 and 840 °C with 21.1% weight loss. In addition, final weight% at 840 °C was 26.1% for CA:PVAm (3:1), 16.9% for CA:PVAm (1:3), and 33.0% for CA:PVAm (1:1) C-dots.
The XRD patterns for CA:PVAm C-dots in ratios are given in Figure 3c. It is obvious that a broad diffraction peak at about 2θ = 23° for CA:PVAm C-dots are assigned to the turbostratic carbon phase at (002) crystal planes [41]. The relatively decreasing intensity at 2θ = 23° can be explained by the increase in nitrogen content and a relative decrease in carbon ratio. Amorphous phased for CA:PVAm C-dots at 3:1, 1:1, and 1:3 ratios were also determined as 100%, 98.5%, and 97.3%, respectively.
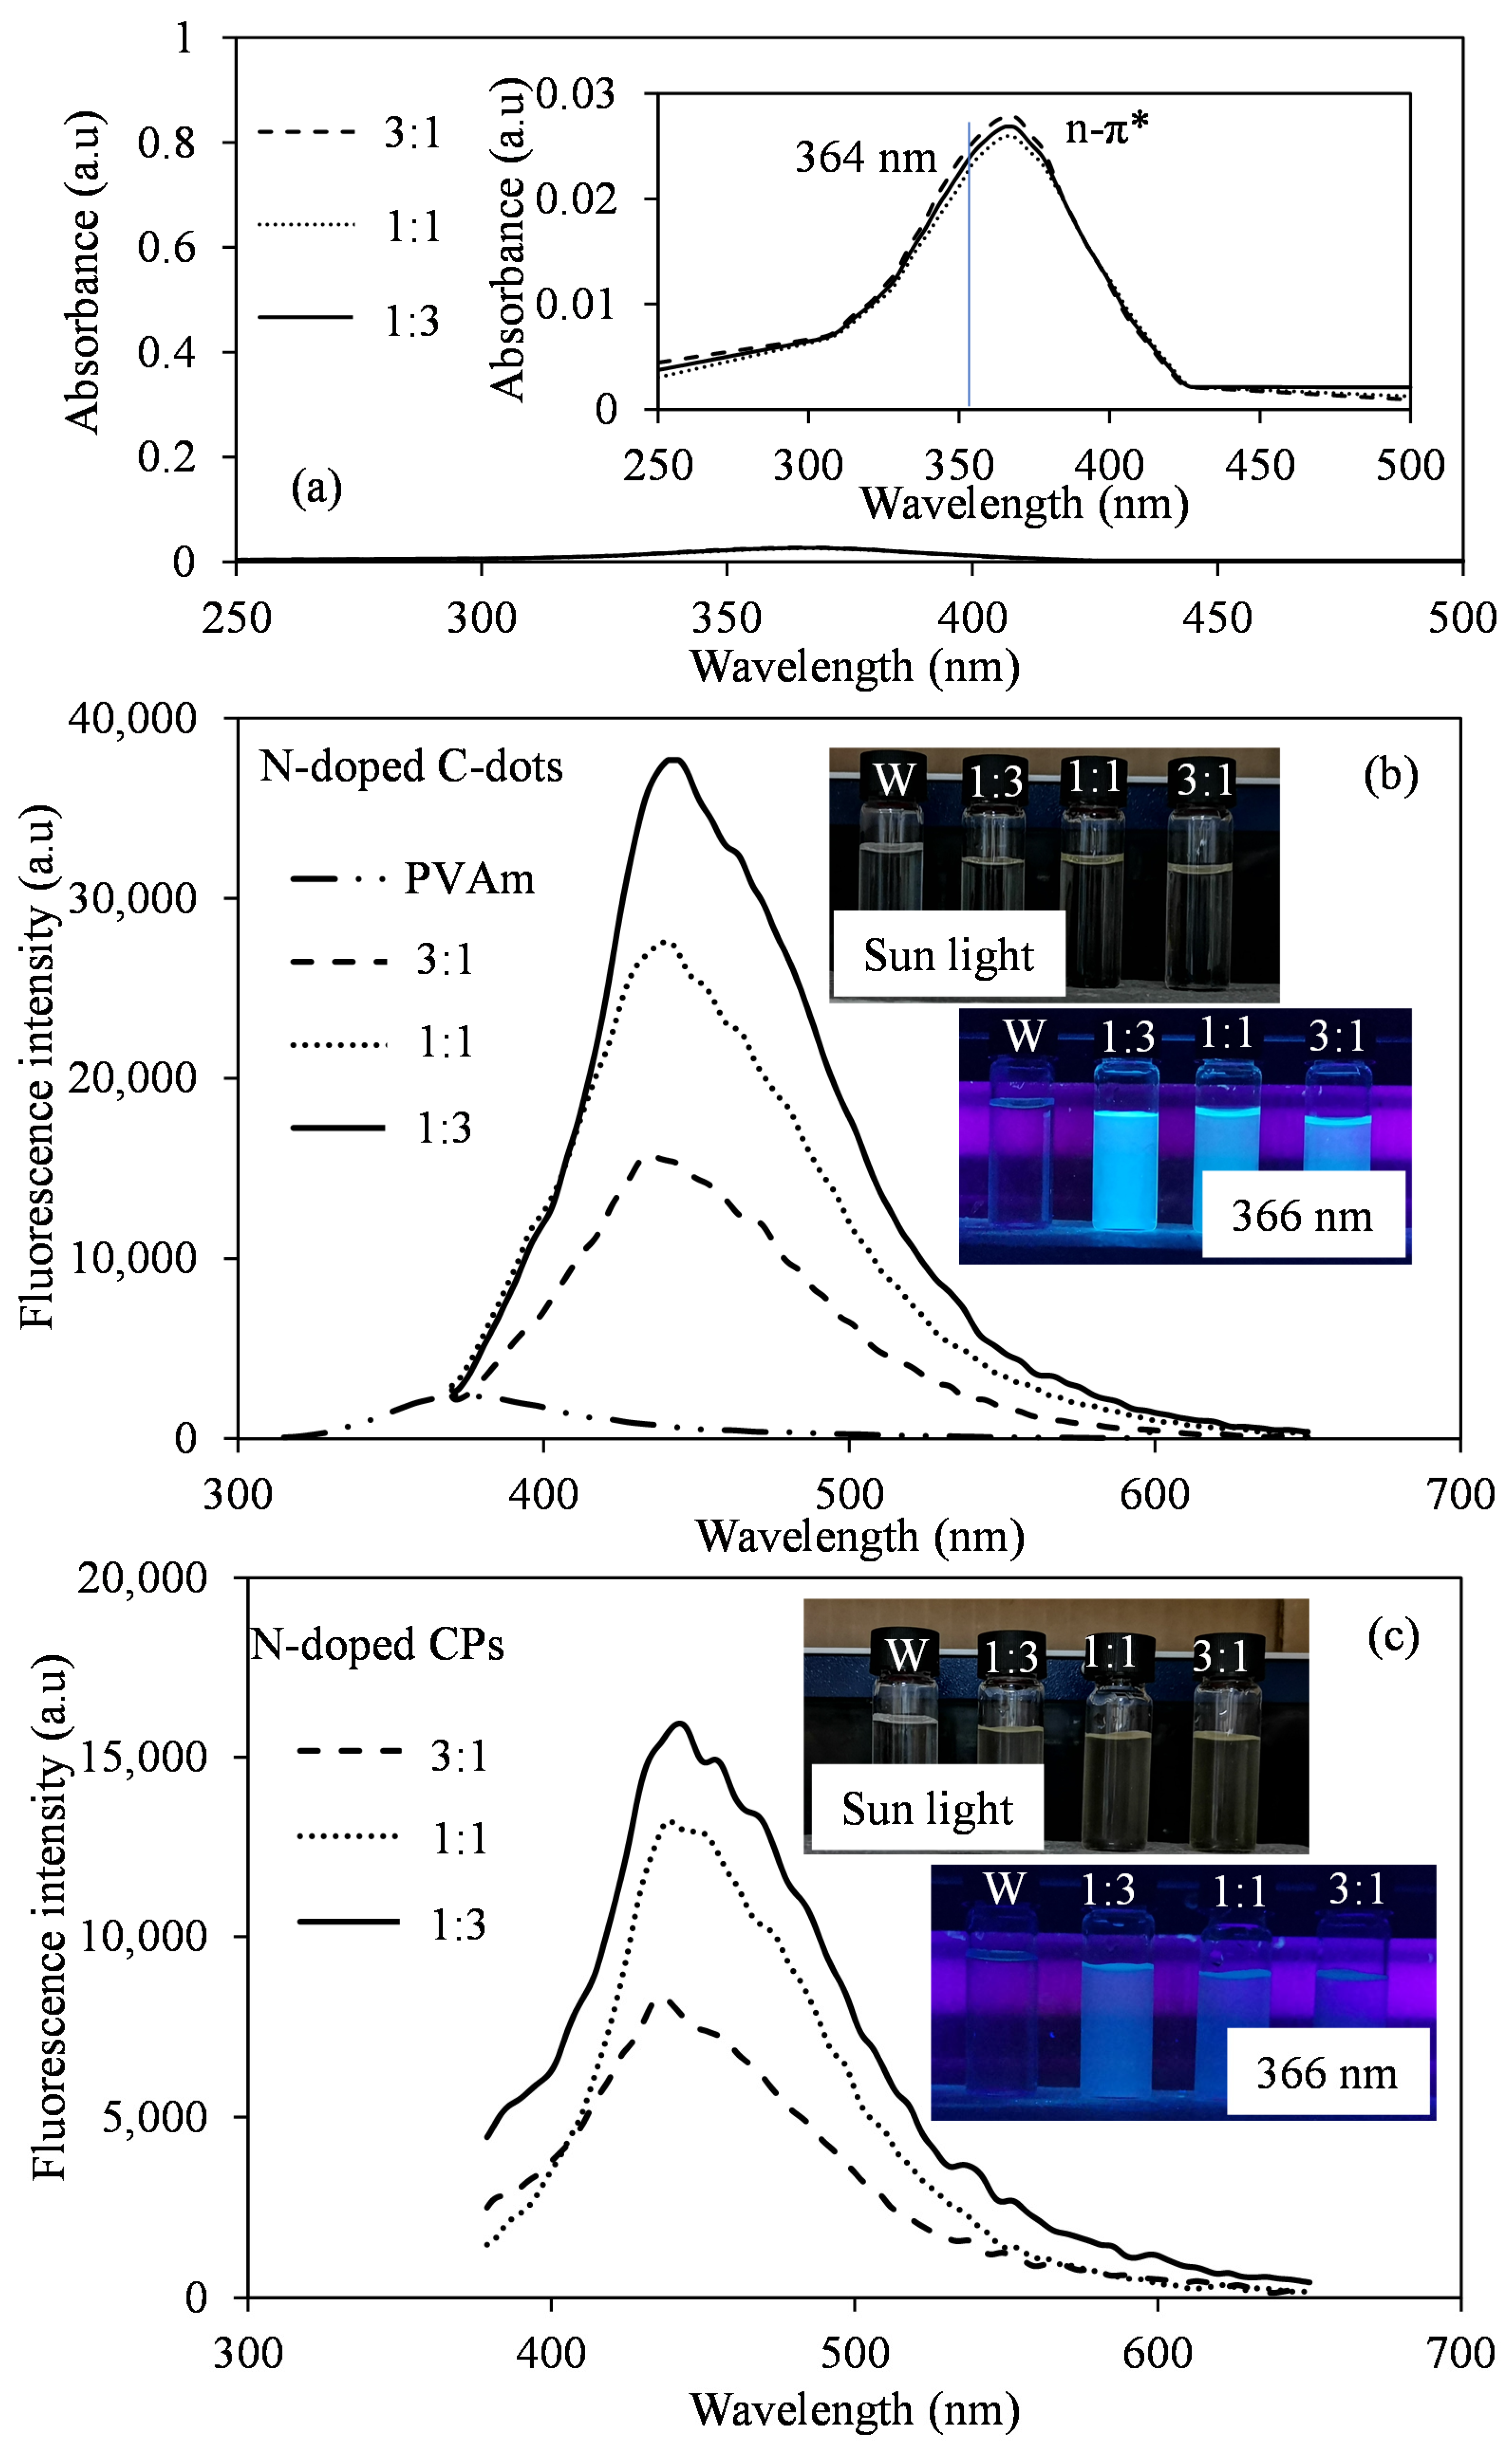
C-dots, one of the relatively newest members of the fluorescent material family, are promising materials with improved optical properties such as low leaching and high stability. The fluorescent behavior of C-dots can be reconciled by their size, crystallinity degree, and functional groups [42,43]. It has been reported in the literature that bare C-dots show low quantum efficiency fluorescence, and their fluorescence properties can be increased by modification and notable functionalization with organic molecules [44]. C-dots with a nitrogen-rich surface exhibit strong fluorescence [45]. Therefore, the CA:PVAm C-dots and CPs are promising materials due to higher primary amine groups of PVAm on chains. The UV–Vis spectra of CA:PVAm C-dots in 3:1, 1:1, and 1:3 w/w ratios are recorded for the determination of excitation wavelength using a fluorescence spectrometer and are given in Figure 4a. The UV–Vis spectra between 300 and 400 nm wavelength related to the n–π* transition of functional groups on the surface [46]. The maximum absorbance values were observed at around 360 nm for all N-doped C-dots. To confirm correct excitation wavelength, the fluorescence emission spectra of CA:PVAm C-dots were scanned between 310 and 400 nm excitation wavelength, and corresponding spectra are given in Figure S3a–c for 3:1, 1:1, and 1:3 w/w ratios of CA:PVAm C-dots, respectively. According to excitation wavelength scanning, it was confirmed that 360 nm is the highest fluorescent intensity observed wavelength and assumed as the correct excitation wavelength.
The PVAm solution showed a fluorescent property at 372 nm wavelength with 2700 fluorescence intensity (302 nm excitation wavelength, 700 V PTM voltage). In Figure 4b, the fluorescent emission spectra of N-doped C-dots at 360 nm excitation wavelength show that fluorescent intensities of N-doped C-dots increased with the increasing amount of PVAm in the structure. N-doped C-dots at 3:1, 1:1, and 1:3 w/w ratios revealed 15,750, 27,550, and 37,680 fluorescent intensity at 434, 439, and 442 nm, respectively. It is clearly seen that the fluorescent intensities are increased, and the emission wavelength shifted (redshift) with the increasing of amounts of nitrogen content, as reported in the literature [47]. The digital camera images of water, and N-doped C-dots under the sunlight and UV light at 366 nm are also given as insets in Figure 4b. The fluorescence emission spectra of N-doped CPs are also given in Figure 4c, and it was observed that the fluorescence intensities of CPs are lower than C-dots. The increase in size decreased the fluorescence intensity of materials. The fluorescence intensities for N-doped CPs in 3:1, 1:1, and 1:3 w/w ratios were determined as 8180, 13,140, and 15,860 at 436, 439, and 442 nm, respectively. A similar redshift with the increase in nitrogen ratio was also observed for N-doped CPs. The comparison of calculated QY% values for both N-doped C-dots and CPs is also summarized in Table 2.
The calculated QY% values for N-doped C-dots were higher than CPs in each ratio, as expected. On the other hand, it was also exhibited that the QY% values increased with the increase in nitrogen ratio in N-doped C-dots, as 20.1 ± 1.3, 33.8 ± 2.1, and 47.5 ± 1.9% for 3:1, 1:1, and 1:3 w/w ratios, respectively. On the other hand, the CPs exhibited lower QY% values due to their bigger size than C-dots. It was calculated as 9.6 ± 0.8, 13.2 ± 1.1, and 17.8 ± 1.3% CPs, respectively. Furthermore, the stability of these N-doped C-dots in physiological conditions was investigated by measuring the change in the fluorescence intensity via fluorescence spectroscopy by keeping N-doped C-dots in PBS at 37 °C. The fluorescent measurements of C-dot-containing solutions were measured after 24 h (at the end of the 1st day) and after 240 h (at end of the 10th day) in PBS. As seen in Figure S4, the intensity and wavelength range of the solutions were not significantly changed. These results clearly support the premise that N-doped C-dots are nondegradable under physiological conditions for up to 10 days.
3.2. Blood Compatibility of N-Doped C-Dots
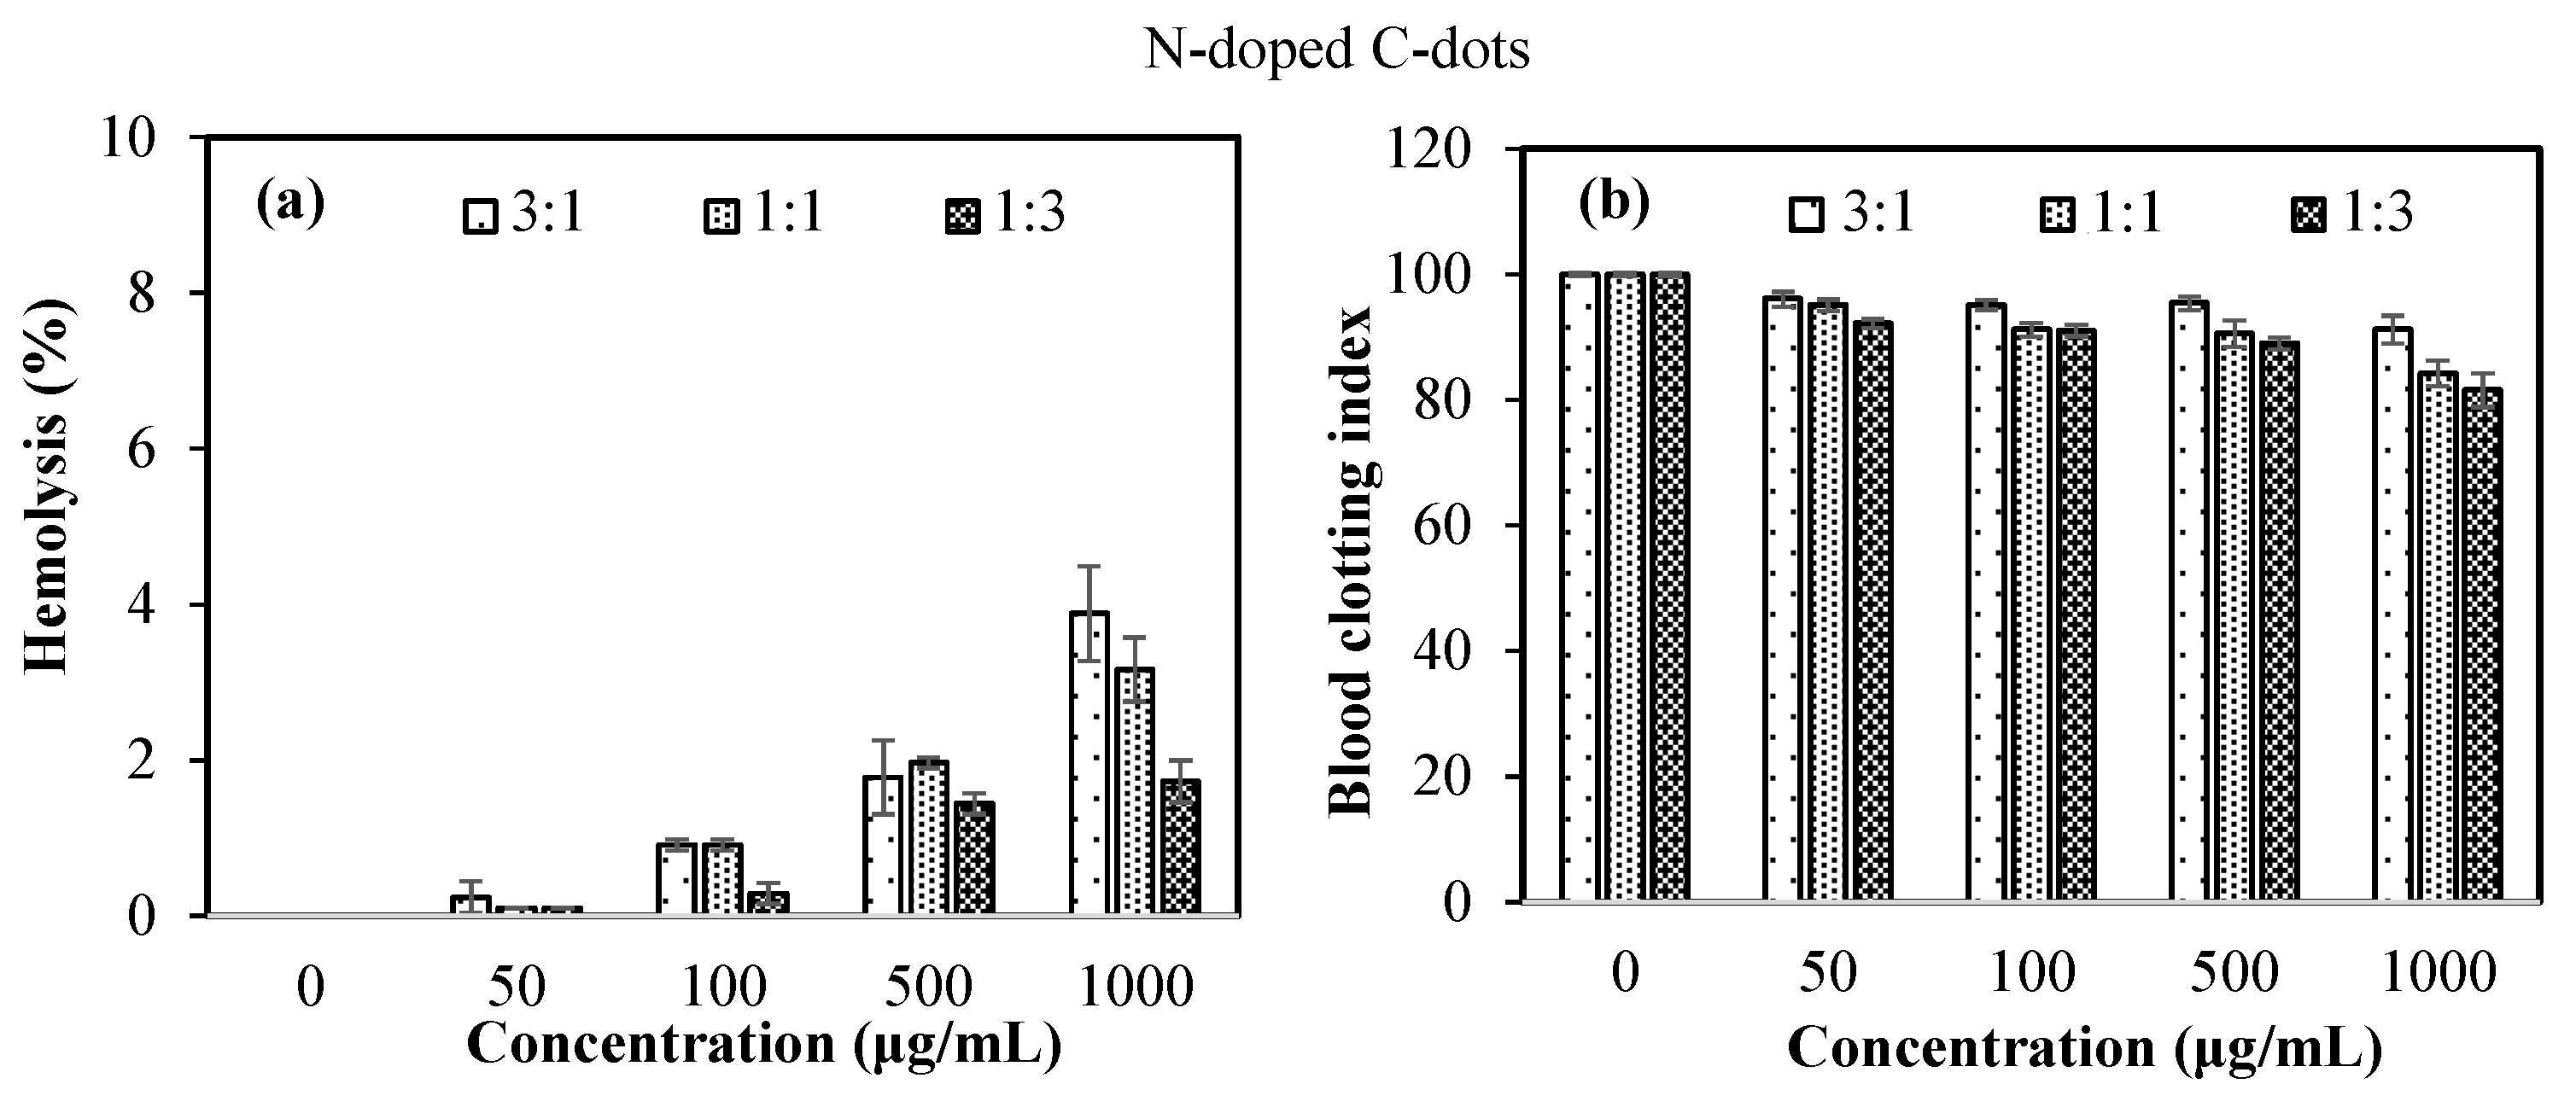
The safety of nanomaterials should be investigated to design materials with biomedical potential for use in intravascular applications. The N-doped C-dots were determined as injectable materials related to nanometer size range and should be directly penetrated through the cells. Blood compatibility of N-doped C-dots was determined by hemolysis= and blood compatibility tests, as illustrated in Figure 5.
Hemolytic ratio up to 5% is considered to be hemocompatible for intravascular use [48]. As can be seen in Figure 5a, all forms of N-doped C-dots show a nonhemolytic range with a maximum of 1.96% hemolysis ratio up to 500 μg/mL concentration. In addition, at a high concentration such as 1000 μg/mL, N-doped C-dots at 3:1 and 1:1 ratios caused slightly hemolytic effects with 3.88 ± 0.61% and 3.16 ± 0.40% hemolysis ratios, respectively, but N-doped C-dots at 1:3 was still nonhemolytic even at 1000 μg/mL concentration. The results of blood compatibility studies of N-doped C-dots revealed that although there is a slight decrease in the hemocompatibility depending on CA ratio in CA:PVAm C-dots, it is needless to say that these materials can be safely used for intravascular applications with up to 500 μg/mL concentration.
The other blood compatibility test as blood clotting indexes of N-doped C-dots is demonstrated in Figure 5b. N-doped C-dots indicate slightly clotting effects on the blood with 91.1 ± 2.2, 84.2 ± 2.0, and 81.5 ± 2.7 blood clotting indexes at 1000 μg/mL concentration of 3:1, 1:1, and 1:3 ratios of CA:PVAm, respectively. These results confirm that the PVAm ratio in the C-dots structure triggers the clotting ability of the N-doped C-dots. Low hemolysis ratio and high blood clotting index values of N-doped C-dots, even at 500 μg/mL concentration, prove the safe use of these materials in blood interacted applications.
3.3. Antimicrobial Activity of N-Doped C-Dots
Antibacterial susceptibility of CA, PVAm, and N-doped C-dots was investigated via two different antimicrobial assays, i.e., disc diffusion and microtiter broth dilution methods against Gram-positive S. aureus and B. subtilis and Gram-negative E. coli and P. aeruginosa. Photographs of inhibition zones and their zone diameter values depend on the bacteria species for CA, PVAm, gentamicin, and CA:PVAm C-dots, which are depicted in Figure 6a,b, respectively.
The inhibition zone diameters of CA and PVAm was found to be 16 ± 2 and 18 ± 1 mm against Gram-positive B. subtilis and 18 ± 1 and 21 ± 2 mm against Gram-negative P. aeruginosa bacteria, respectively. In the killing mechanism, organic acids, e.g., CA, cause membrane damage on the bacteria through intercalation, chelation, or protonation, increase reactive oxygen species (ROS), and inhibit enzymatic ROS scavenging mechanism on aerobic microorganisms [48]. In addition, PVAm with a more cationic surface could inhibit the adhesion and growth of bacteria through highly electrostatic interaction with bacteria surface and membrane [49]. It was also reported that killing of bacteria could be dependent on the destabilization of the bacterial membrane by the ion-exchange effect of divalent Ca2+ and Mg2+ cations with cationic PVAm based materials [50]. It is clear that CA and PVAm have significant antimicrobial effects on Gram-positive and Gram-negative species and the prepared N-doped C-dots that contain different ratios of CA and PVAm could possess potent antibacterial activity based on these two components. Additionally, the effects of CA and PVAm ratio on the antibacterial activity of N-doped C-dots was investigated and given in Figure 6.
It was determined that the 5 mg of 3:1 ratio of N-doped C-dots shows no inhibition ability on each bacteria species because of the less positive surface charge in consequence of low PVAm ratio into the C-dot structure. The antimicrobial ability of N-doped C-dots was significantly increased, depending on the PVAm ratio in N-doped C-dots. As a result, 5 mg of 1:1 and 1:3 ratios of N-doped C-dots were shown to have perfect inhibition ability on B. subtilis, S. aureus, and E. coli with a nearly 20 mm inhibition zone. Moreover, the highest inhibition zone was determined as 22 ± 1 and 23 ± 1 mm against Gram-positive B. subtilis for 5 mg of 1:1 and 1:3 ratios of N-doped C-dots, respectively.
In the other antibacterial method, minimum inhibition concentration (MIC) and minimum bactericidal concentration (MBC) values of CA, PVAm, and N-doped C-dots against Gram-positive and Gram-negative bacteria are given in Table 3 and Table 4.
It is clear that antibacterial propensity of PVAm and CA were almost similar with 0.31, 1.56, 3.12, and 1.56 mg/mL MIC values of PVAm and 0.75, 1.56, 1.56, and 1.56 mg/mL MIC values of CA against B. subtilis, S. aureus, E. coli, and P. aeruginosa, respectively. Similarly, disc diffusion results for the 3:1 ratio of N-doped C-dots revealed less antimicrobial ability, with a high MIC value of 25 mg/mL on each bacteria species and no bactericidal effect. MBC values of 1:1 ratio N-doped C-dots were significantly decreased to 0.75 mg/mL from 6.25 mg/mL for 1:3 ratio of N-doped C-dots against B. subtilis, as seen in Table 3. In addition, the perfect antimicrobial ability was determined for the 1:3 ratio of N-doped C-dots as 3.12 mg/mL of MBC values on Gram-negative E. coli and P. aeruginosa, as shown in Table 4. It is obvious that antibacterial activity of N-doped C-dots was coming from both components and maybe dominantly from the killing effects of cationic PVAm content.
In addition, the antimicrobial activity of 1:3 ratio of N-doped C-dots was similar for B. subtilis, S. aureus, and P. aeruginosa, and slightly higher than PVAm against E. coli. These results show that the C-dot structure could be tuned to enhance the antibacterial potential of C-dots in relation to their nanometer size. Three different killing mechanisms were reported for C-dot-based materials, i.e., (1) through leakage of the bacterial membrane by nanometer size, (2) disruption of the membrane by an increase in hazardous reactive oxygen species (ROS), and (3) interaction of genetic materials of bacteria [51,52].
Furthermore, the highest antibacterial effects were observed against B. subtilis and no significant differences in the other bacteria species were detected. Furthermore, the antimicrobial susceptibility of N-doped C-dots was significantly increased depending on the PVAm ratio of the C-dots structure. It is well-known that Gram-positive and Gram-negative bacteria have a negatively charged membrane surface [53]. Gram-negative bacteria consist of a more negatively charged lipopolysaccharide structure in the outer membrane and polyphosphate backbone resulting from teichoic acid molecules causing negatively surface structures on the cell wall of Gram-positive bacteria [53]. PVAm is a well-known cationic polymer that comprises long-chain primer amine groups [21]. The ratio of PVAm in the C-dots structure can importantly affect the surface characteristics of the prepared C-dots. As provided in Table 1, the zeta potential value of the N-doped C-dots was increased to higher positive values as the amount of PVAm increased. Similarly, antimicrobial susceptibility of N-doped C-dots was significantly improved by increasing PVAm ratio because of the highest electrostatic interaction with negatively charged bacteria cell membrane that can readily disrupt the bacteria membrane. Zhao et al. showed that highly positively charged cationic N-doped C-dots could directly and strongly interact with surface of bacteria, destroying the permeability of the cell wall [54]. In addition, N-doped C-dots exhibited a higher antibacterial susceptibility against Gram-positive species than against Gram-negative bacteria, because of the differences in the cell wall structure of these bacteria. The negatively charged polyphosphate backbone of Gram-positive species in the membrane structure offers high interaction ability with cationic materials, e.g., N-doped C-dots. Moreover, the thicker lipopolysaccharide structure of Gram-negative species acts as a barrier against the antimicrobial agents [54,55]. These membrane structures of Gram-positive and Gram-negative bacteria can play a significant role in the interaction between the bacteria and antibacterial agents since N-doped CA:PVAm C-dots showed stronger inhibition or killing ability against Gram-positive bacteria than against Gram-negative.
3.4. Antibiofilm Activity of CA:PVAm C-Dots
The resistance against antibiotics for many infections caused serious health problems in clinical and industrial applications because of the presence of a biofilm layer protecting these microorganisms. The minimum inhibition concentration (MIC) value of commonly used antibiotics is generally effective in the removal of planktonic bacteria but not enough for inhibition or eradication of the bacteria within the biofilm [56]. Novel antibacterial systems need to be designed for providing antibacterial activity for planktonic cells and for inhibition or eradication of biofilms generated by bacteria to fight resistant infections. Therefore, biofilm inhibition and eradication properties of 1:3 ratio of N-doped C-dots were evaluated on B. subtilis and E. coli species via crystal violet assay, as demonstrated in Figure 7.
The photographs of the wells clearly show that inhibition or eradication ability of N-doped C-dots is dependent on the concentration of the used materials and a high concentration of N-doped C-dots such as 25 mg/mL could totally inhibit or eradicate the biofilms of bacteria. Even a low concentration such as 0.78 mg/mL of N-doped C-dots inhibits more than half of bacterial biofilm for each bacterium. Furthermore, biofilm inhibition% of N-doped C-dots was significantly higher than biofilm eradication% at low concentrations, up to 1.56 mg/mL concentration against E. coli with 30 ± 4 and 76 ± 1 of biofilm% for inhibition and eradication processes, respectively. In addition, N-doped C-dots show more inhibition/eradication ability in Gram-positive B. subtilis than in Gram-negative E. coli.
Li et al. reported that the cationic property of C-dots displays perfect biofilm inhibition activity similar to our results, with charge–charge interactions of highly cationic N-doped C-dots in the mildly acidic biofilm [57]. Another study represented that hydrophilic materials such as N-doped C-dots have more penetration tendency against biofilm and can readily pass through the biofilms and interact with bacteria, taking advantage of its nanoscale size [13]. It is believed that N-doped C-dots are promising materials in the treatment or inhibition of resistant infections.
4. Conclusions
The synthesis of N-doped C-dots was successfully carried out via the hydrothermal method by using PVAm as a nitrogen source. PVAm was prepared from basic hydrolysis of PNVF and used at various ratios of CA as precursors 3:1, 1:1, and 1:3 w/w to prepare C-dots. It was observed that during the synthesis, C-dots and CPs were present after 4 h reaction time in Teflon-lined autoclave at 250 °C. The fluorescence intensity and QY% values of N-doped C-dots were found to be much higher than CPs, as expected, due to their smaller sizes. On the other hand, fluorescence intensity and QY% values of N-doped C-dots and CPs were increased with the increasing amount of nitrogen in the structure. Moreover, N-doped C-dots were found to be blood compatible and safe, even at 500 μg/mL concentration, for potential intravascular applications with a nonhemolytic behavior and no significant effect on the clotting mechanism of blood. Furthermore, these positively charged N-doped C-dots exhibited significant antibacterial activity against Gram-negative and Gram-positive species but more effectively on Gram-positive bacteria such as B. subtilis, as anticipated, due to the possibility of the highest electrostatic interaction. In addition, the PVAm ratio in the CA:PVAm C-dots structure plays a significant role in the killing capacity of the materials since N-doped C-dots at 1:3 ratio of CA:PVAm showed better antibacterial effects against each of the studied bacteria species. Moreover, N-doped C-dots provide a strong ability to protect against a wide range of biofilm-forming bacteria, with mighty biofilm-destroying capabilities. Therefore, C-dots may have significant potential in in vivo biomedical applications as multifunctional biomaterials.
Supplementary Materials
The following are available online at https://0-www-mdpi-com.brum.beds.ac.uk/article/10.3390/c7020040/s1, Figure S1. The FT-IR spectra of (a) NVF, PNVF, and PVAm molecules, and (b) CA:PVAm CPs in various ratios of CA and PVAm, Figure S2. The possible mechanism of synthesis of CA:PVAm Cdots, Figure S3. The fluorescence emission spectra of N-doped C-dots in prepared (a) 3:1, (b) 1:1, and (c) 1:3 w/w ratio of CA:PVAm at various excitation wavelengths, Figure S4. The fluorescence emission spectra of CA-PVAm Cdots at various ratio of CA-PVAm in pH 7.4 PBS solution at 360 nm excitation wavelengths.
Author Contributions
Formal analysis, S.D.S., M.S., S.S.S., S.D., and N.S.; investigation, S.D.S., M.S., S.S.S., S.D., and N.S.; methodology, S.D.S., M.S., S.S.S., and S.D.; writing—original draft preparation, S.D.S., M.S., S.S.S., S.D., and N.S.; conceptualization, O.G. and N.S.; project administration, O.G.; resources, O.G. and N.S.; supervision, O.G. and N.S.; writing—review and editing, O.G. and N.S.; funding acquisition, N.S.; visualization, N.S. All authors have read and agreed to the published version of the manuscript.
Funding
This research received no external funding.
Institutional Review Board Statement
Not applicable.
Informed Consent Statement
Not applicable.
Data Availability Statement
Did not report any data.
Acknowledgments
The authors are thankful to Yildiz Yildirim, Canakkale Seramic LLC for the XRD studies.
Conflicts of Interest
The authors declare no conflict of interest.
References
- Lin, X.; Xiong, M.; Zhang, J.; He, C.; Ma, X.; Zhang, H.; Kuang, Y.; Yang, M.; Huang, Q. Carbon dots based on natural resources: Synthesis and applications in sensors. Microchem. J. 2021, 160, 105604. [Google Scholar] [CrossRef]
- Liu, J.; Li, R.; Yang, B. Carbon Dots: A New Type of Carbon-Based Nanomaterial with Wide Applications. ACS Cent. Sci. 2020, 6, 2179–2195. [Google Scholar] [CrossRef] [PubMed]
- Chung, Y.J.; Kim, J.; Park, C.B. Photonic Carbon Dots as an Emerging Nanoagent for Biomedical and Healthcare Applications. ACS Nano 2020, 14, 6470–6497. [Google Scholar] [CrossRef] [PubMed]
- Uriarte, D.; Vidal, E.; Canals, A.; Domini, C.E.; Garrido, M. Simple-to-use and portable device for free chlorine determination based on microwave-assisted synthesized carbon dots and smartphone images. Talanta 2021, 229, 122298. [Google Scholar] [CrossRef]
- Van Tam, T.; Hur, S.H.; Chung, J.S.; Choi, W.M. Novel paper- and fiber optic-based fluorescent sensor for glucose detection using aniline-functionalized graphene quantum dots. Sens. Actuators B Chem. 2021, 329, 129250. [Google Scholar] [CrossRef]
- Yang, X.; Tian, F.; Wen, S.; Xu, H.; Zhang, L.; Zeng, J. Selective determination of dopamine in pharmaceuticals and human urine using carbon quantum dots as a fluorescent probe. Processes 2021, 9, 170. [Google Scholar] [CrossRef]
- Lee, T.Y.; Jayakumar, T.; Thanasekaran, P.; Lin, K.C.; Chen, H.M.; Veerakumar, P.; Sheu, J.R. Carbon dot nanoparticles exert inhibitory effects on human platelets and reduce mortality in mice with acute pulmonary thromboembolism. Nanomaterials 2020, 10, 1254. [Google Scholar] [CrossRef] [PubMed]
- Rashiya, N.; Padmini, N.; Ajilda, A.A.K.; Prabakaran, P.; Durgadevi, R.; Veera Ravi, A.; Ghosh, S.; Sivakumar, N.; Selvakumar, G. Inhibition of biofilm formation and quorum sensing mediated virulence in Pseudomonas aeruginosa by marine sponge symbiont Brevibacterium casei strain Alu 1. Microb. Pathog. 2021, 150, 104693. [Google Scholar] [CrossRef] [PubMed]
- Parastan, R.; Kargar, M.; Solhjoo, K.; Kafilzadeh, F. Staphylococcus aureus biofilms: Structures, antibiotic resistance, inhibition, and vaccines. Gene Rep. 2020, 20. [Google Scholar] [CrossRef]
- Nguyen, P.T.M.; Nguyen, M.T.H.; Bolhuis, A. Inhibition of biofilm formation by alpha-mangostin loaded nanoparticles against Staphylococcus aureus. Saudi J. Biol. Sci. 2020. [Google Scholar] [CrossRef]
- Kumari, P.; Arora, N.; Chatrath, A.; Gangwar, R.; Pruthi, V.; Poluri, K.M.; Prasad, R. Delineating the biofilm inhibition mechanisms of phenolic and aldehydic terpenes against cryptococcus neoformans. ACS Omega 2019. [Google Scholar] [CrossRef] [PubMed]
- Patil, R.H.; Kalam Khan, F.A.; Jadhav, K.; Damale, M.; Akber Ansari, S.; Alkahtani, H.M.; Ali Khan, A.; Shinde, S.D.; Patil, R.; Sangshetti, J.N. Fungal biofilm inhibition by piperazine-sulphonamide linked Schiff bases: Design, synthesis, and biological evaluation. Arch. Der Pharm. 2018, 351, 1700354. [Google Scholar] [CrossRef] [PubMed]
- Li, P.; Yang, X.; Zhang, X.; Pan, J.; Tang, W.; Cao, W.; Zhou, J.; Gong, X.; Xing, X. Surface chemistry-dependent antibacterial and antibiofilm activities of polyamine-functionalized carbon quantum dots. J. Mater. Sci. 2020, 55, 16744–16757. [Google Scholar] [CrossRef]
- Harroun, S.G.; Lai, J.-Y.; Huang, C.-C.; Tsai, S.-K.; Lin, H.-J. Reborn from the Ashes: Turning Organic Molecules to Antimicrobial Carbon Quantum Dots. ACS Infect. Dis. 2017, 3, 777–779. [Google Scholar] [CrossRef]
- Saravanan, A.; Maruthapandi, M.; Das, P.; Ganguly, S.; Margel, S.; Luong, J.H.T.; Gedanken, A. Applications of N-Doped Carbon Dots as Antimicrobial Agents, Antibiotic Carriers, and Selective Fluorescent Probes for Nitro Explosives. ACS Appl. Bio Mater. 2020, 3, 8023–8031. [Google Scholar] [CrossRef]
- Shi, L.; Berkland, C. Acid-labile polyvinylamine micro- and nanogel capsules. Macromolecules 2007, 40, 4635–4643. [Google Scholar] [CrossRef] [Green Version]
- Chaudhari, S.; Kwon, Y.S.; Moon, M.J.; Shon, M.Y.; Nam, S.E.; Park, Y.I. Poly(vinyl alcohol) and poly(vinyl amine) blend membranes for isopropanol dehydration. J. Appl. Polym. Sci. 2017, 134. [Google Scholar] [CrossRef]
- Zelinskiy, S.N.; Danilovtseva, E.N.; Kandasamy, G.; Pal’Shin, V.A.; Shishlyannikova, T.A.; Krishnan, U.M.; Annenkov, V.V. Poly(vinyl amine) as a matrix for a new class of polymers. e-Polymers 2018, 18, 347–357. [Google Scholar] [CrossRef] [Green Version]
- Achari, A.E.; Coqueret, X.; Lablache-Combier, A.; Loucheux, C. Preparation of polyvinylamine from polyacrylamide: A reinvestigation of the hofmann reaction. Die Makromol. Chem. Macromol. Chem. Phys. 1993, 194, 1879–1891. [Google Scholar] [CrossRef]
- Buys, H.C.W.M.; Vercauteren, F.F.; Van Elven, A.; Tinnernans, A.H.A. Molar fraction of VMAcm Acid hydrolysis of polymers and copolymers of N-vinyl-N-methylacetamide. Recl. Trav. Chim. Pays-Bas 1081, 1088904, 123–127. [Google Scholar]
- Pelton, R. Polyvinylamine: A tool for engineering interfaces. Langmuir 2014, 30, 15373–15382. [Google Scholar] [CrossRef]
- Thaiboonrod, S.; Cellesi, F.; Ulijn, R.V.; Saunders, B.R. One-step preparation of uniform cane-ball shaped water-swellable microgels containing poly (N-vinyl formamide). Langmuir 2012, 28, 5227–5236. [Google Scholar] [CrossRef]
- Illergård, J.; Wågberg, L.; Ek, M. Bacterial-growth inhibiting properties of multilayers formed with modified polyvinylamine. Colloids Surf. B Biointerfaces 2011, 88, 115–120. [Google Scholar] [CrossRef]
- Henschen, J.; Larsson, P.A.; Illergård, J.; Ek, M.; Wågberg, L. Bacterial adhesion to polyvinylamine-modified nanocellulose films. Colloids Surf. B Biointerfaces 2017, 151, 224–231. [Google Scholar] [CrossRef]
- Zhang, T.D.; Deng, X.; Wang, Y.F.; Wang, X.T.; Zhang, X.; Chen, L.L.; Cao, X.; Zhang, Y.Z.; Zhang, C.Y.; Zheng, X.; et al. Layer-by-layer coating of polyvinylamine and dopamine-modified hyaluronic acid inhibits the growth of bacteria and tumor cell lines on the surface of materials. Appl. Surf. Sci. 2020, 530, 147197. [Google Scholar] [CrossRef]
- Gu, L.; Zhu, S.; Hrymak, A.N. Acidic and basic hydrolysis of poly(N-vinylformamide). J. Appl. Polym. Sci. 2002, 86, 3412–3419. [Google Scholar] [CrossRef]
- Gu, L.; Zhu, S.; Hrymak, A.N.; Pelton, R.H. Kinetics and modeling of free radical polymerization of N-vinylformamide. Polymer 2001, 42, 3077–3086. [Google Scholar] [CrossRef]
- Lu, S.; Guo, S.; Xu, P.; Li, X.; Zhao, Y.; Gu, W.; Xue, M. Hydrothermal synthesis of nitrogen-doped carbon dots with real-time live-cell imaging and blood-brain barrier penetration capabilities. Int. J. Nanomed. 2016, 11, 6325–6336. [Google Scholar] [CrossRef] [PubMed] [Green Version]
- Demirci, S.; McNally, A.B.; Ayyala, R.S.; Lawson, L.B.; Sahiner, N. Synthesis and characterization of nitrogen-doped carbon dots as fluorescent nanoprobes with antimicrobial properties and skin permeability. J. Drug Deliv. Sci. Technol. 2020, 59, 101889. [Google Scholar] [CrossRef]
- Zamani, E.; Yahyaei, H.; Zamani, M.; States, U. Evaluation of the Mechanical properties and Blood compatibility of Polycarbonate Urethane and Fluorescent Self-colored Polycarbonate Urethane as Polymeric Biomaterials. J. Polym. Res. 2021, 28, 1–11. [Google Scholar] [CrossRef]
- Sun, B.; Wu, F.; Zhang, Q.; Chu, X.; Wang, Z.; Huang, X.; Li, J.; Yao, C.; Zhou, N.; Shen, J. Insight into the effect of particle size distribution differences on the antibacterial activity of carbon dots. J. Colloid Interface Sci. 2021, 584, 505–519. [Google Scholar] [CrossRef] [PubMed]
- Ran, H.H.; Cheng, X.; Bao, Y.W.; Hua, X.W.; Gao, G.; Zhang, X.; Jiang, Y.-W.; Zhu, Y.-X.; Wu, F.-G. Multifunctional quaternized carbon dots with enhanced biofilm penetration and eradication efficiencies. J Mater Chem B 2019, 7, 5104–5114. [Google Scholar] [CrossRef] [PubMed]
- Li, L.; Liu, D.; Mao, H.; You, T. Multifunctional solid-state electrochemiluminescence sensing platform based on poly(ethylenimine) capped N-doped carbon dots as novel co-reactant. Biosens. Bioelectron. 2017, 89, 489–495. [Google Scholar] [CrossRef] [PubMed]
- Zhong, D.; Cao, Z.; Wu, B.; Zhang, Q.; Wang, G. Polymer dots of DASA-functionalized polyethyleneimine: Synthesis, visible light/pH responsiveness, and their applications as chemosensors. Sens. Actuators B Chem. 2018, 254, 385–392. [Google Scholar] [CrossRef]
- Liu, T.; Dong, J.X.; Liu, S.G.; Li, N.; Lin, S.M.; Fan, Y.Z.; Lei, J.L.; Luo, H.Q.; Li, N.B. Carbon quantum dots prepared with polyethyleneimine as both reducing agent and stabilizer for synthesis of Ag/CQDs composite for Hg2+ ions detection. J. Hazard. Mater. 2017, 322, 430–436. [Google Scholar] [CrossRef]
- Zhou, X.; Pan, Y.; Xu, J.; Wang, A.; Wu, S.; Shen, J. The carbonization of polyethyleneimine: Facile fabrication of N-doped graphene oxide and graphene quantum dots. RSC Adv. 2015, 5, 105855–105861. [Google Scholar] [CrossRef]
- Wang, W.; Wang, B.; Embrechts, H.; Damm, C.; Cadranel, A.; Strauss, V.; Distaso, M.; Hinterberger, V.; Guldi, D.M.; Peukert, W. Shedding light on the effective fluorophore structure of high fluorescence quantum yield carbon nanodots. RSC Adv. 2017, 7, 24771–24780. [Google Scholar] [CrossRef] [Green Version]
- Ogi, T.; Aishima, K.; Permatasari, F.A.; Iskandar, F.; Tanabe, E.; Okuyama, K. Kinetics of nitrogen-doped carbon dot formation via hydrothermal synthesis. New J. Chem. 2016, 40, 5555–5561. [Google Scholar] [CrossRef]
- Wang, L.; Zhou, H.S. Green synthesis of luminescent nitrogen-doped carbon dots from milk and its imaging application. Anal. Chem. 2014, 86, 8902–8905. [Google Scholar] [CrossRef]
- Mudunkotuwa, I.A.; Grassian, V.H. Citric acid adsorption on TiO2 nanoparticles in aqueous suspensions at acidic and circumneutral pH: Surface coverage, surface speciation, and its impact on nanoparticle-nanoparticle interactions. J. Am. Chem. Soc. 2010, 132, 14986–14994. [Google Scholar] [CrossRef]
- Hu, R.; Li, L.; Jin, W.J. Controlling speciation of nitrogen in nitrogen-doped carbon dots by ferric ion catalysis for enhancing fluorescence. Carbon 2017, 111, 133–141. [Google Scholar] [CrossRef]
- Li, W.; Zhang, Z.; Kong, B.; Feng, S.; Wang, J.; Wang, L.; Yang, J.; Zhang, F.; Wu, P.; Zhao, D. Simple and Green Synthesis of Nitrogen-Doped Photoluminescent Carbonaceous Nanospheres for Bioimaging. Angew. Chem. 2013, 125, 8309–8313. [Google Scholar] [CrossRef]
- Niu, W.J.; Li, Y.; Zhu, R.H.; Shan, D.; Fan, Y.R.; Zhang, X.J. Ethylenediamine-assisted hydrothermal synthesis of nitrogen-doped carbon quantum dots as fluorescent probes for sensitive biosensing and bioimaging. Sens. Actuators B Chem. 2015, 218, 229–236. [Google Scholar] [CrossRef]
- Fernando, K.A.S.; Sahu, S.; Liu, Y.; Lewis, W.K.; Guliants, E.A.; Jafariyan, A.; Wang, P.; Bunker, C.E.; Sun, Y.P. Carbon quantum dots and applications in photocatalytic energy conversion. ACS Appl. Mater. Interfaces 2015, 7, 8363–8376. [Google Scholar] [CrossRef] [PubMed]
- Suner, S.S.; Sahiner, M.; Ayyala, R.S.; Bhethanabotla, V.R.; Sahiner, N. Nitrogen-Doped Arginine Carbon Dots and Its Metal Nanoparticle Composites as Antibacterial Agent. C J. Carbon Res. 2020, 6, 58. [Google Scholar] [CrossRef]
- Zhang, Z.; Yi, G.; Li, P.; Zhang, X.; Fan, H.; Zhang, Y.; Wang, X.; Zhang, C. A minireview on doped carbon dots for photocatalytic and electrocatalytic applications. Nanoscale 2020, 12, 13899–13906. [Google Scholar] [CrossRef]
- Holá, K.; Sudolská, M.; Kalytchuk, S.; Nachtigallová, D.; Rogach, A.L.; Otyepka, M.; Zbořil, R. Graphitic Nitrogen Triggers Red Fluorescence in Carbon Dots. ACS Nano 2017, 11, 12402–12410. [Google Scholar] [CrossRef]
- Singhal, J.P.; Ray, A.R. Synthesis of blood compatible polyamide block copolymers. Biomaterials 2002, 23, 1139–1145. [Google Scholar] [CrossRef]
- Kang, J.-W.; Lee, H.-Y.; Kang, D.-H. Synergistic bactericidal effect of hot water with citric acid against Escherichia coli O157:H7 biofilm formed on stainless steel. Food Microbiol. 2021, 95, 103676. [Google Scholar] [CrossRef]
- Chen, C.; Petterson, T.; Illergård, J.; Ek, M.; Wågberg, L. Influence of Cellulose Charge on Bacteria Adhesion and Viability to PVAm/CNF/PVAm-Modified Cellulose Model Surfaces. Biomacromolecules 2019, 20, 2075–2083. [Google Scholar] [CrossRef]
- Li, H.; Huang, J.; Song, Y.; Zhang, M.; Wang, H.; Lu, F.; Huang, H.; Liu, Y.; Dai, X.; Gu, Z.; et al. Degradable Carbon Dots with Broad-Spectrum Antibacterial Activity. ACS Appl. Mater. Interfaces 2018, 10, 26936–26946. [Google Scholar] [CrossRef]
- Chu, X.; Zhang, P.; Wang, Y.; Sun, B.; Liu, Y.; Zhang, Q.; Feng, W.; Li, Z.; Li, K.; Zhou, N.; et al. Near-infrared carbon dot-based platform for bioimaging and photothermal/photodynamic/quaternary ammonium triple synergistic sterilization triggered by single NIR light source. Carbon 2021, 176, 126–138. [Google Scholar] [CrossRef]
- Malanovic, N.; Lohner, K. Gram-positive bacterial cell envelopes: The impact on the activity of antimicrobial peptides. Biochim. Biophys. Acta Biomembr. 2016, 1858, 936–946. [Google Scholar] [CrossRef] [Green Version]
- Zhao, D.; Zhang, R.; Liu, X.; Huang, X.; Xiao, X.; Yuan, L. One-step synthesis of blue–green luminescent carbon dots by a low-temperature rapid method and their high-performance antibacterial effect and bacterial imaging. Nanotechnology 2021, 32, 155101. [Google Scholar] [CrossRef] [PubMed]
- Gottenbos, B.; Grijpma, D.W.; Van Der Mei, H.C.; Feijen, J.; Busscher, H.J. Antimicrobial effects of positively charged surfaces on adhering Gram-positive and Gram-negative bacteria. J. Antimicrob. Chemother. 2001, 48, 7–13. [Google Scholar] [CrossRef]
- Thieme, L.; Hartung, A.; Tramm, K.; Klinger-Strobel, M.; Jandt, K.D.; Makarewicz, O.; Pletz, M.W. MBEC Versus MBIC: The Lack of Differentiation between Biofilm Reducing and Inhibitory Effects as a Current Problem in Biofilm Methodology. Biol. Proced. Online 2019, 21, 1–5. [Google Scholar] [CrossRef] [PubMed]
- Li, P.; Liu, S.; Yang, X.; Du, S.; Tang, W.; Cao, W.; Zhou, J.; Gong, X.; Xing, X. Low-drug resistance carbon quantum dots decorated injectable self-healing hydrogel with potent antibiofilm property and cutaneous wound healing. Chem. Eng. J. 2021, 403, 126387. [Google Scholar] [CrossRef]
Figure 1.
(a) The schematic presentation of the synthesis process of Ndoped C-dots and CPs and (b) pH vs. Zeta potential measurements of N-doped C-dots.
Figure 1.
(a) The schematic presentation of the synthesis process of Ndoped C-dots and CPs and (b) pH vs. Zeta potential measurements of N-doped C-dots.

Figure 2.
(a) Particle size distributions of N-doped C-Dots by DLS measurements and (b) TEM images of N-doped C-dots with 1:3 CA:PVAm ratio.
Figure 2.
(a) Particle size distributions of N-doped C-Dots by DLS measurements and (b) TEM images of N-doped C-dots with 1:3 CA:PVAm ratio.

Figure 3.
The (a) FT-IR spectra, (b) TGA thermograms, and (c) XRD patterns of N-doped C-dots at different ratios of CA:PVAm precursors.
Figure 3.
The (a) FT-IR spectra, (b) TGA thermograms, and (c) XRD patterns of N-doped C-dots at different ratios of CA:PVAm precursors.

Figure 4.
(a)The UV–Vis spectra of N-doped C-dots, and fluorescence emission spectra of (b) N-doped C-dots (inset: their corresponding digital photograph images under the sunlight and 366 nm UV light) and (c) N-doped CPs (inset: their corresponding digital photograph images under the sunlight and 366 nm UV light).

Figure 5.
(a) Hemolysis and (b) blood clotting indexes of N-doped C-dots prepared at 3:1, 1:1, and 1:3 weight ratios of CA:PVAm.
Figure 5.
(a) Hemolysis and (b) blood clotting indexes of N-doped C-dots prepared at 3:1, 1:1, and 1:3 weight ratios of CA:PVAm.

Figure 6.
(a) Photographs of 50 μL, 100 mg/mL (5 mg) CA, PVAm, and N-doped C-dots at three ratios of 3:1, 1:1, and 1:3 against B. subtilis, S. aureus, E. coli, and P. aeruginosa according to disc diffusion assay and (b) their inhibition zone diameters (mm). Gentamicin at 20 μL, 1 mg/mL (0.02 mg) was used as a control.

Figure 7.
The photographs and inhibition and eradication% of biofilms generated by (a) B. subtilis and (b) E. coli treated with by N-doped C-dots prepared by CA:PVAm at 1:3 weight ratio using crystal violet assay.
Figure 7.
The photographs and inhibition and eradication% of biofilms generated by (a) B. subtilis and (b) E. coli treated with by N-doped C-dots prepared by CA:PVAm at 1:3 weight ratio using crystal violet assay.


Table 1.
Zeta potential, size, and polydispersity (PDI) values of CA:PVAm C-dots and CPs.
| Sample | Zeta Potential (mV) | Particle Size (d.nm) | PDI | ||||
|---|---|---|---|---|---|---|---|
| Peak 1 | %Int | Peak 2 | %Int | ||||
| N-doped C-dots | 3:1 | 27.4 ± 0.5 | 168 ± 10 | 91.6 | 31.8 ± 7 | 8.4 | 0.329 |
| 1:1 | 27.2 ± 0.6 | 148 ± 10 | 80.1 | 6.6 ± 3 | 19.9 | 0.258 | |
| 1:3 | 29.7 ± 0.1 | 12.6 ± 6 | 100 | - | - | 0.309 | |
| CPs | 3:1 | 26.4 ± 0.4 | 1422 ± 40 | 0.447 | |||
| 1:1 | 8.4 ± 0.1 | 951 ± 4 | 0.608 | ||||
| 1:3 | 35 ± 0.5 | 1218 ± 72 | 0.714 | ||||
Table 2.
The effect of size and nitrogen ratio on QY of N-doped C-dots and CPs.
| % | Ratio | CA:PVAm | |
|---|---|---|---|
| N-Doped C-Dots | CPs | ||
| QY | 3:1 | 20.1 ± 1.3 | 9.6 ± 0.8 |
| 1:1 | 33.8 ± 2.1 | 13.2 ± 1.1 | |
| 1:3 | 47.5 ± 1.9 | 17.8 ± 1.3 | |
Table 3.
Minimum inhibition concentration (MIC) and minimum bactericidal concentration (MBC) of CA, PVAm, and N-doped C-dots prepared at 3:1, 1:1, and 1:3 ratios against B. subtilis and S. aureus Gram-positive bacteria according to microtiter dilution assay. Gentamicin was used as a control.
Table 3.
Minimum inhibition concentration (MIC) and minimum bactericidal concentration (MBC) of CA, PVAm, and N-doped C-dots prepared at 3:1, 1:1, and 1:3 ratios against B. subtilis and S. aureus Gram-positive bacteria according to microtiter dilution assay. Gentamicin was used as a control.
| N-Doped C-Dots | B. subtilis | S. aureus | ||
|---|---|---|---|---|
| MIC (mg/mL) | MBC (mg/mL) | MIC (mg/mL) | MBC (mg/mL) | |
| CA | 0.75 | 1.56 | 1.56 | 3.12 |
| PVAm | 0.31 | 1.56 | 1.56 | 3.12 |
| 3:1 | 25.0 | N.D. | 25.0 | N.D. |
| 1:1 | 3.12 | 6.25 | 1.56 | 6.25 |
| 1:3 | 0.75 | 0.75 | 1.56 | 3.12 |
| Gentamicin | 0.001 | 0.002 | 0.001 | 0.002 |
Table 4.
Minimum inhibition concentration (MIC) and minimum bactericidal concentration (MBC) of CA, PVAm, and N-doped C-dots prepared at 3:1, 1:1, and 1:3 ratios against E. coli and P. aeruginosa Gram-negative bacteria according to microtiter dilution assay. Gentamicin was used as a control.
Table 4.
Minimum inhibition concentration (MIC) and minimum bactericidal concentration (MBC) of CA, PVAm, and N-doped C-dots prepared at 3:1, 1:1, and 1:3 ratios against E. coli and P. aeruginosa Gram-negative bacteria according to microtiter dilution assay. Gentamicin was used as a control.
| N-Doped C-Dots | E. coli | P. aeruginosa | ||
|---|---|---|---|---|
| MIC (mg/mL) | MBC (mg/mL) | MIC (mg/mL) | MBC (mg/mL) | |
| CA | 1.56 | 3.12 | 1.56 | 3.12 |
| PVAm | 3.12 | 12.5 | 1.56 | 3.12 |
| 3:1 | 25.0 | N.D. | 25.0 | N.D. |
| 1:1 | 1.56 | 6.25 | 1.56 | 3.12 |
| 1:3 | 1.56 | 3.12 | 1.56 | 3.12 |
| Gentamicin | 0.002 | 0.002 | 0.004 | 0.004 |
Publisher’s Note: MDPI stays neutral with regard to jurisdictional claims in published maps and institutional affiliations. |
© 2021 by the authors. Licensee MDPI, Basel, Switzerland. This article is an open access article distributed under the terms and conditions of the Creative Commons Attribution (CC BY) license (https://creativecommons.org/licenses/by/4.0/).
Share and Cite
MDPI and ACS Style
Sutekin, S.D.; Sahiner, M.; Suner, S.S.; Demirci, S.; Güven, O.; Sahiner, N. Poly(Vinylamine) Derived N-Doped C-Dots with Antimicrobial and Antibiofilm Activities. C 2021, 7, 40. https://0-doi-org.brum.beds.ac.uk/10.3390/c7020040
AMA Style
Sutekin SD, Sahiner M, Suner SS, Demirci S, Güven O, Sahiner N. Poly(Vinylamine) Derived N-Doped C-Dots with Antimicrobial and Antibiofilm Activities. C. 2021; 7(2):40. https://0-doi-org.brum.beds.ac.uk/10.3390/c7020040
Chicago/Turabian StyleSutekin, Semiha Duygu, Mehtap Sahiner, Selin Sagbas Suner, Sahin Demirci, Olgun Güven, and Nurettin Sahiner. 2021. "Poly(Vinylamine) Derived N-Doped C-Dots with Antimicrobial and Antibiofilm Activities" C 7, no. 2: 40. https://0-doi-org.brum.beds.ac.uk/10.3390/c7020040
Note that from the first issue of 2016, this journal uses article numbers instead of page numbers. See further details here.