
Variable Temperature Synthesis of Tunable Flame-Generated Carbon Nanoparticles
by
 , , and
Francesca Picca
1 ,
,
Angela Di Pietro
1,
Mario Commodo
2,*,
Patrizia Minutolo
2,* and
Andrea D’Anna
1 1
Dipartimento di Ingegneria Chimica, dei Materiali e della Produzione Industriale, Università degli Studi di Napoli “Federico II”, P.le Tecchio 80, 80125 Napoli, Italy
2
Istituto di Scienze e Tecnologie per l’Energia e la Mobilità Sostenibili, Consiglio Nazionale delle Ricerche, P.le Tecchio 80, 80125 Napoli, Italy
*
Authors to whom correspondence should be addressed.
C 2021, 7(2), 44; https://0-doi-org.brum.beds.ac.uk/10.3390/c7020044
Submission received: 15 April 2021
/
Revised: 29 April 2021
/
Accepted: 1 May 2021
/
Published: 6 May 2021
(This article belongs to the Collection Feature Papers in the Science and Engineering of Carbons)
Abstract
:In this study, flame-formed carbon nanoparticles of different nanostructures have been produced by changing the flame temperature. Raman spectroscopy has been used for the characterization of the carbon nanoparticles, while the particle size has been obtained by online measurements made by electrical mobility analysis. The results show that, in agreement with recent literature data, a large variety of carbon nanoparticles, with a different degree of graphitization, can be produced by changing the flame temperature. This methodology allows for the synthesis of very small carbon nanoparticles with a size of about 3–4 nm and with different graphitic orders. Under the perspective of the material synthesis process, the variable-temperature flame-synthesis of carbon nanoparticles appears as an attractive procedure for a cost-effective and easily scalable production of highly tunable carbon nanoparticles.

1. Introduction
The scientific interest on the formation and characterization of soot from fuel-rich combustion processes has been historically motivated by mainly two factors: their environmental impact when released into the atmosphere, particularly their effects on climate change [1,2], and their negative effects on human health, especially when generated at the nanoscale level [3,4,5]. However, the formation of carbon nanoparticles from combustion and pyrolytic processes, commonly referred to as carbon black, has also attracted remarkable interest as a material for a long time, and many industrial applications are indeed available [6]. Practical applications for carbon nanoparticles, CNPs, are numerous, and to date many documented routes for their preparation have been proposed. Candle soot, for instance, has attracted much attention in recent years, mostly originating from the pioneering work of Liu et al. [7], which showed for the first time the use of candle soot as a source material for the preparation of photoluminescent CNPs. Other reported applications include the use of soot as a hole extractor layer in perovskite solar cells [8], electron acceptor material in blends with poly (3-hexylthiophene) (P3HT) for organic solar cells [9], anode material in high-rate lithium-ion batteries [10], or use as a supercapacitor electrode material [11]. The technological applications of soot CNPs are thus manifold and span from their use in optoelectronic devices, such as material for the energy and environmental sectors, to the realization of active coatings for sensing [12,13], surface wettability modification [14,15,16] and water purification [17,18], or coatings with customized anti-icing and antimicrobial performances [19]. Mulay et al. [20] recently reviewed the preparation and usage of candle soot for a large variety of applications.
The preparation methods for CNPs can be conveniently divided into two categories. “Top-down” routes, including laser ablation, arc discharge, and chemical and electrochemical oxidation of large carbon-based structures are to date among the most commonly implemented. Alternative routes for CNP synthesis are gas-to-particles “bottom-up” processes [21,22], which as a part of the soot formation process, starting from gas-phase precursors, produce particles that can be intercepted during the growth process or can be altered by acting on the combustion operative parameters to achieve particle property tunability. In this regard, flames appear as very attractive “reactors” for the controlled synthesis of highly tunable CNPs, owing to their simplicity and energy saving. Particularly, laminar premixed flames, because of their one-dimensionality and the absence of the complexity of coupling fluid dynamic and kinetics, easily allow one to control the property of the produced particles by selecting the main operative parameters. Indeed, owing to the vast literature on the soot formation process, it is well established that the fuel chemical composition, residence time, pressure, and temperature are all important parameters in controlling the shape, i.e., size, and properties of the soot particles [23,24,25,26].
Depending on the flame characteristics and particle sampling conditions, the size of flame-formed CNPs, namely soot nanoparticles, can range from a few nanometers, typically 2–3 nm, up to tens of nanometers [27,28,29,30,31,32]. Additionally, particle physicochemical properties, including optical, electrical, and electronic properties, have been shown to vary as a function of the residence time, the fuel composition, and the flame stoichiometry [33,34,35,36,37,38]. All these properties are strongly related to the nanostructure of the generated CNPs and in particular to the size of the aromatic constituents and to the structural order within the particle. In this respect, several earlier works have demonstrated that soot particles generated under most of the laboratory flame configurations are mainly composed of polycyclic aromatic hydrocarbons (PAHs) of moderate size. They have about the size of coronene to ovalene [39,40,41,42,43,44], with an average lateral size of the order of 0.8–1.0 nm that shows a rather small dependency on the abovementioned combustion operative parameters. However, very recently, Camacho and coworkers [45,46] reported a remarkable change in the graphitization degree of flame-generated CNPs under a relatively higher flame temperature as compared to most of the flames used in earlier studies.
The possibility of tuning particle properties by a fine control of the flame temperature is of great relevance from a practical standpoint, being an alternative and more advantageous method with respect to post-processing technologies, which are more energy- and time-consuming. In light of this, there is still a need for new research to fully understand the 3–4 nm between chemico-physical particle modification and flame temperature increase.
In this study, CNPs with average size of 3–4 nm, were generated in flames under very different flame temperature conditions, from 1700 K to 2000 K, and have been characterized in terms of particle size and nanostructures. The obtained results are in agreement with those recently reported in [45,46], thus paving the way for the possibility, by a direct gas-to-particles flame synthesis process, to generate highly tunable CNPs with a precise control of the size and of the optical, electronical, and electrical properties.
2. Materials and Methods
Different CNPs, generated from four laminar premixed ethylene/air flames stabilized on a water-cooled McKenna burner (Holthuis & Associates, Sebastopol, CA, USA), were analyzed in this work. A summary of the flame conditions is reported in Table 1. Two flames were characterized by a C/O = 0.67, corresponding to an equivalence ratio, φ, of 2.01, and a gas velocity of 9.8 cm/s. In the first flame, the feed gas mixture was at ambient temperature, while in the second flame the gases were preheated before they were mixed and entered into the burner.
Conversely, the other two flames were characterized by a slightly higher C/O, specifically C/O = 0.69 and C/O = 0.71, corresponding to an equivalence ratio, φ, of 2.07 and 2.13, respectively. These flame conditions were set by fixing the flow rate of unburned gas in order to have a gas velocity of 20 cm/s. Again, the gases were preheated before they were mixed and entered into the burner.
The flame temperature was measured by an R-type thermocouple (Pt/Pt-13%Rh) with a spherical junction with a diameter of 300 mm using a fast-insertion procedure. The flame temperatures were corrected for radiation losses following the procedure reported elsewhere [47].
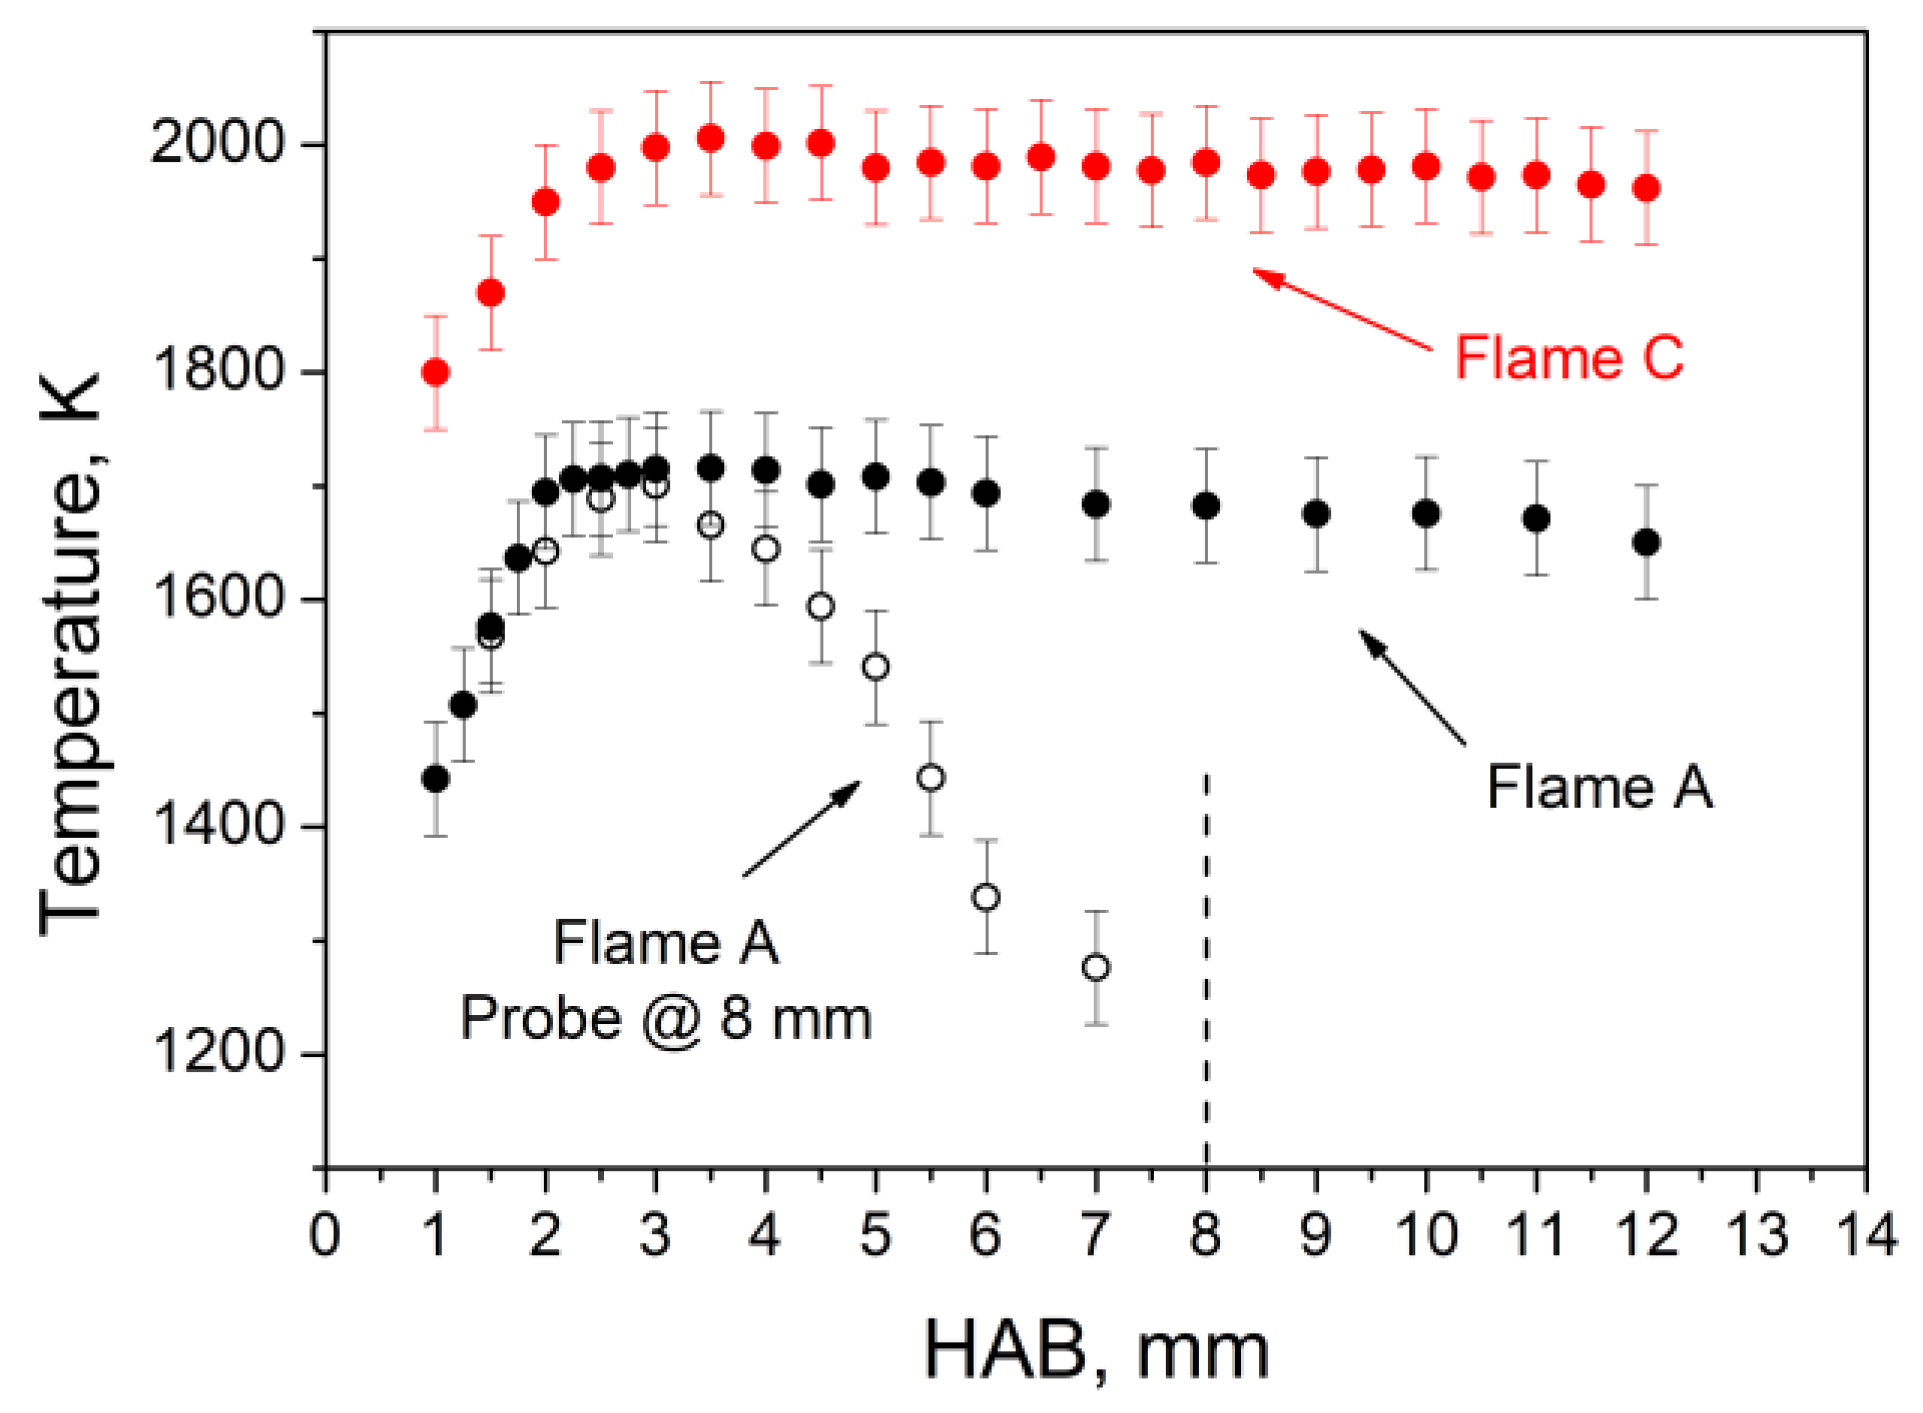
The first flame, referred to as Flame A, which is the one not subjected to gas preheating, reaches a maximum flame temperature of 1720 ± 50 K at a height above the burner (HAB) of 3 mm. The second flame, referred to as Flame B, is similar to the previous one, with the application of a preheating of the feed gases, thus leading to a maximum flame temperature of 1820 ± 50 K at HAB = 3.5 mm. The temperature of the flame with C/O = 0.69 is the highest, reaching a maximum value of 2006 ± 50 K at a height of 3.5 mm above the burner; it is referred to as Flame C. Ultimately, the flame with C/O = 0.71, namely Flame D, arrives at a maximum of 1984 ± 50 K at a height of 4.0 mm. The high gas velocity and feed gas preheating, which were constantly monitored, allowed one to reach high temperature values. Figure 1 reports the entire temperature profiles for two flames: the one with the highest temperature (Flame C) and the one with the lowest temperature (Flame A). The latter was measured with and without the presence of the probe for CNP sampling inside.
CNPs were analyzed by using online and ex-situ measurements. The online sizing of CNPs was performed by the Differential Mobility Analysis (DMA). CNPs were withdrawn from the flame by a horizontally positioned tubular probe (1 cm outer diameter, 0.05 cm thickness) with a small downwards orifice (diameter = 0.2 mm). The sampled aerosol flow was immediately diluted by a flux of N2 in the probe, thus ensuring a dilution ratio of the order of 1:3000; in this way, particle coagulation and mass growth in the sampling line were prevented. The used scanning mobility particle sizer (SMPS) spectrometer (TSI Incorporated, Shoreview, MN, USA) consisting in an X-ray charger (Model 3088), an electrostatic classifier (Model 3082), and an ultrafine condensation particle counter (Model 3776). The aerosol flow was set at 1.5 L/min, the sheath flow at 15 L/min, and the measured particle sizes were in the 1.98–65-nm range.
A similar sampling system was used to collect CNPs on quartz filters (QMA, with a diameter of 25 mm by Whatman plc, Buckinghamshire, UK) for the offline Raman spectroscopy characterization. Specifically, the probe utilized for the sampling of particles had a larger orifice (diameter = 0.6 mm). Downstream of the tubular probe, the stainless-steel aerosol filter holder was positioned. On the base of the size distribution measurements, the tubular probe was placed at the appropriate distance from the burner to collect CNPs of approximately 3–4 nm in diameter.
Raman spectroscopy of the CNPs-loaded quartz filters was performed using a XploRA Raman microscope (Horiba, Ltd. Kyoto, Japan) equipped with a NA 0.9 100× objective (Olympus corporation, Tokyo, Japan). The laser source was a frequency-doubled Nd:YAG laser (λ = 532 nm). The laser beam power, exposure time, and other instrumental parameters were selected to avoid structural changes in the sample due to thermal effects and to ensure the best resolution. Spectra were obtained by keeping the laser beam power density constant for all the measurements and by using the accumulation and exposure time of five cycles of 30 s each. A total of five spots were randomly selected for each filter in order to obtain statistically relevant Raman spectroscopy results data. The obtained spectra were baseline corrected and normalized.
3. Results and Discussion
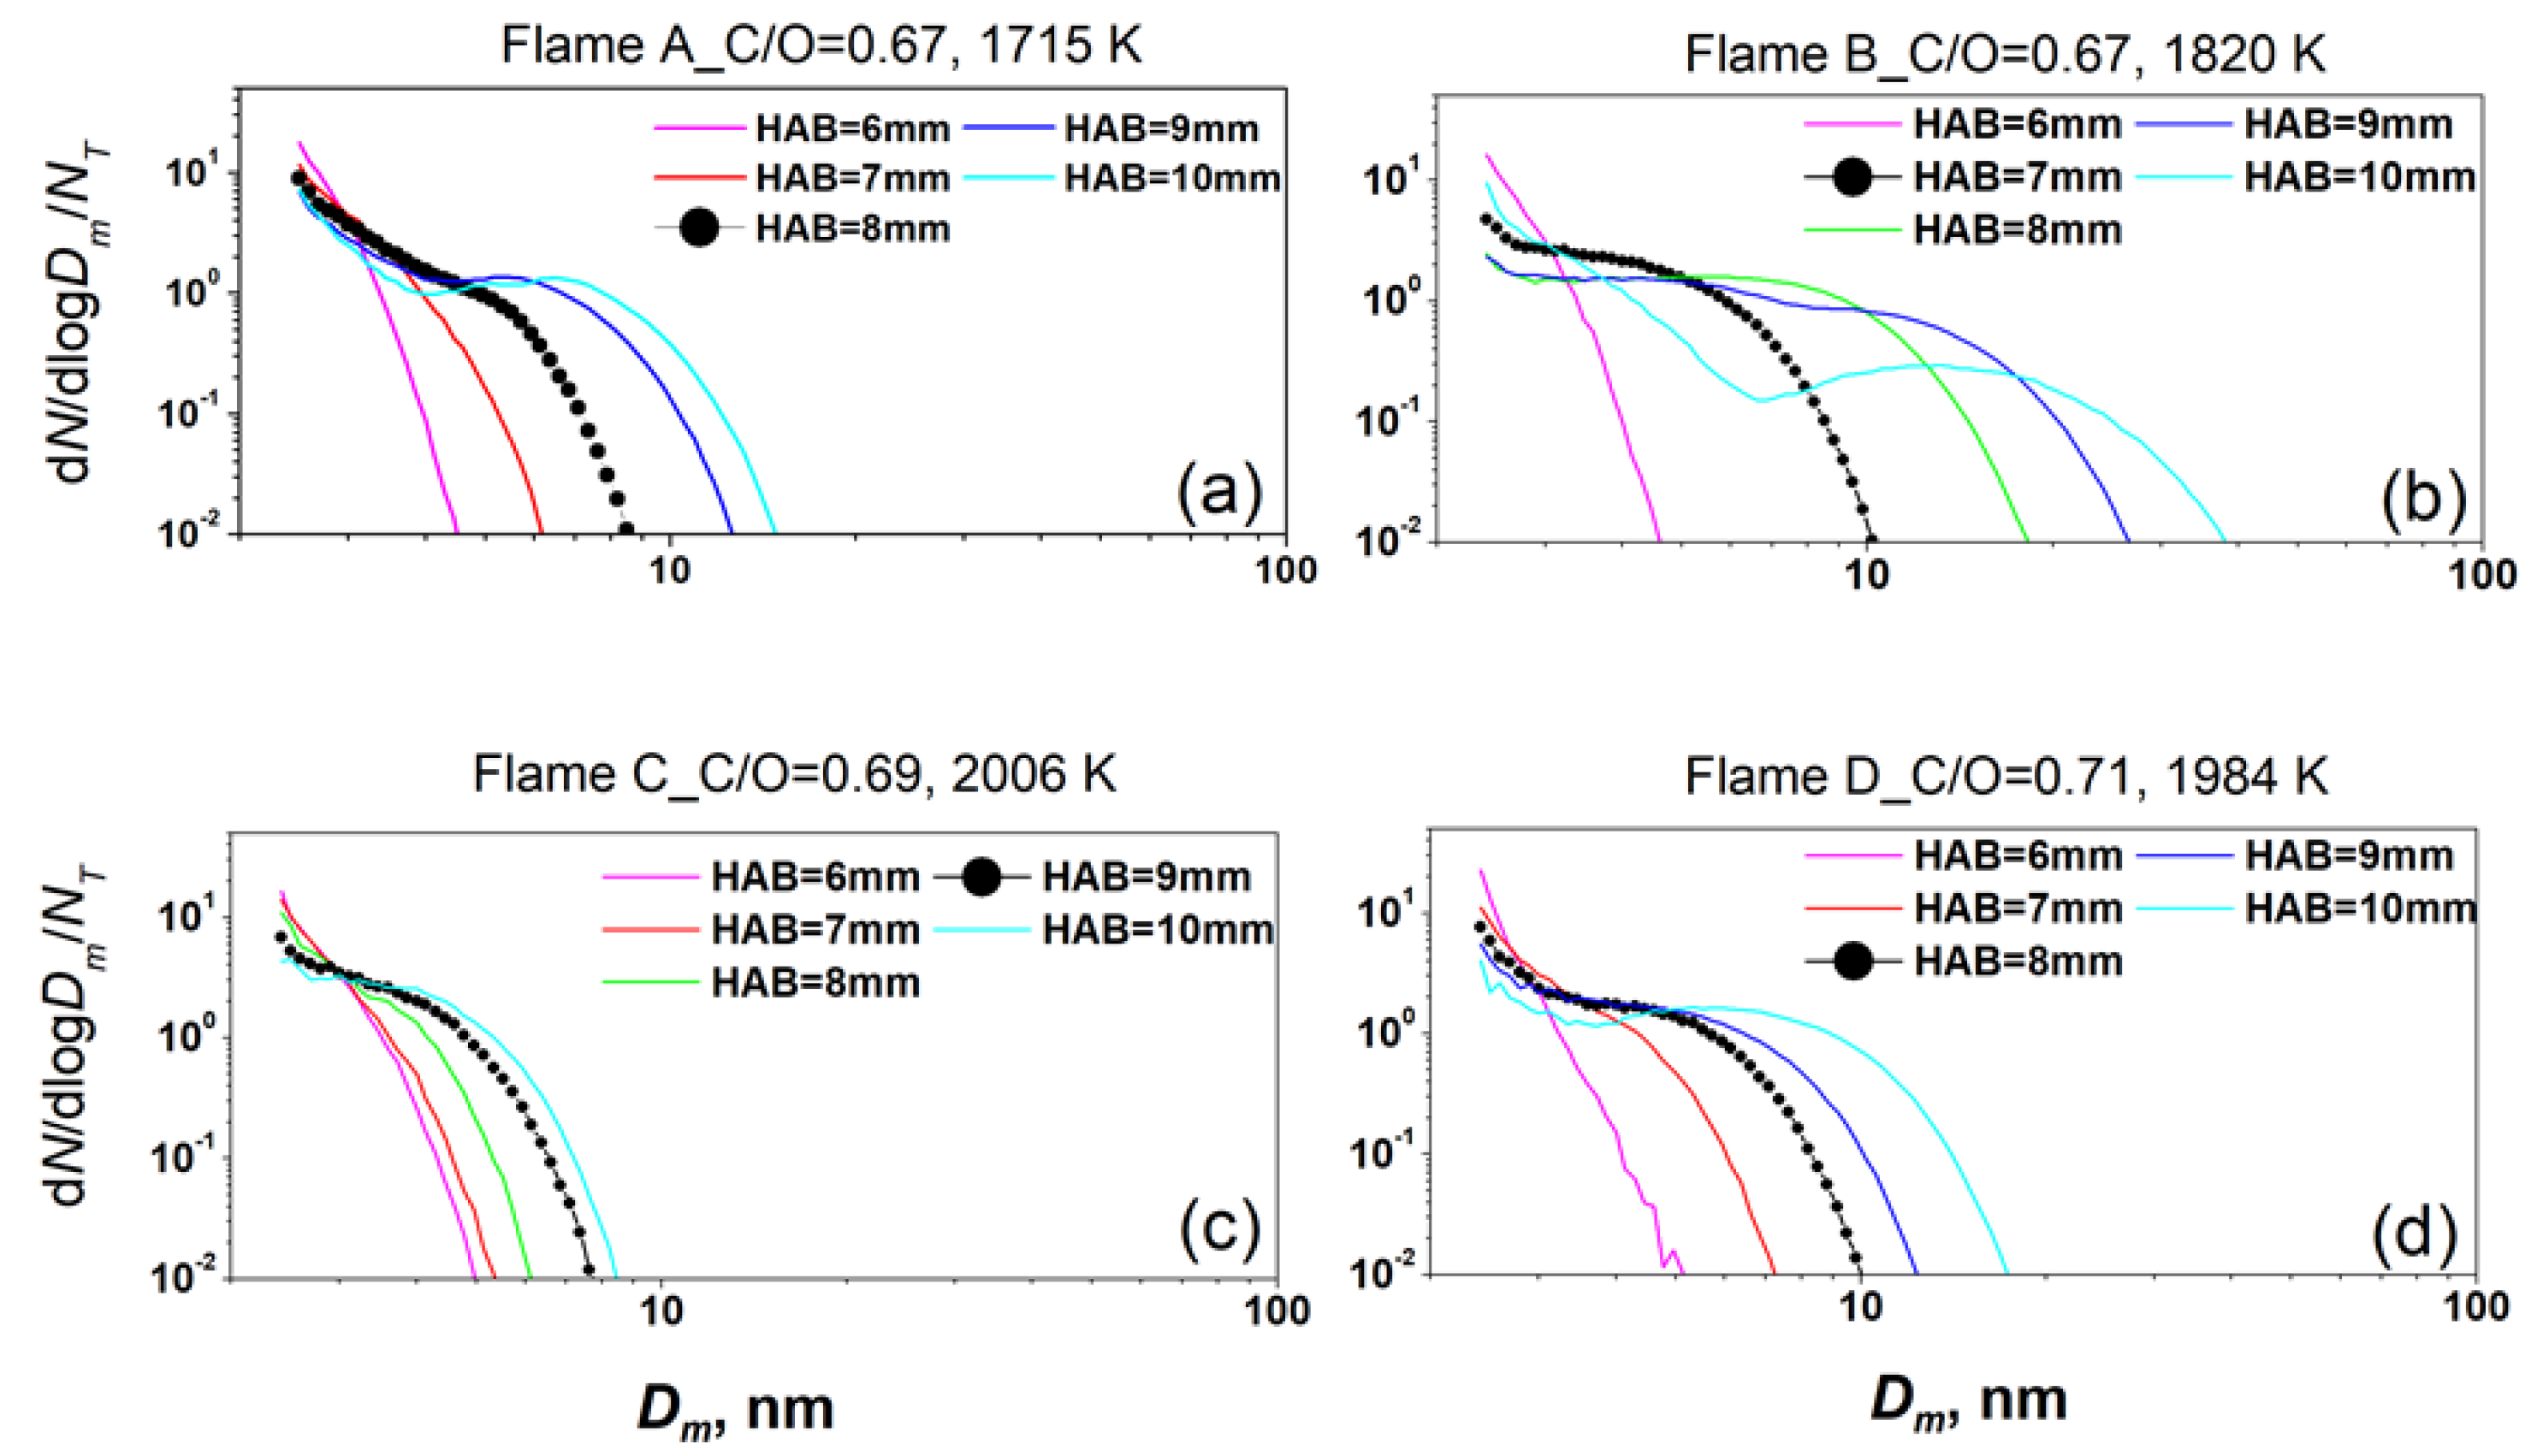
Particle size distributions (PSDs) as a function of the height above the burner (HAB) are reported in Figure 2 for the four investigated flames.
The distribution is expressed in terms of the number of particles, N, normalized to the total number, NT, and is reported as a function of the particle mobility diameter, Dm. This is the diameter of a spherical particle, which moves into the electric field of the DMA with the same mobility as the analyzed particle.
The PSDs of the four flames show some different behaviors. Flame A shows a mono-modal distribution at the lowest HABs, with a progression toward a bimodality starting from 9 mm and becoming evident at the highest HABs. The bimodal PSDs are characterized by the typical tail towards smaller sizes and by a trough separating the nucleation and coagulation modes. Flame B, with the same equivalence ratio but with a slightly different temperature with respect to Flame A, shows a similar behavior in the evolution of the mono- and bi-modality but with the formation of much larger particles. In addition, the trough between the two modes appears deeper and at higher mobility diameters.
As the flame temperature further increases, such as in Flames C and D, the PSD changes in shape, evolving into a mono-modal distribution also at higher HABs. This result is consistent with previous investigations in which it has been shown that, depending on the equivalence ratio and on the temperature, the tail, the trough location, and the shape of the PSD vary significantly [48]. In turn, all these features are highly dependent on the competition among the various processes leading to the formation of CNPs [49]. In PSDs of Flame D, it is possible to note a less evident bimodality with a less deep trough, which also shifts to smaller mobility diameters, leading to the near-disappearance of the tail. The scenario for Flame C is completely different, which is the one with the highest temperature among these studied in this work. Figure 2c shows the PSDs to be completely mono-modal. The disappearance of both the tail and the trough and the decreasing size of the particles is remarkable.
With higher temperatures, the formation of the CNP precursors in the flame is reduced, and this leads to a decrease of the size of the particles [49].
On the basis of the size distribution measurements, the appropriate distance from the burner in order to collect particles of approximately 3–4 nm in diameter was chosen. The relative size distributions are shown in Figure 2 as black dotted curves, and the average particles’ diameters, <Dp>, are reported in Table 2.
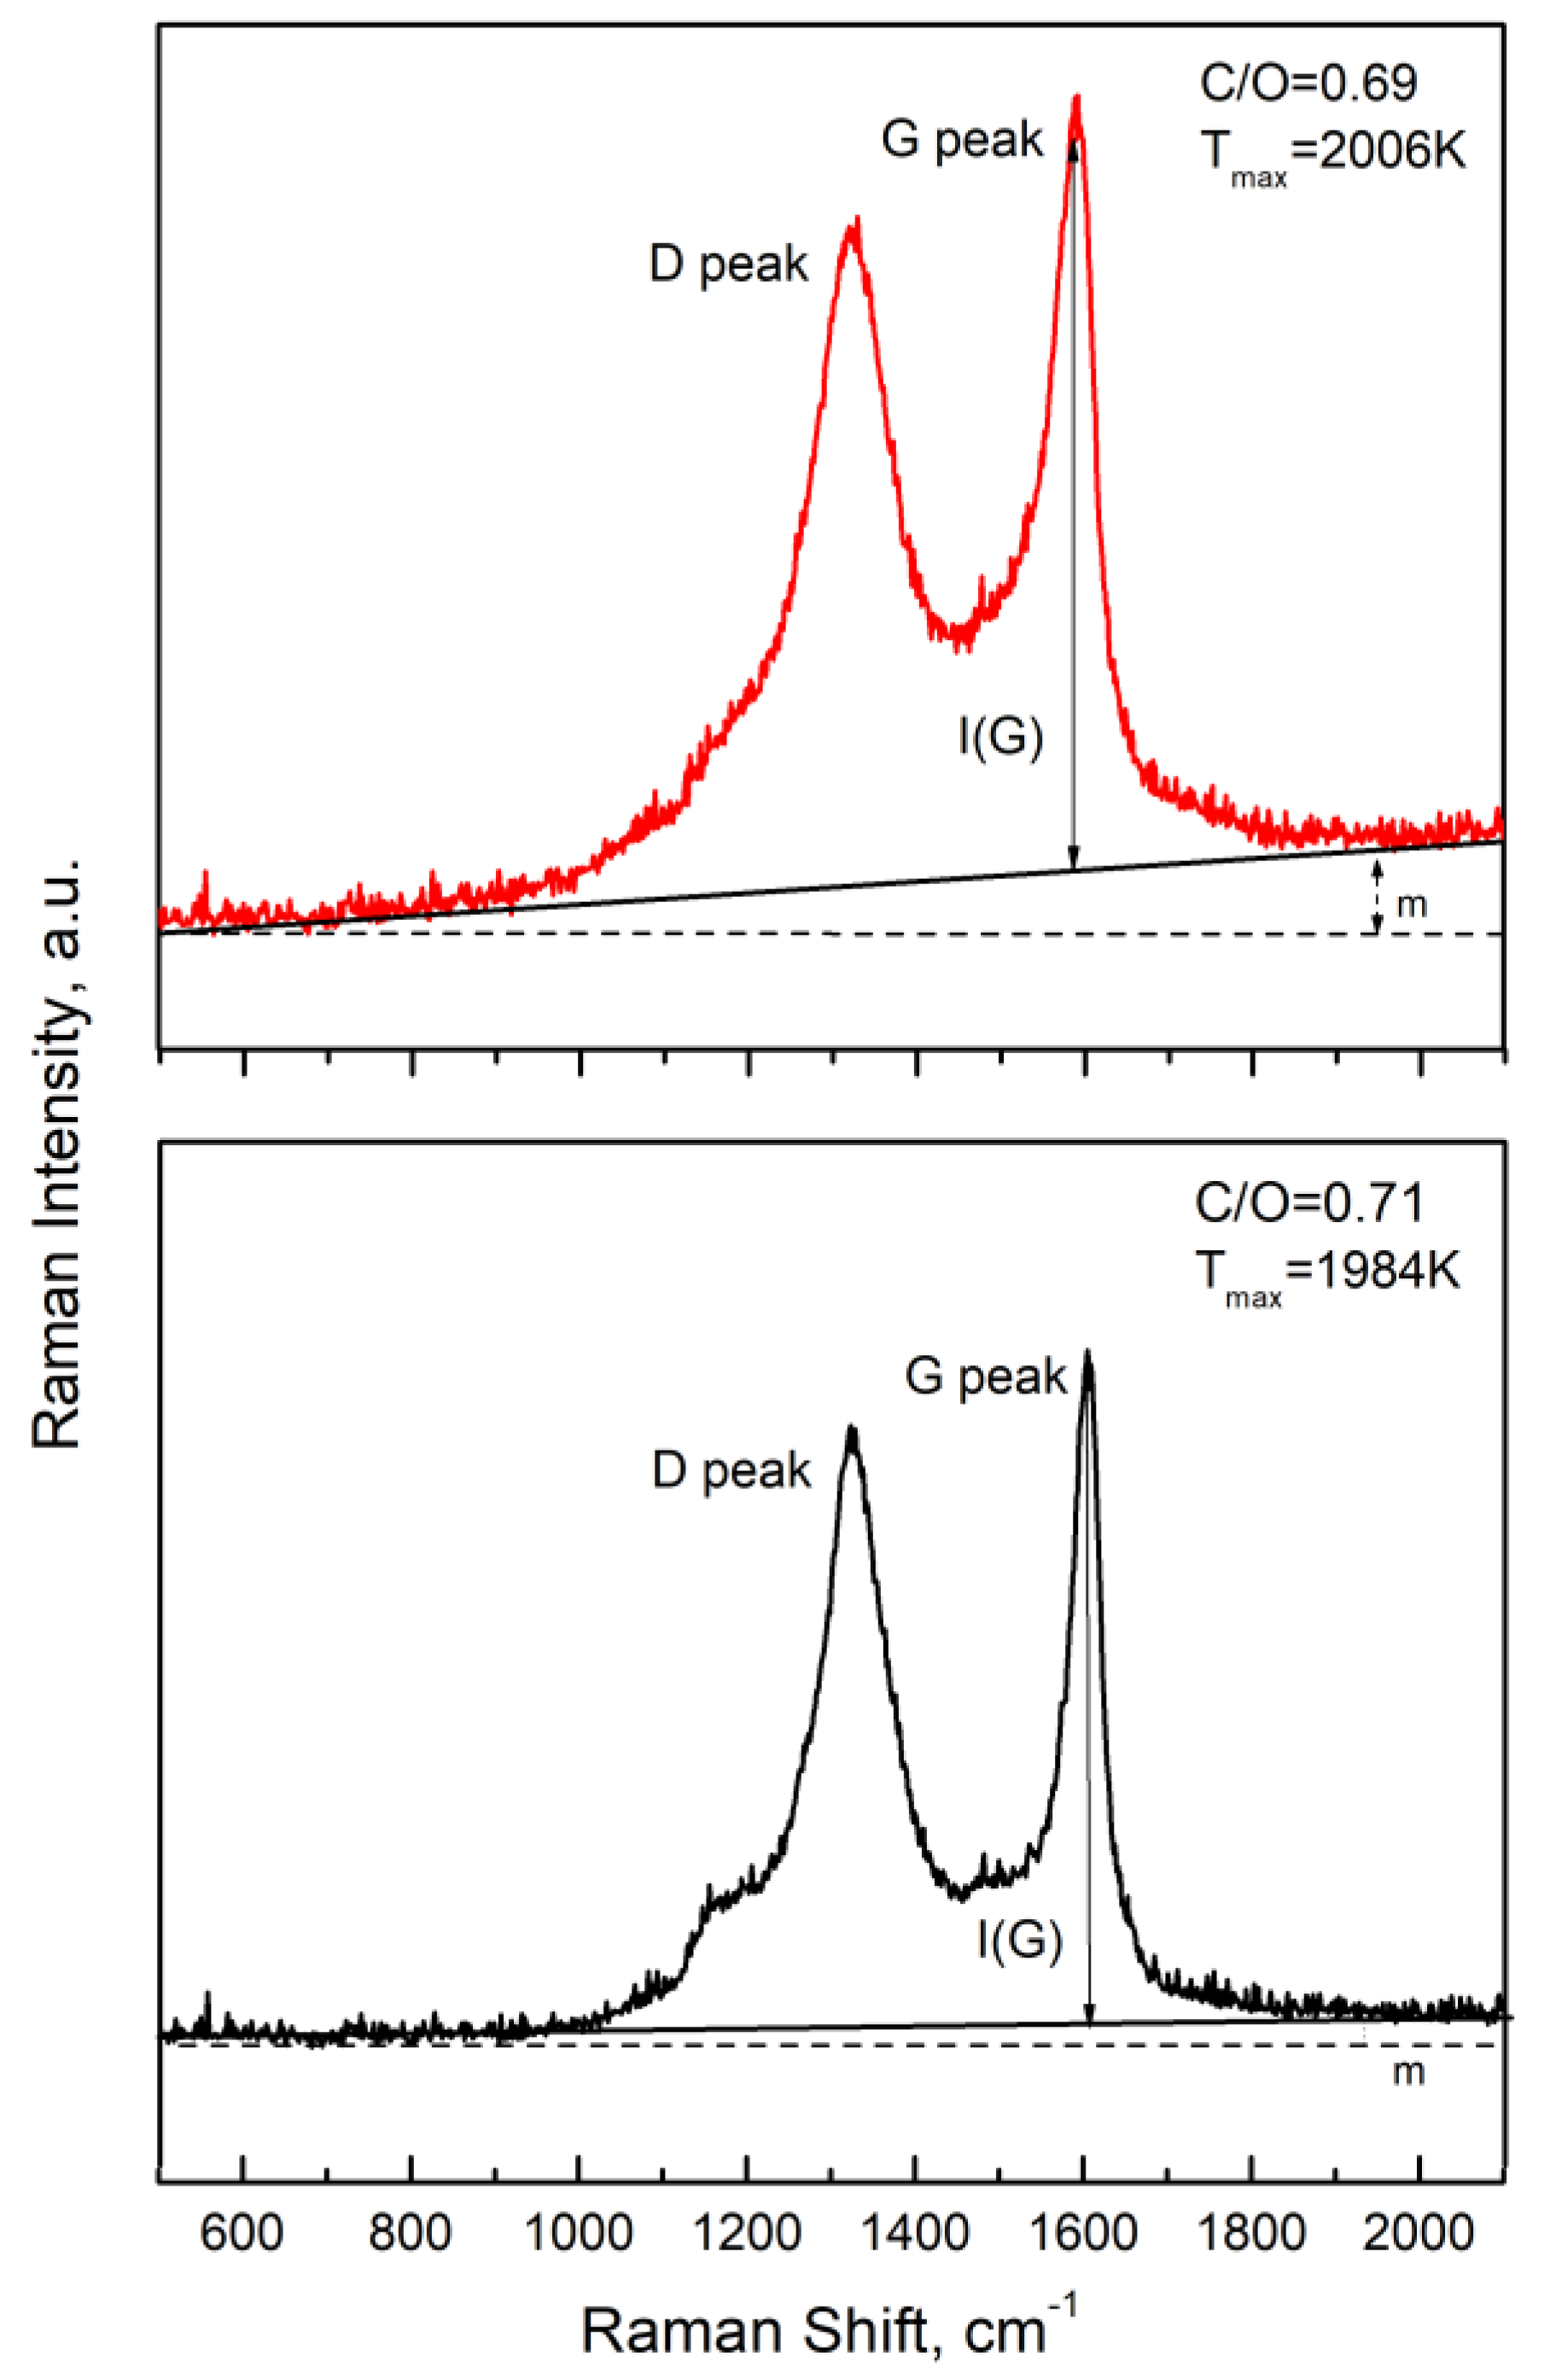
CNPs collected on quartz filters have been analyzed by Raman spectroscopy for structural characterization. Typical Raman spectra of CNPs are reported in Figure 3. In the 1000–1800-cm−1 spectral region, corresponding to the first-order spectral region, two Raman bands are present: They are characteristic of carbon-based materials: the D peak, often referred to as the disorder peak, at a Raman shift of about 1350 cm−1 and the G peak, often referred to as the graphitic peak, at ~1600 cm−1. The G peak is produced by phonon modes with E2g symmetry and is Raman-active for every hybridized sp2 carbon. Instead, the D peak is due to phonons that are produced by the ring breathing mode with A1g symmetry from sp2 carbon rings. This band, however, requires edges or defects to be activated, and for instance it appears in nanocrystalline graphite due to edge effects, or in defected and amorphous carbon materials [50,51,52] including soot nanoparticles [30,45,46,47]. Disorder also allows the activation of the so-called D’ band near 1620 cm−1, which overlaps to the G band in very disordered carbons. It is worth noting that for soot nanoparticles, as well as for any disordered carbon, other defect bands can be detected in the 1000–1800-cm−1 spectral region. These have been usually reported to be centered at ~1200 cm−1, ~1500 cm−1, and ~1620 cm−1, and various fitting procedures have been reported in the literature to deconvolute the Raman spectrum in terms of the different contributions [53,54,55,56,57,58], although there is not yet a widely accepted approach.
Most importantly, it is widely accepted that the relative intensity of the two major peaks, namely I(D) and I(G), correlates with the average size of aromatic islands, La, within the carbon matrix. For highly disordered materials with very small La values, which is the case of the investigated CNPs, the intensity ratio between the D and G peaks has been found to be proportional to La2 by the following equation [51]:
where EL is the energy of the incident photon expressed in eV. The La values (expressed in nm) for the CNPs sampled in the four flames and derived from the corresponding measured Raman spectra are reported in Table 2. The I(D)/I(G) value is of the order of 0.75 for both Flame A and Flame B conditions, indicating a similar size of La of about 1.1 nm, which is about the size of ovalene. A higher value of the I(D)/I(G) ratio is, instead, measured for the two flames with a higher temperature, namely Flame C and Flame D, indicating an increase of La as the flame temperature increases from 1700/1800 K to 2000 K. In addition to the I(D)/I(G) ratio, the analysis of the measured Raman spectra also allows one to obtain additional chemical information on CNPs and their differences under the various flame temperatures adopted. In particular, it is interesting to use the photoluminescence background in the Raman spectrum of CNPs, shown in Figure 3, to obtain an indication of the variation in the organic carbon content in the carbon matrix [59] and more specifically of the change in the amount of hydrogen atoms in the structure [60,61]. In this regard, Casiraghi et al. [60] found an empirical equation that can be used to determine the atomic percentage of hydrogen atoms, H[at.%], for hydrogenated amorphous carbon-based materials, based on the ratio, expressed in microns, between the slope of the photoluminescence background, m, and the intensity of the G peak, I(G):
From the measured Raman spectra, the obtained m/I(G) values are reported in Table 2 together with the calculated percentage of hydrogen atoms using Equation (2). There is a considerable difference in the hydrogen content between the CNPs produced in the lower temperature flame conditions, Flames A and B, and the ones formed at a higher temperature, i.e., Flames C and D. Therefore, the results of both the I(D)/I(G) and m/I(G) ratios indicate a relatively higher graphitization degree of the high temperature flame CNPs (Tmax ~2000 K) as compared to those generated under the lower temperature flame conditions (Tmax ~1700/1800 K).
It is worth mentioning that other authors reported a linear trend analogous to Equation (2) but with slightly different coefficients [61]. The use of these 3–4 nms would produce a slightly different absolute value of the H percentage but does not affect the conclusion of this analysis regarding the temperature effect.
The differences between the two sets of flames are more clearly observable by a direct comparison of the normalized Raman spectra for all types of collected CNPs, as shown in Figure 4.
In addition to the abovementioned increase of the D peak as compared to the G one, other interesting features can be noticed as the flame temperature increases. The shift of the D and G peak positions to lower frequencies is very clear.
It is well known that an upward shift in wavenumber and broadening of the G band position is consequent to phonon confinement in small graphite crystal as the crystalline units become smaller [51], so that the G band shift towards the upper limit of 1600 cm−1. In addition, as the lateral size La decreases, also the intensity of the D’ band increases so that its contribution to the band made of the superposition of G and D’ bands increases, thus moving the maximum towards higher wavenumbers. A similar quantum effect has been reported also for the D band [62]. Consistently with the shift of the bands, the reduction of their broadening, also reported in Figure 5, is a further indication of a larger size of the aromatic islands in the particles and the increase of their graphitic character. Interesting is that in the more graphitic particles, produced at higher temperature, the increase of the D band does not seem to be associated to a concurrent increase of the D’ band. This evidence might be ascribed to a different amount of zig-zag and arm-chair edges of the aromatic islands. Indeed, a larger contribution of zig-zag edges in the particles produced at the lower maximum flame temperature would explain a larger contribution of the D’ band with respect to D, I(D’)/I(D).
Other differences in the Raman spectra concern the decrease of the signal in the region near 1500 cm−1 as well as in the region at about 1200 cm−1 and above 1650 cm−1. All these features indicate a reduction of the organic carbon content in the particles, consisting for instance in small aromatic units, a small carbon chain, and oxygen atoms.
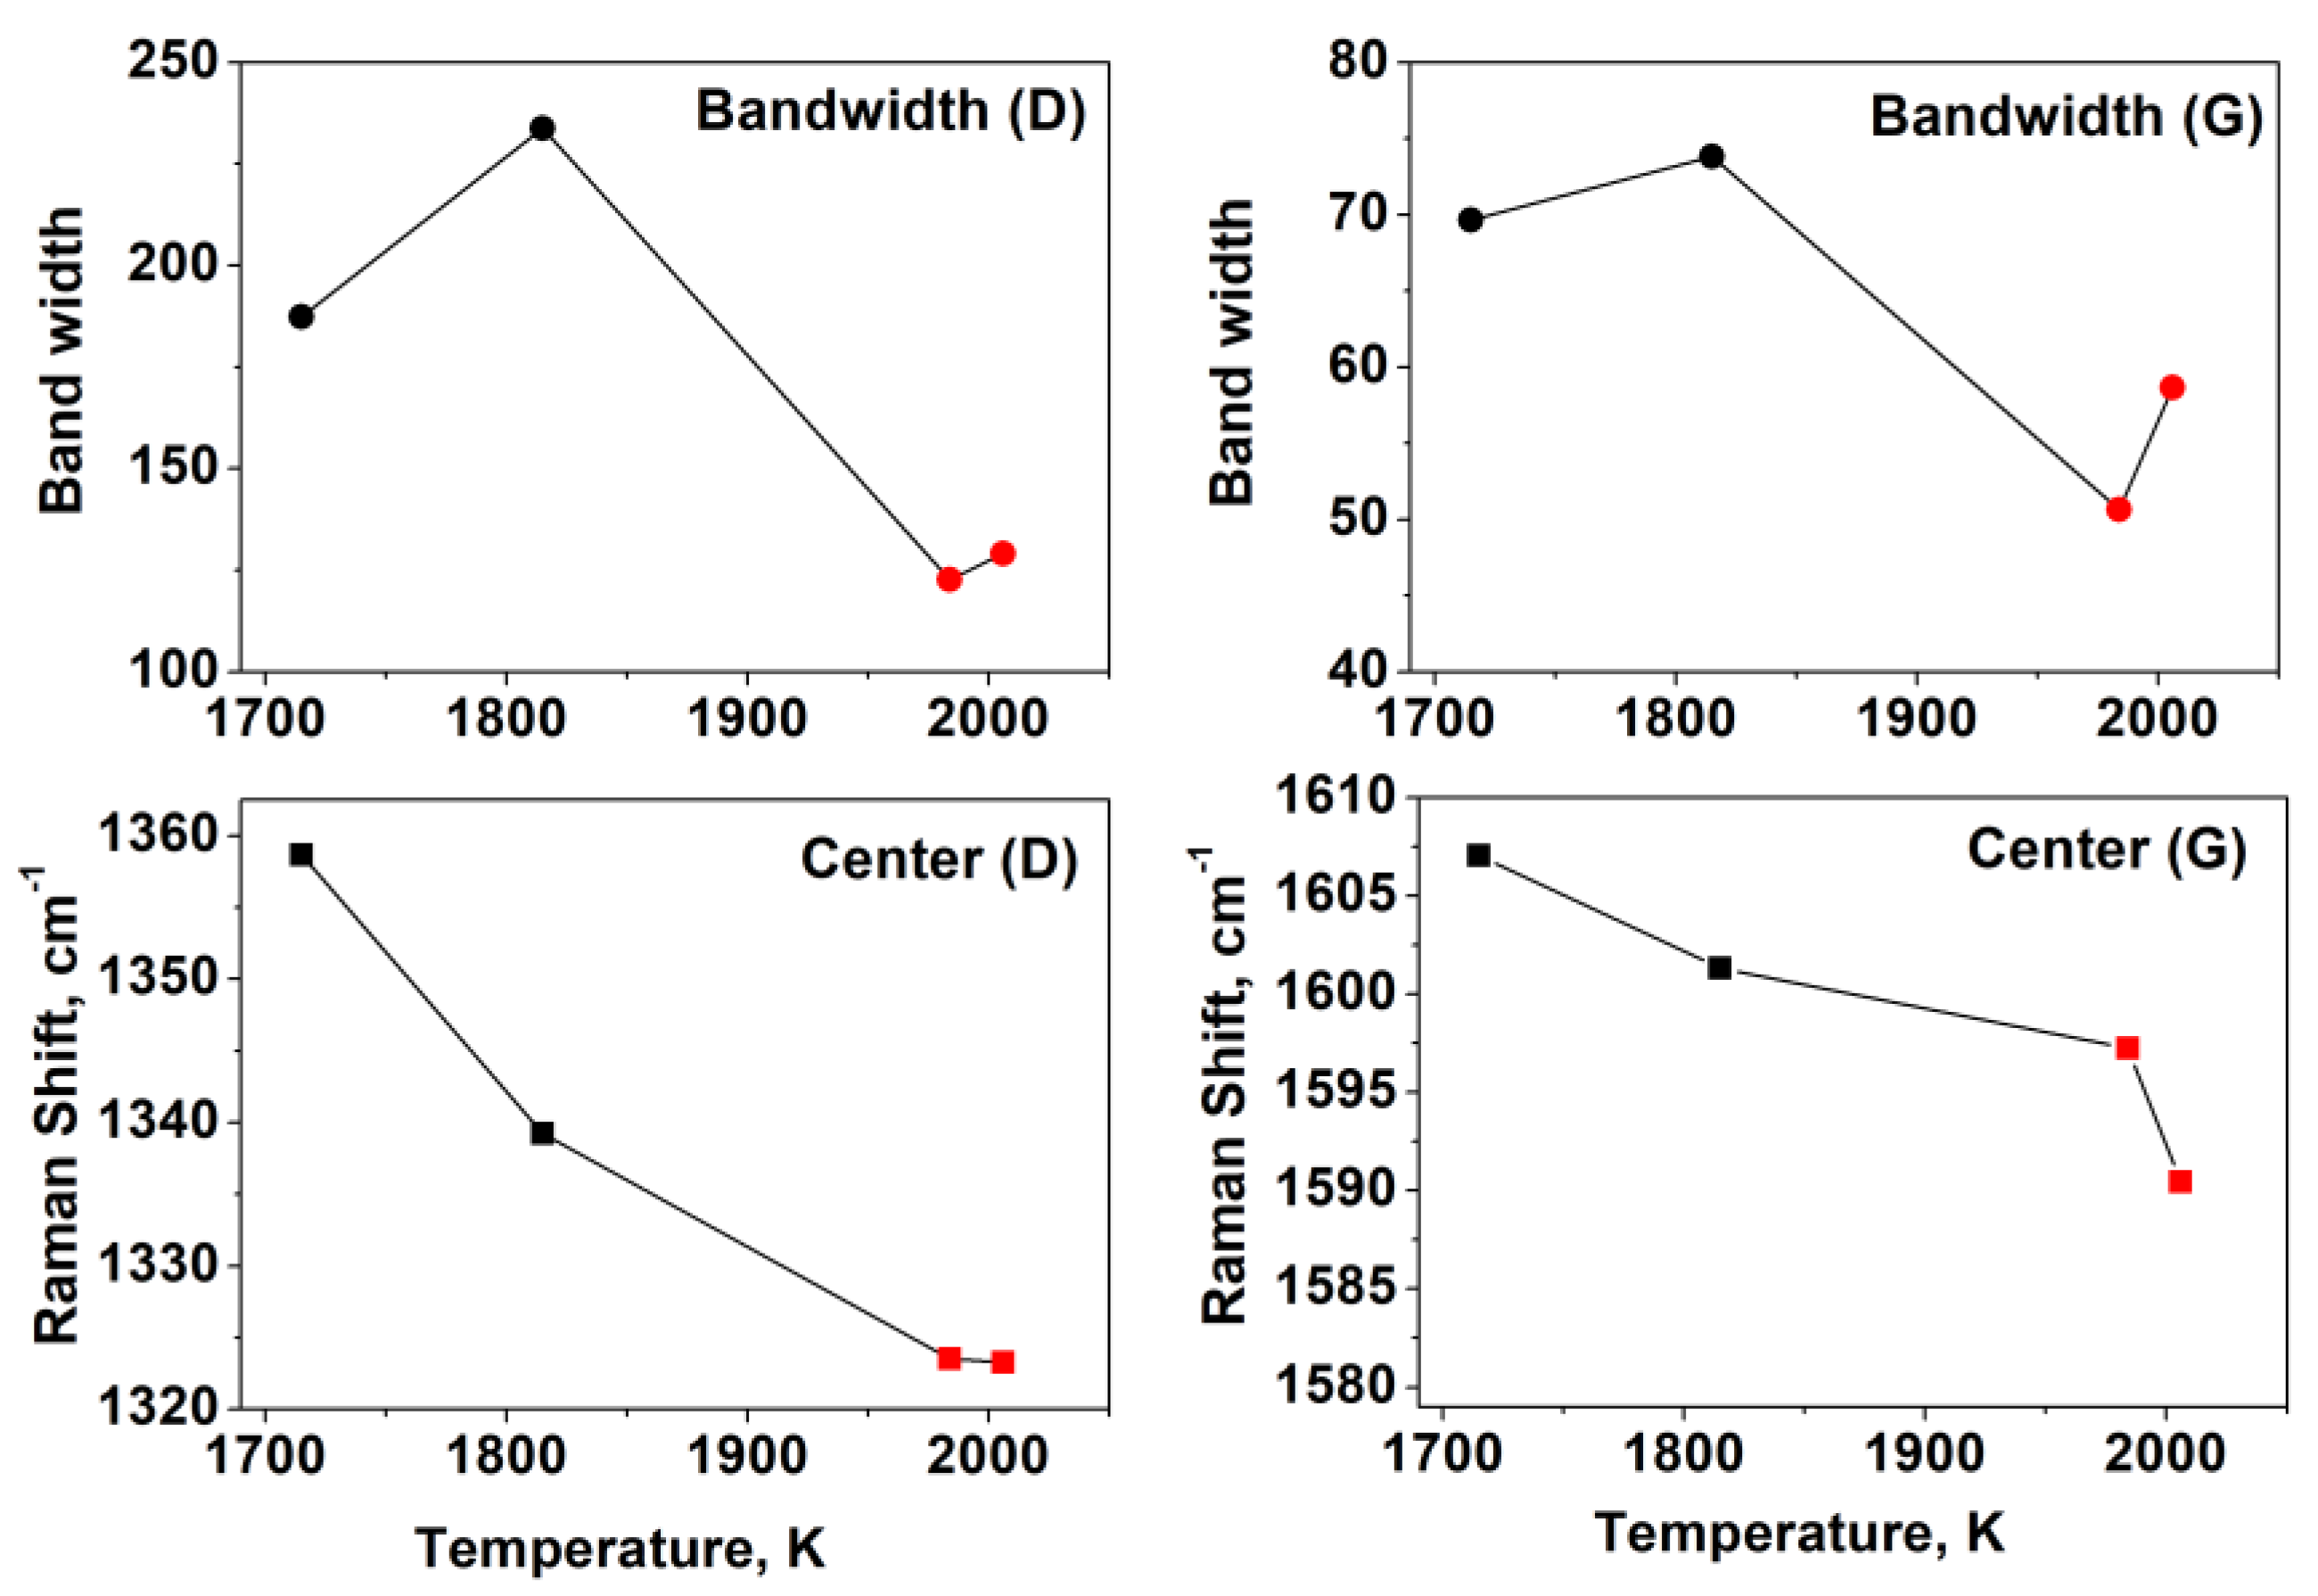
The main differences in the Raman spectra are shown in Figure 5 as a function of the maximum flame temperature.
All of them indicate an increase in the graphitization degree of the CNPs as the flame temperature increases. Therefore, in accordance with the recent conclusions of Camacho and coworkers [45,46], the narrowing of the bands, the shifts of the peaks, and the increase of La indicate that as the flame temperature increases more ordered structures are produced. The fact that the observed graphitization is relative to very small nanoparticles <Dp> about 3–4 nm is particularly relevant. A graphitization path is generally observed in flames as a function of the residence time and is always combined with particle growth. The result of this work, instead, shows that particles with a constant size can be produced with a different graphitization degree when changing the flame temperature.
4. Conclusions
In this study, the transformation of carbon nanoparticles formed in flames as the flame temperature is increased is explored. The aim of this work is to corroborate this methodology as an efficient procedure for tuning particle properties.
Carbon nanoparticles with sizes of 3–4 nm have been generated and collected from fuel-rich laminar premixed flames having different maximum flame temperatures.
Raman spectroscopy analysis of the collected CNPs showed that the temperature had a major impact on the carbon structure of the particles. Particularly, and in agreement with some very recent studies, the higher the flame temperature, the higher the graphitization degree of the particles. Indeed, CNPs generated under high temperature conditions present a larger aromatic domain size. There is a transformation of the edges of the aromatic units with a reduction of zig-zag and an increase of arm-chair edges. The organic carbon content also decreases while the structures become more ordered. Therefore, carbon nanoparticles with a constant size can be produced with different graphitization degrees when changing the flame temperature.
As part of an ongoing research effort, future work will also explore the change of other soot properties including electrical conductance, electronic/optical properties by band gap analysis, and finally surface properties such as hydrophobicity.
Author Contributions
Conceptualization, F.P. and M.C.; methodology, F.P. and M.C.; investigation, F.P. and A.D.P.; data curation, F.P. and A.D.P.; writing—review and editing, F.P., M.C., P.M., and A.D.; funding acquisition, P.M. and A.D. All authors have read and agreed to the published version of the manuscript.
Funding
This research was conducted under the PRIN project 2017PJ5XXX: “MAGIC DUST”.
Institutional Review Board Statement
Not applicable.
Informed Consent Statement
Not applicable.
Data Availability Statement
The data presented in this study are available on request from the corresponding author.
Conflicts of Interest
The authors declare no conflict of interest. The funders had no role in the design of the study; in the collection, analyses, or interpretation of data; in the writing of the manuscript, or in the decision to publish the results.
References
- Bond, T.C.; Doherty, S.J.; Fahey, D.W.; Forster, P.M.; Berntsen, T.; Deangelo, B.J.; Flanner, M.G.; Ghan, S.; Kärcher, B.; Koch, D.; et al. Bounding the role of black carbon in the climate system: A scientific assessment. J. Geophys. Res. Atmos. 2013, 118, 5380–5552. [Google Scholar]
- Ramanathan, V.; Carmichael, G. Global and regional climate changes due to black carbon. Nat. Geosci. 2008, 1, 221–227. [Google Scholar] [CrossRef]
- Kennedy, I.M. The health effects of combustion-generated aerosols. Proc. Combust. Inst. 2007, 31, 2757–2770. [Google Scholar] [CrossRef]
- Pedata, P.; Stoeger, T.; Zimmermann, R.; Peters, A.; Oberdörster, G.; D’Anna, A. Are we forgetting the smallest, sub 10 nm combustion generated particles? Part. Fibre Toxicol. 2015, 12, 1–4. [Google Scholar] [CrossRef] [PubMed] [Green Version]
- De Falco, G.; Terlizzi, M.; Sirignano, M.; Commodo, M.; D’Anna, A.; Aquino, R.P.; Pinto, A.; Sorrentino, R. Human peripheral blood mononuclear cells (PBMCs) from smokers release higher levels of IL-1-like cytokines after exposure to combustion-generated ultrafine particles. Sci. Rep. 2017, 7, 43016. [Google Scholar] [CrossRef] [PubMed] [Green Version]
- Khodabakhshi, S.; Fulvio, P.F.; Andreoli, E. Carbon black reborn: Structure and chemistry for renewable energy harnessing. Carbon 2020, 162, 604–649. [Google Scholar] [CrossRef] [Green Version]
- Liu, H.; Ye, T.; Mao, C. Fluorescent carbon nanoparticles derived from candle soot. Angew. Chem. Int. Ed. 2007, 46, 6473–6475. [Google Scholar] [CrossRef]
- Wei, Z.; Yan, K.; Chen, H.; Yi, Y.; Zhang, T.; Long, X.; Li, J.; Zhang, L.; Wang, J.; Yang, S. Cost-efficient clamping solar cells using candle soot for hole extraction from ambipolar perovskites. Energy Environ. Sci. 2014, 7, 3326–3333. [Google Scholar] [CrossRef]
- Bruno, A.; Commodo, M.; Haque, S.A.; Minutolo, P. Spectroscopic investigation of flame synthesized carbon nanoparticle/P3HT blends. Carbon 2015, 94, 955–961. [Google Scholar] [CrossRef]
- Kakunuri, M.; Sharma, C.S. Candle soot derived fractal-like carbon nanoparticles network as high-rate lithium ion battery anode material. Electrochim. Acta 2015, 180, 353–359. [Google Scholar] [CrossRef]
- Zhang, B.; Wang, D.; Yu, B.; Zhou, F.; Liu, W. Candle soot as a supercapacitor electrode material. RSC Adv. 2014, 4, 2586–2589. [Google Scholar] [CrossRef]
- Li, R.; Mao, H.; Zhu, M.; Yang, Y.; Xiong, J.; Wang, W. Facile preparation of broadband absorbers based on patternable candle soot for applications of optical sensors. Sens. Actuators A 2019, 285, 111–117. [Google Scholar] [CrossRef]
- Pankaj, A.; Tewari, K.; Singh, S.; Singh, S.P. Waste candle soot derived nitrogen doped carbon dots based fluorescent sensor probe: An efficient and inexpensive route to determine Hg(II) and Fe(III) from water. J. Environ. Chem. Eng. 2018, 6, 5561–5569. [Google Scholar] [CrossRef]
- Liang, C.-J.; Liao, J.-D.; Li, A.-J.; Chen, C.; Lin, H.-Y.; Wang, X.-J.; Xu, Y.-H. Relationship between wettabilities and chemical compositions of candle soots. Fuel 2014, 128, 422–427. [Google Scholar] [CrossRef]
- Campbell, D.J.; Andrews, M.J.; Stevenson, K.J. New nanotech from an ancient material: Chemistry demonstrations involving carbon-based soot. J. Chem. Educ. 2012, 89, 1280–1287. [Google Scholar] [CrossRef]
- Commodo, M.; De Falco, G.; Larciprete, R.; D’Anna, A.; Minutolo, P. On the hydrophilic/hydrophobic character of carbonaceous nanoparticles formed in laminar premixed flames. Exp. Therm. Fluid Sci. 2016, 73, 56–63. [Google Scholar] [CrossRef]
- Cao, H.; Fu, J.; Liu, Y.; Chen, S. Facile design of superhydrophobic and superoleophilic copper mesh assisted by candle soot for oil water separation. Colloids Surf. A Physicochem. Eng. Asp. 2018, 537, 294–302. [Google Scholar] [CrossRef]
- Zulfiqar, U.; Hussain, S.Z.; Subhani, T.; Hussain, I.; Rehman, H.-U. Mechanically robust superhydrophobic coating from sawdust particles and carbon soot for oil/water separation. Colloids Surf. A Physicochem. Eng. Asp. 2018, 539, 391–398. [Google Scholar] [CrossRef]
- Esmeryan, K.D.; Fedchenko, Y.I.; Yankov, G.P.; Temelkov, K.A. Laser irradiation of super-nonwettable carbon soot coatings–physicochemical implications. Coatings 2021, 11, 58. [Google Scholar] [CrossRef]
- Mulay, M.R.; Chauhan, A.; Patel, S.; Balakrishnan, V.; Halder, A.; Vaish, R. Candle soot: Journey from a pollutant to a functional material. Carbon 2019, 144, 684–712. [Google Scholar] [CrossRef]
- Li, S.; Ren, Y.; Biswas, P.; Tse, S.D. Flame aerosol synthesis of nanostructured materials and functional devices: Processing, modeling, and diagnostics. Prog. Energy Combust. Sci. 2016, 55, 1–59. [Google Scholar] [CrossRef] [Green Version]
- Kumal, R.R.; Gharpure, A.; Viswanathan, V.; Mantri, A.; Skoptsov, G.; Wal, R.V. Microwave plasma formation of nanographene and graphitic carbon black. C. J. Carbon Res. 2020, 6, 70. [Google Scholar] [CrossRef]
- D’Anna, A. Combustion-formed nanoparticles. Proc. Combust. Inst. 2009, 32, 593–613. [Google Scholar] [CrossRef]
- Wang, H. Formation of nascent soot and other condensed-phase materials in flames. Proc. Combust. Inst. 2011, 33, 41–67. [Google Scholar] [CrossRef]
- Michelsen, H.A. Probing soot formation, chemical and physical evolution, and oxidation: A review of in situ diagnostic techniques and needs. Proc. Combust. Inst. 2017, 36, 717–735. [Google Scholar] [CrossRef] [Green Version]
- Karataş, A.E.; Gülder, O.L. Soot formation in high pressure laminar diffusion flames. Prog. Energy Combust. Sci. 2012, 38, 818–845. [Google Scholar] [CrossRef]
- Zhao, B.; Yang, Z.; Wang, J.; Johnston, M.V.; Wang, H. Analysis of soot nanoparticles in a laminar premixed ethylene flame by scanning mobility particle sizer. Aerosol Sci. Technol. 2003, 37, 611–620. [Google Scholar] [CrossRef]
- Maricq, M.M. Size and charge of soot particles in rich premixed ethylene flames. Combust. Flame 2004, 137, 340–350. [Google Scholar] [CrossRef]
- Abid, A.D.; Camacho, J.; Sheen, D.A.; Wang, H. Quantitative measurement of soot particle size distribution in premixed flames—The burner-stabilized stagnation flame approach. Combust. Flame 2009, 156, 1862–1870. [Google Scholar] [CrossRef]
- Commodo, M.; De Falco, G.; Bruno, A.; Borriello, C.; Minutolo, P.; D’Anna, A. Physicochemical evolution of nascent soot particles in a laminar premixed flame: From nucleation to early growth. Combust. Flame 2015, 162, 3854–3863. [Google Scholar] [CrossRef]
- Carbone, F.; Attoui, M.; Gomez, A. Challenges of measuring nascent soot in flames as evidenced by high-resolution differential mobility analysis. Aerosol Sci. Technol. 2016, 50, 740–757. [Google Scholar] [CrossRef] [Green Version]
- Betrancourt, C.; Liu, F.; Desgroux, P.; Mercier, X.; Faccinetto, A.; Salamanca, M.; Ruwe, L.; Kohse-Höinghaus, K.; Emmrich, D.; Beyer, A.; et al. Investigation of the size of the incandescent incipient soot particles in premixed sooting and nucleation flames of n-butane using LII, HIM, and 1 nm-SMPS. Aerosol Sci. Technol. 2017, 51, 916–935. [Google Scholar] [CrossRef] [Green Version]
- De Falco, G.; Commodo, M.; Bonavolontà, C.; Pepe, G.P.; Minutolo, P.; D’Anna, A. Optical and electrical characterization of carbon nanoparticles produced in laminar premixed flames. Combust. Flame 2014, 161, 3201–3210. [Google Scholar] [CrossRef]
- De Falco, G.; Commodo, M.; Barra, M.; Chiarella, F.; D’Anna, A.; Aloisio, A.; Cassinese, A.; Minutolo, P. Electrical characterization of flame-soot nanoparticle thin films. Synth. Met. 2017, 229, 89–99. [Google Scholar] [CrossRef]
- Commodo, M.; De Falco, G.; Minutolo, P.; D’Anna, A. Structure and size of soot nanoparticles in laminar premixed flames at different equivalence ratios. Fuel 2018, 216, 456–462. [Google Scholar] [CrossRef]
- Liu, Y.; Song, C.; Lv, G.; Fan, C.; Zhang, X.; Qiao, Y. Relationships between the electrical properties and nanostructure of soot particles in a laminar inverse diffusion flame. Proc. Combust. Inst. 2019, 37, 1185–1192. [Google Scholar] [CrossRef]
- De Falco, G.; Mattiello, G.; Commodo, M.; Minutolo, P.; Shi, X.; D’Anna, A.; Wang, H. Electronic band gap of flame-formed carbon nanoparticles by scanning tunneling spectroscopy. Proc. Combust. Inst. 2021, 38, 1805–1812. [Google Scholar] [CrossRef]
- Liu, Y.; Song, C.; Lv, G.; Zhang, W.; Chen, H. Evaluation of the oxidative reactivity and electrical properties of soot particles. Carbon 2021, 178, 37–47. [Google Scholar] [CrossRef]
- Öktem, B.; Tolocka, M.P.; Zhao, B.; Wang, H.; Johnston, M.V. Chemical species associated with the early stage of soot growth in a laminar premixed ethylene–oxygen–argon flame. Combust. Flame 2005, 142, 364–373. [Google Scholar] [CrossRef]
- Cain, J.P.; Camacho, J.; Phares, D.J.; Wang, H.; Laskin, A. Evidence of aliphatics in nascent soot particles in premixed ethylene flames. Proc. Combust. Inst. 2011, 33, 533–540. [Google Scholar] [CrossRef]
- Miller, J.H.; Herdman, J.D.; Green, C.D.O.; Webster, E.M. Experimental and computational determinations of optical band gaps for PAH and soot in a N2-diluted, ethylene/air non-premixed flame. Proc. Combust. Inst. 2013, 34, 3669–3675. [Google Scholar] [CrossRef]
- Schulz, F.; Commodo, M.; Kaiser, K.; De Falco, G.; Minutolo, P.; Meyer, G.; D’Anna, A.; Gross, L. Insights into incipient soot formation by atomic force microscopy. Proc. Combust. Inst. 2019, 37, 885–892. [Google Scholar] [CrossRef]
- Commodo, M.; Kaiser, K.; De Falco, G.; Minutolo, P.; Schulz, F.; D’Anna, A.; Gross, L. On the early stages of soot formation: Molecular structure elucidation by high-resolution atomic force microscopy. Combust. Flame 2019, 205, 154–164. [Google Scholar] [CrossRef]
- Jacobson, R.S.; Korte, A.R.; Vertes, A.; Miller, J.H. The molecular composition of soot. Angew. Chem. Int. Ed. 2020, 59, 4484–4490. [Google Scholar] [CrossRef] [PubMed]
- Dasappa, S.; Camacho, J. Evolution in size and structural order for incipient soot formed at flame temperatures greater than 2100 K. Fuel 2021, 291, 120196. [Google Scholar] [CrossRef]
- Bonpua, J.; Yagües, Y.; Aleshin, A.; Dasappa, S.; Camacho, J. Flame temperature effect on sp2 bonds on nascent carbon nanoparticles formed in premixed flames (Tf, max & gt; 2100 K): A Raman spectroscopy and particle mobility sizing study. Proc. Combust. Inst. 2019, 37, 943–951. [Google Scholar]
- De Falco, G.; Moggia, G.; Sirignano, M.; Commodo, M.; Minutolo, P.; D’Anna, A. Exploring soot particle concentration and emissivity by transient thermocouples measurements in laminar partially premixed coflow flames. Energies 2017, 10, 232. [Google Scholar] [CrossRef]
- Abid, A.D.; Heinz, N.; Tolmachoff, E.D.; Phares, D.J.; Campbell, C.S.; Wang, H. On evolution of particle size distribution functions of incipient soot in premixed ethylene–oxygen–argon flames. Combust. Flame 2008, 154, 775–788. [Google Scholar] [CrossRef]
- Gu, C.; Lin, H.; Camacho, J.; Lin, B.; Shao, C.; Li, R.; Gu, H.; Guan, B.; Huang, Z.; Wang, H. Particle size distribution of nascent soot in lightly and heavily sooting premixed ethylene flames. Combust. Flame 2016, 165, 177–187. [Google Scholar] [CrossRef]
- Ferreira, E.H.M.; Moutinho, M.V.O.; Stavale, F.; Lucchese, M.M.; Capaz, R.B.; Achete, C.A.; Jorio, A. Evolution of the Raman spectra from single-, few-, and many-layer graphene with increasing disorder. Phys. Rev. B Condens. 2010, 82, 125429. [Google Scholar] [CrossRef] [Green Version]
- Ferrari, A.C.; Basko, D.M. Raman spectroscopy as a versatile tool for studying the properties of graphene. Nat. Nanotechnol. 2013, 8, 235–246. [Google Scholar] [CrossRef] [PubMed] [Green Version]
- Merlen, A.; Buijnsters, J.G.; Pardanaud, C. A guide to and review of the use of multiwavelength raman spectroscopy for characterizing defective aromatic carbon solids: From graphene to amorphous carbons. Coatings 2017, 7, 153. [Google Scholar] [CrossRef]
- Sadezky, A.; Muckenhuber, H.; Grothe, H.; Niessner, R.; Pöschl, U. Raman microspectroscopy of soot and related carbonaceous materials: Spectral analysis and structural information. Carbon 2005, 43, 1731–1742. [Google Scholar] [CrossRef]
- Lapuerta, M.; Oliva, F.; Agudelo, J.R.; Stitt, J.P. Optimization of Raman spectroscopy parameters for characterizing soot from different diesel fuels. Combust. Sci. Technol. 2011, 183, 1203–1220. [Google Scholar] [CrossRef]
- Herdman, J.D.; Connelly, B.C.; Smooke, M.D.; Long, M.B.; Miller, J.H. A comparison of Raman signatures and laser-induced incandescence with direct numerical simulation of soot growth in non-premixed ethylene/air flames. Carbon 2011, 49, 5298–5311. [Google Scholar] [CrossRef]
- Seong, H.J.; Boehman, A.L. Evaluation of Raman parameters using visible Raman microscopy for soot oxidative reactivity. Energy Fuels 2013, 27, 1613–1624. [Google Scholar] [CrossRef]
- Minutolo, P.; Commodo, M.; Santamaria, A.; De Falco, G.; D’Anna, A. Characterization of flame-generated 2-D carbon nano-disks. Carbon 2014, 68, 138–148. [Google Scholar] [CrossRef]
- Le, K.C.; Lefumeux, C.; Bengtsson, P.-E.; Pino, T. Direct observation of aliphatic structures in soot particles produced in low-pressure premixed ethylene flames via online Raman spectroscopy. Proc. Combust. Inst. 2019, 37, 869–876. [Google Scholar] [CrossRef]
- Ess, M.N.; Ferry, D.; Kireeva, E.D.; Niessner, R.; Ouf, F.-X.; Ivleva, N.P. In situ Raman microspectroscopic analysis of soot samples with different organic carbon content: Structural changes during heating. Carbon 2016, 105, 572–585. [Google Scholar] [CrossRef]
- Casiraghi, C.; Piazza, F.; Ferrari, A.C.; Grambole, D.; Robertson, J. Bonding in hydrogenated diamond-like carbon by Raman spectroscopy. Diam. Relat. Mater. 2005, 14, 1098–1102. [Google Scholar] [CrossRef]
- Buijnsters, J.G.; Gago, R.; Jiḿnez, I.; Camero, M.; Agulló-Rueda, F.; Gómez-Aleixandre, C. Hydrogen quantification in hydrogenated amorphous carbon films by infrared, Raman, and x-ray absorption near edge spectroscopies. J. Appl. Phys. 2009, 105, 093510. [Google Scholar] [CrossRef] [Green Version]
- Schuepfer, D.B.; Badaczewski, F.; Guerra-Castro, J.M.; Hofmann, D.M.; Heiliger, C.; Smarsly, B.; Klar, P.J. Assessing the structural properties of graphitic and non-graphitic carbons by Raman spectroscopy. Carbon 2020, 161, 359–372. [Google Scholar] [CrossRef]
Figure 1.
Temperature profiles for Flame A and Flame C conditions. Full dots refer to the unperturbed flames, i.e., without a sampling probe. Empty dots refer to Flame A with the CNPs sampling probe positioned at 8 mm, marked by the dashed line.
Figure 1.
Temperature profiles for Flame A and Flame C conditions. Full dots refer to the unperturbed flames, i.e., without a sampling probe. Empty dots refer to Flame A with the CNPs sampling probe positioned at 8 mm, marked by the dashed line.

Figure 2.
Normalized number PSD (1/NT*dN/dlogD) of CNPs as a function of HAB for: (a) Flame A, C/O = 0.67 and Tmax = 1715 K; (b) Flame B, C/O = 0.67 and Tmax = 1820 K; (c) Flame C, C/O = 0.69 and Tmax = 2006 K; and (d) Flame D, C/O = 0.71 and Tmax = 1984 K. Note: black dotted curves correspond to the selected conditions for particle sampling and characterization.

Figure 3.
Typical Raman spectra of the CNPs collected under two different flame conditions.

Figure 4.
Comparison of the normalized Raman spectra of CNPs collected for different flame conditions. Note: for clarity, the red lines refer to the two hottest conditions (Flames C and D).
Figure 4.
Comparison of the normalized Raman spectra of CNPs collected for different flame conditions. Note: for clarity, the red lines refer to the two hottest conditions (Flames C and D).
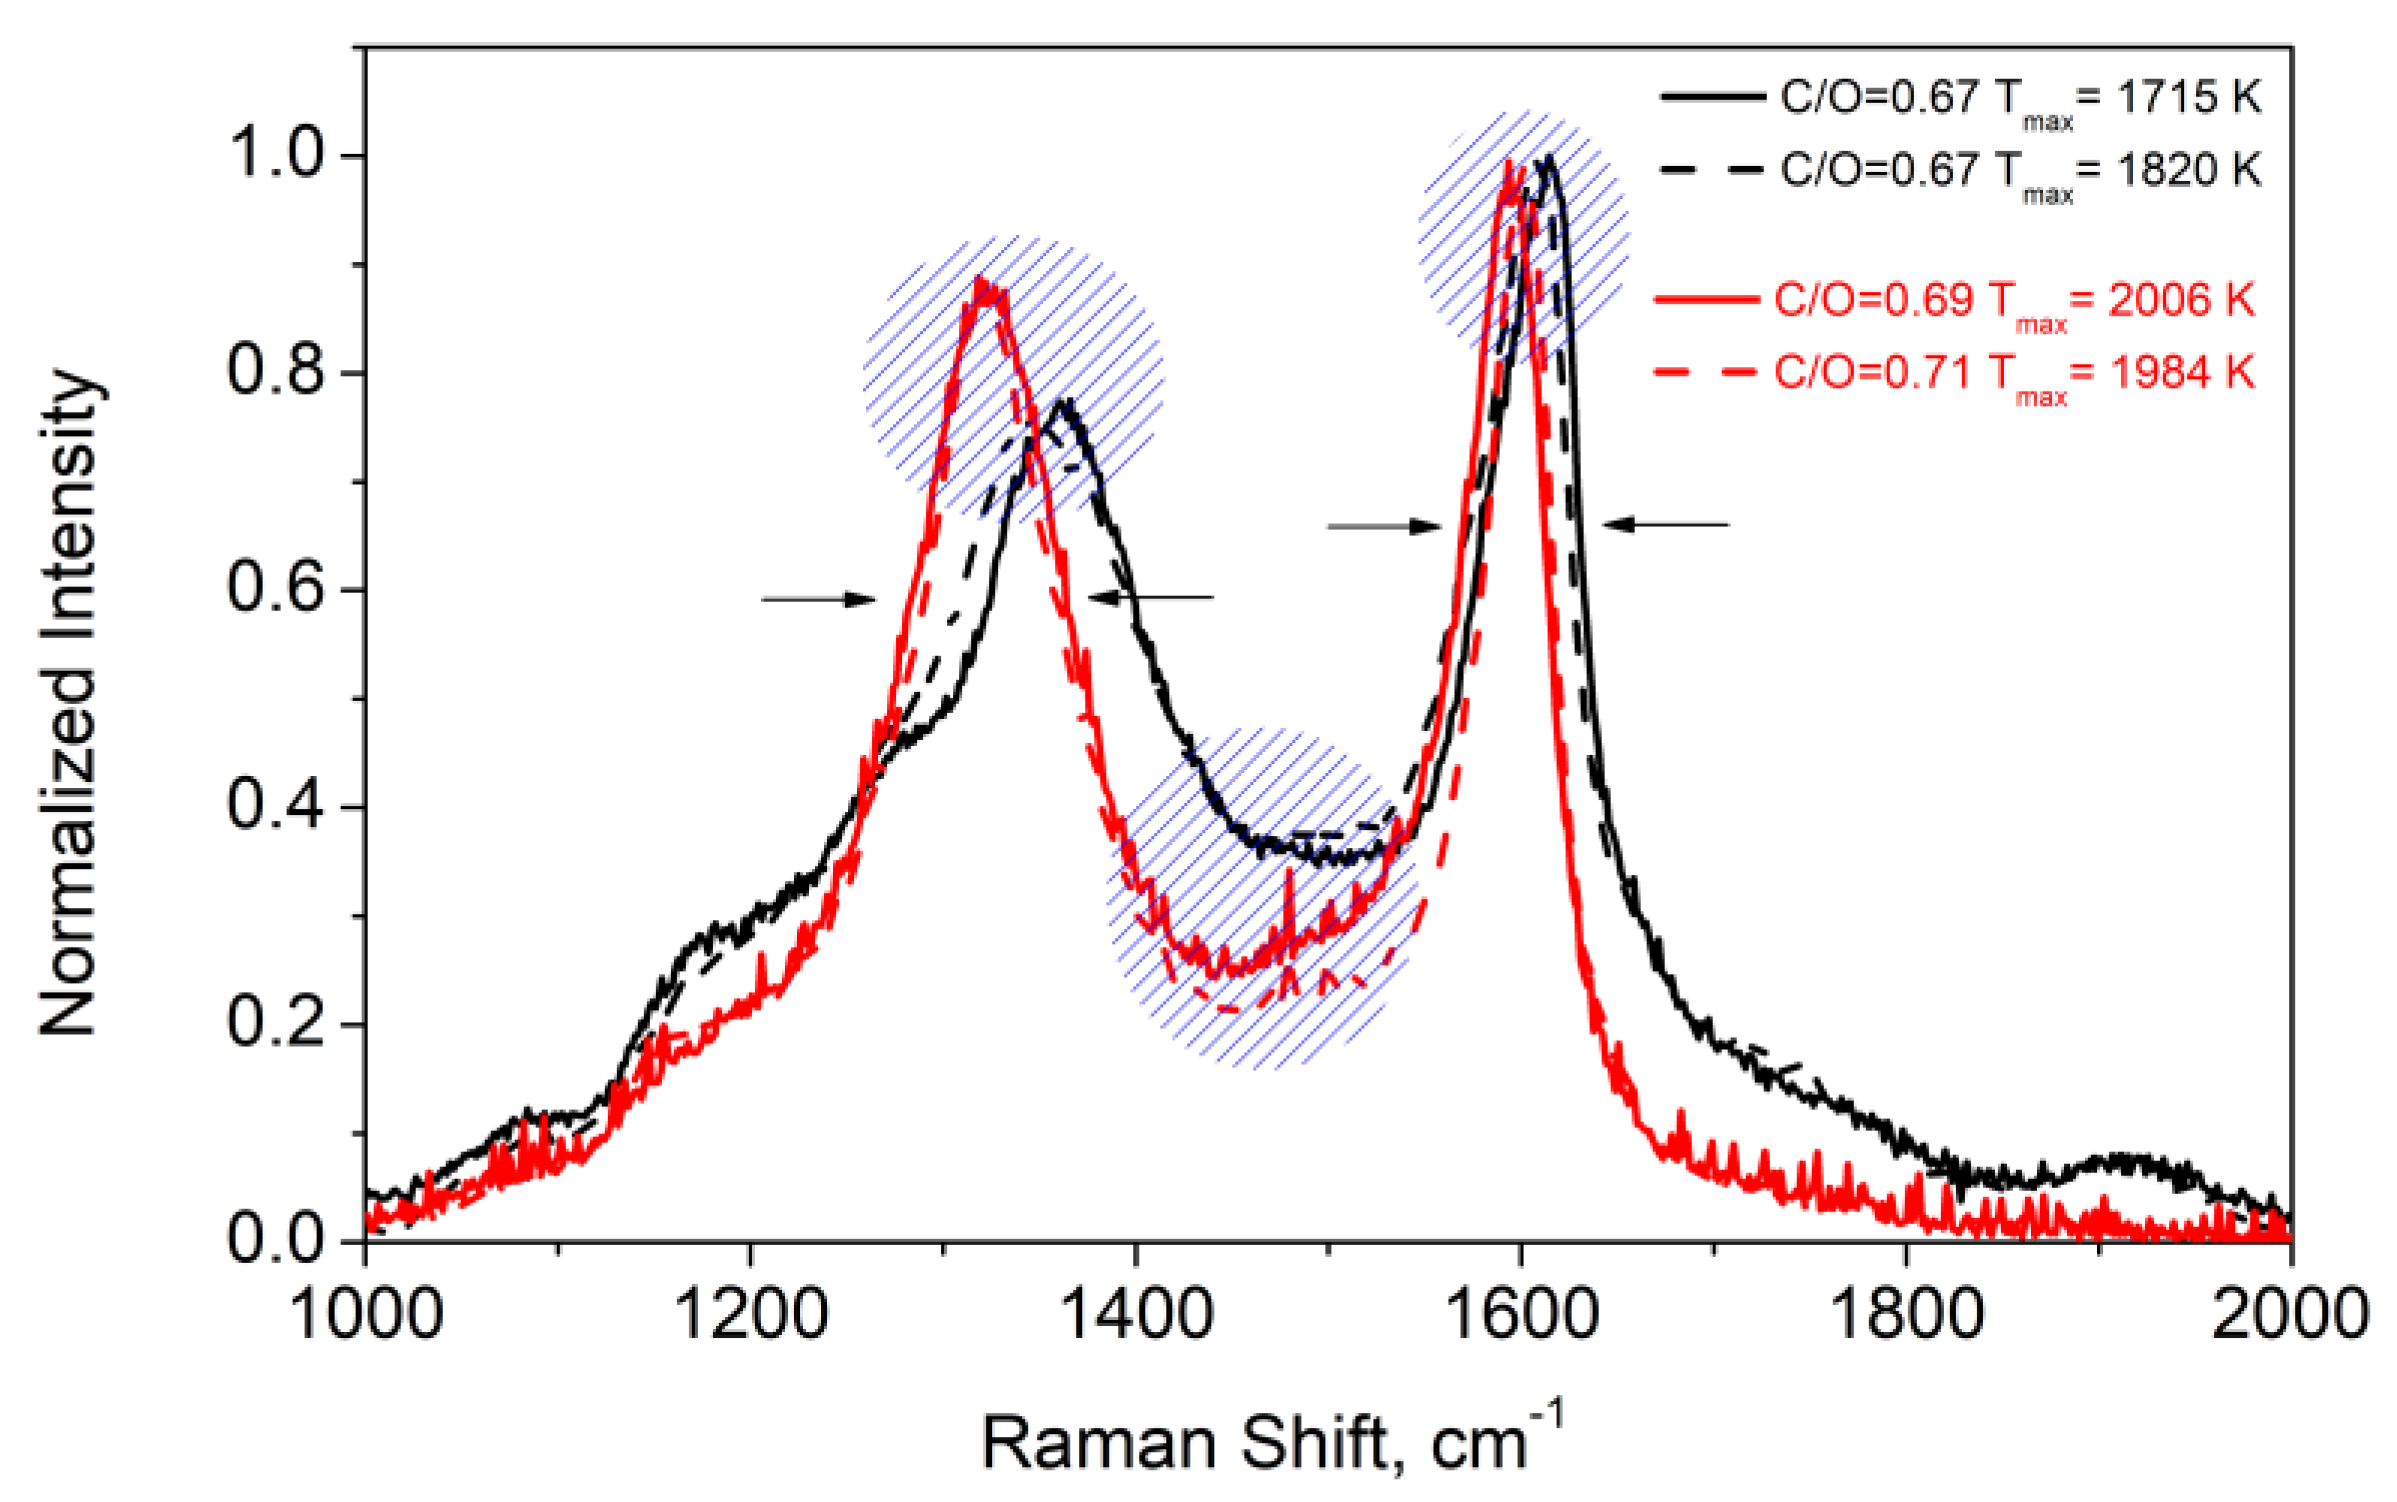
Figure 5.
Analysis of the main differences between the measured Raman spectra of the CNPs collected at different temperatures. Note: for clarity, red dots are used for consistency with Figure 4.
Figure 5.
Analysis of the main differences between the measured Raman spectra of the CNPs collected at different temperatures. Note: for clarity, red dots are used for consistency with Figure 4.

Table 1.
Flame conditions.
| Flame | Feed Gas | C/O | Gas Velocity, cm/s | Max Temperature, K |
|---|---|---|---|---|
| A | Ethylene/air | 0.67 | 9.8 cm/s | 1715 |
| B | Ethylene/air | 0.67 | 9.8 cm/s | 1820 |
| C | Ethylene/air | 0.69 | 20 cm/s | 2006 |
| D | Ethylene/air | 0.71 | 20 cm/s | 1984 |
Table 2.
Properties of flame-generated CNPs.
| Flame | C/O Tmax HAB | <Dp> | I(D)/I(G) | La (nm) | m/I(G) | H [%] |
|---|---|---|---|---|---|---|
| A | C/O = 0.67 1715 K 8 mm | 3.34 nm | 0.76 | 1.10 | 3.2 | 30.0 |
| B | C/O = 0.67 1820 K 7 mm | 3.80 nm | 0.75 | 1.09 | 6.6 | 35.3 |
| C | C/O = 0.69 2006 K 9 mm | 3.30 nm | 0.88 | 1.18 | 0.3 | 13.5 |
| D | C/O = 0.71 1984 K 8 mm | 4.06 nm | 0.89 | 1.19 | 0.5 | 17.2 |
Publisher’s Note: MDPI stays neutral with regard to jurisdictional claims in published maps and institutional affiliations. |
© 2021 by the authors. Licensee MDPI, Basel, Switzerland. This article is an open access article distributed under the terms and conditions of the Creative Commons Attribution (CC BY) license (https://creativecommons.org/licenses/by/4.0/).
Share and Cite
MDPI and ACS Style
Picca, F.; Pietro, A.D.; Commodo, M.; Minutolo, P.; D’Anna, A. Variable Temperature Synthesis of Tunable Flame-Generated Carbon Nanoparticles. C 2021, 7, 44. https://0-doi-org.brum.beds.ac.uk/10.3390/c7020044
AMA Style
Picca F, Pietro AD, Commodo M, Minutolo P, D’Anna A. Variable Temperature Synthesis of Tunable Flame-Generated Carbon Nanoparticles. C. 2021; 7(2):44. https://0-doi-org.brum.beds.ac.uk/10.3390/c7020044
Chicago/Turabian StylePicca, Francesca, Angela Di Pietro, Mario Commodo, Patrizia Minutolo, and Andrea D’Anna. 2021. "Variable Temperature Synthesis of Tunable Flame-Generated Carbon Nanoparticles" C 7, no. 2: 44. https://0-doi-org.brum.beds.ac.uk/10.3390/c7020044
Note that from the first issue of 2016, this journal uses article numbers instead of page numbers. See further details here.