
Raman Spectroscopy Investigation of Graphene Oxide Reduction by Laser Scribing


Dipartimento di Scienze Chimiche, Università degli Studi di Catania, Viale A. Doria 6, 95125 Catania, Italy
*
Author to whom correspondence should be addressed.
C 2021, 7(2), 48; https://0-doi-org.brum.beds.ac.uk/10.3390/c7020048
Submission received: 31 May 2021
/
Revised: 10 June 2021
/
Accepted: 11 June 2021
/
Published: 17 June 2021
(This article belongs to the Collection Feature Papers in the Science and Engineering of Carbons)
Abstract
:Laser scribing has been proposed as a fast and easy tool to reduce graphene oxide (GO) for a wide range of applications. Here, we investigate laser reduction of GO under a range of processing and material parameters, such as laser scan speed, number of laser passes, and material coverage. We use Raman spectroscopy for the characterization of the obtained materials. We demonstrate that laser scan speed is the most influential parameter, as a slower scan speed yields poor GO reduction. The number of laser passes is influential where the material coverage is higher, producing a significant improvement of GO reduction on a second pass. Material coverage is the least influential parameter, as it affects GO reduction only under restricted conditions.
1. Introduction
Laser scribing has arisen over the past decade as an easy, efficient and low-cost method for the modification of materials, which can be mask-less patterned without the use of expensive lithographic techniques that also require a clean room environment [1,2].
Processing graphene in liquid media is a challenge that has been solved over the years via different approaches. It can be dissolved in organic solvents [3], in water with the aid of surfactants [4], or in its oxidized form [5]. The oxidation of graphene introduces oxygen-containing groups, such as hydroxyl, carboxyl, or epoxy, into the carbon-based honeycomb structure of pristine graphene, thus making it soluble in water without the use of any surfactants or polymers [5]. Graphene oxide (GO) properties are deeply different from pristine graphene, so it has to be reduced back after processing to obtain a new material known as reduced GO (RGO) that resembles graphene [5,6,7].
While GO reduction is typically carried out chemically, laser scribing of GO has been proposed as a faster, easier, and chemical-free alternative, able to produce conductive patterns with a resolution down to 1 μm with no need of expensive lithography and clean-room technology. In this process, the laser energy transferred onto GO induces the material to release CO2 and H2O, thus partially recreating the graphene structure [1,8]. Moreover, laser scribing is particularly suitable to create patterned structures with resolution in the order of 1 μm. Indeed, laser-produced RGO has mainly found applications in sensing, such as humidity sensing [9,10,11,12,13], gas sensing [9,10], and strain sensing [11], as well as energy storage [12,13,14,15]. Moreover, it has the potential to expand its application range to photonics and optoelectronics [16], where graphene employment has already been proven.
In our previous work [17], we demonstrated that the scribing environment is a key factor in achieving high-quality RGO and that Argon-based atmospheres yield the best outcome in terms of similarity of RGO to pristine graphene. In this paper, we determine the best materials and processing conditions to achieve the best possible RGO quality by investigating parameters such as scribing speed, amount of material, and number of scribing passes. We show that the most influential parameter is the scribing speed, while the amount of material and number of scribing passes are only influential under certain conditions.
2. Materials and Methods
GO was purchased from Graphenea as a 0.4 wt% water solution, with a declared monolayer content >95%. The solution was used after a 30 min bath ultrasonication. Defined volumes (400 and 850 μL) of such solution were drop-casted onto PET substrates (size 2 × 2 cm) to give samples with 400 and 850 μg/cm2, respectively, which from now on we will refer to as #400 and #850 samples for simplicity. Once drop-casted, the solution was left to dry on the PET substrate under ambient conditions, which took around two days.
The as-produced samples were laser-scribed under Argon and Argon:H2 (95:5) atmospheres using a Qiilu DK-BL machine bearing a 405 nm laser with 1.5 W power. Three different scan rates were used (5.9, 2.7, 1.2 mm/s) to produce a simple pattern made of a 2 cm-long line. Note that 5.9 and 1.2 mm/s are, respectively, the fastest and slowest scan speeds allowed by our system.
The quality of RGO was investigated by performing Raman spectroscopy (WITec Alpha 300 RS spectrometer) at 532 nm excitation. For each sample produced, we acquired 20 spectra at random locations (10 × 10 s acquisitions). For each spectrum, peaks were fitted by Lorentzian curves using the OriginPro 8.5 package, and the fitting parameters were statistically analyzed. Examples of such fittings are shown in Figure 1, Figure 2, Figure 3 and Figure 4 from Ref. [18].
3. Results and Discussion
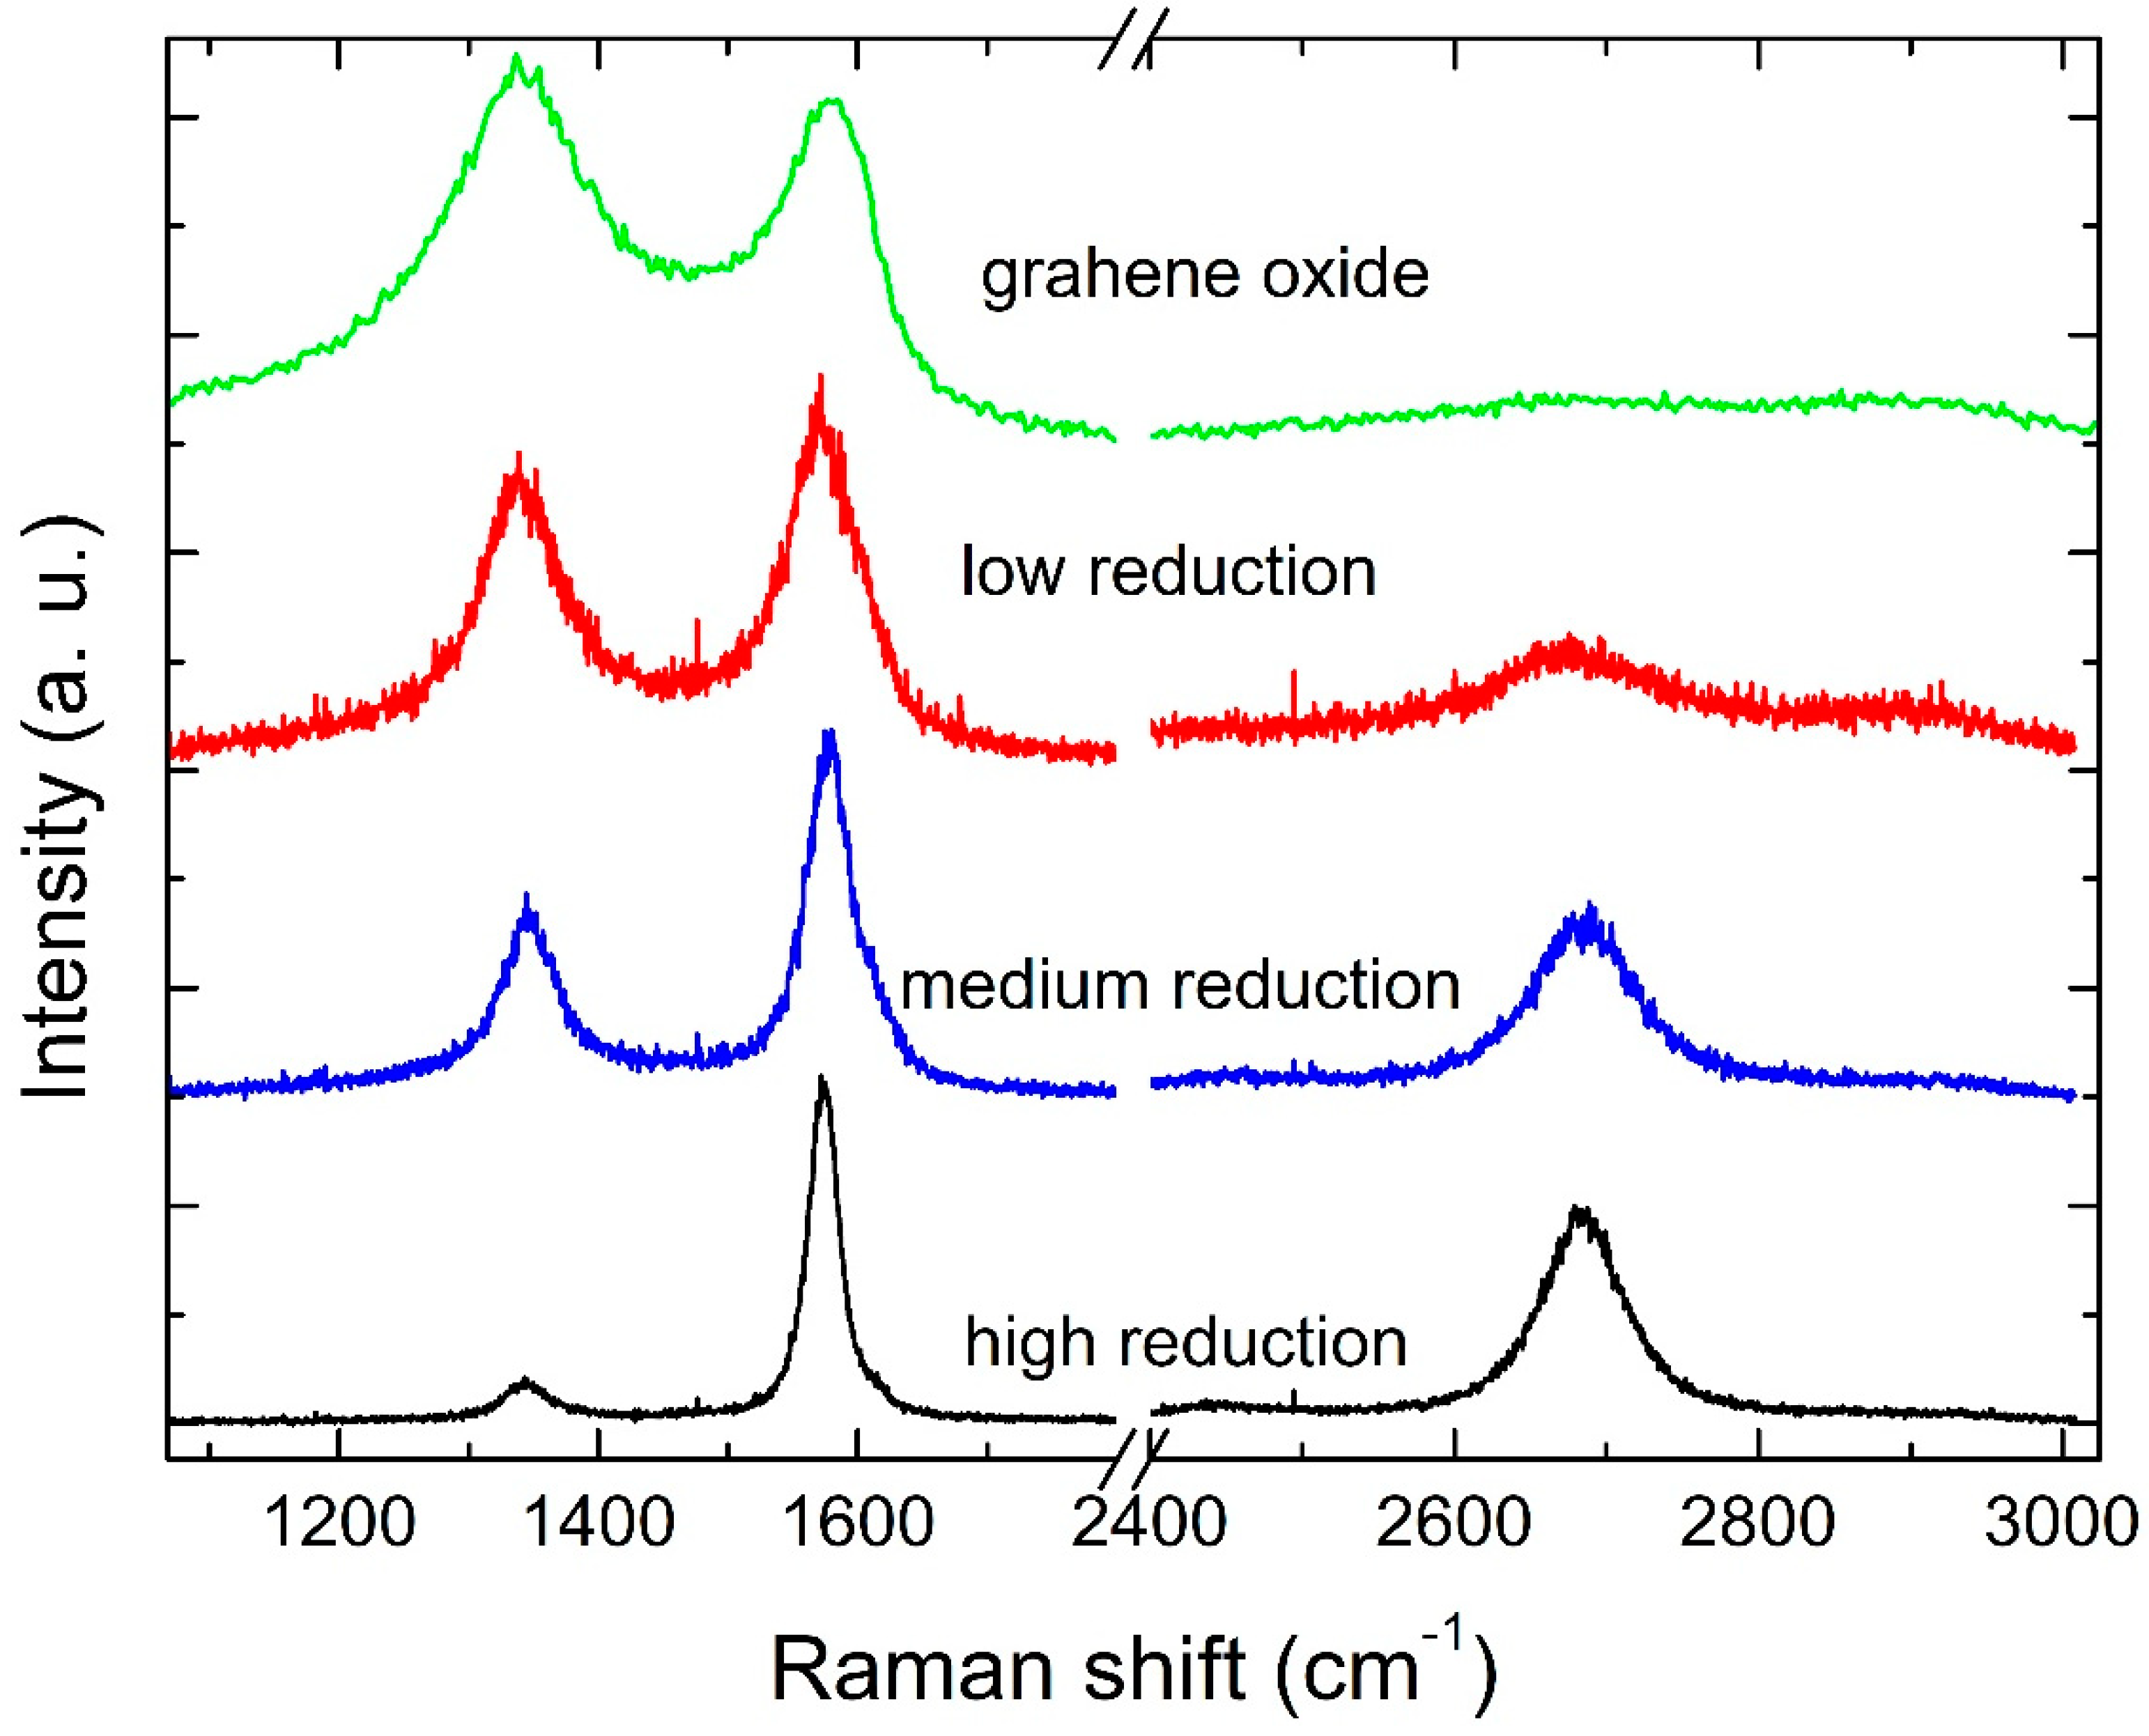
The quality of the obtained RGO was investigated by Raman spectroscopy, long-established as the simplest and non-invasive tool for the characterization of carbon structures [19]. Example Raman spectra of high, average, and low quality RGO, as well as GO, are shown in Figure 1. Such spectra show the G and D bands that are typical of Carbon nanostructures. While the G-band is generated by the C−C stretching and appears in all Carbon structures, the D-Band arises from the breathing mode of aromatic rings. The latter is forbidden by the fundamental q = 0 Raman selection rule and is only visible in the presence of disorder in the structure [20]. The intensity ratio of the D and G band (ID/IG) may thus be an indirect estimation of the disorder within the material and is what we use in our investigation. However, it has been argued that the ID/IG ratio is not a reliable parameter, as its trend with disorder is not monotonous but rather depends on the crystallite size: for a crystallite size lower than 2 nm, ID/IG increases with order [19]. Over the past decade, other peaks have been identified in the D- and G-peak regions for graphene-based materials, which are also related to disorder. Such peaks have been labeled as D* (around 1200 cm−1), D’’ (around 1450–1500 cm−1), and D’ (around 1600 cm−1) [21,22,23,24,25]. Other metrics for disorder evaluation have thus been suggested. For example, the width of the D and G peaks has been observed to decrease upon GO reduction [26]. From the fittings shown in Figure 1, Figure 2, Figure 3 and Figure 4 from Ref. [18], we can notice that D’ is not observed in the GO spectra, while D* is not observed in the RGO spectra. From the fittings carried out in all our spectra, it emerges that a monotonic, increasing relation exists between the ID/IG ratio and the D and G peak widths (Figure 5 in Ref. [18]). We can thus infer that we are in a region in which ID/IG increases with disorder, and thus adopt this parameter, from now on, to interpret our results. King et al. suggested that the peak position difference between D’ and G is directly related to the oxygen content in GO [25]. Interestingly, they categorized the material depending on such D’-G position difference, whereby D’-G < 0 identifies GO, 0 < D’-G < 25 identifies RGO and D’-G > 25 identifies graphene. From fitting our data, where a D’ peak arises from the fitting procedure, the D’-G quantity is always greater than 25, thus according to this definition, our material properties go beyond RGO and can be indeed considered as graphene.
RGO spectra also show a 2D band that appears as a single component. From our analysis, the peak width falls in the range of 50–70 cm−1, much larger than pristine graphene. This is an indication that RGO layers rest on top of each other without electronically interacting [27,28]. This is not surprising as the starting GO material is made of monolayers. Therefore, due to the sample preparation method, we can infer that RGO monolayers are stacked on top of each other.
For a thorough investigation of the sample and processing conditions, we performed two different sets of experiments. In the first set, we investigated the quality of the obtained RGO according to the quantity of material deposited and the scan speed in both Argon and Argon/H2 atmospheres.
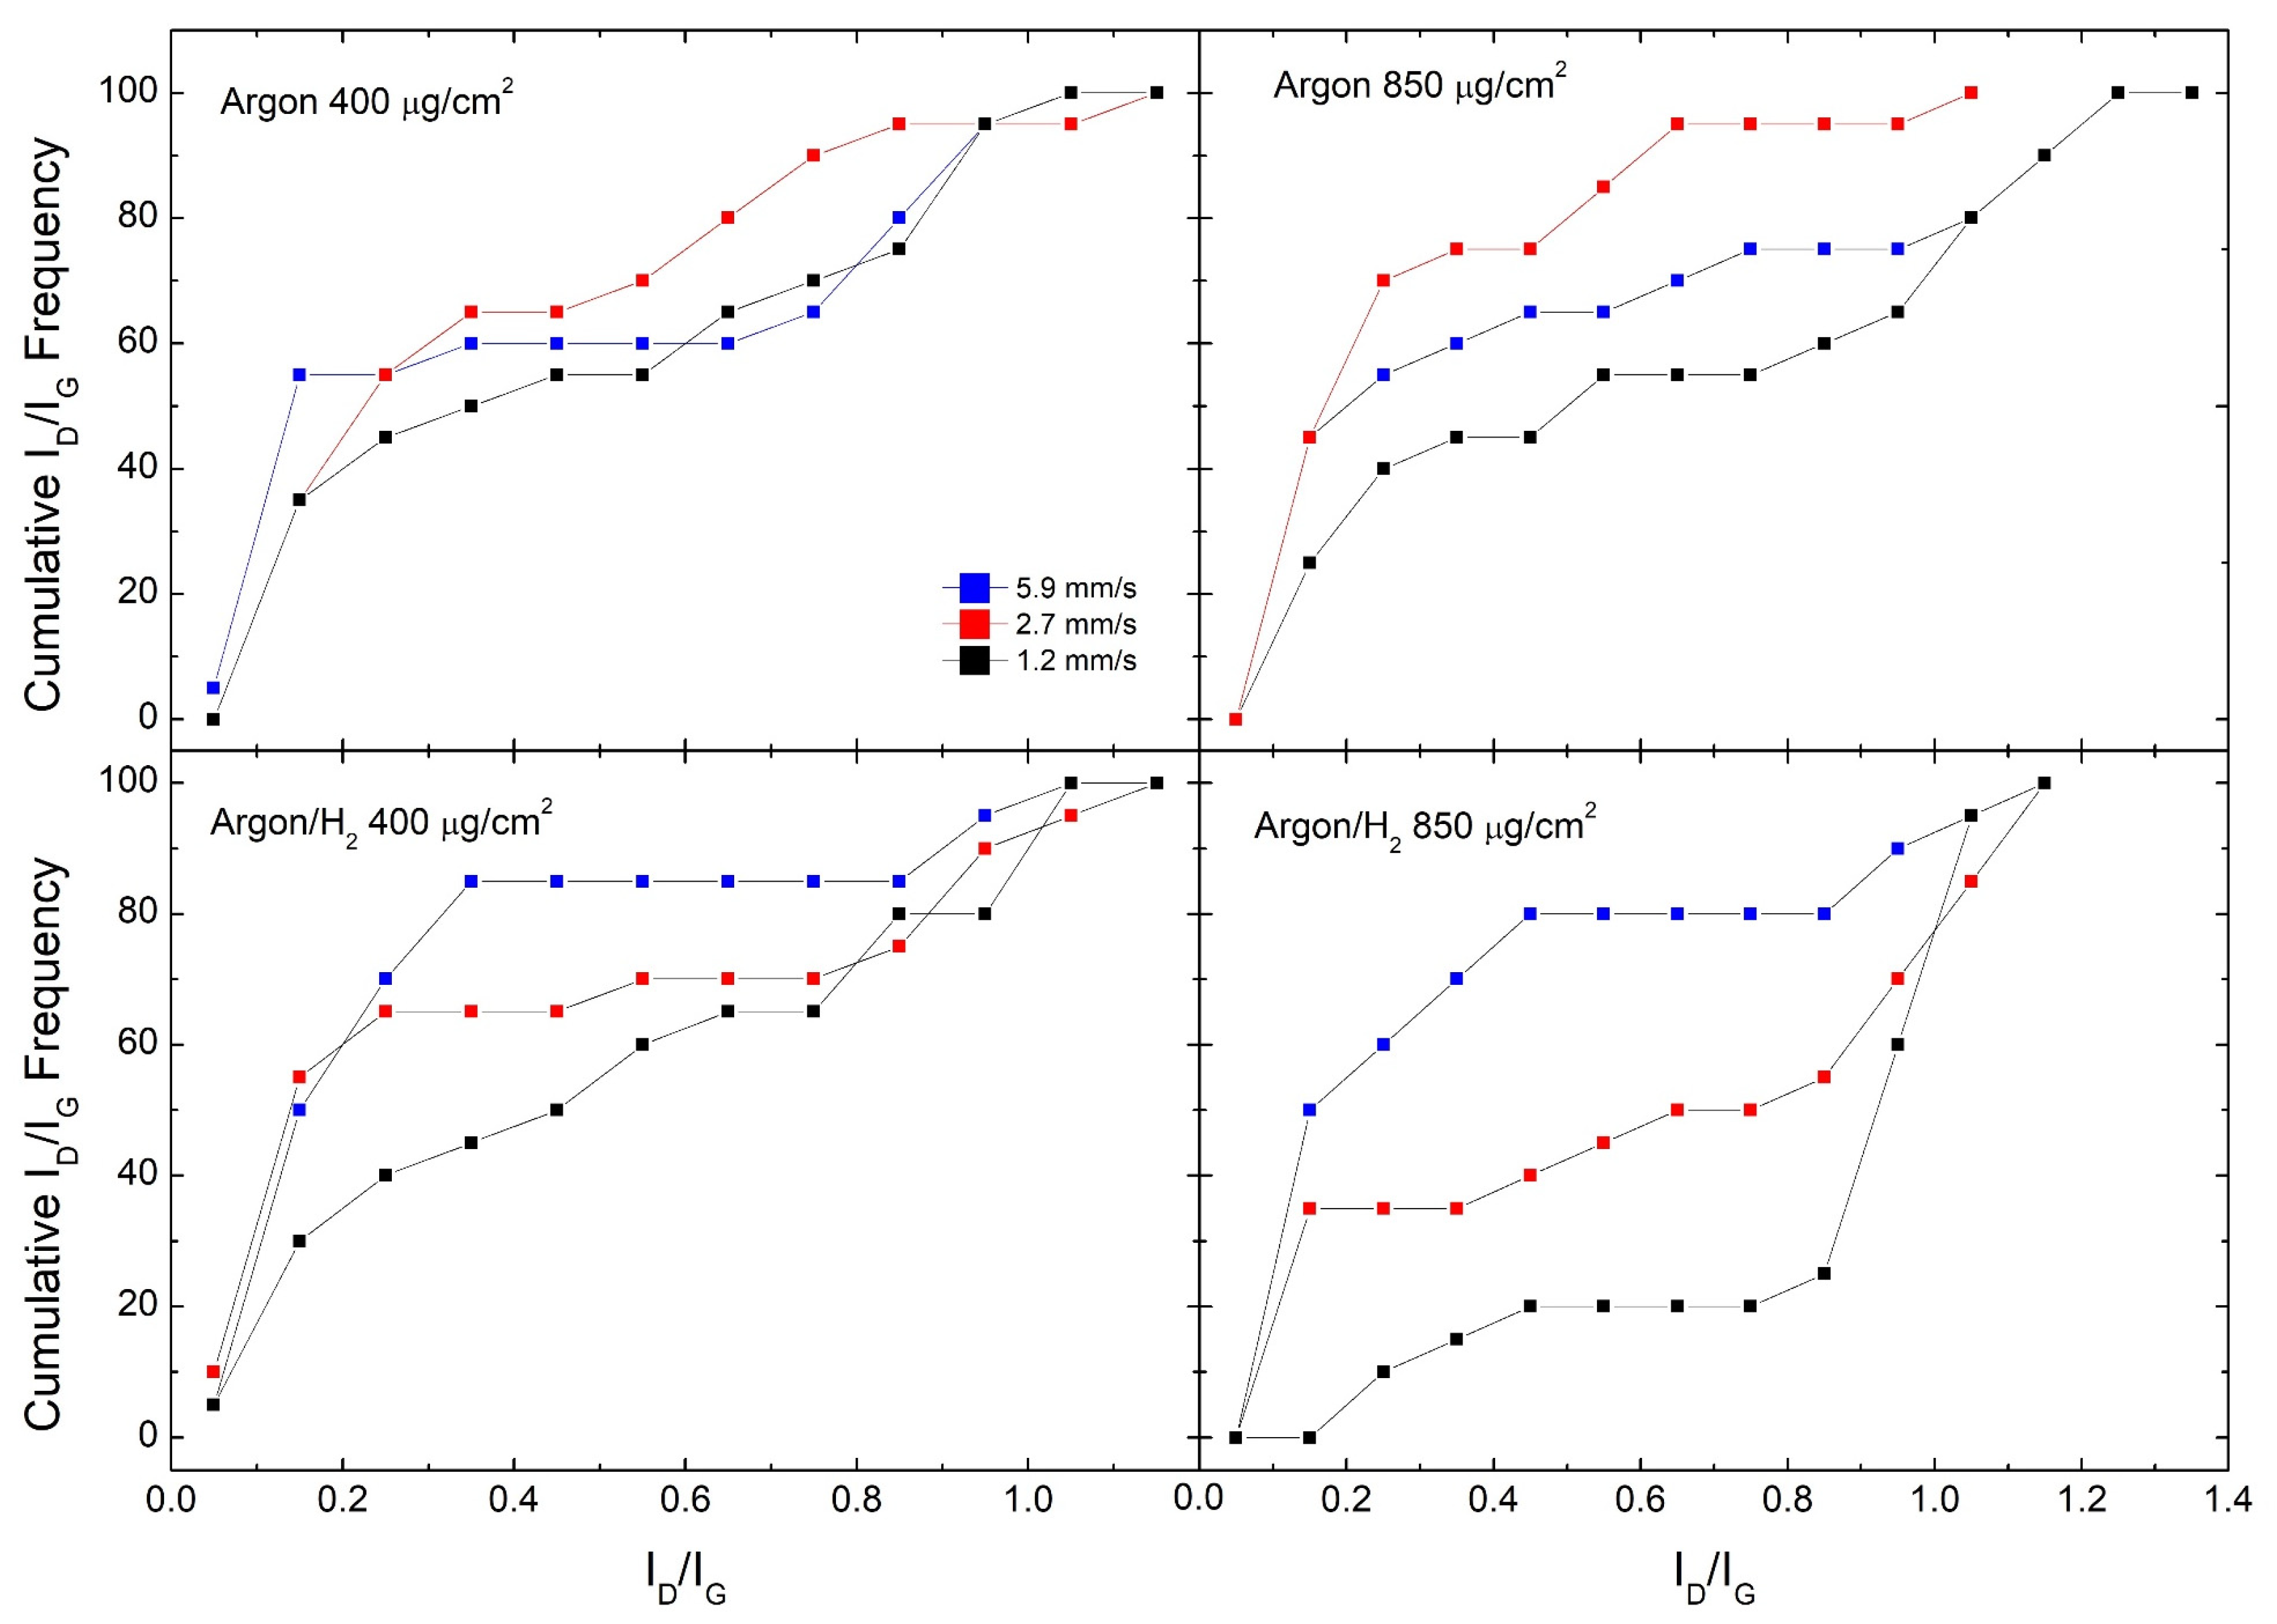
Figure 2 shows cumulative ID/IG frequencies for all samples in the said set of experiments, comparing different scan speeds. This means, according to textbook definitions of cumulative distribution, that the value of the distribution at ID/IG = x is the number of occurrences in which ID/IG < x. We observe that samples produced in the Argon/H2 atmosphere show a clear trend, where the fastest scan speed produces the best quality RGO while the slowest scan speed produces the worst. For example, #850 samples produced at 5.9 mm/s have 50% of ID/IG < 0.2, while samples produced at 2.7 mm/s have 35% and none for 1.2 mm/s. Moreover, #400 samples produced at 5.9 mm/s have 85% of ID/IG below 0.4, while this fraction falls to 65% at 2.7 mm/s and 45% at 1.2 mm/s. In Argon, the #850 sample shows a clear trend, where the slowest scan speed (1.2 mm/s) still shows the poorest performance, while the best performance is shown by the intermediate scan speed (2.7 mm/s). On the other hand, for the #400 sample, there is no clear trend like in the previous cases, but the 2.7 mm/s scan speed seems to offer the best RGO overall quality.
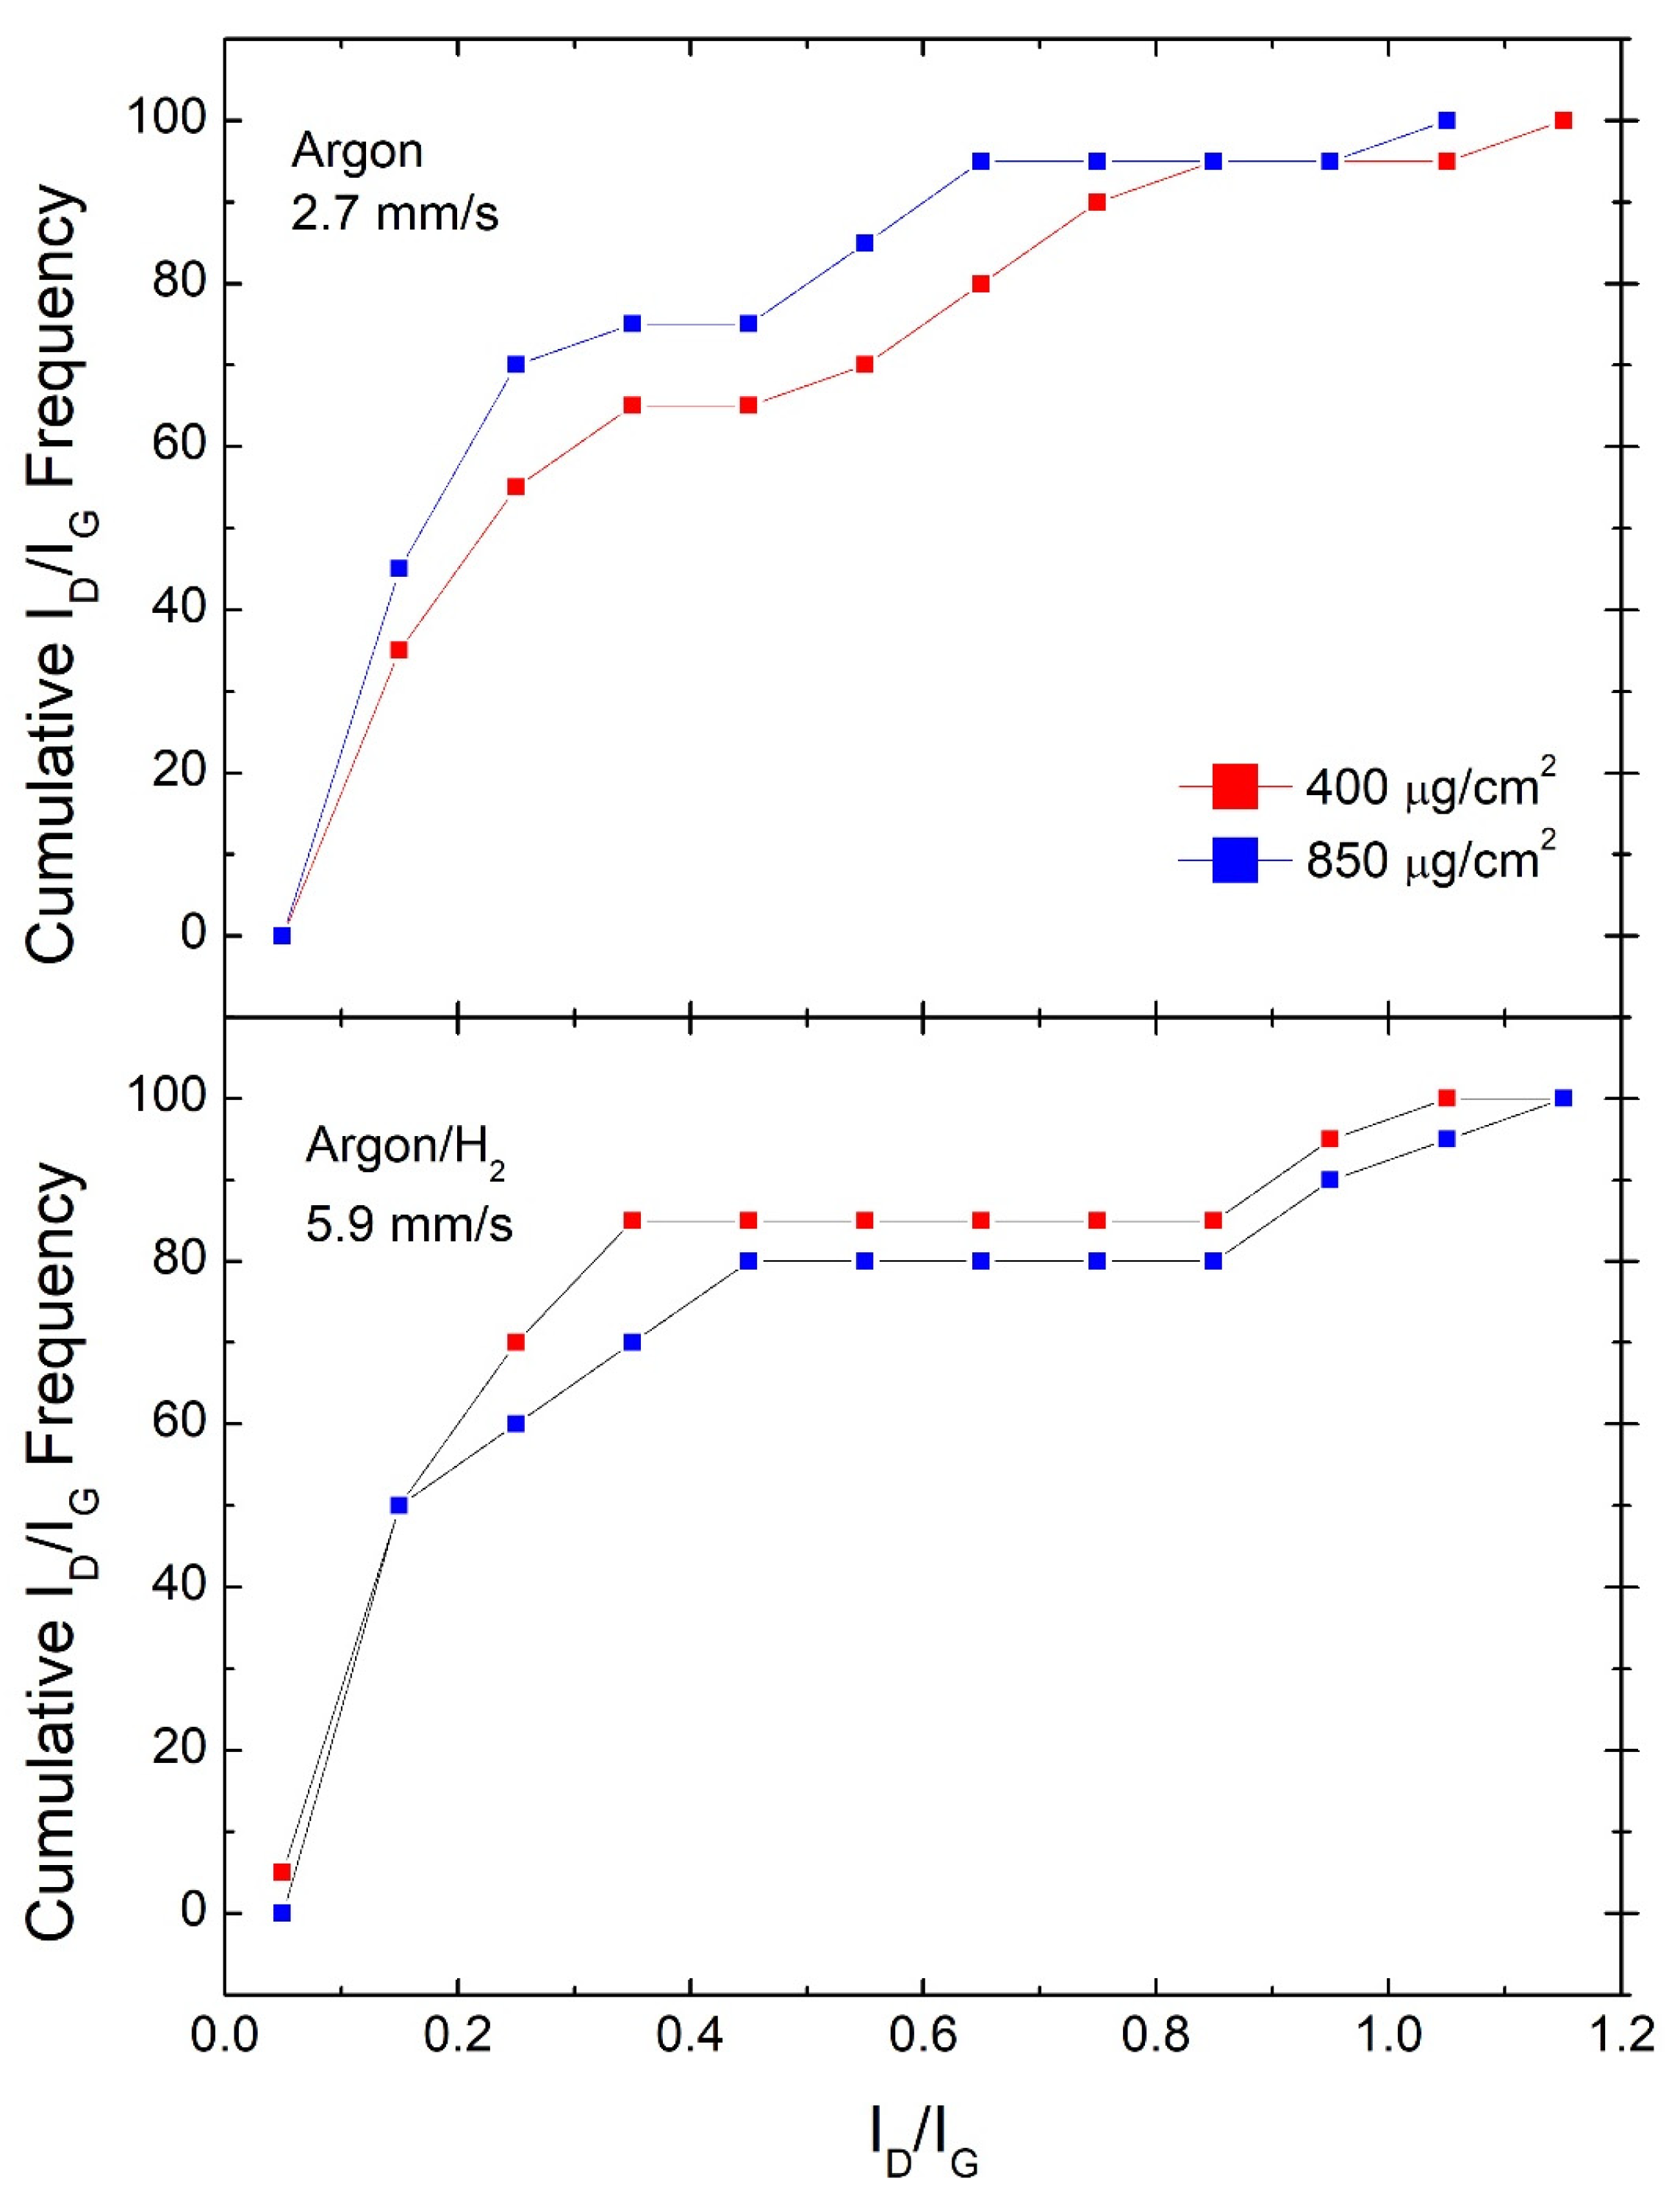
In Figure 3, we perform a similar comparison by reporting cumulative ID/IG frequencies for samples produced at the best performing scan speed towards the amount of material deposited, that is, 2.7 mm/s for Argon and 5.9 mm/s for Argon/H2. It can be observed that in Argon, sample #850 shows a better performance, while in Argon/H2, sample #400 shows a slightly better performance in terms of RGO quality. Similar comparisons at the other scan speeds, reported in Figures 6 and 7 from Ref. [18], show wider gaps in favor of the #400 samples, while no clear trends can be observed for the other Argon samples.
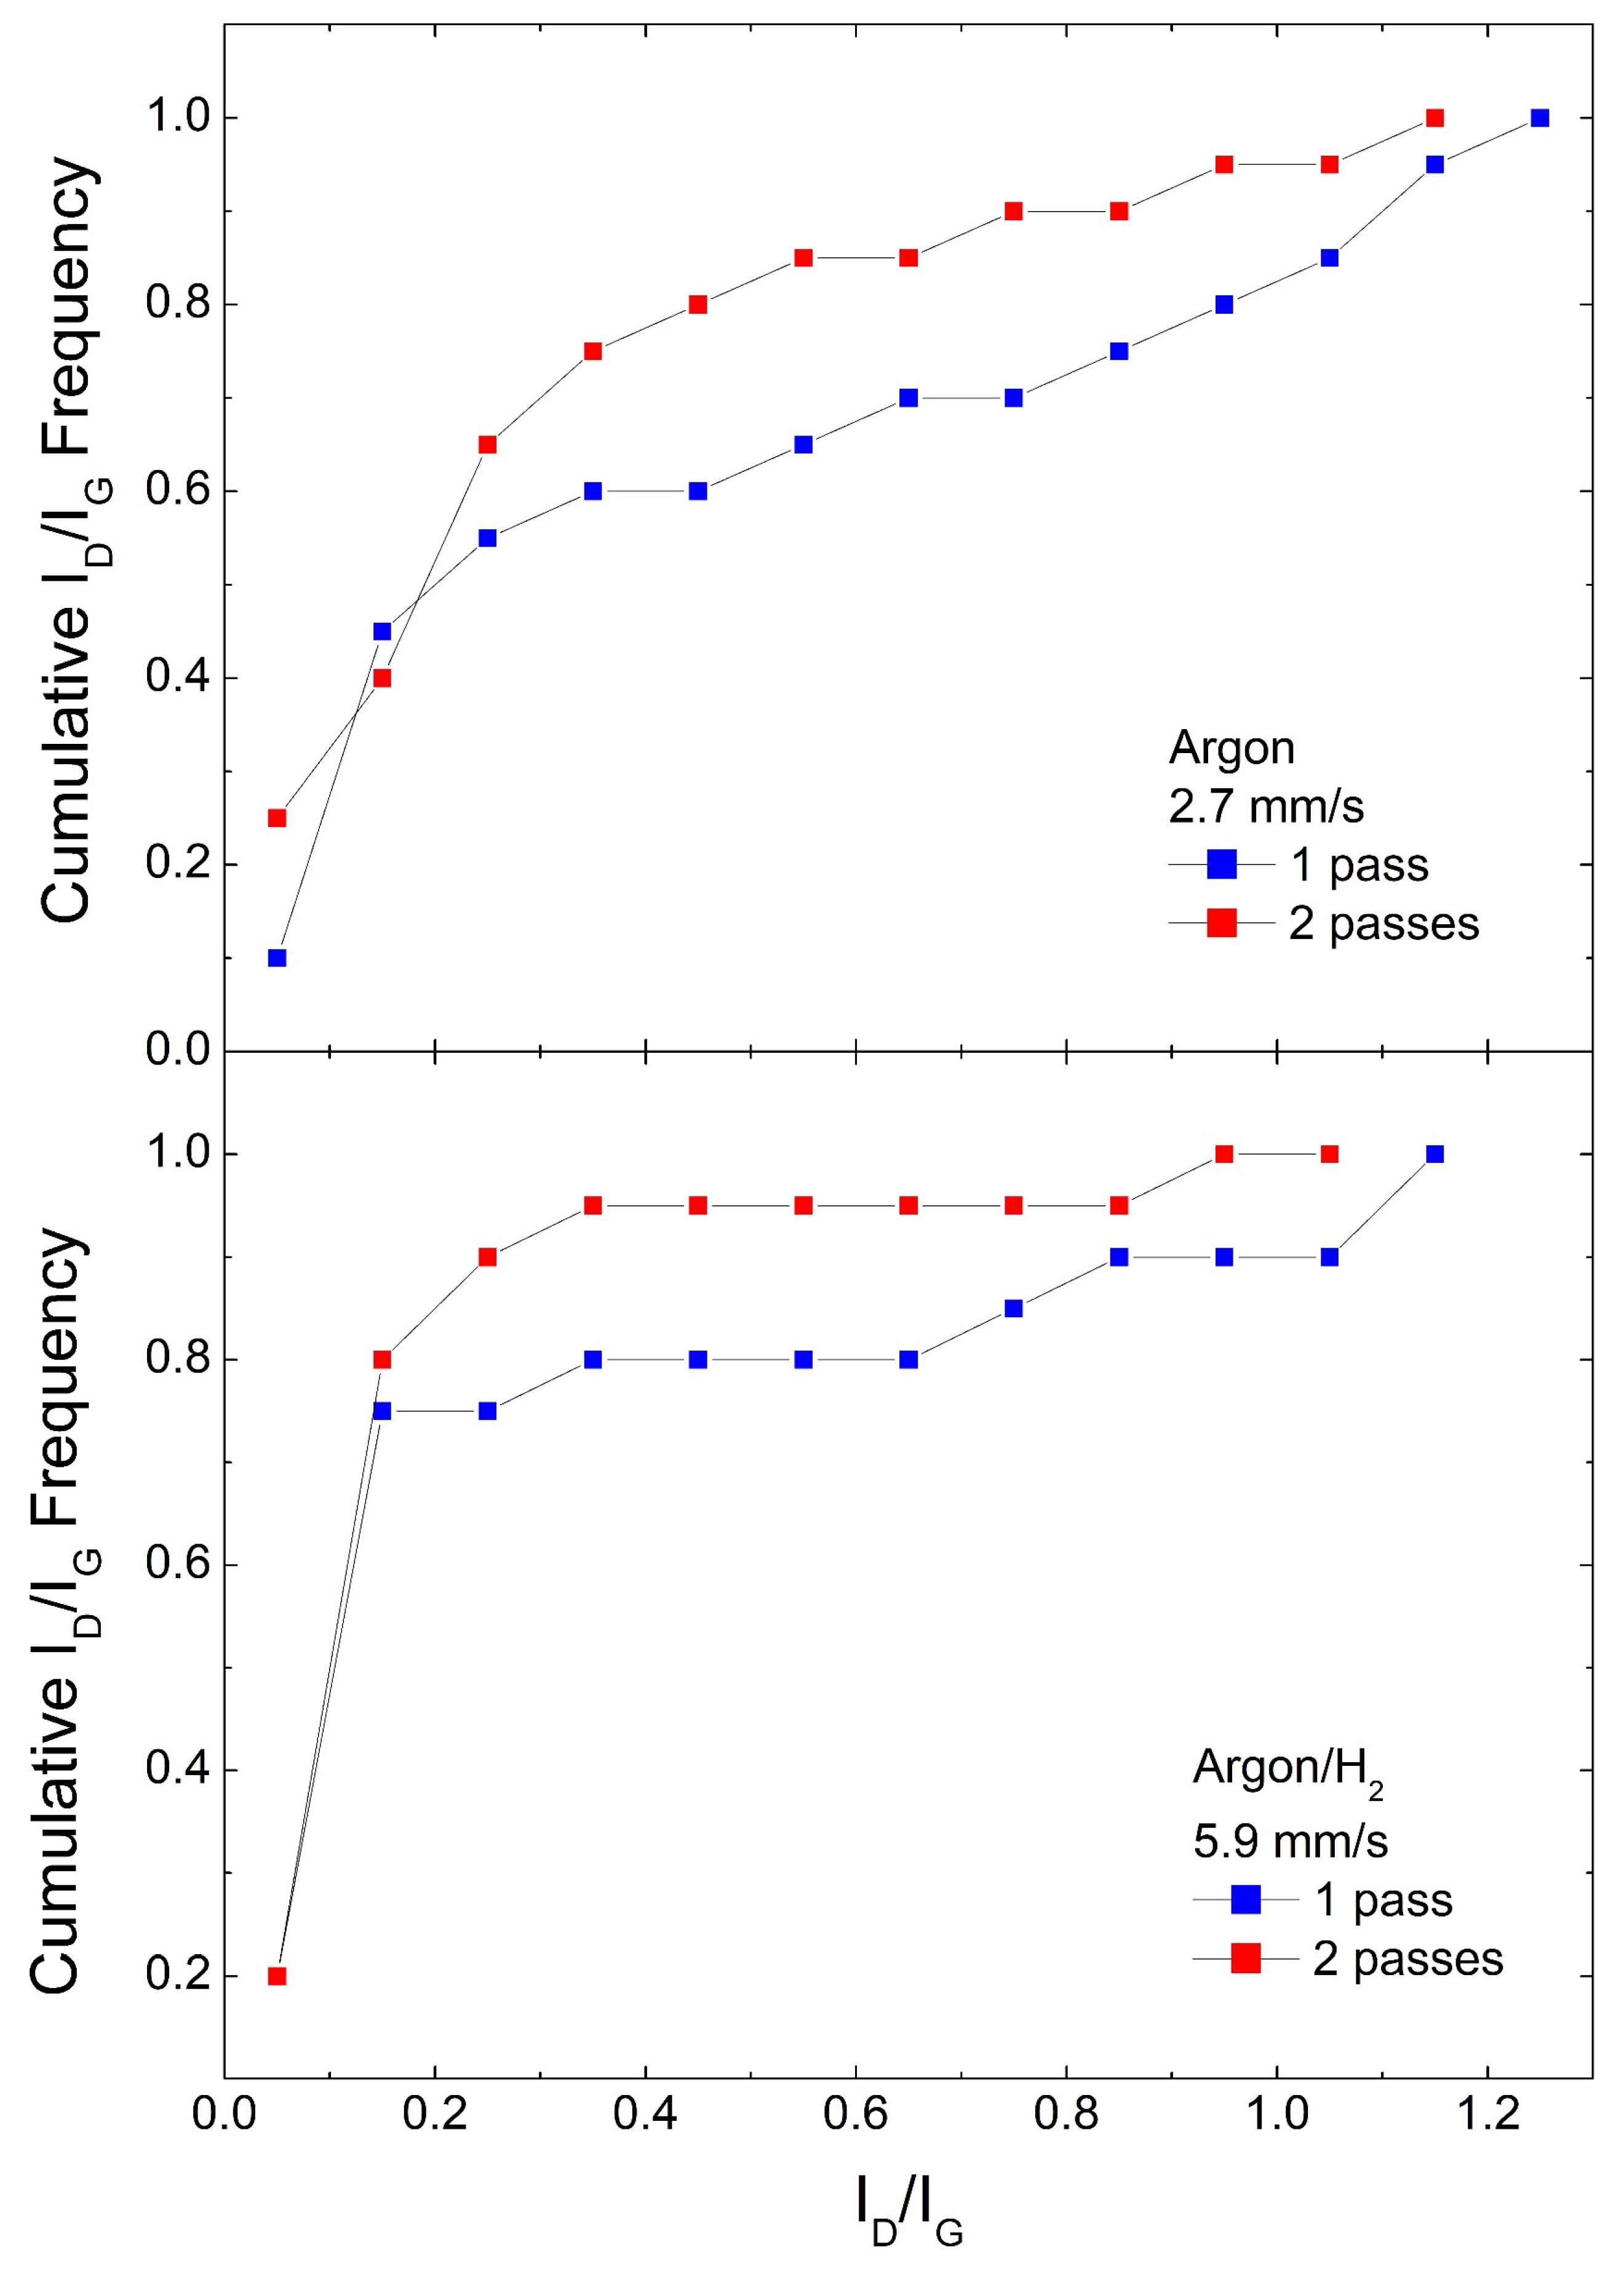
In a second set of experiments, we analyze similar samples where the pattern was created by passing the laser twice, again using both Argon and Argon/H2 atmospheres and the two different material coverages. We chose the same scan speed we used in Figure 3, as this produced the best performance in terms of the lowest ID/IG distribution, namely 2.7 mm/s for Argon and 5.9 mm/s for Argon/H2. Figure 4 shows the cumulative ID/IG frequencies for #850 samples. It can be observed that in both Argon and Argon/H2 a second scribing pass improves the yield of very low ID/IG data. Again, the Argon/H2 atmosphere shows a better performance, with an impressive 90% data with ID/IG < 0.3. In samples #400, shown in Figure 8 from Ref. [18], there is no significant improvement on a second laser pass.
Our results suggest that the key for optimizing the laser reduction conditions is to achieve the best balance between reduction by heat and the dissipation of the heat itself. Moreover, this balance is influenced by the environment in which the reduction takes place. If we consider the scan speed, a slower speed introduces much more heat into the system than a faster speed. Thus one might think that a heat-induced reduction would be more efficient. Instead, we observe the opposite since slower speeds yield poor reduction performance. This suggests that an excess accumulation of heat is detrimental to the reduction process. On the other hand, while faster speeds yield better results in terms of GO reduction, this is not to the same extent in the two different atmospheres we used. Argon/H2 seems by far the best atmosphere to carry out GO laser reduction. In this atmosphere, the reduction process is very efficient at the fastest scan speed, suggesting that in the presence of H2, thus in a slightly reducing atmosphere, the process needs a lower amount of heat. However, in pure Argon, the optimum performance, while still inferior to the Argon/H2 atmosphere, happens at an intermediate speed, suggesting that in an inert atmosphere, the need for heat is superior.
The results obtained in the second set of experiments, introducing a second laser pass, give a further insight into the process and the effect of material coverage. The fact that a second laser pass provides a significant improvement on #850 samples only suggests that where less material is present, a single laser pass provides enough heat to maximize the reduction process. On the other hand, where more material is present on the substrate, there is still the need for heat to bring the reduction process forward. However, this is better provided by a second laser pass rather than a slower scan speed. Indeed, in the former case, there is enough time between the two passes to dissipate the heat, while in the latter case, excess heat would accumulate and hinder the reduction process. This can be understood by the significantly reduced thermal conductivity of GO compared to graphite [29]. Focusing on the single-pass experiments, material coverage has little or no effect in Argon samples, while it has a dramatic effect in samples produced at slower scan speed in Argon/H2, so hydrogen clearly has an effect. We might hypothesize that in this atmosphere, the reduction is mainly hydrogen-driven and that a slower scan speed lets the system accumulate more heat. Such heat is then hardly dissipated in a system that could be more-packed, like in samples #850.
4. Conclusions
We carried out a systematic investigation of the laser reduction of GO under a range of experimental conditions, using Raman spectroscopy as a tool to determine the quality of the obtained material. We demonstrated that the scan speed is a crucial parameter, as a slow speed would negatively affect the material’s quality, while material density was found to be less influential. We have also demonstrated that a second laser pass, over an already treated surface, is beneficial to the final RGO quality for higher density samples.
Author Contributions
Conceptualization, V.S.; methodology, V.S. and G.C.; validation, V.S. and G.C.; formal analysis, V.S.; investigation, V.S.; data curation, V.S.; writing—original draft preparation, V.S.; writing—review and editing, V.S. and G.C.; supervision, G.C.; funding acquisition, G.C. All authors have read and agreed to the published version of the manuscript.
Funding
This research was funded by the PON project Bionanotech Research and Innovation Tower (BRIT) financed by the Italian Ministry for Education, University and Research (MIUR) and the “NaTI4Smart” interdepartmental project.
Institutional Review Board Statement
Not applicable.
Informed Consent Statement
Not applicable.
Data Availability Statement
The data presented in this study are available on request from the corresponding author.
Conflicts of Interest
The authors declare no conflict of interest.
References
- Zhou, Y.; Loh, K.P. Making Patterns on Graphene. Adv. Mater. 2010, 22, 3615–3620. [Google Scholar] [CrossRef] [PubMed]
- Zhou, Y.; Bao, Q.; Varghese, B.; Tang, L.A.L.; Tan, C.K.; Sow, C.-H.; Loh, K.P. Microstructuring of Graphene Oxide Nanosheets Using Direct Laser Writing. Adv. Mater. 2010, 22, 67–71. [Google Scholar] [CrossRef] [PubMed]
- Hernandez, Y.; Nicolosi, V.; Lotya, M.; Blighe, F.M.; Sun, Z.; De, S.; McGovern, I.T.; Holland, B.; Byrne, M.; Gun’Ko, Y.K.; et al. High-yield production of graphene by liquid-phase exfoliation of graphite. Nat. Nanotechnol. 2008, 3, 563–568. [Google Scholar] [CrossRef] [Green Version]
- Lotya, M.; Hernandez, Y.; King, P.J.; Smith, R.J.; Nicolosi, V.; Karlsson, L.S.; Blighe, F.M.; De, S.; Wang, Z.; McGovern, I.T.; et al. Liquid Phase Production of Graphene by Exfoliation of Graphite in Surfactant/Water Solutions. J. Am. Chem. Soc. 2009, 131, 3611–3620. [Google Scholar] [CrossRef] [Green Version]
- Dreyer, D.R.; Park, S.; Bielawski, C.W.; Ruoff, R.S. The chemistry of graphene oxide. Chem. Soc. Rev. 2010, 39, 228–240. [Google Scholar] [CrossRef]
- Zhu, Y.; Murali, S.; Cai, W.; Li, X.; Suk, J.W.; Potts, J.R.; Ruoff, R.S. Graphene and Graphene Oxide: Synthesis, Properties, and Applications. Adv. Mater. 2010, 22, 3906–3924. [Google Scholar] [CrossRef]
- Stankovich, S.; Dikin, D.A.; Piner, R.D.; Kohlhaas, K.A.; Kleinhammes, A.; Jia, Y.; Wu, Y.; Nguyen, S.T.; Ruoff, R.S. Synthesis of graphene-based nanosheets via chemical reduction of exfoliated graphite oxide. Carbon 2007, 45, 1558–1565. [Google Scholar] [CrossRef]
- Sokolov, D.A.; Shepperd, K.R.; Orlando, T.M. Formation of Graphene Features from Direct Laser-Induced Reduction of Graphite Oxide. J. Phys. Chem. Lett. 2010, 1, 2633–2636. [Google Scholar] [CrossRef]
- Strong, V.; Dubin, S.; El-Kady, M.F.; Lech, A.; Wang, Y.; Weiller, B.H.; Kaner, R.B. Patterning and Electronic Tuning of Laser Scribed Graphene for Flexible All-Carbon Devices. ACS Nano 2012, 6, 1395–1403. [Google Scholar] [CrossRef]
- Choi, S.-J.; Kim, S.-J.; Kim, I.-D. Ultrafast optical reduction of graphene oxide sheets on colorless polyimide film for wearable chemical sensors. NPG Asia Mater. 2016, 8, e315. [Google Scholar] [CrossRef]
- Tian, H.; Shu, Y.; Cui, Y.-L.; Mi, W.-T.; Yang, Y.; Xie, D.; Ren, T.-L. Scalable fabrication of high-performance and flexible graphene strain sensors. Nanoscale 2014, 6, 699–705. [Google Scholar] [CrossRef]
- Cai, F.; Tao, C.-A.; Li, Y.; Yin, W.; Wang, X.; Wang, J. Effects of amount of graphene oxide and the times of LightScribe on the performance of all-solid-state flexible graphene-based micro-supercapacitors. Mater. Res. Express 2017, 4, 036304. [Google Scholar] [CrossRef]
- El-Kady, M.F.; Strong, V.; Dubin, S.; Kaner, R.B. Laser Scribing of High-Performance and Flexible Graphene-Based Electrochemical Capacitors. Science 2012, 335, 1326. [Google Scholar] [CrossRef] [Green Version]
- El-Kady, M.F.; Kaner, R.B. Scalable fabrication of high-power graphene micro-supercapacitors for flexible and on-chip energy storage. Nat. Commun. 2013, 4, 1475. [Google Scholar] [CrossRef] [PubMed]
- Gao, W.; Singh, N.; Song, L.; Liu, Z.; Reddy, A.L.M.; Ci, L.; Vajtai, R.; Zhang, Q.; Wei, B.; Ajayan, P.M. Direct laser writing of micro-supercapacitors on hydrated graphite oxide films. Nat. Nanotechnol. 2011, 6, 496–500. [Google Scholar] [CrossRef] [PubMed]
- Fu, B.; Sun, J.; Wang, G.; Shang, C.; Ma, Y.; Ma, J.; Xu, L.; Scardaci, V. Solution-processed two-dimensional materials for ultrafast fiber lasers (invited). Nanophotonics 2020, 9, 2169–2189. [Google Scholar] [CrossRef] [Green Version]
- Scardaci, V.; Fichera, L.; Fragalà, M.E.; Tuccitto, N.; Marletta, G.; Compagnini, G. Reduction of Graphene Oxide by Laser Scribing in Different Atmospheres and Application in Humidity Sensing. J. Nanomater. 2020, 2020, 4946954. [Google Scholar] [CrossRef]
- Scardaci, V.; Compagnini, G. Raman Spectroscopy Data Related to the Laser Induced Reduction of Graphene Oxide. Data Brief 2021, in press. [Google Scholar]
- Ferrari, A.C. Raman spectroscopy of graphene and graphite: Disorder, electron–phonon coupling, doping and nonadiabatic effects. Solid State Commun. 2007, 143, 47–57. [Google Scholar] [CrossRef]
- Ferrari, A.C.; Robertson, J. Interpretation of Raman spectra of disordered and amorphous carbon. Phys. Rev. B 2000, 61, 14095–14107. [Google Scholar] [CrossRef] [Green Version]
- Díez-Betriu, X.; Álvarez-García, S.; Botas, C.; Álvarez, P.; Sánchez-Marcos, J.; Prieto, C.; Menéndez, R.; de Andrés, A. Raman spectroscopy for the study of reduction mechanisms and optimization of conductivity in graphene oxide thin films. J. Mater. Chem. C 2013, 1, 6905–6912. [Google Scholar] [CrossRef]
- Claramunt, S.; Varea, A.; López-Díaz, D.; Velázquez, M.M.; Cornet, A.; Cirera, A. The Importance of Interbands on the Interpretation of the Raman Spectrum of Graphene Oxide. J. Phys. Chem. C 2015, 119, 10123–10129. [Google Scholar] [CrossRef]
- López-Díaz, D.; López Holgado, M.; García-Fierro, J.L.; Velázquez, M.M. Evolution of the Raman Spectrum with the Chemical Composition of Graphene Oxide. J. Phys. Chem. C 2017, 121, 20489–20497. [Google Scholar] [CrossRef]
- Kaniyoor, A.; Ramaprabhu, S. A Raman spectroscopic investigation of graphite oxide derived graphene. AIP Adv. 2012, 2, 032183. [Google Scholar] [CrossRef] [Green Version]
- King, A.A.K.; Davies, B.R.; Noorbehesht, N.; Newman, P.; Church, T.L.; Harris, A.T.; Razal, J.M.; Minett, A.I. A New Raman Metric for the Characterisation of Graphene oxide and its Derivatives. Sci. Rep. 2016, 6, 19491. [Google Scholar] [CrossRef] [Green Version]
- Coleman, J.N.; Lotya, M.; O’Neill, A.; Bergin, S.D.; King, P.J.; Khan, U.; Young, K.; Gaucher, A.; De, S.; Smith, R.J.; et al. Two-Dimensional Nanosheets Produced by Liquid Exfoliation of Layered Materials. Science 2011, 331, 568. [Google Scholar] [CrossRef] [Green Version]
- Ferrari, A.C.; Meyer, J.C.; Scardaci, V.; Casiraghi, C.; Lazzeri, M.; Mauri, F.; Piscanec, S.; Jiang, D.; Novoselov, K.S.; Roth, S.; et al. Raman Spectrum of Graphene and Graphene Layers. Phys. Rev. Lett. 2006, 97, 187401. [Google Scholar] [CrossRef] [Green Version]
- Ferrari, A.C.; Basko, D.M. Raman spectroscopy as a versatile tool for studying the properties of graphene. Nat. Nanotechnol. 2013, 8, 235–246. [Google Scholar] [CrossRef] [Green Version]
- Mu, X.; Wu, X.; Zhang, T.; Go, D.B.; Luo, T. Thermal Transport in Graphene Oxide—From Ballistic Extreme to Amorphous Limit. Sci. Rep. 2014, 4, 3909. [Google Scholar] [CrossRef] [PubMed] [Green Version]
Figure 1.
Examples of Raman spectra from RGO at high, medium and low reduction, and from GO as sourced from the supplier.
Figure 1.
Examples of Raman spectra from RGO at high, medium and low reduction, and from GO as sourced from the supplier.

Figure 2.
Cumulative ID/IG frequencies for GO samples reduced in Argon and Argon/H2 at different laser scan speeds.
Figure 2.
Cumulative ID/IG frequencies for GO samples reduced in Argon and Argon/H2 at different laser scan speeds.

Figure 3.
Comparison of cumulative ID/IG frequencies for samples #400 and samples #850 shown for scan speeds producing the most efficient GO reduction in each atmosphere.
Figure 3.
Comparison of cumulative ID/IG frequencies for samples #400 and samples #850 shown for scan speeds producing the most efficient GO reduction in each atmosphere.

Figure 4.
Cumulative ID/IG frequencies for #850 samples under single and double laser pass.
Publisher’s Note: MDPI stays neutral with regard to jurisdictional claims in published maps and institutional affiliations. |
© 2021 by the authors. Licensee MDPI, Basel, Switzerland. This article is an open access article distributed under the terms and conditions of the Creative Commons Attribution (CC BY) license (https://creativecommons.org/licenses/by/4.0/).
Share and Cite
MDPI and ACS Style
Scardaci, V.; Compagnini, G. Raman Spectroscopy Investigation of Graphene Oxide Reduction by Laser Scribing. C 2021, 7, 48. https://0-doi-org.brum.beds.ac.uk/10.3390/c7020048
AMA Style
Scardaci V, Compagnini G. Raman Spectroscopy Investigation of Graphene Oxide Reduction by Laser Scribing. C. 2021; 7(2):48. https://0-doi-org.brum.beds.ac.uk/10.3390/c7020048
Chicago/Turabian StyleScardaci, Vittorio, and Giuseppe Compagnini. 2021. "Raman Spectroscopy Investigation of Graphene Oxide Reduction by Laser Scribing" C 7, no. 2: 48. https://0-doi-org.brum.beds.ac.uk/10.3390/c7020048
Note that from the first issue of 2016, this journal uses article numbers instead of page numbers. See further details here.