
Monitoring of Curing and Cyclic Thermoresistive Response Using Monofilament Carbon Nanotube Yarn Silicone Composites


Department of Mechanical Engineering, The Catholic University of America, Washington, DC 20064, USA
*
Author to whom correspondence should be addressed.
C 2021, 7(3), 60; https://0-doi-org.brum.beds.ac.uk/10.3390/c7030060
Submission received: 21 June 2021
/
Revised: 21 July 2021
/
Accepted: 30 July 2021
/
Published: 4 August 2021
(This article belongs to the Collection Feature Papers in the Science and Engineering of Carbons)
Abstract
:The curing process and thermoresistive response of a single carbon nanotube yarn (CNTY) embedded in a room temperature vulcanizing (RTV) silicone forming a CNTY monofilament composite were investigated toward potential applications in integrated curing monitoring and temperature sensing. Two RTV silicones of different crosslinking mechanisms, SR1 and SR2 (tin- and platinum-cured, respectively), were used to investigate their curing kinetics using the electrical response of the CNTY. It is shown that the relative electrical resistance change of CNTY/SR1 and CNTY/SR2 monofilament composites increased by 3.8% and 3.3%, respectively, after completion of the curing process. The thermoresistive characterization of the CNTY monofilament composites was conducted during heating–cooling ramps ranging from room temperature (RT~25 °C) to 100 °C. The thermoresistive response was nearly linear with a negative temperature coefficient of resistance (TCR) at heating and cooling sections for both CNTY/SR1 and CNTY/SR2 monofilament composites. The average TCR value was −8.36 × 10⁻⁴ °C−1 for CNTY/SR1 and −7.26 × 10⁻⁴ °C−1 for CNTY/SR2. Both monofilament composites showed a negligible negative residual relative electrical resistance change with average values of ~−0.11% for CNTY/SR1 and ~−0.16% for CNTY/SR2 after each cycle. The hysteresis amounted to ~21.85% in CNTY/SR1 and ~29.80% in CNTY/SR2 after each cycle. In addition, the effect of heating rate on the thermoresistive sensitivity of CNTY monofilament composites was investigated and it was shown that it reduces as the heating rate increases.

1. Introduction
Carbon nanotube yarns (CNTYs), continuous fiber-like materials comprised of carbon nanotube (CNT) bundles, may become candidates for in situ sensors in structural health monitoring (SHM) because of their significant sensitivity to temperature and strain, small size, light weight, high surface area, high electrical and thermal conductivity, and multifunctionality [1,2,3,4,5]. The coupling between the electrical resistance (R) of the yarn and temperature (T) makes them candidates for the development of self-sensing smart materials for thermal analysis inside structures [4,5,6]. To correlate the change in the electrical resistance and temperature, the temperature coefficient of resistance (TCR) is quantified as the slope of the linear relationship between the relative electrical resistance change or fractional change in electrical resistance (∆R/R0) of the CNTY per unit change of temperature (∆T). There are several factors affecting the electrical response of the CNTY in contact with liquids during the polymerization process. The porous structure of the yarn increases interactions between the polymeric matrix and the yarn [1]. In addition, the high porosity of the CNTYs may promote infiltration of liquids between the CNT bundles affecting the stiffness, toughness, and electrical conductivity of the yarn by separating the adjacent CNT bundles and increasing the contact electrical resistance [3,7,8,9]. It was observed that the thermoresistive properties of the embedded CNTY strongly depend on the chemical structure of the polymeric matrix, temperature range, porosity, and capillary diffusion of polar liquids [3,8,10,11,12,13,14,15]. Rodríguez-Uicab et al. [10] investigated the effect of the curing kinetics of epoxy resins with different viscosities on the thermoresistive response of the CNTY monofilament composites at different curing temperatures. The results showed that the fractional change in electrical resistance of the CNTY/epoxy resin increased (~9%) during the curing process of an epoxy resin with a viscosity of 59 cP cured at 130 °C, while it decreased (~−9%) for another epoxy with viscosity of 115 cP cured at 60 °C. It was observed that the curing kinetics of epoxy resin has a dominant role on the electrical resistance of CNTY monofilament composites due to the resin infiltration, electrochemical charge transfer, chemical and thermal shrinkage, and thermal stresses. Rodríguez-Uicab et al. [13] also investigated the effect of polymerization kinetics of the resin on the electrical response of CNTY/vinyl ester monofilament composites using three different levels of initiator (methyl ethyl ketone peroxide). It was observed that upon resin wetting, wicking, and infiltration, the fractional change in electrical resistance of the CNTY decreased (~−0.8%) for all initiator concentrations during the polymerization process. Moreover, the increase in the initiator concentration resulted in a faster and more negative change in the relative electrical resistance change of the CNTY due to the faster residual stresses built up. The thermoresistive response of CNTYs embedded in thermosetting resins was also studied by a few authors. Balam et al. [14] investigated the thermoresistive response of CNTY/vinyl ester composites and isolated CNTYs above RT. The electrical resistance per unit length of the isolated CNTY was ~20 Ω mm−1, and it increased by 37% during the curing process of the resin. Balam et al. [14] also compared the cyclic and hysteretic thermoresistive response of an isolated CNTY to that of one embedded in vinyl ester. They reported a negative temperature coefficient of resistance of −9.5 × 10⁻⁴ K−1, which decreased about 28% by embedding the CNTY into the vinyl ester resin. Therefore, the polymeric matrix plays a paramount role in the electrical response of the CNTY. This study aims to investigate the curing process of RTV silicones using the electrical resistance changes of CNTY and the thermoresistive response of CNTY monofilament composites using heating–cooling processes. Two room temperature vulcanizing (RTV) silicones with different properties were used for this purpose. Toward the potential fabrication of integrated thermoresistive sensors that are commensurate with other thermal sensors (thermistors) offering stability, consistency, and low hysteresis, the effect of the temperature rate variation on the thermoresistive response of these CNTY/silicone monofilament composites was also studied.
2. Experimental
2.1. Materials
The CNTY used in this study was fabricated from a vertically aligned CNT array at Nanoworld Laboratories (Cincinnati, OH, USA). The diameter, density, angle of twist, and average electrical resistivity of the densified CNTYs are ~30 μm, ~0.65 g/cm3, ~30° and 1.7 × 10⁻³ Ω cm, respectively [1,2]. Figure 1 shows images of the twisted yarn obtained by Scanning Electron Microscopy (SEM). Figure 1a shows an image with a magnification of 5000 and Figure 1b shows an image with a magnification of 50,000.
Two commercially available RTV silicones, OOMOOTM 00-30 labeled SR1 and ECOFLEXTM 00-50 labeled SR2 both from Smooth-On Inc. (Macungie, PA, USA) were used as the polymeric matrices by mixing two premixes denoted as a crosslinker and a base polymer with a mixing ratio of 1:1 [16,17]. RTV silicones are mainly crosslinked by two different methods: titanium-catalyzed condensation cure and platinum-catalyzed hydrosilylation addition cure [18,19,20]. SR1 is a condensation-cure silicone in which a silicon-terminated polydimethylsiloxane (PDMS) reacts with an organosilicon crosslinker in the presence of tin (Sn) catalyst [16], and SR2 is an addition-cure silicone rubber [17]. Table 1 shows the description and physical properties of SR1 and SR2, respectively.
2.2. Fabrication of Monofilament Composites
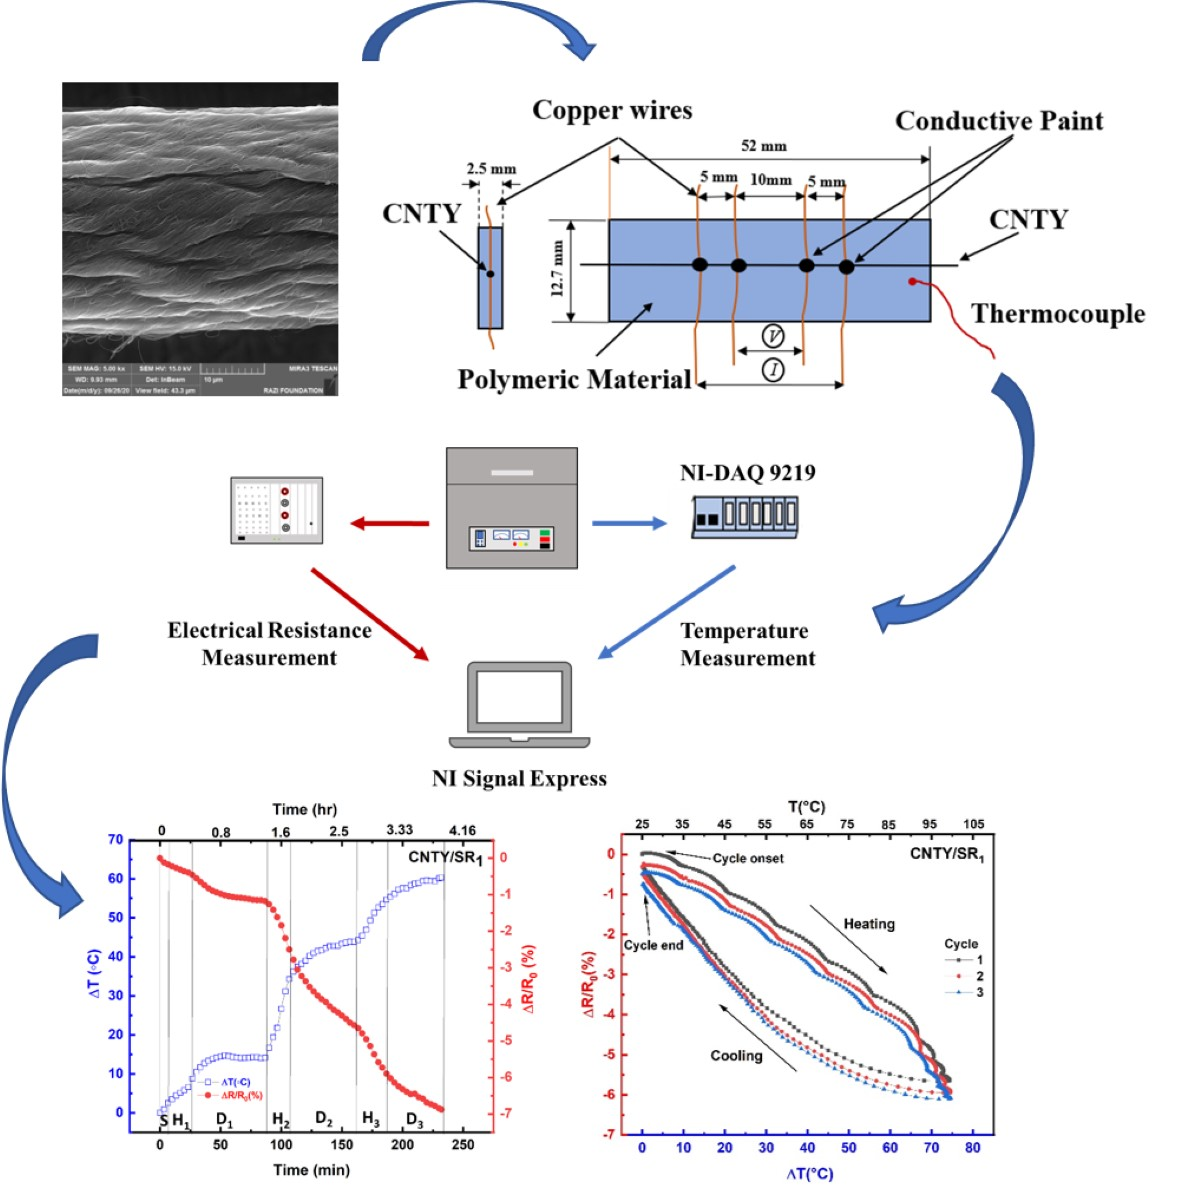
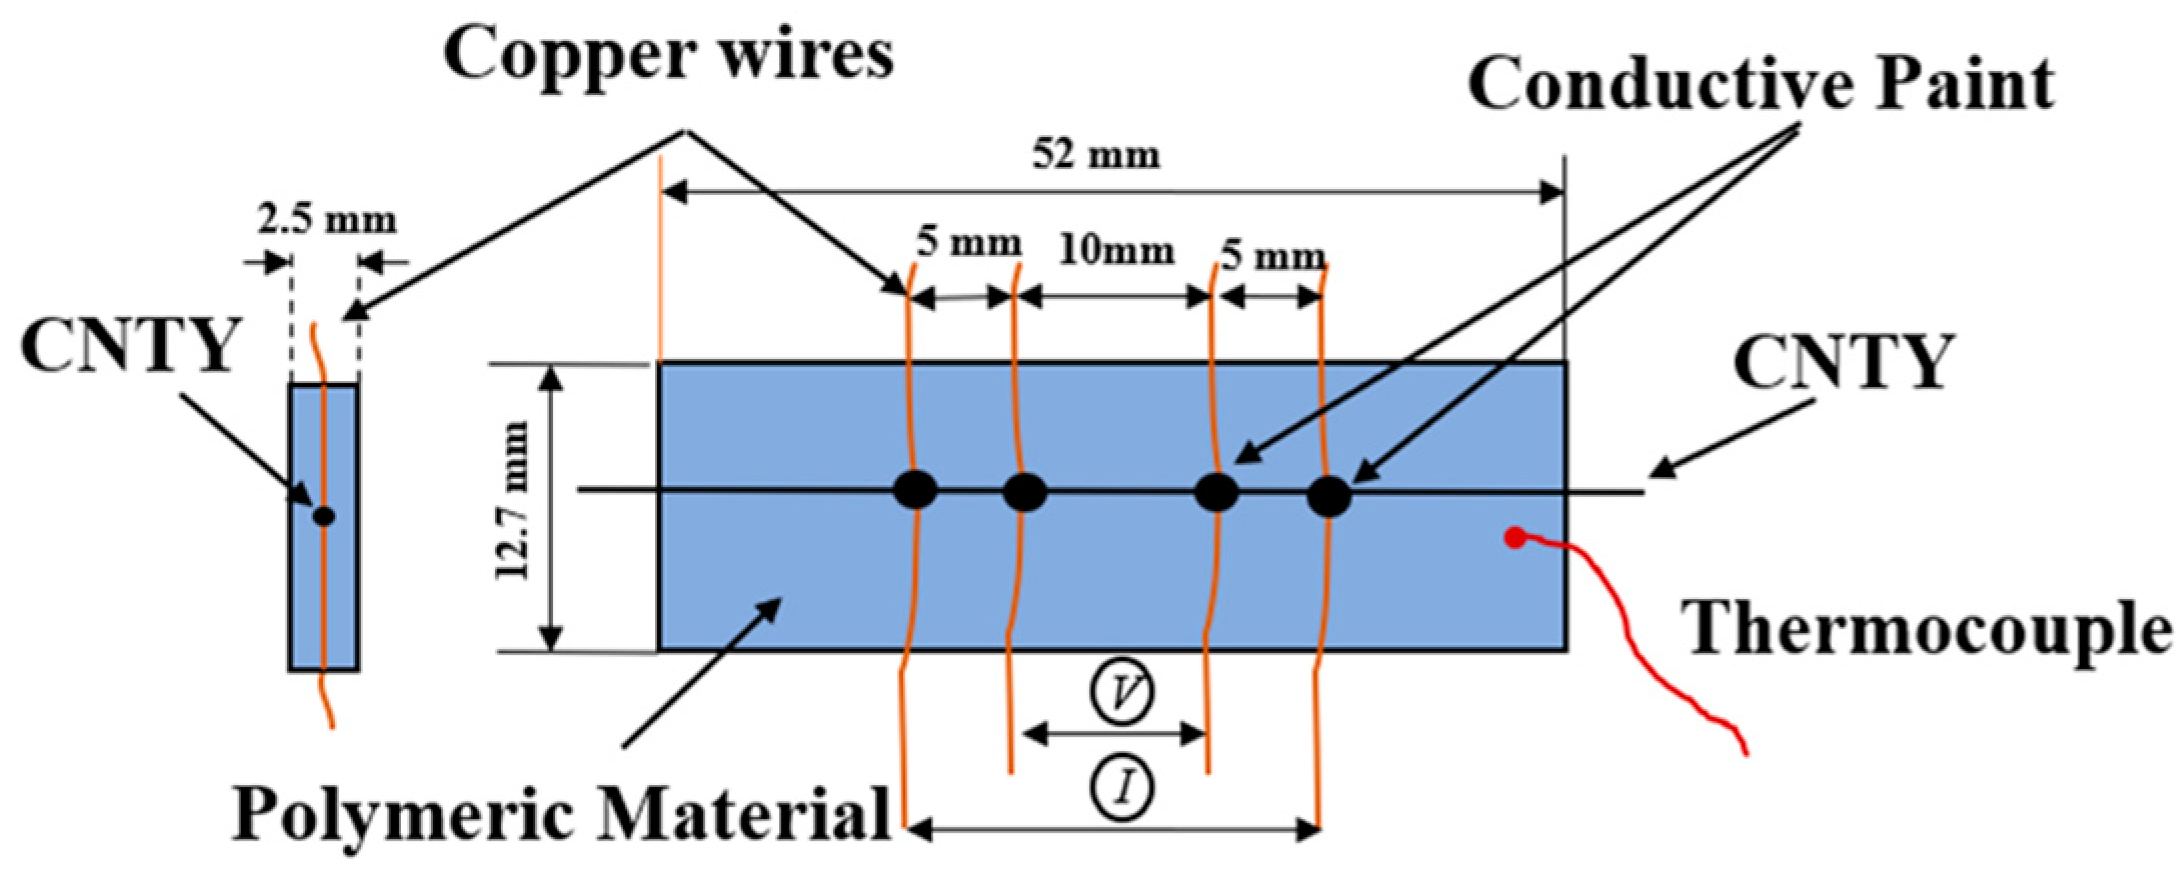
Figure 2 shows the schematic and dimensions of the CNTY/silicone monofilament composites for electrical and thermal measurements. Four electrical copper wires were secured across an acrylonitrile butadiene styrene (ABS) mold at the mid center of the mold to measure the electrical resistance (R) of the CNTY. Then, the CNTY was placed longitudinally at the center of the mold and on top of the copper wires. The CNTY was secured in place using a small tape and it was pretensioned using a small mass (116 mg) to ensure the same configuration in all specimens during the fabrication. An electrically conductive paint from Bare ConductiveTM (Thief River Falls, MN, USA) was used to make ohmic contact between the copper wires and the CNTY at their intersections. The elastic structure of the paint protects the CNTY against stiffening during bonding. Once the paint was dried (about 10–15 min), two parts of each material (SR1 or SR2) were mixed well together with the ratio of 1:1 and poured into the mold using a syringe. Three samples of each material were made for each experiment using the exact same procedure. CNTY/SR1 and CNTY/SR2 specimens were cured at room temperature for 6 h and 3 h, respectively.
2.3. Experimental Setup for Curing and Cyclic Thermoresistive Characterization
To determine the electrical response of the CNTY/silicone monofilament composites during the curing process, the electrical resistance and temperature of three specimens of each monofilament composite were simultaneously measured and acquired at a rate of 1 Hz using NI Signal Express software. Figure 3a shows the schematic of the experimental setup during the curing process. A NI PXI-4072 LCR (Inductance-Capacitance-Resistance) reader mounted on a NI PXI-1033 chassis was used for electrical resistance measurements. The copper wires were attached to the LCR through wire clips for four-point probe measurements in which two probes measure the voltage drop within the inner terminals while a fixed current is applied between the outer terminals. The temperature was continuously measured by inserting a K-type thermocouple at a location close to the CNTY in the mold and connecting it to a NI-9219 reader mounted on a NI cDAQ-9178 chassis. To prevent the temperature fluctuations during the curing process at room temperature (RT~25 °C), the test was done under an insulated chamber.
Figure 3b shows the schematic of the experimental setup for thermoresistive characterization after the curing process of CNTY/silicone monofilament composites. A digital tube oven BR-12NT (Zhengzhou Brother Furnace Co., Ltd., Zhengzhou, China) was used to evaluate the thermoresistive response of the CNTY monofilament composites. The thermoresistive characterization of CNTY/silicone specimens was carried out using three temperature programs. Details of each program are explained in Sections S1, S2, and S3 of the Supplementary Information. The same temperature program was used for each monofilament composite and three replicates were tested for each program. During the temperature programs, specimens were equilibrated for 15 min at RT in stabilization zone (S). In order to evaluate the signal noise level, the signal to noise ratio (SNR) of the fractional change in electrical resistance was calculated according to [10]:
where (ΔR/R0)Mean is the mean value of fractional change in electrical resistance and (ΔR/R0)SD is the corresponding standard deviation.
The heating temperature coefficient of resistance (βH) was calculated at heating zones according to:
where (ΔR/R0)Heating corresponds to the fractional change in electrical resistance in heating zones (H1, H2, and H3), and ΔT is the corresponding change in temperature.
Similarly, the cooling temperature coefficient of resistance (βC) was calculated at cooling sections according to:
where (ΔR/R0)Cooling corresponds to the fractional change in electrical resistance in cooling zones (C1, C2, and C3), and ΔT is the corresponding change in temperature.
2.4. Swelling Characterization
To estimate the crosslinking morphology of RTV silicones, 3 cuboid specimens of each material with approximate dimensions of 1 cm by 1 cm by 3 mm thickness were dried in a vacuum oven and weighed (W0). These specimens were immersed in 20 mL of toluene for 48 h at room temperature, and the toluene was renewed every 24 h. The swelled samples were weighed (WSW) and dried in a vacuum oven until a constant weight () was obtained. The magnitude of soluble fraction (ST) and the degree of solubility (dSW) were determined according to [18,19,20,21]:
where ST is the soluble fraction (%), W0 is the initial weight of the sample, WSW is the weight of the swollen sample, and is the final weight of the sample.
2.5. Scanning Electron Microscopy
In order to investigate the microstructure of the fracture surface, of CNTY/silicone monofilament composites, scanning electron microscopy (SEM) was conducted using a FEG-SEM field-emission MIRA3 TESCAN SEM (Kohoutovice, Czech Republic) operated at 15 kV.
3. Results
3.1. Electrical Response of CNTY during Curing Process
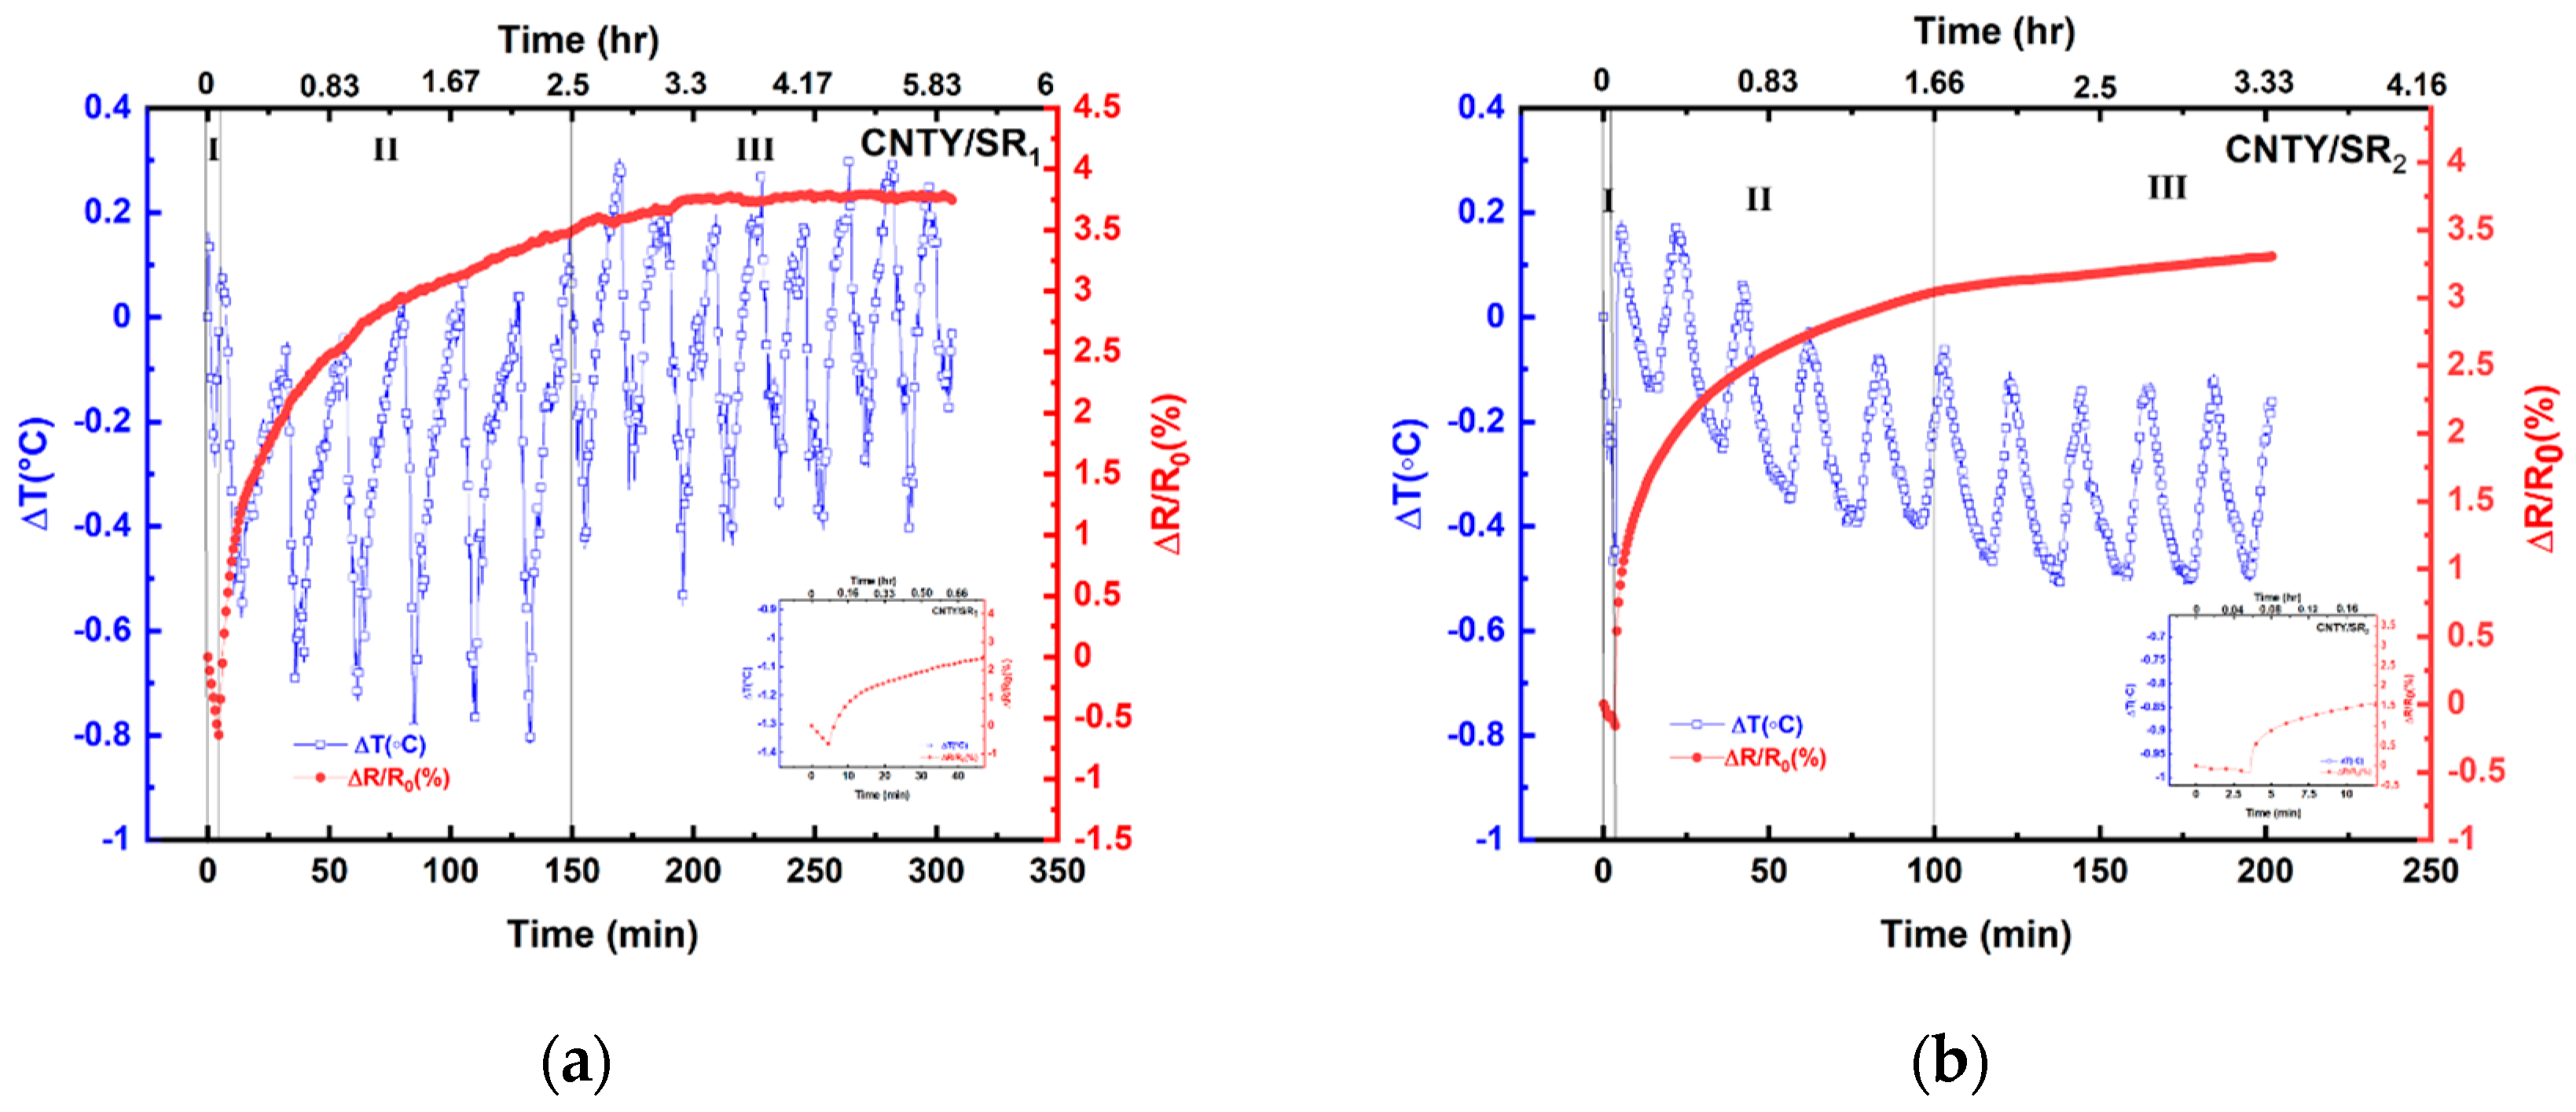
The change in electrical resistance of the CNTY during the curing process was used to identify the various stages that the RTV silicones undergo during the curing process. Figure 4 shows the fractional change in electrical resistance (∆R/R0) and temperature change (∆T) plotted as a function of time during the curing process of both CNTY/SR1 and CNTY/SR2 specimens. The negligible temperature variation during the experiments is a result of the room temperature oscillation. The data was acquired a few minutes before pouring the premixed polymer into the mold. The close-ups of the initial zone I (inset graphs in the lower right corner of Figure 4a,b) show a sharp decrease in ∆R/R0 (−0.70% in CNTY/SR1 and −0.2% in CNTY/SR2) at the time of pouring the premixed polymer into the mold, which could be attributed to the interaction between the polymer and the CNTY [10]. In zone II, an inter-connected, three-dimensional (3D) network starts to form by a crosslinking reaction between the polymer chains and the crosslinker [16,17] resulting in a sharp increase in ∆R/R0 during the polymerization of SR1 and SR2 (Figure 4a,b). In CNTY/SR1 (Figure 4a), the crosslinking happens by a condensation reaction of methoxy groups in the presence of a tin-based catalyst [16]. The final network consists of viscoelastic crosslinked polymer chains along with a byproduct [16]. The evaporation of the byproduct results in a slight shrinkage (~0.25%) [16] in its 3D network. During the addition reaction of the RTV silicone, SR2, the hydrosilylation between the vinyl and hydride functional groups in the presence of a platinum catalyst results in a faster formation of a covalent 3D network without any side products (Figure 4b) [17]. The shrinkage in the final product is almost negligible (~<0.1%) [17]. ∆R/R0 starts to level off and reaches a plateau for both specimens in zone III. In this zone, the crosslinking reaction is almost completed [16,17]. After polymerization, ∆R/R0 reaches 3.8% in CNTY/SR1 and 3.3% in CNTY/SR2. This final positive residual fractional change in electrical resistance, (∆R/R0)res after completion of the polymerization process is attributed to the crosslinking and formation of a 3D network during the polymerization process. A similar positive residual fractional change in electrical resistance was previously reported by Rodríguez-Uicab et al. during the curing of epoxy resin at RT (~∆R/R0 = 4.1%) [10].
It is observed that the curing process of SR1 and SR2 does not affect the final or residual value of ∆R/R0 significantly (~3.8% in CNTY/SR1 and ~3.3% in CNTY/SR2). The difference between the electrical response of CNTY/SR1 and CNTY/SR2 during the polymerization process could be attributed to the difference in the curing kinetics and crosslinking density during the polymerization process [10,13,14].
3.2. Swelling Experiments of CNTY/Silicone Composites
Swelling/extraction experiments were conducted in order to investigate the effect of crosslinking density on the electrical response of the CNTY/silicone monofilament composites. The average soluble fraction calculated according to Equation (4) was 22.9 ± 0.78% for CNTY/SR1 and 38.21 ± 2.01% for CNTY/SR2 in absolute terms. The average degree of swelling calculated according to Equation (5) was 66.93 ± 4.04% for CNTY/SR1 and 134.35 ± 13.03% for CNTY/SR2. The crosslinking density of the matrix network is inversely proportional to the degree of swelling [18,19,20,21,22,23]. By comparing the results of the swelling experiments, it could be concluded that the larger (∆R/R0)res after completion of polymerization process in CNTY/SR1 could be attributed to the higher crosslinking density in CNTY/SR1, which results in a more compact 3D network and less free volume in its molecular 3D network [22,24]. It could also be concluded that the residual stresses due to chemical shrinkage did not have a dominant effect on the final ∆R/R0 values due to the negligible amount of shrinkage in both monofilament composites [16,17]. According to Table 1, it could also be concluded that due to the high viscosity in both specimens, the ingress of polymer into the porous structure of the embedded CNTY is prevented and only the outer CNT bundles within the cross-sectional area of the CNTY may be affected.
3.3. Electrical Response of CNTY during Heating-Dwell Thermoresistive Characterization
The thermoresistive response of the CNTY/silicone monofilament composites after the curing process was investigated using an incremental heating-dwell temperature program. Details of the temperature program can be found in Section S1 of the Supplementary Information. Figure 5 shows the measurements of ∆T and ∆R/R0 as a function of time for the CNTY/SR1 and CNTY/SR2 monofilament composites. Initially, the specimens were stabilized at RT for 15 min (stabilization zone, S). Small oscillations observed during the stabilization zone in both graphs, could be due to electric noise [25,26] and CNTY’s relaxation effects [27,28]. After the stabilization zone, the temperature increases from RT to ~38 °C (zone H1) and then remains constant in the first dwell zone (D1). In the second heating zone (H2), the temperature increases from 38 °C to 60 °C and remains constant in the second dwell zone (D2). The temperature increases from 60 °C to 80 °C in the third heating zone (H3) and remains constant at the third dwell zone (D3).
The gradual decrease in ∆R/R0 in dwell zones could be related to the thermo-viscoelastic behavior of the silicone matrix and dielectric relaxation effects in the CNTY [28]. This shows that the electrical signal of the embedded CNTY could be sensitive to the polymer stress relaxation [12,29]. The average SNR values were calculated at every dwell zone according to Equation (1). The average SNR values of CNTY/SR1 in D1, D2 and D3 zones were 29.72 ± 1.3 dB, 27.85 ± 1.9 dB, and 28.12 ± 1.7 dB, respectively. The average SNR values of CNTY/SR2 in D1, D2, and D3 zones were 29.72 ± 1.6 dB, 28.2 ± 1.7 dB, and 30.32 ± 0.9 dB, respectively. The SNR values are in agreement with SNR values reported previously [10]. In both graphs of Figure 5, a decrease in the electrical resistance with increasing temperature was observed, which corresponds to a negative TCR (βH). Table 2 shows the TCR values with standard deviations for CNTY/SR1 and CNTY/SR2. This negative thermoresistive behavior was reported previously for individual CNTYs [4,6,10,14], CNTs [30,31] and carbon fibers [32,33], and could be explained by quantum mechanics mechanisms such as variable range hopping (VRH) and fluctuation-induced tunneling (FIT) [34,35]. Increasing temperature can enhance the electron transport at CNT junctions and decrease the electrical resistance of individual CNTs [35], as well as the contact resistance between CNTs [10,15].
3.4. Electrical Response of CNTY during Cyclic Thermoresistive Characterization
A heating–cooling temperature program was also used to evaluate the thermoresistive characterization of CNTY monofilament composites during heating–cooling ramps for each specimen (see Supplementary Information, Section S2). The temperature and fractional change in electrical resistance of the samples were continuously measured throughout the experiment and were plotted against time for both CNTY monofilament composites (Figure 6).
The SNR values of ∆R/R0, calculated at the stabilization zone (S) using Equation (1), were similar to those obtained in Section 3.3 (33.15 dB for CNTY/SR1 and 27.30 dB for CNTY/SR2). After the stabilization zone, two heating–dwell–cooling cycles were repeated for every specimen. Table 3 shows the TCR values with standard deviations of each specimen at heating (βH) and cooling (βC) sections calculated according to Equations (2) and (3), respectively.
A negative and quasilinear thermoresistive response was observed in both graphs, which agrees with the results obtained in Section 3.3. The rationale for this negative thermoresistive behavior was explained in Section 3.3. The temperature coefficients of resistance (thermoresistive sensitivity) of the CNTY/silicone monofilament composites in the heating and cooling zones are of the same order of magnitude.
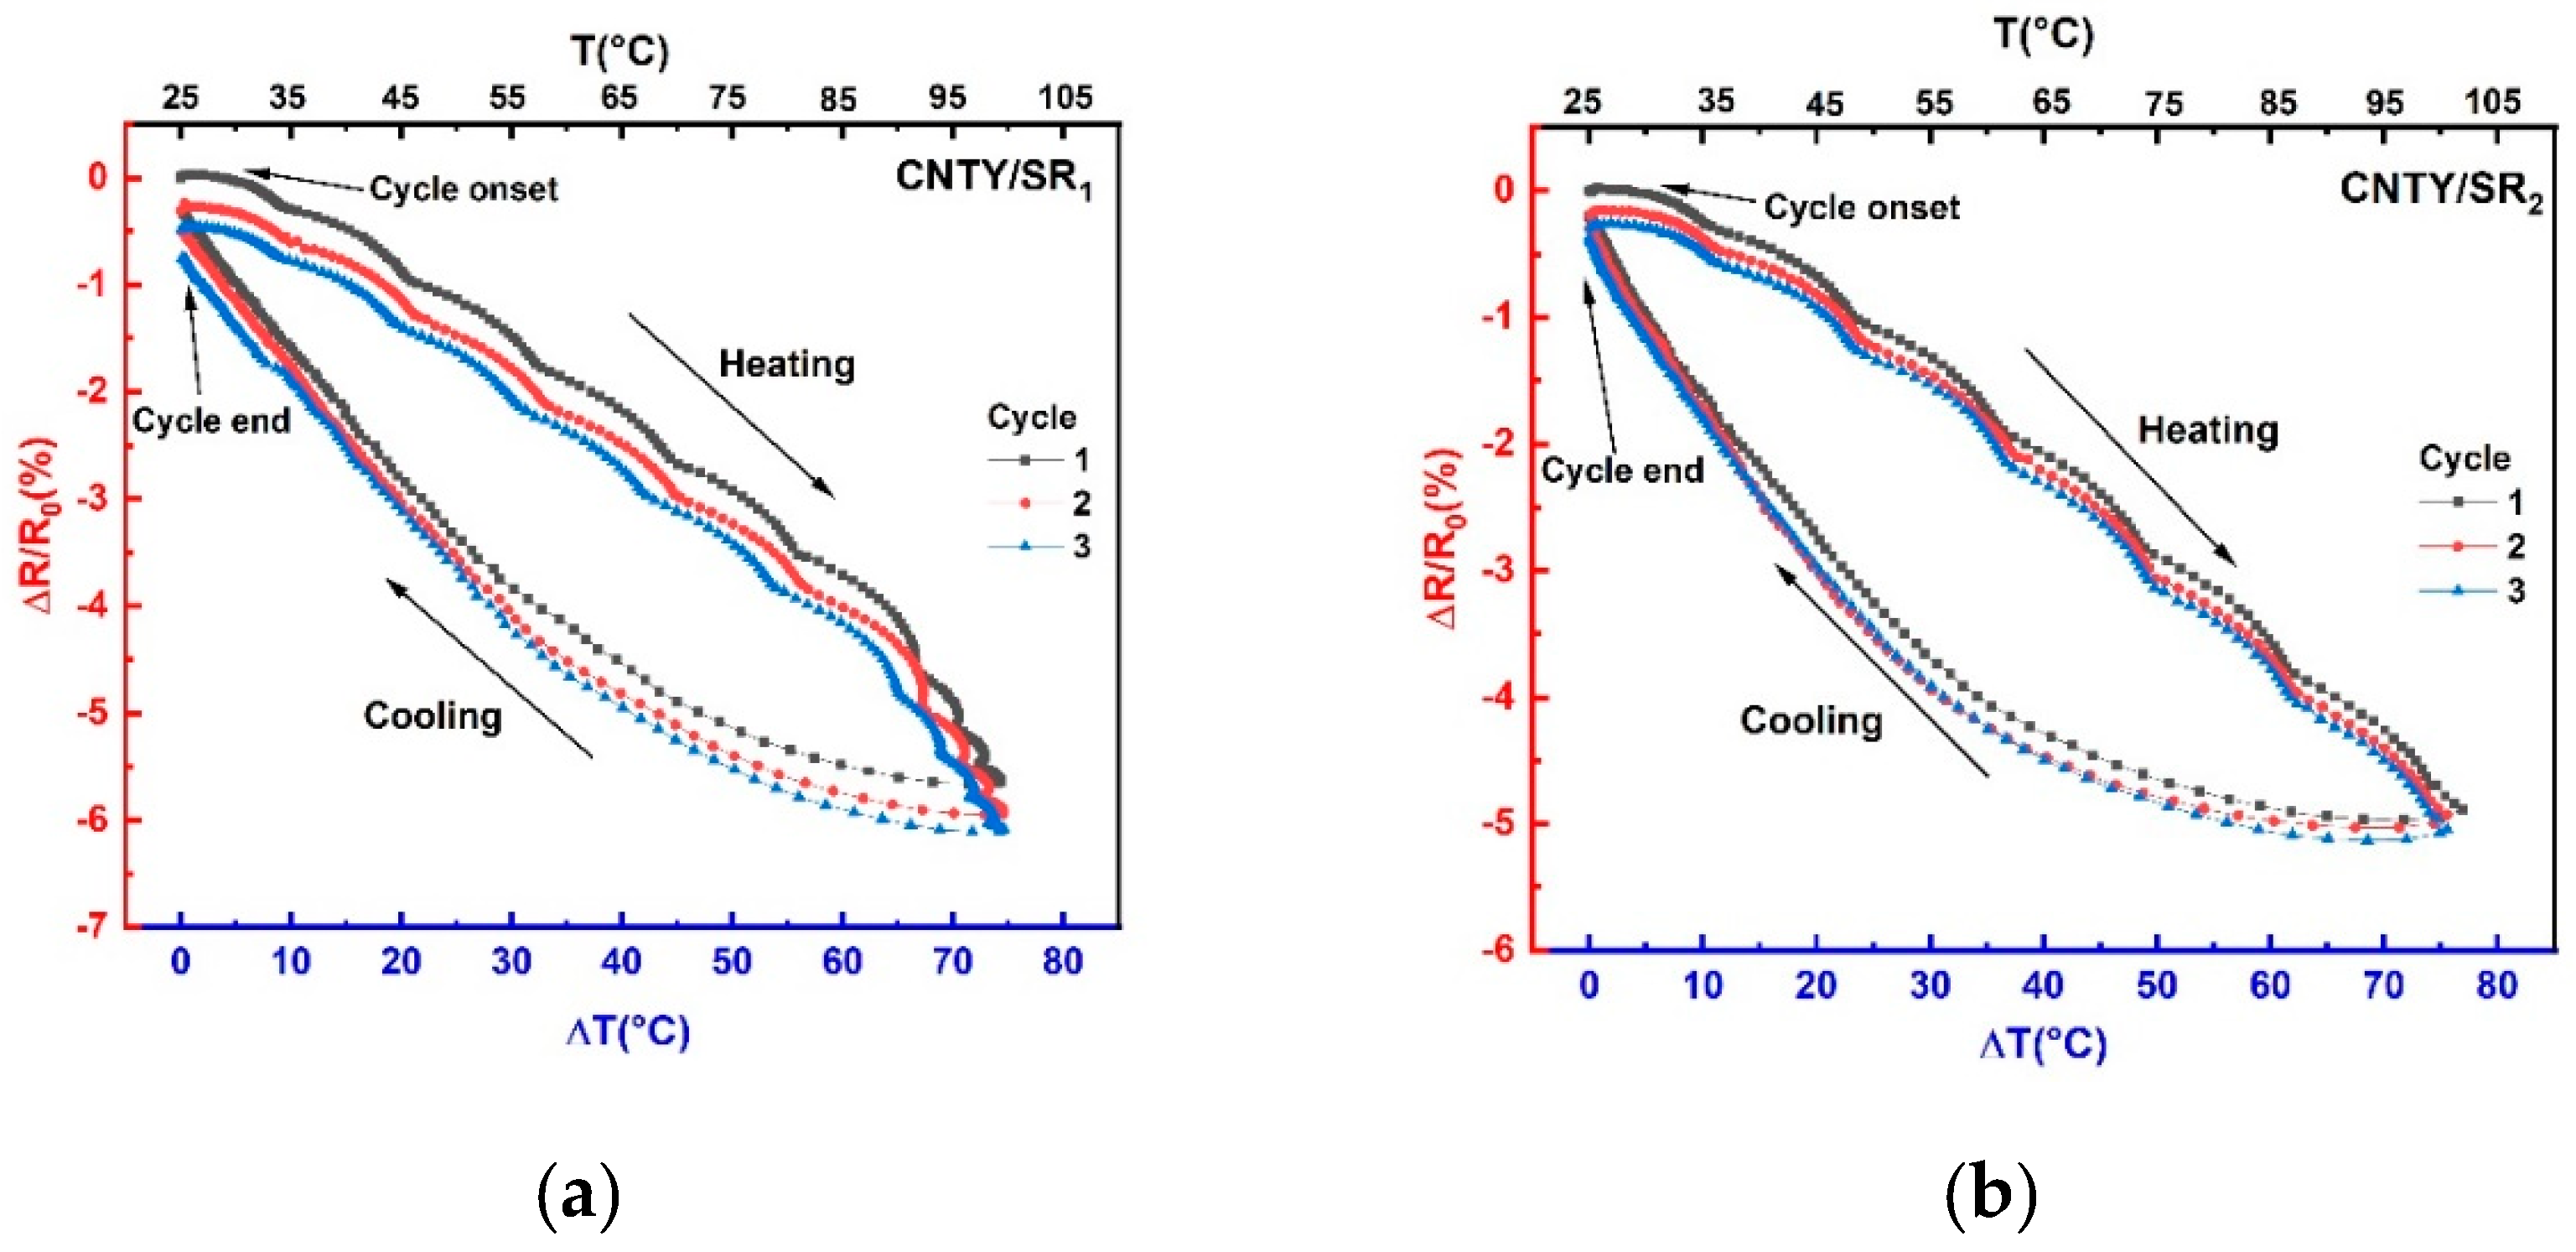
To study the thermoresistive hysteresis after each cycle, a thermoresistive characterization of CNTY/SR1 and CNTY/SR2 specimens during four continuous heating–cooling cycles was performed according to the temperature program described in Section S3, Supplementary Information. Each cycle corresponds to heating of the samples above RT to 100 °C and cooling back to RT. The electrical resistance and temperature of the specimens were simultaneously measured throughout the heating and cooling sections of the experiment and the graphs were obtained for the last three cycles. The first cycle was not considered in order to disregard any thermal history of the material, which may cause the first cycle to behave differently than the subsequent ones [12,14]. Figure 7 shows the fractional change in electrical resistance as a function of temperature change of the CNTY/silicone monofilament composites. The thermoresistive sensitivity for CNTY/SR1 and CNTY/SR2 was obtained by calculating the average TCR values of three replicates of each specimen during heating–cooling sections according to Equations (2) and (3). The TCR values are shown in Table 4 and are in agreement with the values obtained for CNTY/vinyl ester reported by Balam et al. [14], and for CNTY/epoxy resin reported by Rodríguez-Uicab et al. [10]. It is observed that the intrinsic thermoresistive response of CNTs plays a paramount role in the thermoresistive response of the CNTY and is not affected by the presence of the polymeric matrix.
The decrease in ∆R/R0 by increasing temperature and contrariwise confirms the intrinsic characteristics of the CNTY (negative thermoresistivity) explained in Section 3.3. The heating paths in both specimens showed more nonlinearity than the cooling ones. In both graphs, the initial resistance at the onset of each cycle decreased in comparison with its previous cycle (negative residual fractional change in electrical resistance). The residual fractional change in electrical resistance, (∆R/R0)res, yielded small values (−0.16% for CNTY/SR1 and −0.11% for CNTY/SR2) and the onset and end points are almost at the same location.
To analyze the reproducibility of the heating–cooling cycles, the normalized hysteresis (HN) parameter of each cycle is quantified according to:
where HN is the normalized hysteresis, H is the area under the hysteresis loop, (∆T)max represents the maximum change in temperature achieved in each cycle, and (∆R/R0)max is the maximum fractional change in electrical resistance associated with the temperature change, see Section S4 in Supplementary Information.
Table 4 shows the thermoresistive parameters of CNTY/SR1 and CNTY/SR2 during the cyclic thermoresistive characterization form RT to 100 °C.
It is observed that the HN value of CNTY/SR1 was 21.85%, which was lower than that of CNTY/SR2 (29.08%). As a reference, Balam et al. [14] reported a HN value of 21.6% during the cyclic thermoresistivity of CNTY/vinyl ester heated above RT. They also reported an average (∆R/R0)res value of −0.22% after each cycle for CNTY/vinyl ester monofilament composites. The higher hysteresis of CNTY/SR2 could be attributed to a lower crosslinking density that yields a less effective 3D network in the silicone matrix and a higher free volume within the polymeric chains [24,36]. By comparing the results of the swelling experiments in Section 3.2, it is observed that CNTY/SR1 could have a higher crosslinking density than CNTY/SR2, and thus restricting the molecular motion of the polymeric chains [18,19,24]. By increasing the crosslinking density, the mobility of the crosslinked segments decreases, and the polymeric chain segments in CNTY/SR1 need more heat to reach the same segment mobility as in CNTY/SR2 [24]. Therefore, by increasing the temperature, the specimens with higher crosslinking density exhibit less deformation in their matrix due to more crosslinking covalent bonds between the polymeric chains resulting in a lower hysteresis in the case of CNTY/SR1 [24,36].
3.5. Scanning Electron Microscopy Characterization
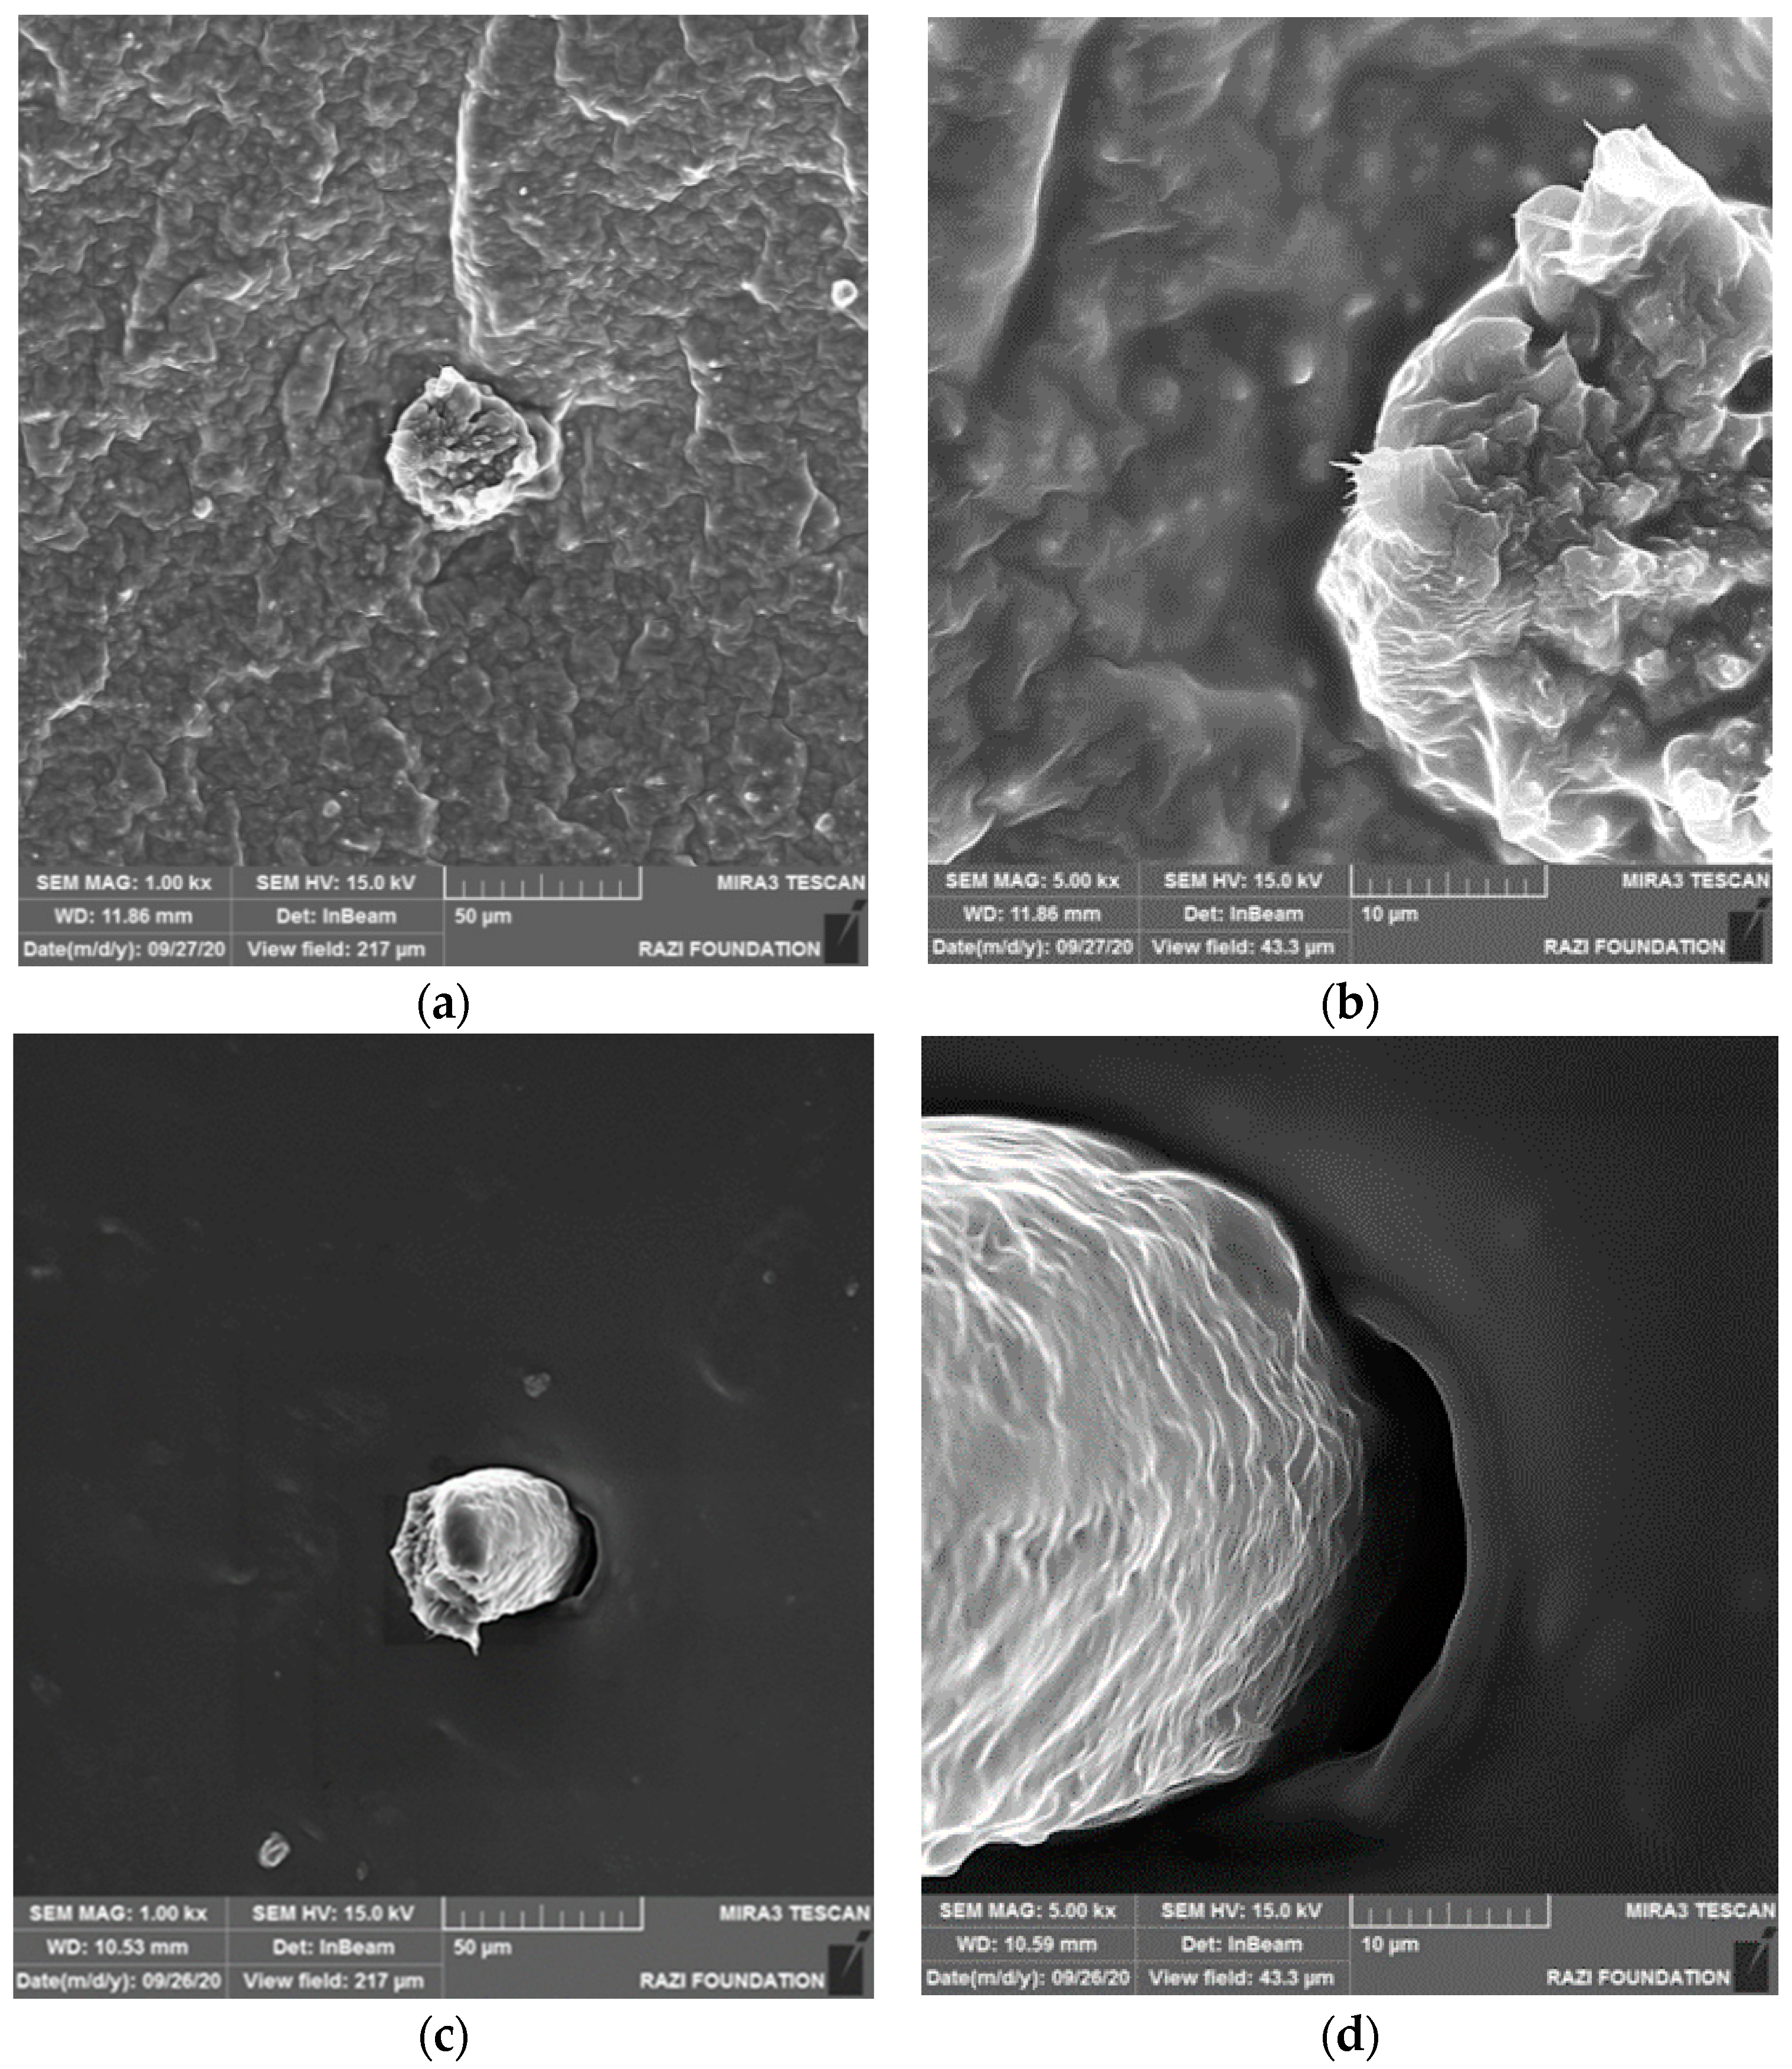
To study the interaction, the level of infiltration and the morphology of the interface between the polymeric matrix and the CNTY, SEM imaging of the fracture surfaces in the CNTY/silicone monofilament composites at 1000× (images on the left) and 5000× (images on the right) was conducted as described in Section 2.5. Figure 8a,c show the representative fractured surface morphology of CNTY/SR1 and CNTY/SR2 at 1000×, respectively. Higher resolution images of the interface between the CNTY and matrix are shown for CNTY/SR1 (Figure 8b) and for CNTY/SR2 (Figure 8d). It is observed that the polymeric matrices have a homogeneous structure in both specimens. The difference in the texture of the polymeric matrices could be attributed to the difference in surface morphologies of SR1 and SR2, and the type of the curing mechanisms [24]. The cross-sectional fracture of the embedded CNTY in both specimens shows the CNT bundles being comprised of thousands of individual CNTs and no evidence of inter-bundles matrix penetration. It can also be observed that there is a weak interface between the CNTY and the polymeric matrix in both specimens, but no CNTY/matrix debonding is detected. The bundles close to the external surface of the CNTY/silicone interface show a slight evidence of polymer infiltration and wetting of the CNT bundles in both specimens. The weak interface between the CNTY and silicone may reduce the presence of residual stresses due to the differential thermal expansion between the CNTY and the polymeric matrix [37]. The high viscosity of the polymeric matrices and low curing temperature in SR1 and SR2 reduce the penetration capability of the polymeric matrix into the CNTY.
3.6. Effect of Heating Rate on Thermoresistive Response of CNTY Monofilaments Composites
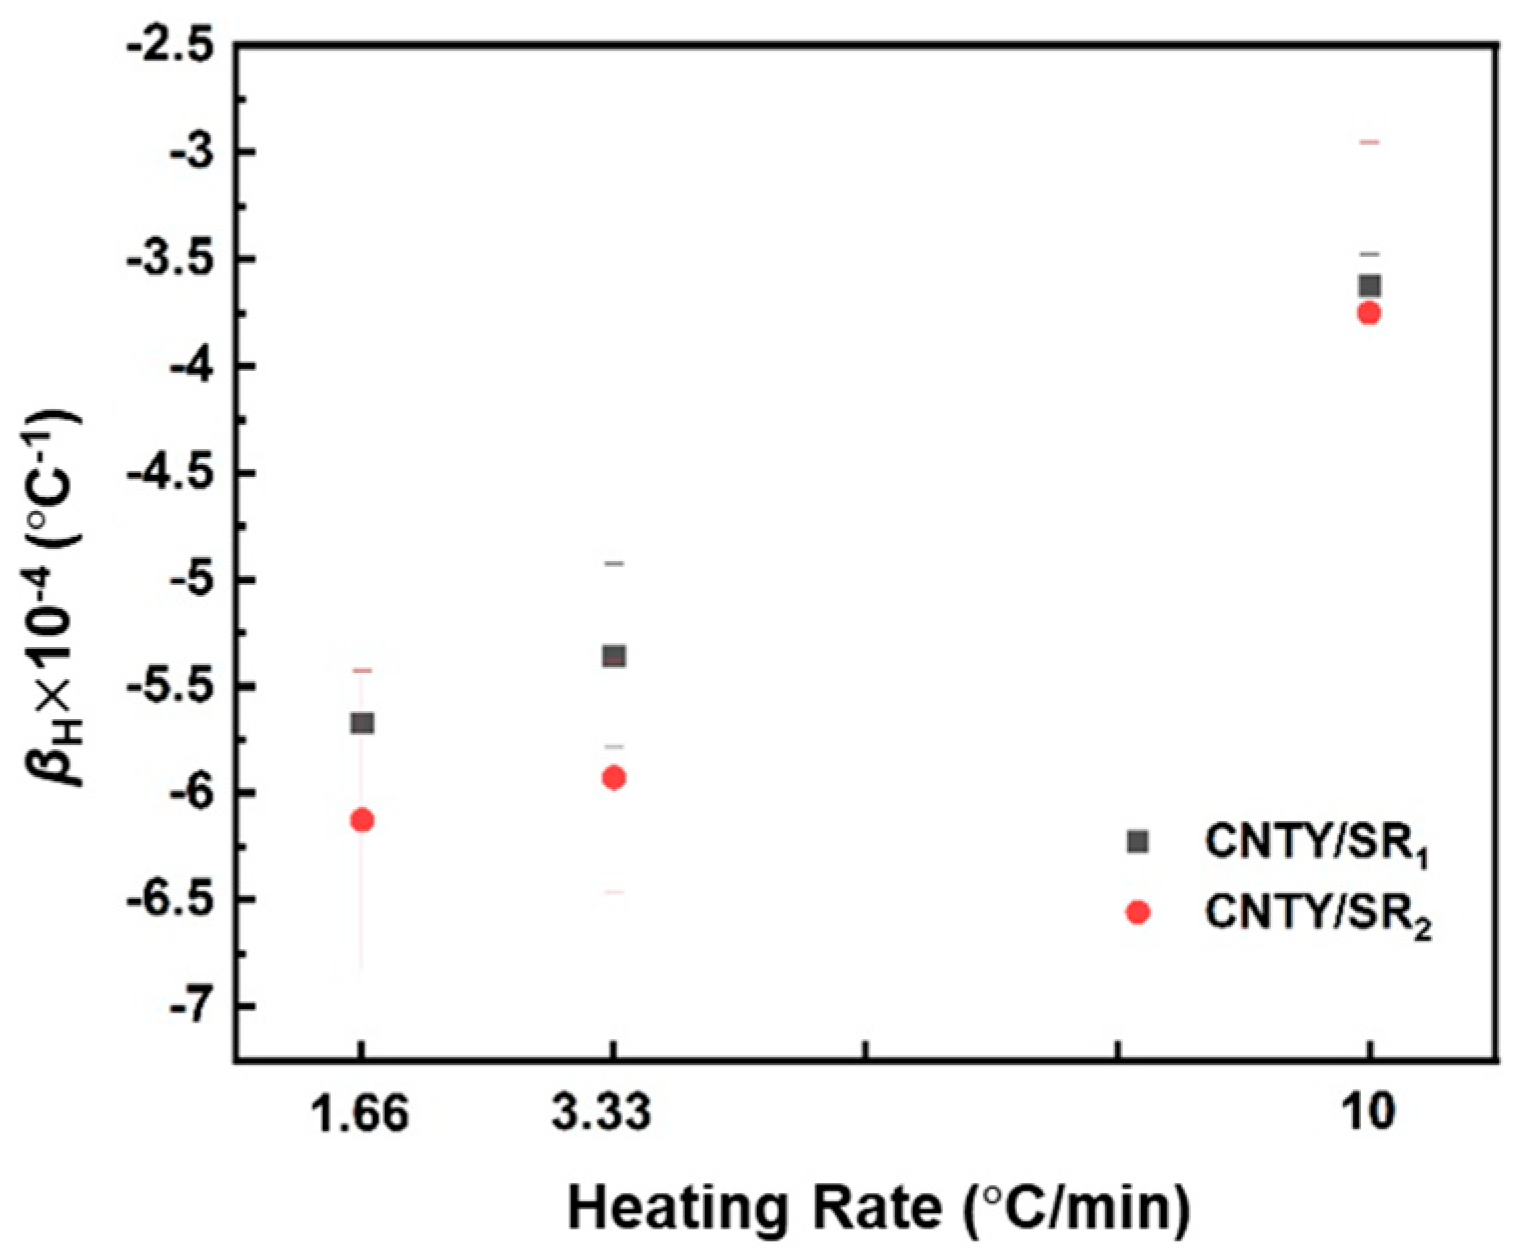
The effect of the heating rate on the thermoresistive sensitivity of the CNTY monofilament composites was investigated by heating the specimens from RT to 100 °C at different heating rates (1.66 °C/min, 3.33 °C/min, and 10 °C/min). Three replicates of each CNTY monofilament composite were tested under the same conditions and an average of TCR values was obtained at each heating rate. Figure 9 shows the average TCR values of CNTY/SR1 and CNTY/SR2 versus the heating rate. At 1.66 °C/min, βH was calculated according to Equation (2) and determined to be −5.67 × 10⁻⁴ °C−1 and −6.12 × 10⁻⁴ °C−1 for CNTY/SR1 and CNTY/SR2, respectively. βH decreased to −5.35 × 10⁻⁴ °C−1 and −5.91 × 10⁻⁴ °C−1, respectively, by increasing the heating rate (3.33 °C/min). The lowest TCR values, in absolute terms, were observed at the 10 °C/min heating rate (−3.62 × 10⁻⁴ °C−1 and −3.75 × 10⁻⁴ °C−1 for CNTY/SR1 and CNTY/SR2, respectively).
It was observed that the sensitivity of the embedded CNTY reduces monotonically, in absolute terms, as the heating rate increases. This could be related to the low thermal conductivity in SR1 and SR2 [16,17] due to the dynamics of phonon transport in an elastic medium, which results in a low heat transfer [38,39]. Low thermal conductivity in both polymeric matrices takes a longer time to reach thermal equilibrium within the material. Therefore, by increasing the heating rate, there would be a temperature gradient.
4. Conclusions
An experimental study was conducted to investigate the thermoresistive behavior including the curing process of carbon nanotube yarns (CNTYs) embedded in room temperature vulcanizing (RTV) silicones using the electrical resistance of the embedded CNTY. Two RTV silicones with different curing mechanisms were used for this purpose. The residual fractional change in electrical resistance increased up to 3.8% for CNTY/SR1 and 3.3% for CNTY/SR2 after completion of the polymerization process. The fractional change in electrical resistance curve is concomitant with the polymerization curve in both specimens. The positive change in the electrical resistance during the curing process of both specimens correlates with the weak interaction between the polymer and the CNTY. High viscosity of the polymer matrix reduces infiltration through the porous structure of the embedded CNTY resulting in a weak interface between the matrix and CNTY. A thermoresistive characterization of CNTY/silicone monofilament composites was conducted using different temperature programs above room temperature. An average negative temperature coefficient of resistance of heating and cooling sections (−8.36 × 10⁻⁴ °C−1 for CNTY/SR1 and −7.26 × 10⁻⁴ °C−1 for CNTY/SR2) was observed for the embedded CNTYs, which could be explained by the intrinsic negative thermoresistive behavior of CNTYs and the exponentially decaying dependence of electrical conductivity of the yarn with temperature. The cyclic thermoresistive response of CNTY/silicone monofilament composites were determined from RT to 100 °C. CNTY monofilament composites showed a negligible negative residual fractional change in electrical resistance (~−0.11% for CNT/SR1 and ~−0.16% for CNTY/SR2) by returning almost to the initial value. The hysteresis upon heating–cooling cycles was about 21.85% for CNTY/SR1 and it increased to 29.80% for CNTY/SR2. The results of swelling experiments would predict higher values of crosslinking density in CNTY/SR1 in comparison to CNTY/SR2, which could be attributed to their different curing mechanisms. SEM images confirm a weaker interface and poorer interaction between the CNTY and silicone in CNTY/SR2 compared with CNTY/SR1. The effect of heating rate on the thermoresistive response of the CNTY was investigated by heating the monofilament composites from RT to 100 °C at different rates. It was observed that the thermoresistive sensitivity decreases by increasing the heating rate, which could be attributed to the development of a thermal gradient in the low electrically conductive polymeric matrices. A better understanding of the thermoresistive response of CNTY monofilament composites under various temperature programs increases the know-how toward the potential development of CNTY sensors integrated within the structures and their implementation as thermistors.
Supplementary Materials
The following are available online at https://0-www-mdpi-com.brum.beds.ac.uk/article/10.3390/c7030060/s1, Figure S1: Heating–dwell temperature program for CNTY/SR1 and CNTY/SR2, Table S1: Description of zones characterized for CNTY/SR1 and CNTY/SR2, Figure S2: Heating-dwell-cooling temperature program for CNTY/SR1 and CNTY/SR2, Table S2: Description of zones and parameters in heating-dwell-cooling temperature cycles, Figure S3: Cyclic temperature program for CNTY/SR1 and CNTY/SR2, Table S3: Description of zones and parameters characterized for CNTY/SR1 and CNTY/SR2, Figure S4: Parameters used for characterization of hysteresis of CNTY/SR1 and CNTY/SR2.
Author Contributions
T.T. was the student who conducted most of the work. T.T., O.R.-U. and J.L.A. wrote the first version of the paper. O.R.-U. provided the main idea, analyzed the data with T.T., and wrote the paper. J.L.A. provided the laboratory facilities, expertise, technical input, and reviewed the final write-ups. All authors have read and agreed to the published version of the manuscript.
Funding
This research was supported by the National Aeronautics Space Administration (NASA) District of Columbia Space Grant Consortium (DCSGC) with grants NNX15AT64H S11 and NNX15AT64H S12 and 80NSSC20M0092 to Jandro L. Abot.
Data Availability Statement
The data presented in this study are available upon request from the corresponding author.
Conflicts of Interest
The authors declare no conflict of interest.
References
- Anike, J.C.; Belay, K.; Abot, J.L. Effect of twist on the electromechanical properties of carbon nanotube yarns. Carbon 2019, 142, 491–503. [Google Scholar] [CrossRef]
- Anike, J.C.; Le, H.H.; Brodeur, G.E.; Kadavan, M.M.; Abot, J.L. Piezoresistive response of integrated CNT yarns under compression and tension: The effect of lateral constraint. J. Carbon Res. 2017, 3, 14. [Google Scholar] [CrossRef] [Green Version]
- Vilatela, J.J.; Khare, R.; Windle, A.H. The hierarchical structure and properties of multifunctional carbon nanotube fibre composites. Carbon 2012, 50, 1227–1234. [Google Scholar] [CrossRef]
- Zhang, M.; Atkinson, K.R.; Baughman, R.H. Multifunctional carbon nanotube yarns by downsizing an ancient technology. Science 2004, 306, 1358–1361. [Google Scholar] [CrossRef]
- Lekawa-Raus, A.; Walczak, K.; Kozlowski, G.; Wozniak, M.; Hopkins, S.C.; Koziol, K.K. Resistance-temperature dependence in carbon nanotube fibres. Carbon 2015, 84, 118–123. [Google Scholar] [CrossRef]
- Niven, J.F.; Johnson, M.B.; Juckes, S.M.; White, M.A.; Alvarez, N.T.; Shanov, V. Influence of annealing on thermal and electrical properties of carbon nanotube yarns. Carbon 2016, 99, 485–490. [Google Scholar] [CrossRef] [Green Version]
- Miao, M. Electrical conductivity of pure carbon nanotube yarns. Carbon 2011, 49, 3755–3761. [Google Scholar] [CrossRef]
- Qiu, J.; Terrones, J.; Vilatela, J.J.; Vickers, M.E.; Elliot, J.A.; Windle, A.H. Liquid infiltration into carbon nanotube fibers: Effect on structure and electrical properties. ACS Nano 2013, 7, 8412–8422. [Google Scholar] [CrossRef] [PubMed]
- Terrones, J.; Elliot, J.A.; Vilatela, J.J.; Windle, A.H. Electric field modulated non-ohmic behavior of carbon nanotube fibers in polar liquids. ACS Nano 2014, 8, 8497–8504. [Google Scholar] [CrossRef] [Green Version]
- Rodríguez-Uicab, O.; Abot, J.L.; Avilés, F. Electrical resistance sensing of epoxy curing using an embedded carbon nanotube yarn. Sensors 2020, 20, 3230. [Google Scholar] [CrossRef]
- Fernández-Toribio, J.C.; Íñiguez-Rábago, A.; Vilà, J.; González, C.; Ridruejo, Á.; Vilatela, J.J. A composite fabrication sensor based on electrochemical doping of carbon nanotube yarns. Adv. Funct. Mater. 2016, 26, 7139–7147. [Google Scholar] [CrossRef]
- Cen-Puc, M.; Pool, G.; Oliva-Avilés, A.I.; May-Pat, A.; Avilés, F. Experimental investigation of the thermoresistive response of multiwall carbon nanotube/polysulfone composites under heating-cooling cycles. Compos. Sci. Technol. 2017, 151, 34–43. [Google Scholar] [CrossRef]
- Rodríguez-Uicab, O.; Guay, I.; Abot, J.L.; Avilés, F. Effect of polymer viscosity and polymerization kinetics on the electrical response of carbon nanotube yarn/vinyl ester monofilament composites. Polymers 2021, 13, 783. [Google Scholar] [CrossRef]
- Balam, A.; Cen-Puc, M.; Rodríguez-Uicab, O.; Abot, J.L.; Avilés, F. Cyclic thermoresistivity of freestanding and polymer embedded carbon nanotube yarns. Adv. Eng. Mater. 2020, 22, 2000220. [Google Scholar] [CrossRef]
- Balam, A.; Cen-Puc, M.; May-Pat, A.; Abot, J.L.; Avilés, F. Influence of polymer matrix on the sensing capabilities of carbon nanotube polymeric thermistors. Smart Mater. Struct. 2019, 29, 015012. [Google Scholar] [CrossRef]
- OOMOO™ 30 Product Information | Smooth-On, Inc. Available online: https://www.smooth-on.com/products/oomoo-30/ (accessed on 3 March 2021).
- Ecoflex™ 00-50 Product Information | Smooth-On, Inc. Available online: https://www.smooth-on.com/products/ecoflex-00-50/ (accessed on 3 March 2021).
- Chen, D.; Yi, S.; Fang, P.; Zhong, Y.; Huang, C.; Woo, X. Synthesis and characterization of novel room temperature vulcanized (RTV) silicone rubbers using octa [(trimethoxysilyl) ethyl]-POSS as cross-linker. React. Funct. Polym. 2011, 71, 502–511. [Google Scholar] [CrossRef]
- Chen, D.; Yi, S.; Wu, W.; Zhong, Y.; Liao, J.; Huang, C.; Shi, W. Synthesis and characterization of novel room temperature vulcanized (RTV) silicone rubbers using Vinyl-POSS derivatives as cross linking agents. Polymer 2010, 51, 3867–3878. [Google Scholar] [CrossRef]
- Ji, J.; Ge, X.; Pang, X.; Liu, R.; Wen, S.; Sun, J.; Liang, W.; Ge, J.; Chen, X. Synthesis and characterization of room temperature vulcanized silicone rubber using methoxyl-capped MQ silicone resin as self-reinforced cross-linker. Polymers 2019, 11, 1142. [Google Scholar] [CrossRef] [Green Version]
- Bahrain, S.H.K.; Mahmud, J. Swelling behaviour and morphological analysis of Arenga pinnata–silicone biocomposite. Mater. Lett. 2019, 242, 32–34. [Google Scholar] [CrossRef]
- Ramli, M.R.; Othman, M.B.H.; Arifin, A.; Ahmad, Z. Cross-link network of polydimethylsiloxane via addition and condensation (RTV) mechanisms. Part I: Synthesis and thermal properties. Polym. Degrad. Stab. 2011, 96, 2064–2070. [Google Scholar] [CrossRef]
- Zhan, X.; Cai, X.; Zhang, J. A novel crosslinking agent of polymethyl (ketoxime) siloxane for room temperature vulcanized silicone rubbers: Synthesis, properties and thermal stability. RSC Adv. 2018, 8, 12517–12525. [Google Scholar] [CrossRef] [Green Version]
- Mirzadeh, H.; Shokrolahi, F.; Daliri, M. Effect of silicon rubber crosslink density on fibroblast cell behavior in vitro. J. Biomed. Mater. Res. 2003, 67, 727–732. [Google Scholar] [CrossRef]
- Soliveres, S.; Gyani, J.; Delseny, C.; Hoffmann, A.; Pascal, F. 1∕f noise and percolation in carbon nanotube random networks. Appl. Phys. Lett. 2007, 90, 082107. [Google Scholar] [CrossRef]
- Snow, E.S.; Novak, J.P.; Lay, M.D.; Perkins, F.K. 1∕f noise in single-walled carbon nanotube devices. Appl. Phys. Lett. 2004, 85, 4172–4174. [Google Scholar] [CrossRef]
- Ramos, A.; Pezzin, S.H.; Farias, H.D.; Becker, D.; Bello, R.H.; Coelho, L.A.F. Conductivity analysis of epoxy/carbon nanotubes composites by dipole relaxation and hopping models. Phys. B Condens. Matter 2016, 57–63. [Google Scholar] [CrossRef]
- Can-Ortiz, A.; Abot, J.L.; Avilés, F. Electrical characterization of carbon-based fibers and their application for sensing relaxation-induced piezoresistivity in polymer composites. Carbon 2019, 145, 119–130. [Google Scholar] [CrossRef]
- Liao, Z.; Hussain, M.; Yao, X.; Navaratne, R.; Chagnon, G. A comprehensive thermo-viscoelastic experimental investigation of Ecoflex polymer. Polym. Test. 2020, 86, 106478. [Google Scholar] [CrossRef] [Green Version]
- Ebbesen, T.W.; Lezec, H.J.; Hiura, H.; Bennett, J.W.; Ghaemi, H.F.; Thio, T. Electrical conductivity of individual carbon nanotubes. Nature 1996, 382, 54–56. [Google Scholar] [CrossRef]
- Yi, W.; Lu, L.; Dian-Lin, Z.; Pan, Z.W.; Xie, S.S. Linear specific heat of carbon nanotubes. Phys. Rev. B 1999, 59, R9015. [Google Scholar] [CrossRef]
- Crasto, A.; Kim, R. Using carbon fiber piezoresistivity to measure residual stresses in composites. In Proceedings of the American Society for Composites 8th Technical Conference; Technomic Publishing AG: Basel, Switzerland, 1993; pp. 162–173. [Google Scholar]
- Chung, Y.; Kim, M.S. Thermal analysis and pack level design of battery thermal management system with liquid cooling for electric vehicles. Energy Convers. Manag. 2019, 196, 105–116. [Google Scholar] [CrossRef]
- Sheng, P. Fluctuation-induced tunneling conduction in disordered materials. Phys. Rev. B 1980, 21, 2180. [Google Scholar] [CrossRef] [Green Version]
- Gong, S.; Zhu, Z.H.; Li, Z. Electron tunnelling and hopping effects on the temperature coefficient of resistance of carbon nanotube/polymer nanocomposites. Phys. Chem. Chem. Phys. 2017, 19, 5113–5120. [Google Scholar] [CrossRef]
- Wool, R.P.; Sun, X.S. Bio-Based Polymers and Composites, 1st ed.; Elsevier Academic Press: Burlington, MA, USA, 2005; pp. 202–255. [Google Scholar] [CrossRef]
- Wisnom, M.R.; Gigliotti, M.; Ersoy, N.; Campbell, M.; Potter, K.D. Mechanisms generating residual stresses and distortion during manufacture of polymer–matrix composite structures. Compos. Part A Appl. Sci. Manuf. 2006, 37, 522–529. [Google Scholar] [CrossRef]
- Bartlett, M.D.; Kazem, N.; Powell-Palm, M.J.; Huang, X.; Sun, W.; Malen, J.A.; Majidi, C. High thermal conductivity in soft elastomers with elongated liquid metal inclusions. Proc. Natl. Acad. Sci. USA 2017, 114, 2143–2148. [Google Scholar] [CrossRef] [PubMed] [Green Version]
- Xu, W.; Wu, Y.; Zhu, Y.; Liang, X. Molecular dynamics simulation of thermal conductivity of silicone rubber. Chin. Phys. B 2020, 29, 046601. [Google Scholar] [CrossRef]
Figure 1.
Scanning Electron Microscopy (SEM) images of CNTY: (a) 5000×; (b) 50,000×.

Figure 2.
Schematic and dimensions of CNTY/silicone monofilament composite specimens.

Figure 3.
Schematic of the experimental setup for the: (a) curing process; (b) temperature programs.
Figure 3.
Schematic of the experimental setup for the: (a) curing process; (b) temperature programs.

Figure 4.
Temperature change and fractional change in electrical resistance during the curing process of: (a) CNTY/SR1; (b) CNTY/SR2. Insets: details of zone I.
Figure 4.
Temperature change and fractional change in electrical resistance during the curing process of: (a) CNTY/SR1; (b) CNTY/SR2. Insets: details of zone I.

Figure 5.
Temperature change and fractional change in electrical resistance during increasing-dwell temperature program of: (a) CNTY/SR1; (b) CNTY/SR2.
Figure 5.
Temperature change and fractional change in electrical resistance during increasing-dwell temperature program of: (a) CNTY/SR1; (b) CNTY/SR2.

Figure 6.
Temperature change and fractional change in electrical resistance during heating/cooling cycles of: (a) CNTY/SR1; (b) CNTY/SR2.
Figure 6.
Temperature change and fractional change in electrical resistance during heating/cooling cycles of: (a) CNTY/SR1; (b) CNTY/SR2.

Figure 7.
Cyclic thermoresistive response (fractional change in electrical resistance versus temperature) above RT of: (a) CNTY/SR1; (b) CNTY/SR2.
Figure 7.
Cyclic thermoresistive response (fractional change in electrical resistance versus temperature) above RT of: (a) CNTY/SR1; (b) CNTY/SR2.

Figure 8.
SEM images of the cross-section of CNTY/silicone matrix. CNTY/SR1 at: (a) 1000×; (b) 5000×. CNTY/SR2 at: (c) 1000×; (d) 5000×.
Figure 8.
SEM images of the cross-section of CNTY/silicone matrix. CNTY/SR1 at: (a) 1000×; (b) 5000×. CNTY/SR2 at: (c) 1000×; (d) 5000×.

Figure 9.
Temperature coefficient of resistance of CNTY/SR1 and CNTY/SR2 monofilament composites for various heating rates, respectively.
Figure 9.
Temperature coefficient of resistance of CNTY/SR1 and CNTY/SR2 monofilament composites for various heating rates, respectively.


| Code | Description and Curing Conditions | Physical Properties | ||
|---|---|---|---|---|
| Viscosity (cP) | Density (g.cm−3) | Shrinkage (%) | ||
| SR1 | OOMOO 00-30 1:1 by volume Condensation-cure at RT (25 °C) for 6 h | 4250 | 1.34 | 0.25 |
| SR2 | ECOFLEX 00-50 1:1 by volume Addition-cure at RT (25 °C) for 3 h | 3000 | 1.07 | <0.1 |
Table 2.
Temperature coefficients of resistance extracted during heating-dwell temperature program.
| Zone | Temperature Coefficient of Resistance (βH) × 10−4 [°C−1] | |
|---|---|---|
| CNTY/SR1 | CNTY/SR2 | |
| H1 | −5.50 ± 0.4 | −5.44 ± 0.3 |
| H2 | −6.28 ± 0.3 | −5.70 ± 0.3 |
| H3 | −9.45 ± 0.8 | −8.31 ± 0.8 |
Table 3.
Temperature coefficients of resistance extracted during heating–cooling temperature program.
Table 3.
Temperature coefficients of resistance extracted during heating–cooling temperature program.
| Zone | Temperature Coefficient of Resistance (βH, βC × 10−4 [°C−1] | |
|---|---|---|
| CNTY/SR1 | CNTY/SR2 | |
| H1 | −6.42 ± 0.02 | −5.53 ± 0.46 |
| H2 | −6.45 ± 0.45 | −6.33 ± 0.14 |
| C1 | −3.81 ± 1.35 | −3.29 ± 0.32 |
| C2 | −5.01 ± 0.12 | −5.01 ± 0.21 |
Table 4.
Cyclic thermoresistive parameters of: (a) CNTY/SR1; (b) CNTY/SR2.
| Material | βH × 10−4 [°C−1] | βC × 10−4 [°C−1] | (∆R/R0)max [%] | (∆R/R0)res [%] | HN [%] |
|---|---|---|---|---|---|
| CNTY/SR1 | −7.80 ± 0.07 | −8.92 ± 0.07 | 5.86 ± 0.30 | −0.16 ± 0.2 | 21.85 ± 0.5 |
| CNTY/SR2 | −6.58 ± 0.08 | −7.94 ± 0.07 | 5.02 ± 0.08 | −0.11 ± 0.05 | 29.80 ± 1.2 |
Publisher’s Note: MDPI stays neutral with regard to jurisdictional claims in published maps and institutional affiliations. |
© 2021 by the authors. Licensee MDPI, Basel, Switzerland. This article is an open access article distributed under the terms and conditions of the Creative Commons Attribution (CC BY) license (https://creativecommons.org/licenses/by/4.0/).
Share and Cite
MDPI and ACS Style
Tayyarian, T.; Rodríguez-Uicab, O.; Abot, J.L. Monitoring of Curing and Cyclic Thermoresistive Response Using Monofilament Carbon Nanotube Yarn Silicone Composites. C 2021, 7, 60. https://0-doi-org.brum.beds.ac.uk/10.3390/c7030060
AMA Style
Tayyarian T, Rodríguez-Uicab O, Abot JL. Monitoring of Curing and Cyclic Thermoresistive Response Using Monofilament Carbon Nanotube Yarn Silicone Composites. C. 2021; 7(3):60. https://0-doi-org.brum.beds.ac.uk/10.3390/c7030060
Chicago/Turabian StyleTayyarian, Tannaz, Omar Rodríguez-Uicab, and Jandro L. Abot. 2021. "Monitoring of Curing and Cyclic Thermoresistive Response Using Monofilament Carbon Nanotube Yarn Silicone Composites" C 7, no. 3: 60. https://0-doi-org.brum.beds.ac.uk/10.3390/c7030060
Note that from the first issue of 2016, this journal uses article numbers instead of page numbers. See further details here.