
Effects of Reducing Agent on the Activity of PtRu/Carbon Black Anode Catalyst of Direct Methanol Fuel Cell


Department of Chemical Engineering, National Central University, Jhongli 32001, Taiwan
*
Author to whom correspondence should be addressed.
C 2021, 7(4), 72; https://0-doi-org.brum.beds.ac.uk/10.3390/c7040072
Submission received: 19 August 2021
/
Revised: 24 September 2021
/
Accepted: 13 October 2021
/
Published: 19 October 2021
(This article belongs to the Special Issue Carbon Materials for Physical and Chemical Hydrogen Storage)
Abstract
:A series of PtRu/carbon black catalysts were prepared by means of deposition-precipitation and reduced by various reducing agents. NaBH4, HCHO and NaH2PO2, respectively, were used as the reduction agents. Some of the samples were reduced by various amounts of NaH2PO2 to investigate the effects of P/Pt ratios on the characteristics and activity of the catalyst. These catalysts were characterized by X-ray diffraction and transmission electron microscopy. The components of these catalysts were detected by X-ray fluorescence, X-ray photoelectron microscopy, and extended X-ray absorption of fine structures (EXAFS). The methanol oxidation ability of the catalysts was tested by cyclic voltammetry measurement. The results show that NaH2PO2 could effectively reduce the particle size of PtRu metal. It can suppress the growth of metal particles. In addition, the P/Pt ratio is crucial. The catalyst reduced by NaH2PO2 with a P/Pt ratio of 1.2 had the highest activity among all catalysts. It had the higher Pt and Ru metal contents and smaller metal particle size than the other catalysts. Its activity was 253.12 A/g, which is higher that than the commercial catalyst (Johnson Matthey H10100, 251.32 A/g).
1. Introduction
Direct methanol fuel cells (DMFC) have received increasing attention in the last few decades [1,2,3,4]. PtRu is used extensively as an anode catalyst. Since very high metal loading is used, the particle size of PtRu is large. Obtaining a small particle size of PtRu is a critical issue in applications [4,5,6,7,8,9,10,11,12]. Yao et al. [13] used hollow porous platinum-silver double-shelled nanocages for the electro-oxidation of methanol. The material possesses numerous surface defects and exposed catalytically active sites, resulting in high activity. Li et al. [14] synthesized concave PtCo nanocrosses for methanol oxidation reaction. The concave cross-like structure can provide more under-coordinated atoms as active sites and shows great enhanced MOR performance than commercial Pt/C. Li et al. [15] recently reported a review on the roles and mechanism of various types of amino-based molecules which can be used to control the morphology of the noble metal crystallites and results in high electrocatalytic activity. Carbon black has been used as the anode of fuel cells. Vulcan XC-72 and black Pearl 2000 (from Cabot), acetylene black (from Denka and Shawinigan Black), and Ketjen Black (from Ketjen) have been used in practice. After loading PtRu on carbon black, the reducing agent is also crucial. Various reducing methods have been reported in the literature [13,14,15,16,17,18,19]. Xue et al. [19] reported that the PtRu/carbon black reduced by NaH2PO2 resulted in the deposition on the surface of catalyst. It decreased PtRu metal particle size, increased metal surface area, and resulted in high activity for the methanol oxidation activity and enhanced the oxidation activity of carbon monoxide.
In the present work, platimum-ruthenium alloy supported on carbon black by various reducing agents were studied. In this study, carbon black with a large surface area (855 m2/g) was used as the substrate. PtRu was loaded by means of the deposition-precipitation method and reduced by various agents. The sample was characterized in detail. Single cell measurement was used to determine the oxygen reduction reaction (ORR) activity.
2. Experimental
2.1. Chemicals
Chloroplatinic acid hydrate was obtained from Aldrich (Saint Louis, MO, USA). Ruthenium trichloride hydrate was purchased from Sigma-Aldrich (Darmstadt, Germany), ethanol was purchased from Sigma-Aldrich (Darmstadt, Germany), hydrochloric acid and sulfuric acid were purchased from Fisher (Hampton, NH, USA), and Nafion Solution was obtained from Dupont (Wilmington, DE, USA). Carbon black was obtained from Ketjen (ECP300JD, Tokyo, Japan)). The commercial catalyst was obtained from Johnson Matthey (H10100, London, UK) for comparison (60 wt.% PtRu/C). Hydrogen and nitrogen gases were purchased from Air Products (Allentown, PA, USA).
2.2. Preparation of Anode Catalyst
In this study, carbon black from Ketjen (ECP300) was chosen as the support for PtRu metal. Pt-Ru/carbon black catalyst was prepared by the following method. RuCl3 and H2PtCl6 metal salts were dissolved in distilled water simultaneously. Carbon black support was then added in the above solution. The solution was agitated for 1 h. The reducing agents, such as NaBH4, HCHO and NaH2PO2, respectively, were added into the above solution. It was washed by distilled water and dried in a vacuum oven. These samples were denoted as PtRu/carbon-m, where m is the reducing agent. Some of the samples were reduced by various amounts of NaH2PO2 to investigate the effects of P/Pt ratios on the characteristics and activity of the catalyst. The catalyst reduced by NaH2PO2 was denoted as PtRuP/carbon (x), where x is the atomic ratio of P/Pt in the starting materials.
2.3. Characterization of Catalysts
The XRD pattern of each sample was recorded on a diffractometer (PANALY X’PERT, Philips, Amsterdam, Holland) with Cu-Kα radiation. The sample was scanned from 10° to 85° at a scanning rate of 0.025° s−1.
The surface area (Sg), pore volume (Vp), and pore size distribution of catalysts were measured by the ASAP2400 (Micromeritics Instrument Corporation, Norcross, GA, USA) surface area and pore size analyzer. N2 physisorption-desorption isotherms were obtained at −196 °C by the BET equation for surface area and the BJH method for pore size distribution calculations.
TPD was used to monitor the oxygen-containing functional groups on the surface of carbon black. At high temperatures, the functional groups decomposed to release CO and CO2. Based on the TPD peaks, one can determine the acidity of functional group on the surface.
A 0.5 g sample was loaded in a quartz U tube reactor. Helium was used as the carrier gas. The temperature of reactor was raised to 1000 °C with a heating rate of 5 °C/min. The outlet gas was sampled every 1 min and analyzed by a gas chromatograph equipped with a thermal conductivity detector (TCD).
Transmission electron micrographs (TEM), energy dispersion scanning (EDS) and selective area electronic diffraction (SAED) analyses were performed on a JEM-2000FX (Tokyo, Japan) instrument using an accelerating voltage of 200 kV.
Thermogravimetric analysis (TGA) was carried out (Mettler Toledo, Columbus, OH, USA) under dry air with flow rate of 40 mL/min. Temperature was raised from 25 to 950 °C with a heating ramp of 10 °C/min.
X-ray photoelectron spectroscopy (XPS) was carried out with a ESCALAB 250 XPS (VG Scientific, Waltham, MA, USA). The XPS spectra were collected using Al Kα radiation at a voltage and current of 20 kV and 30 mA, respectively. The base pressure in the analyzing chamber was maintained in the order of 10−9 Pa. The pass energy was 23.5 eV and the binding energy was calibrated by contaminant carbon (C1S = 284.5 eV). The peaks of each spectrum were organized using XPSPEAK software; Shirley type background and 30:70 Lorentzian/Gaussian peak shape were adopted during the deconvolution.
X-ray fluorescence (XRF, Philips PW2400 Spectrometer, Amsterdam, Holland) was used to analyze the compositions of the samples.
The conductivity of carbon black was measured with a Four Point Probe Tester and Potentiostat (Autolab PGSTAT30).
X-ray absorption spectroscopy (XAS) of palladium was analyzed by using synchrotron radiation in fluorescence mode in the National Synchrotron Radiation Research Center, Hsinchu, Taiwan. The light source (TPS BL44A) provided photon energy ranging from 4.5 to 34 keV, which can be adjusted by a Si(111) monochromator. The oxidation state of palladium was also acquired using a linear combination referring to the standards of Pd foil, PdCl2, and PdO2, and the fit of the XANES spectra using Athena software. In addition, the coordination of the first core shell was analyzed using FEFF calculation by the Artemis interface depending on a secondary electron backscattering mode based on the EXAFS data. Pd K-edge steps were normalized to unity, and the data above Pd K-edge was background subtracted to produce the χ(k) functions, then, converting from the energy (eV) to k space over the region from 2 to 15 Å−1. k3-weighted χ(k) data, we proceeded with Fourier transformation to form a partial radial distribution function (RDF) around Pd and used a Hanning termination window of 2.0 Å−1 at both ends of transformation range.
2.4. Methanol Oxidation Activity
The methanol oxidation activity of PtRu/carbon black was measured with a half cell. The detailed measurement procedure was reported in a previous paper [4]. Briefly, PtRu/carbon black catalyst was added in a suitable amount of distilled water to form slurry. The catalyst slurry was dropped on a rotating electrode disk. The sample was dried at 50 °C for 50 min. Nafion in isopropanol solution was then added in the catalyst and dried in nitrogen atmosphere.
Catalyst ink was prepared by dispersing the electrocatalysts in methanol with agitation. It was then dropped onto a glassy carbon surface. The Nafion alcoholic solution was dropped on the electrode surface and heated at 60 °C. The electrode was pretreated to remove surface contamination by cycling the electrode potential between 0 and 1.0 V vs. RHE at 50 mV s−1 for 100 cycles in 0.5 M H2SO4. Electrocatalytic methanol oxidation was measured by chronoamperometry in 1 M CH3OH mixed with 0.5 M H2SO4. Catalytic activity was calculated by the current density at 0.5 V obtained by the CV method divided by PtRu catalyst loading.
3. Results and Discussion
3.1. Characteristics of Carbon Black
3.1.1. TPD of Functional Groups on the Surface of Carbon Black
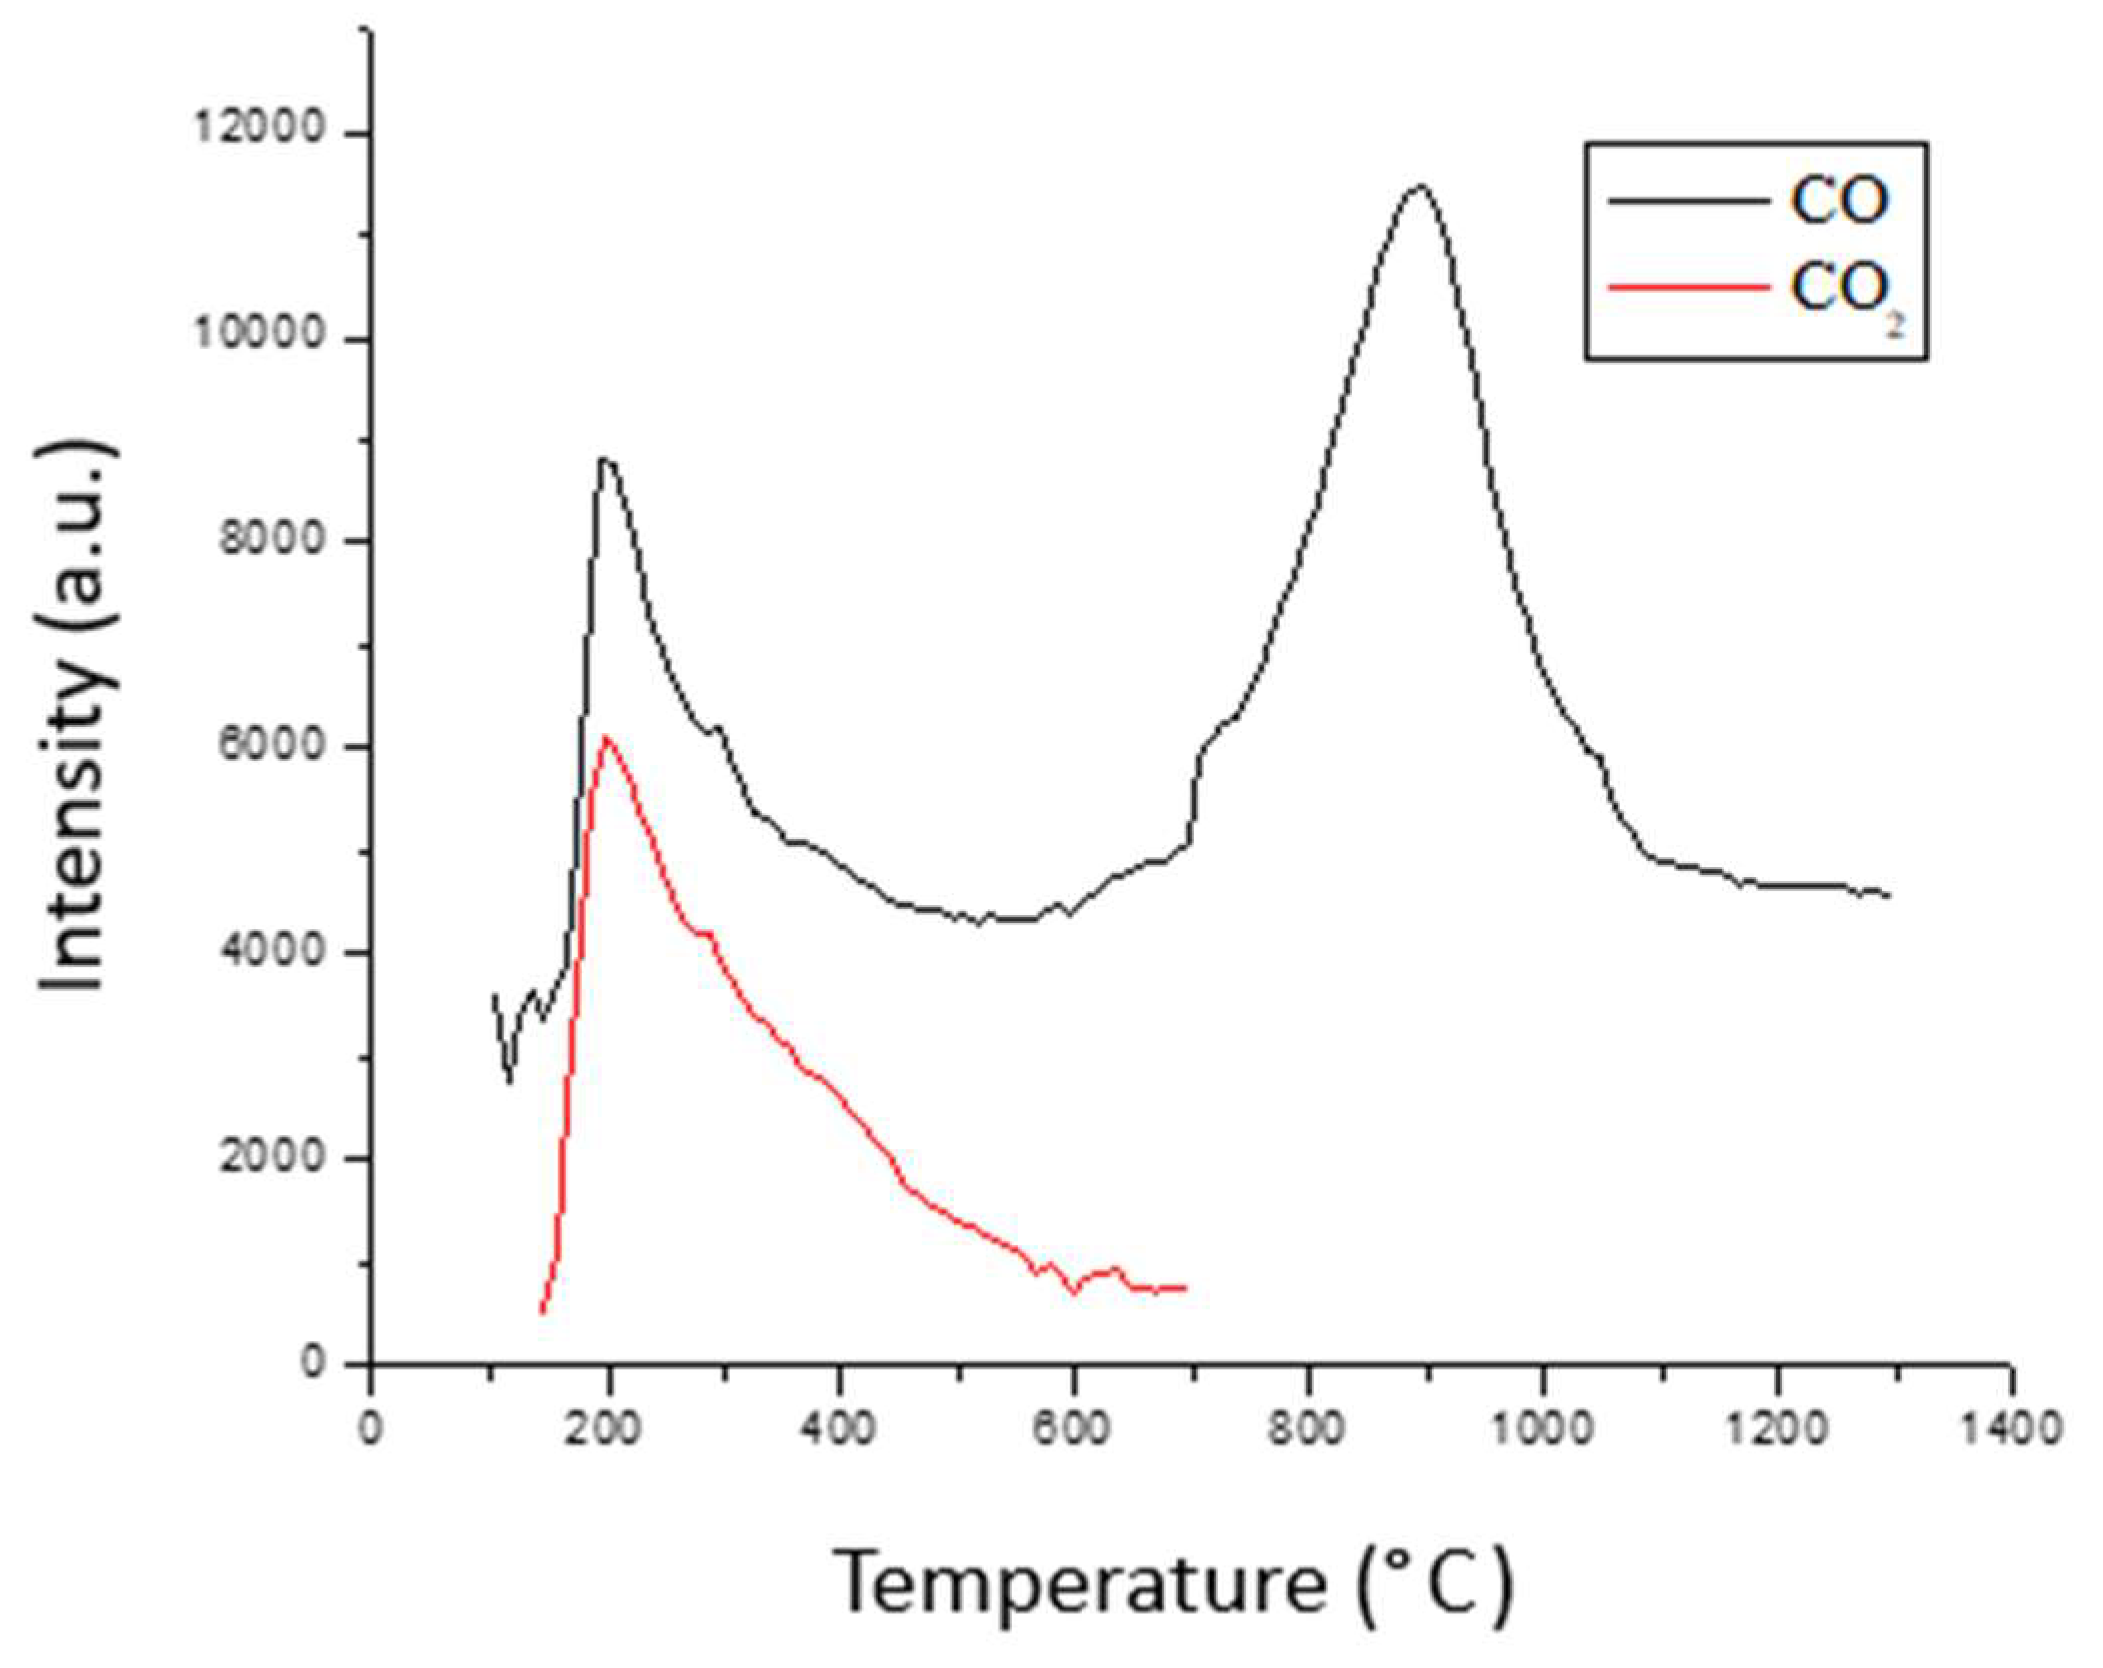
Figure 1 shows the presence of oxygen-containing functional groups on the carbon black. The TPD peak at low temperatures was mainly from the strong acidic functional groups, and the desorption at high temperatures was from weak acidic functional groups [20,21]. This shows that the carbon black has both strong and weak functional groups on the surface. The amount of weak acidic functional groups was higher than that of the strong acidic function groups. The amounts of functional groups on carbon black are listed in Table 1.
3.1.2. BET Surface Area and Pore Size Distribution of Carbon Black
BET surface area was calculated using the N2 sorption isotherm, and pore size distribution was calculated using the BJH method. It shows that the surface area of carbon black was 855 m2/g. The average pore diameter was 59 Å, and the total pore volume was 1.25 cm3/g. The conductivity of carbon black was 12.11 S/cm, as shown in Table 1.
3.2. Characterization of PtRu/Carbon Black Anode Catalyst
3.2.1. XRD
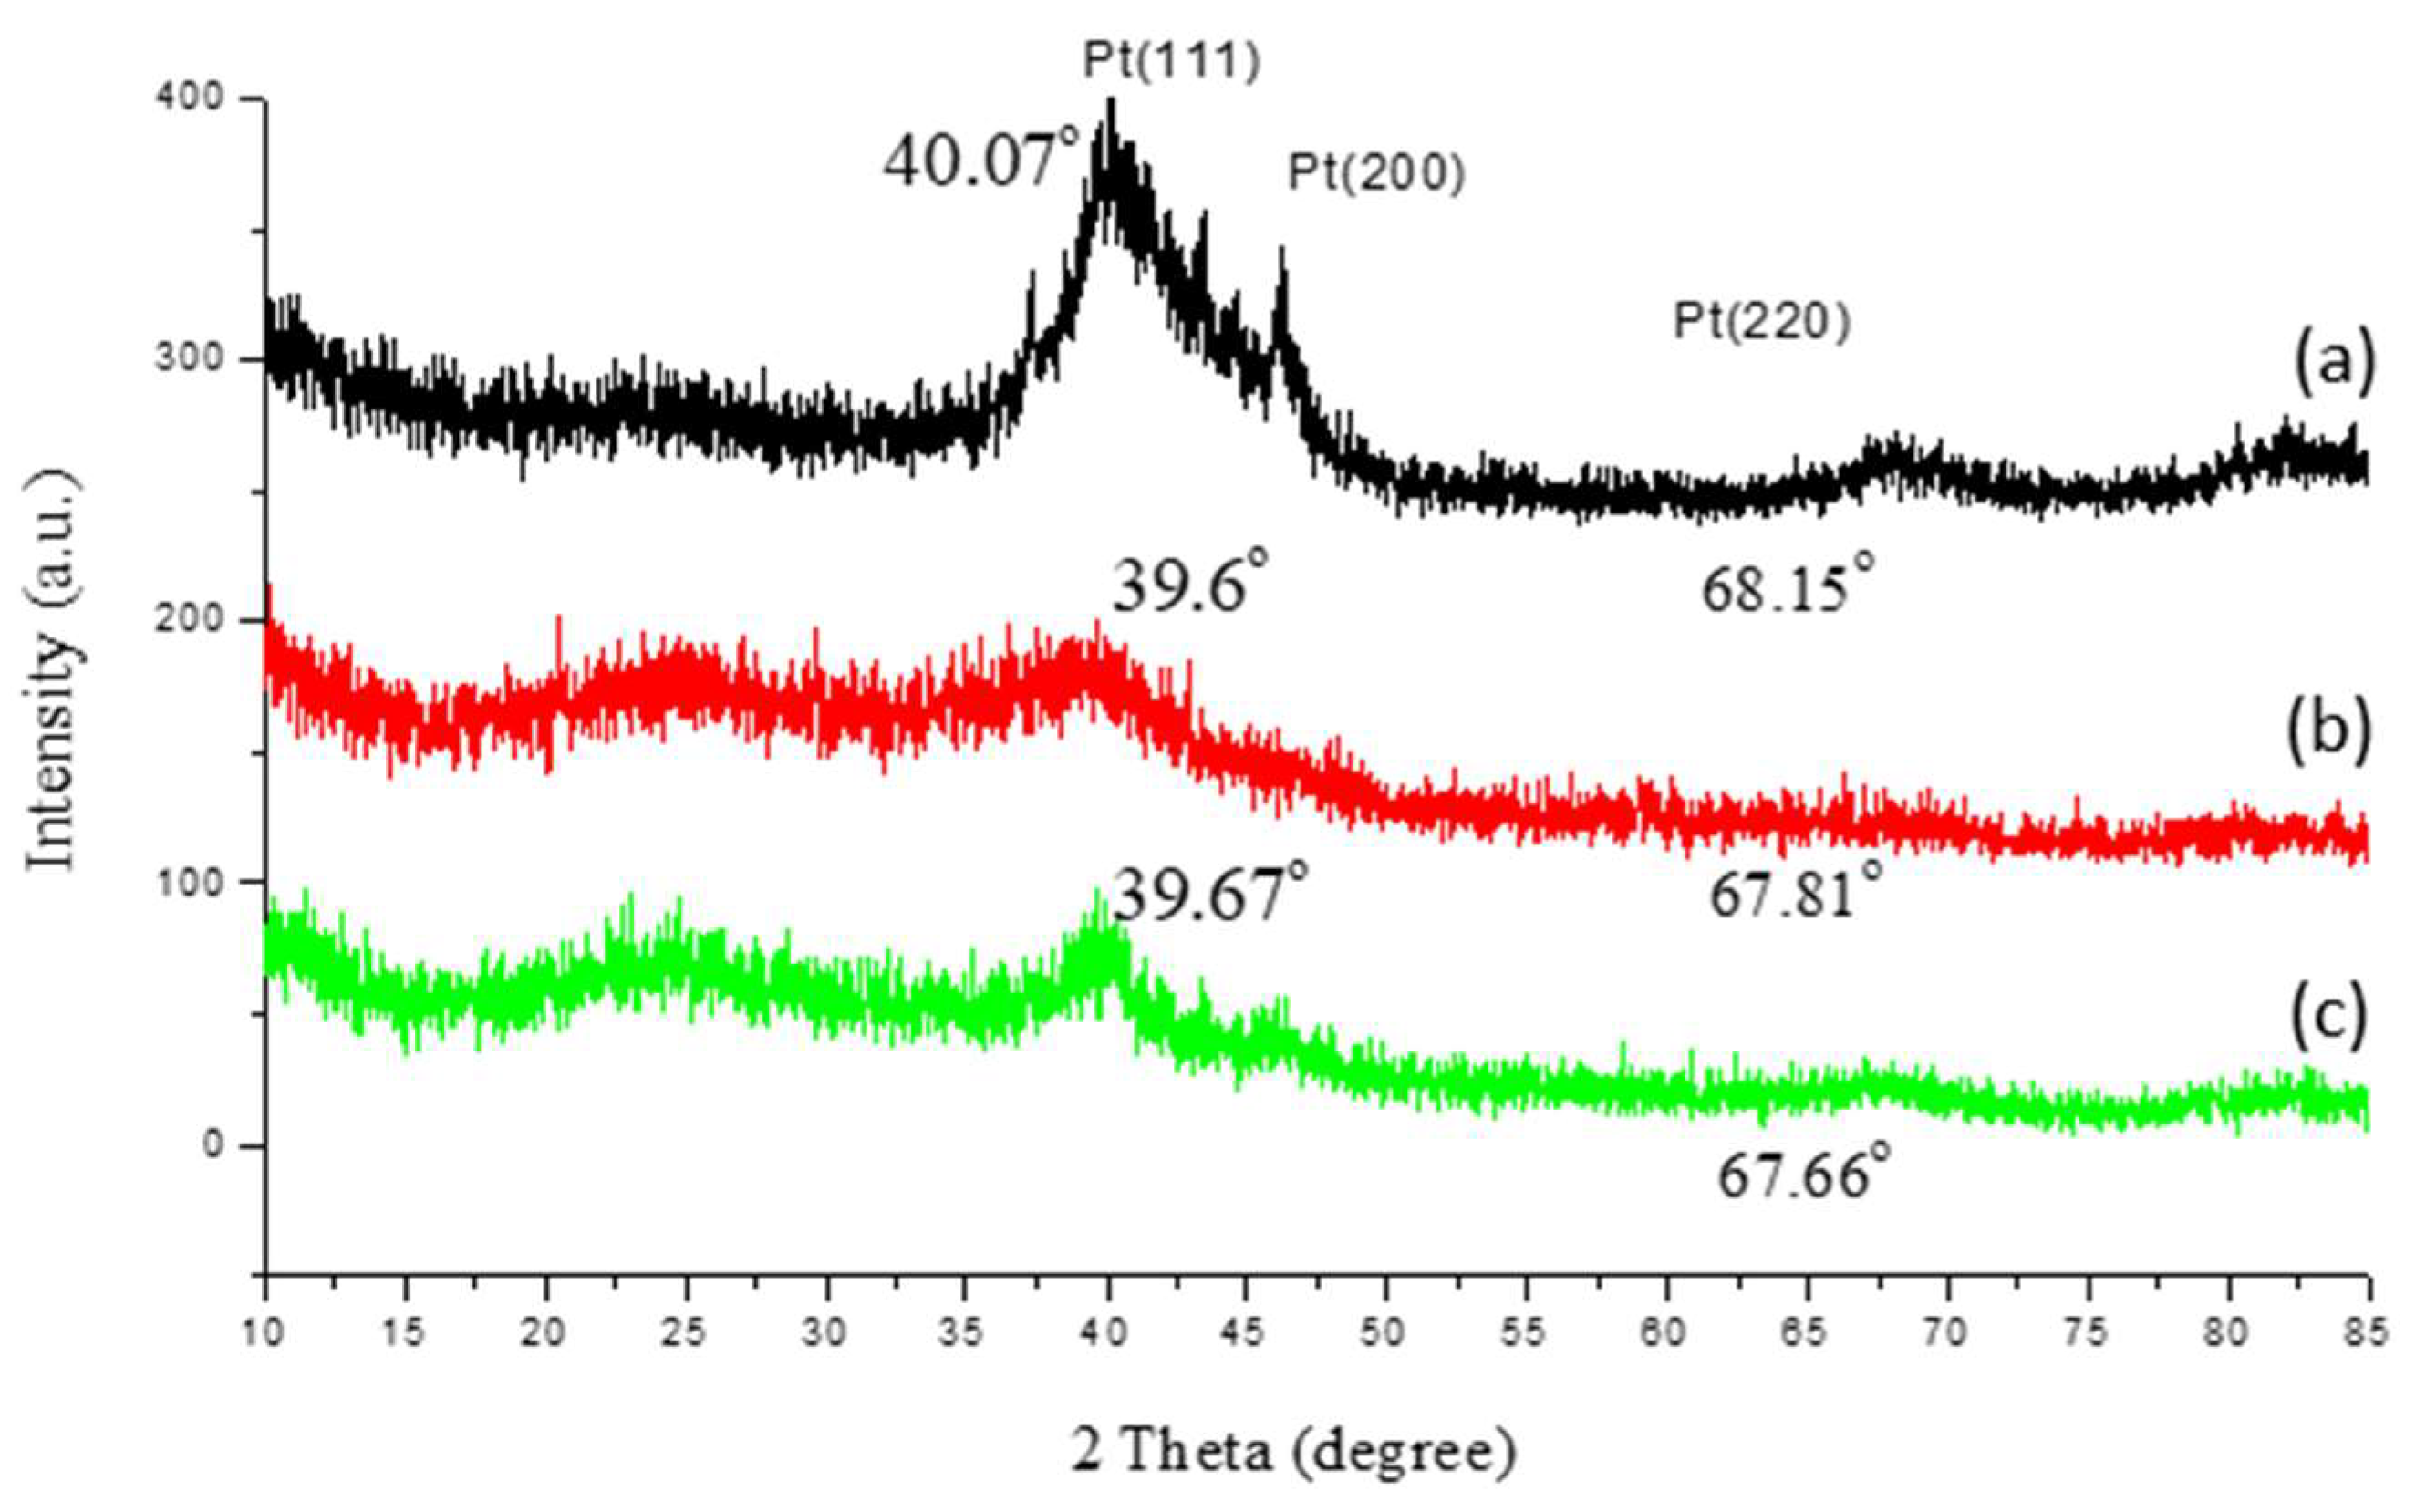
Pt is a face-centered cubic crystal. It has XRD peaks at 39.9°, 46.3° and 67.45°, corresponding to face (111), (200), and (220), respectively, in Pt/carbon black. In PtRu/C catalyst [22,23,24], since the atomic radius of Ru is smaller than that of Pt, the spacing of PtRu alloy crystal is smaller than that of Pt, resulting in the shift of XRD peaks to a higher degree.
Figure 2 shows the XRD patterns of the PtRu catalysts supported on the carbon black and reduced by various reducing agents; the Pt-Ru/carbon-NaBH4 sample was reduced by NaBH4, the Pt-Ru/carbon-HCHO sample was reduced by HCHO, and the Pt-Ru/carbon-NaH2PO2 sample was reduced by NaH2PO2. Scherrer’s equation was used to calculate the crystallite size of the sample based on the peak intensity of phase (220). The crystallite of the Pt-Ru/carbon-NaBH4 sample was 2.57 nm long. We were not able to calculate the crystallite sizes of the Pt-Ru/carbon-HCHO and Pt-Ru/carbon-NaH2PO2 samples, since the noise of the signal was too large and the peak intensity of phase (220) was too small. The results show that the sample reduced by NaBH4 had the large metal particle size. The XRD peaks for Pt slightly shifted to a high angle, but this was not significant. There were no XRD peaks for Ru and RuO2, inferring that Ru particles were too small to be detected.
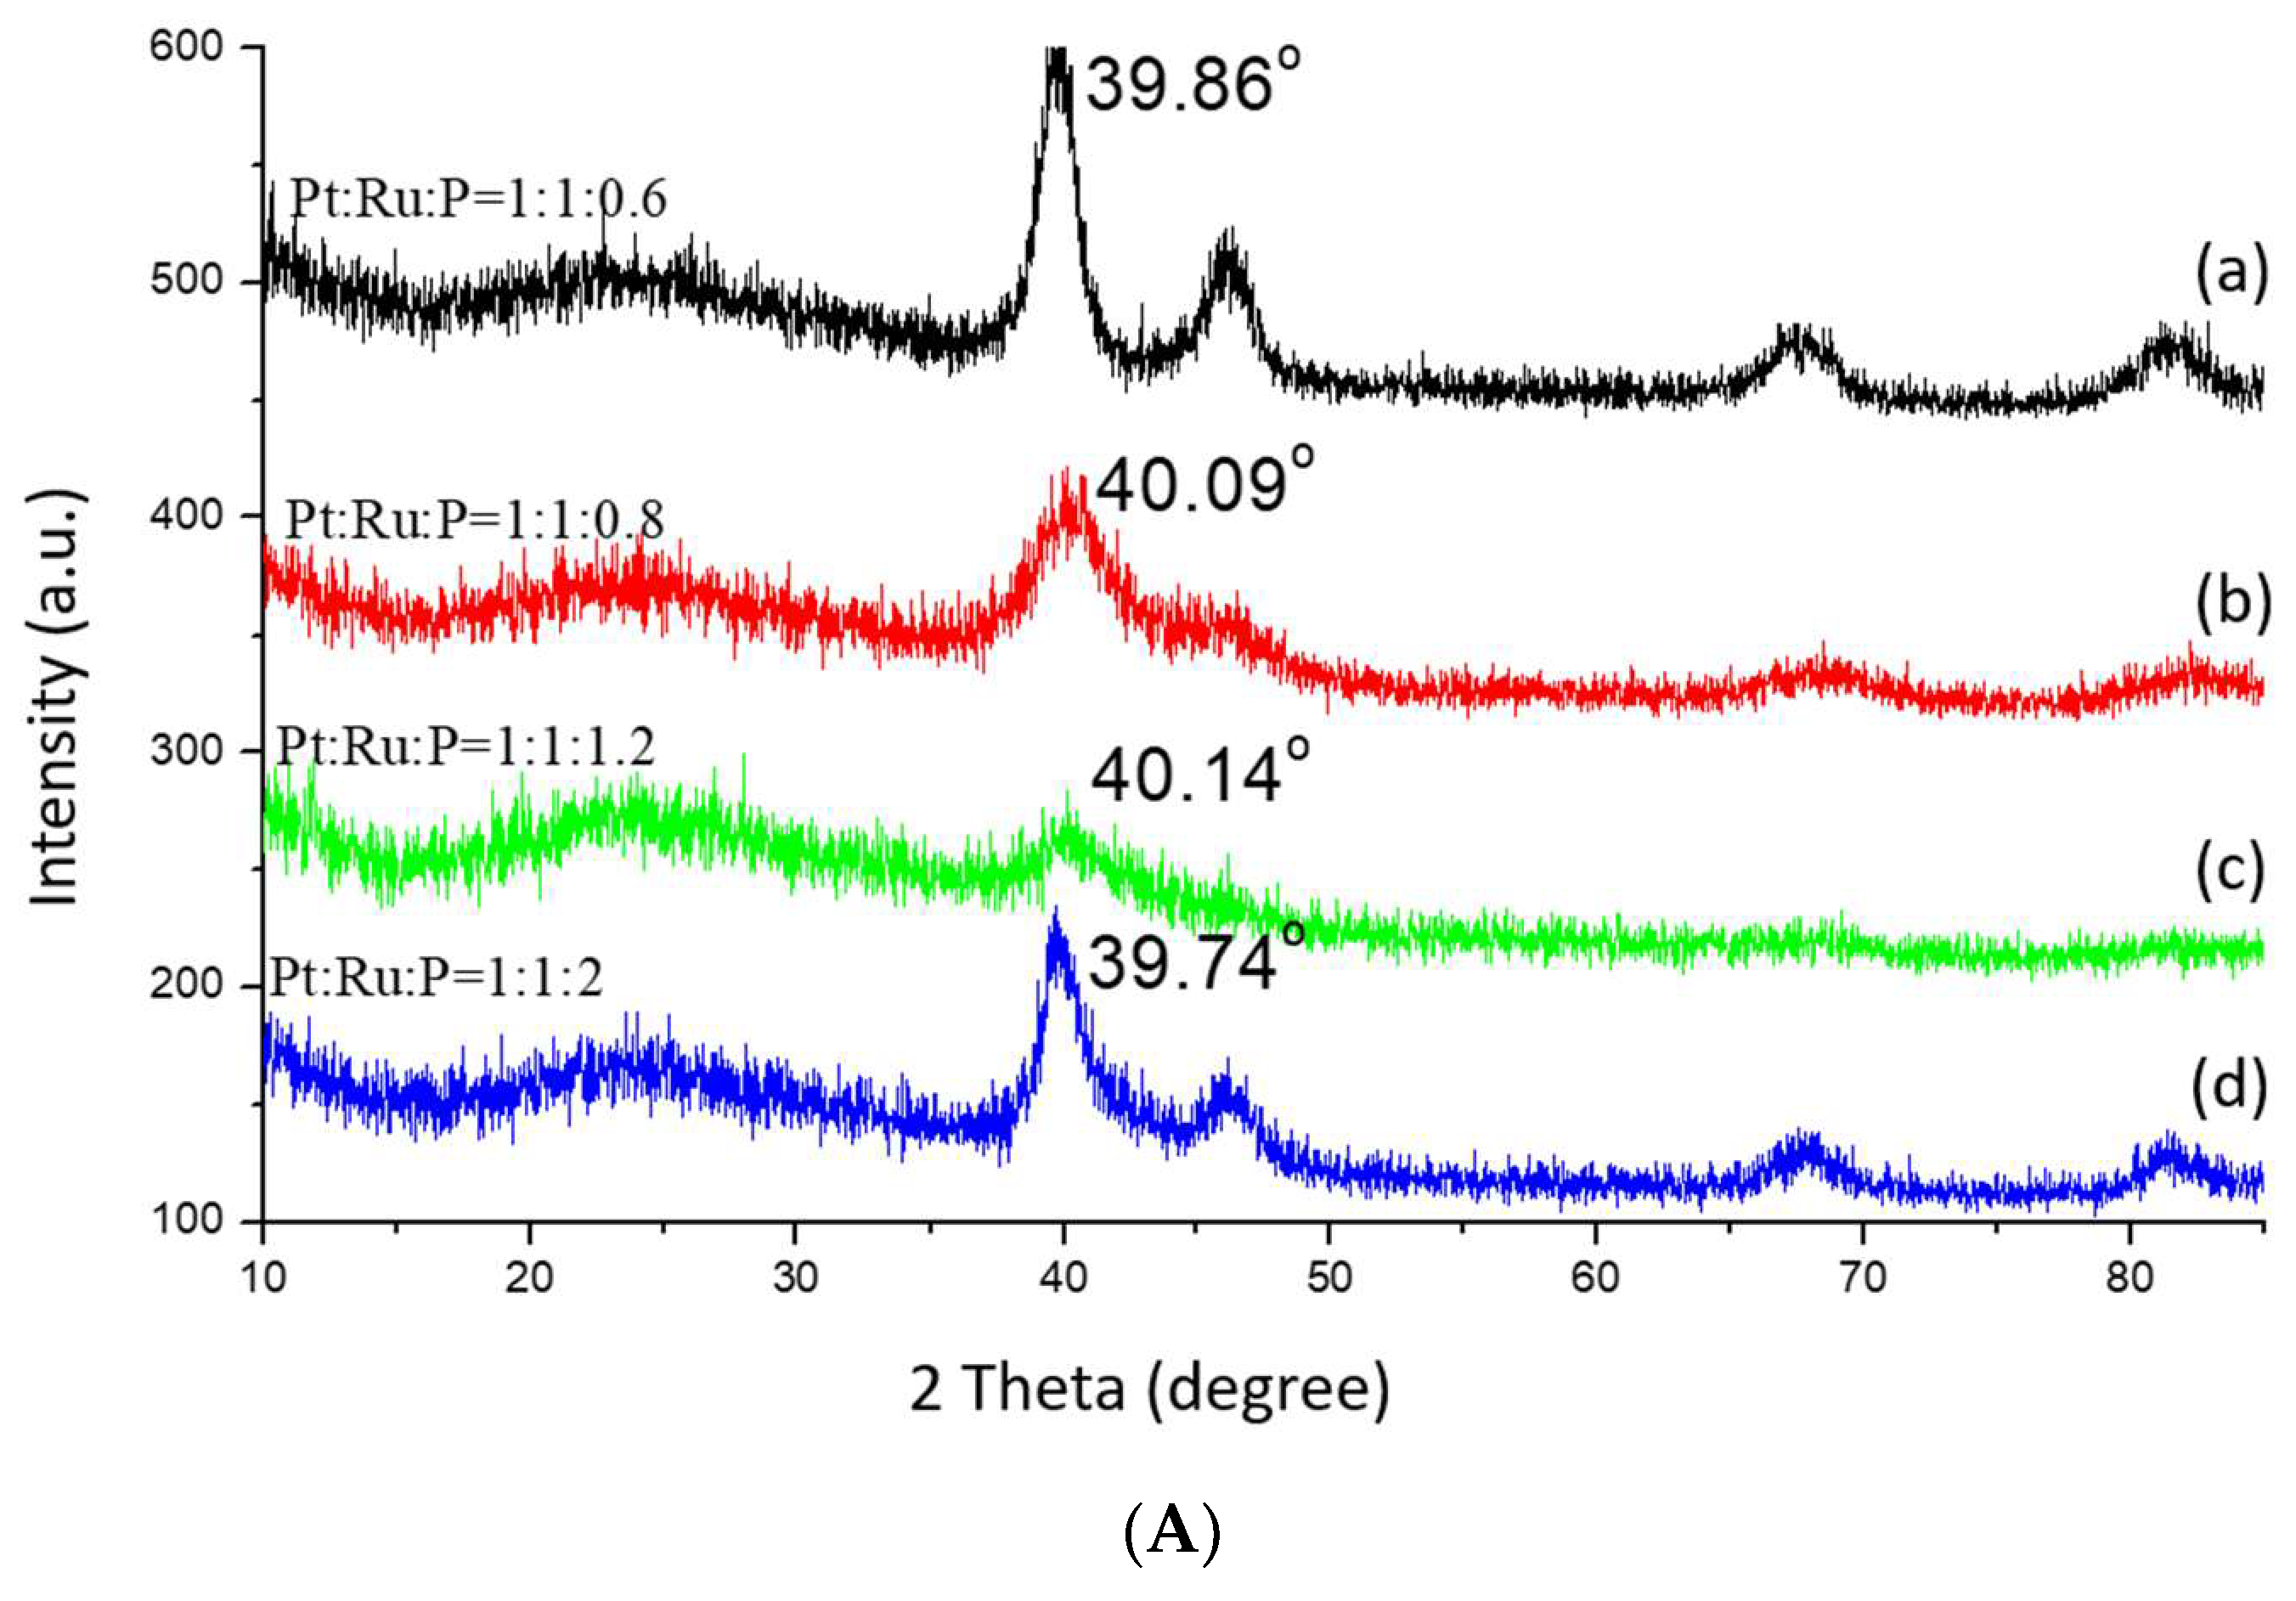
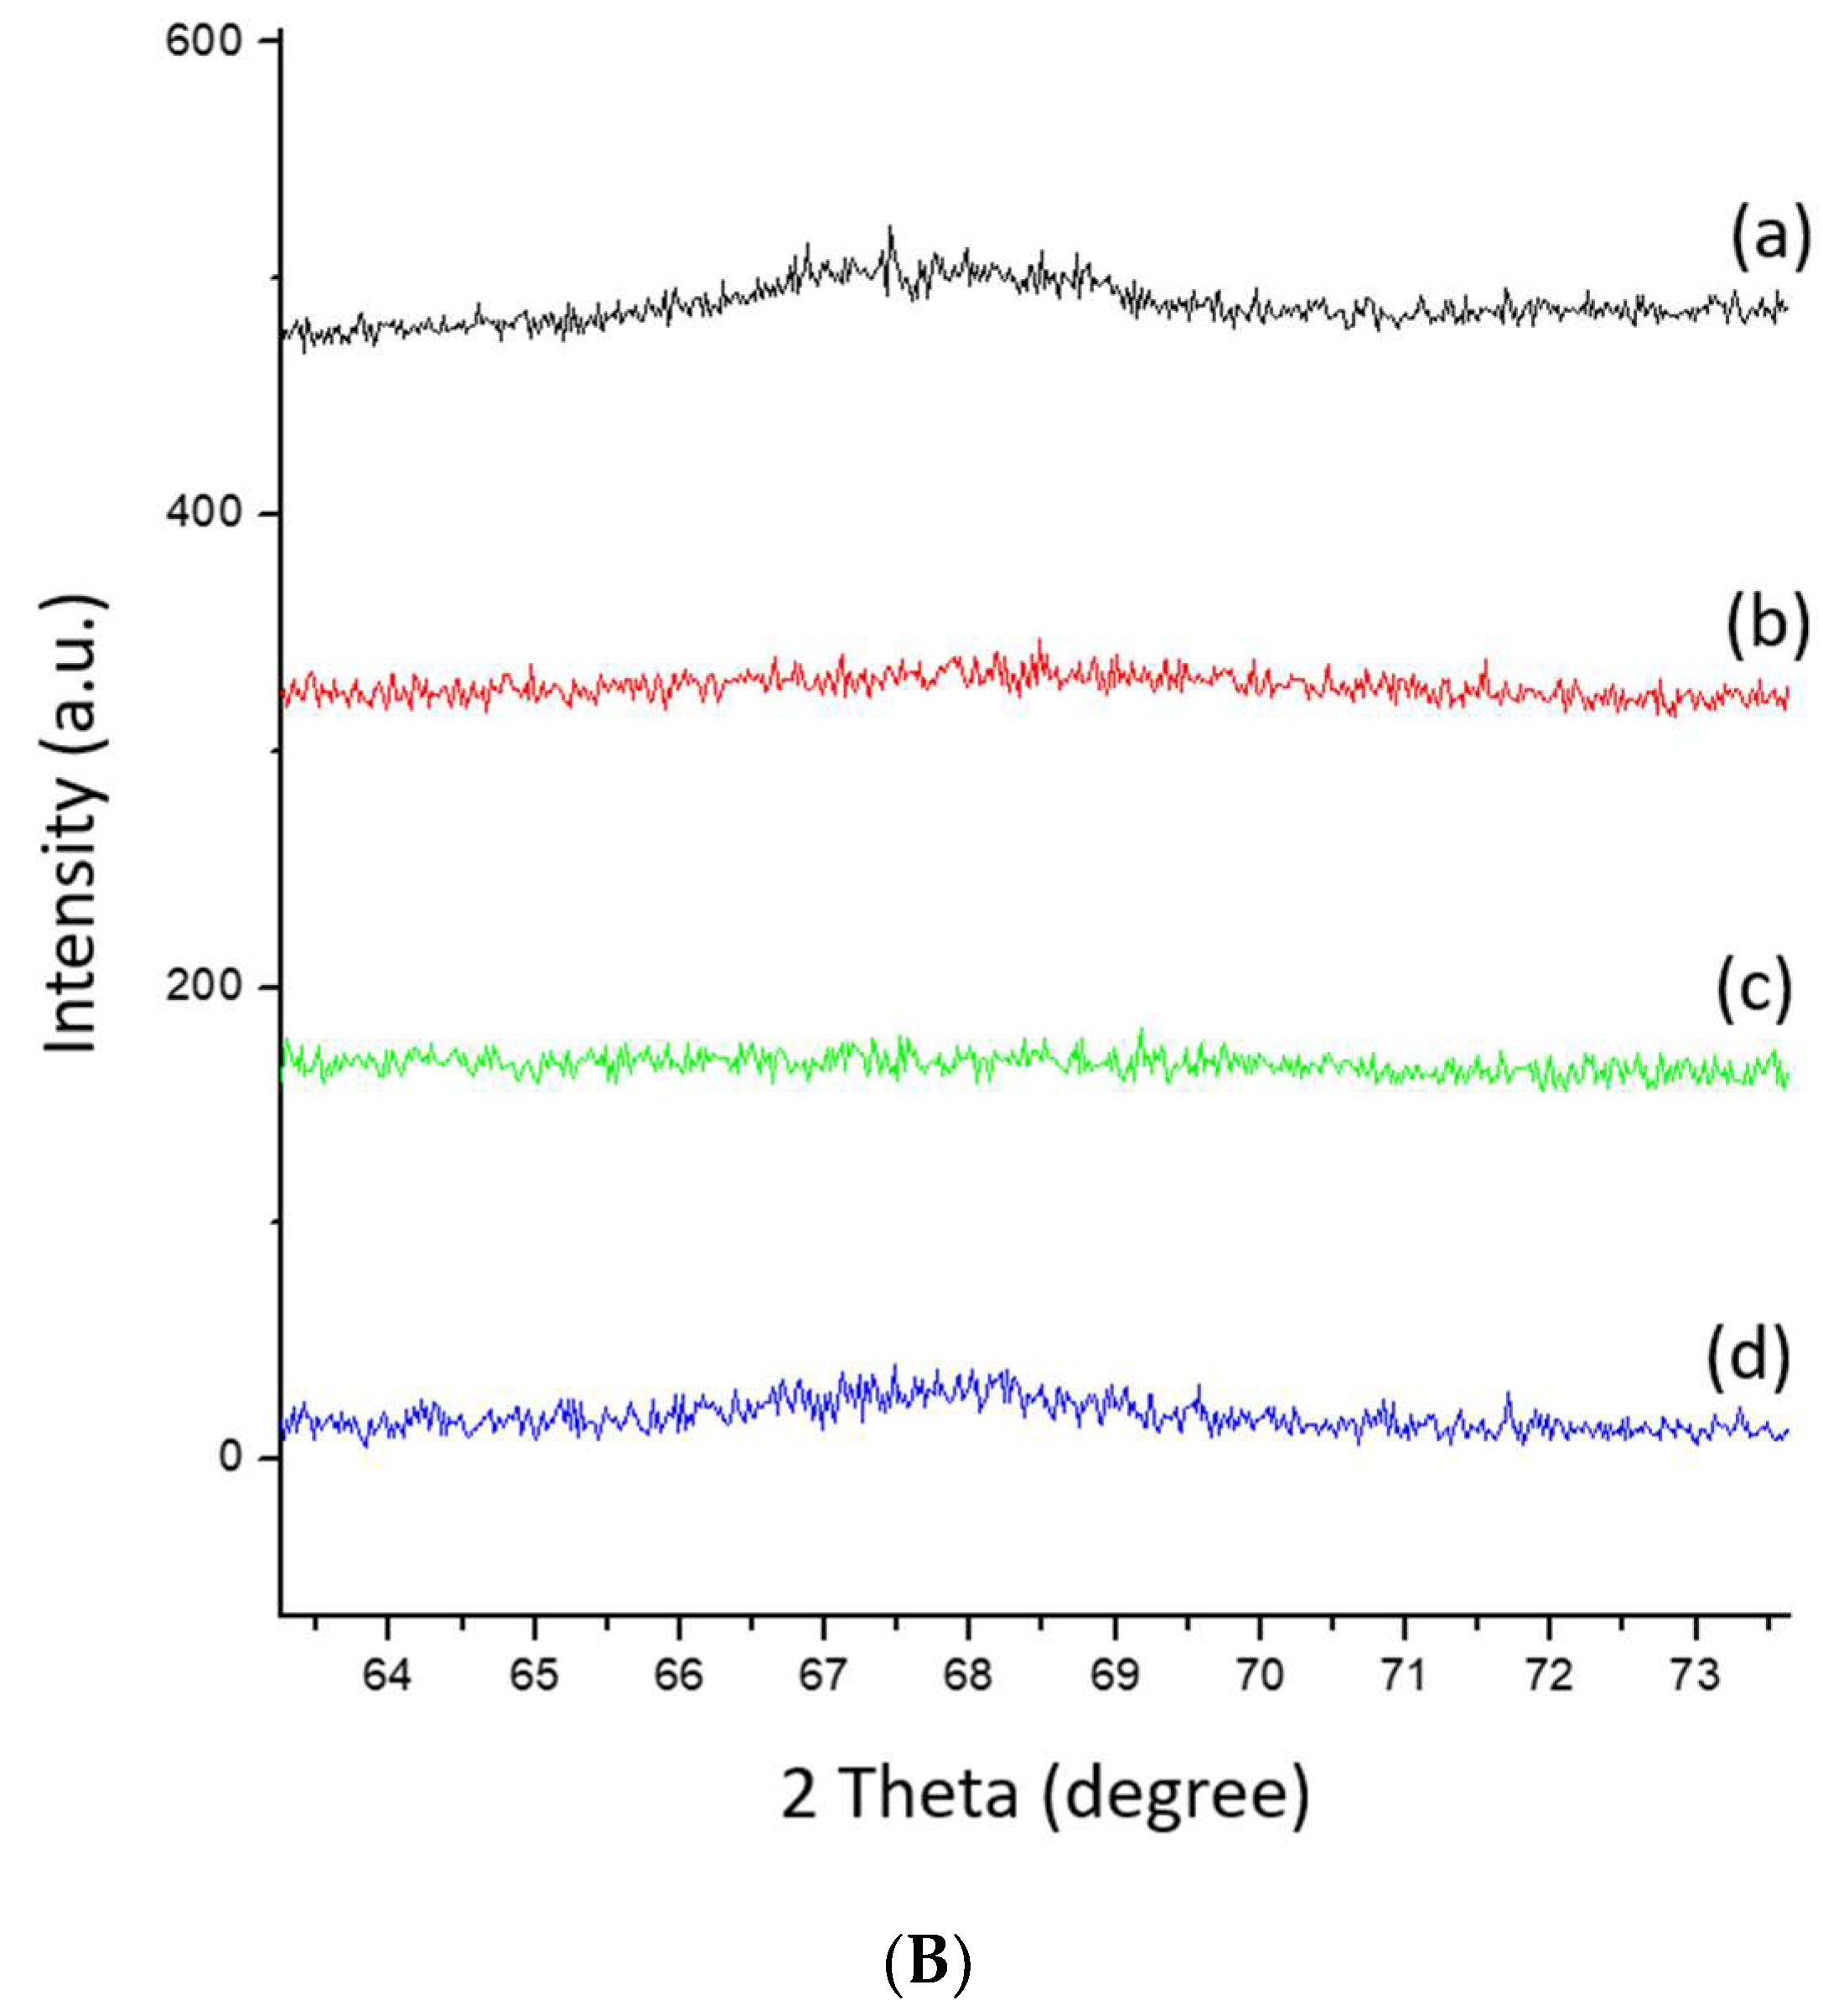
Figure 3 shows the effect of the amount of NaH2PO2 on the properties of the catalysts. The catalyst is denoted as PtRuP/carbon (x), where x is the atomic ratio of P/Pt. As the amount of NaH2PO2 increased, the (200) peak and (220) peak could not be differentiated. The XRD peak of (220) became broader as the amount of NaH2PO2 increased, indicating that the particle size of the catalyst decreased. The particle size of PtRu/carbon (0.8) increased, possibly because the amount of NaH2PO2 was not enough to suppress the growth of metal particles. When the amount of phosphorus increased to a P/Pt atomic ratio of 2, the XRD peak Pt (220) became narrow, indicating that the particle size of Pt was greater than the other samples. This is due to the large amount of P on the surface of carbon black, resulting in less space to adjust the metal particle size.
3.2.2. TEM
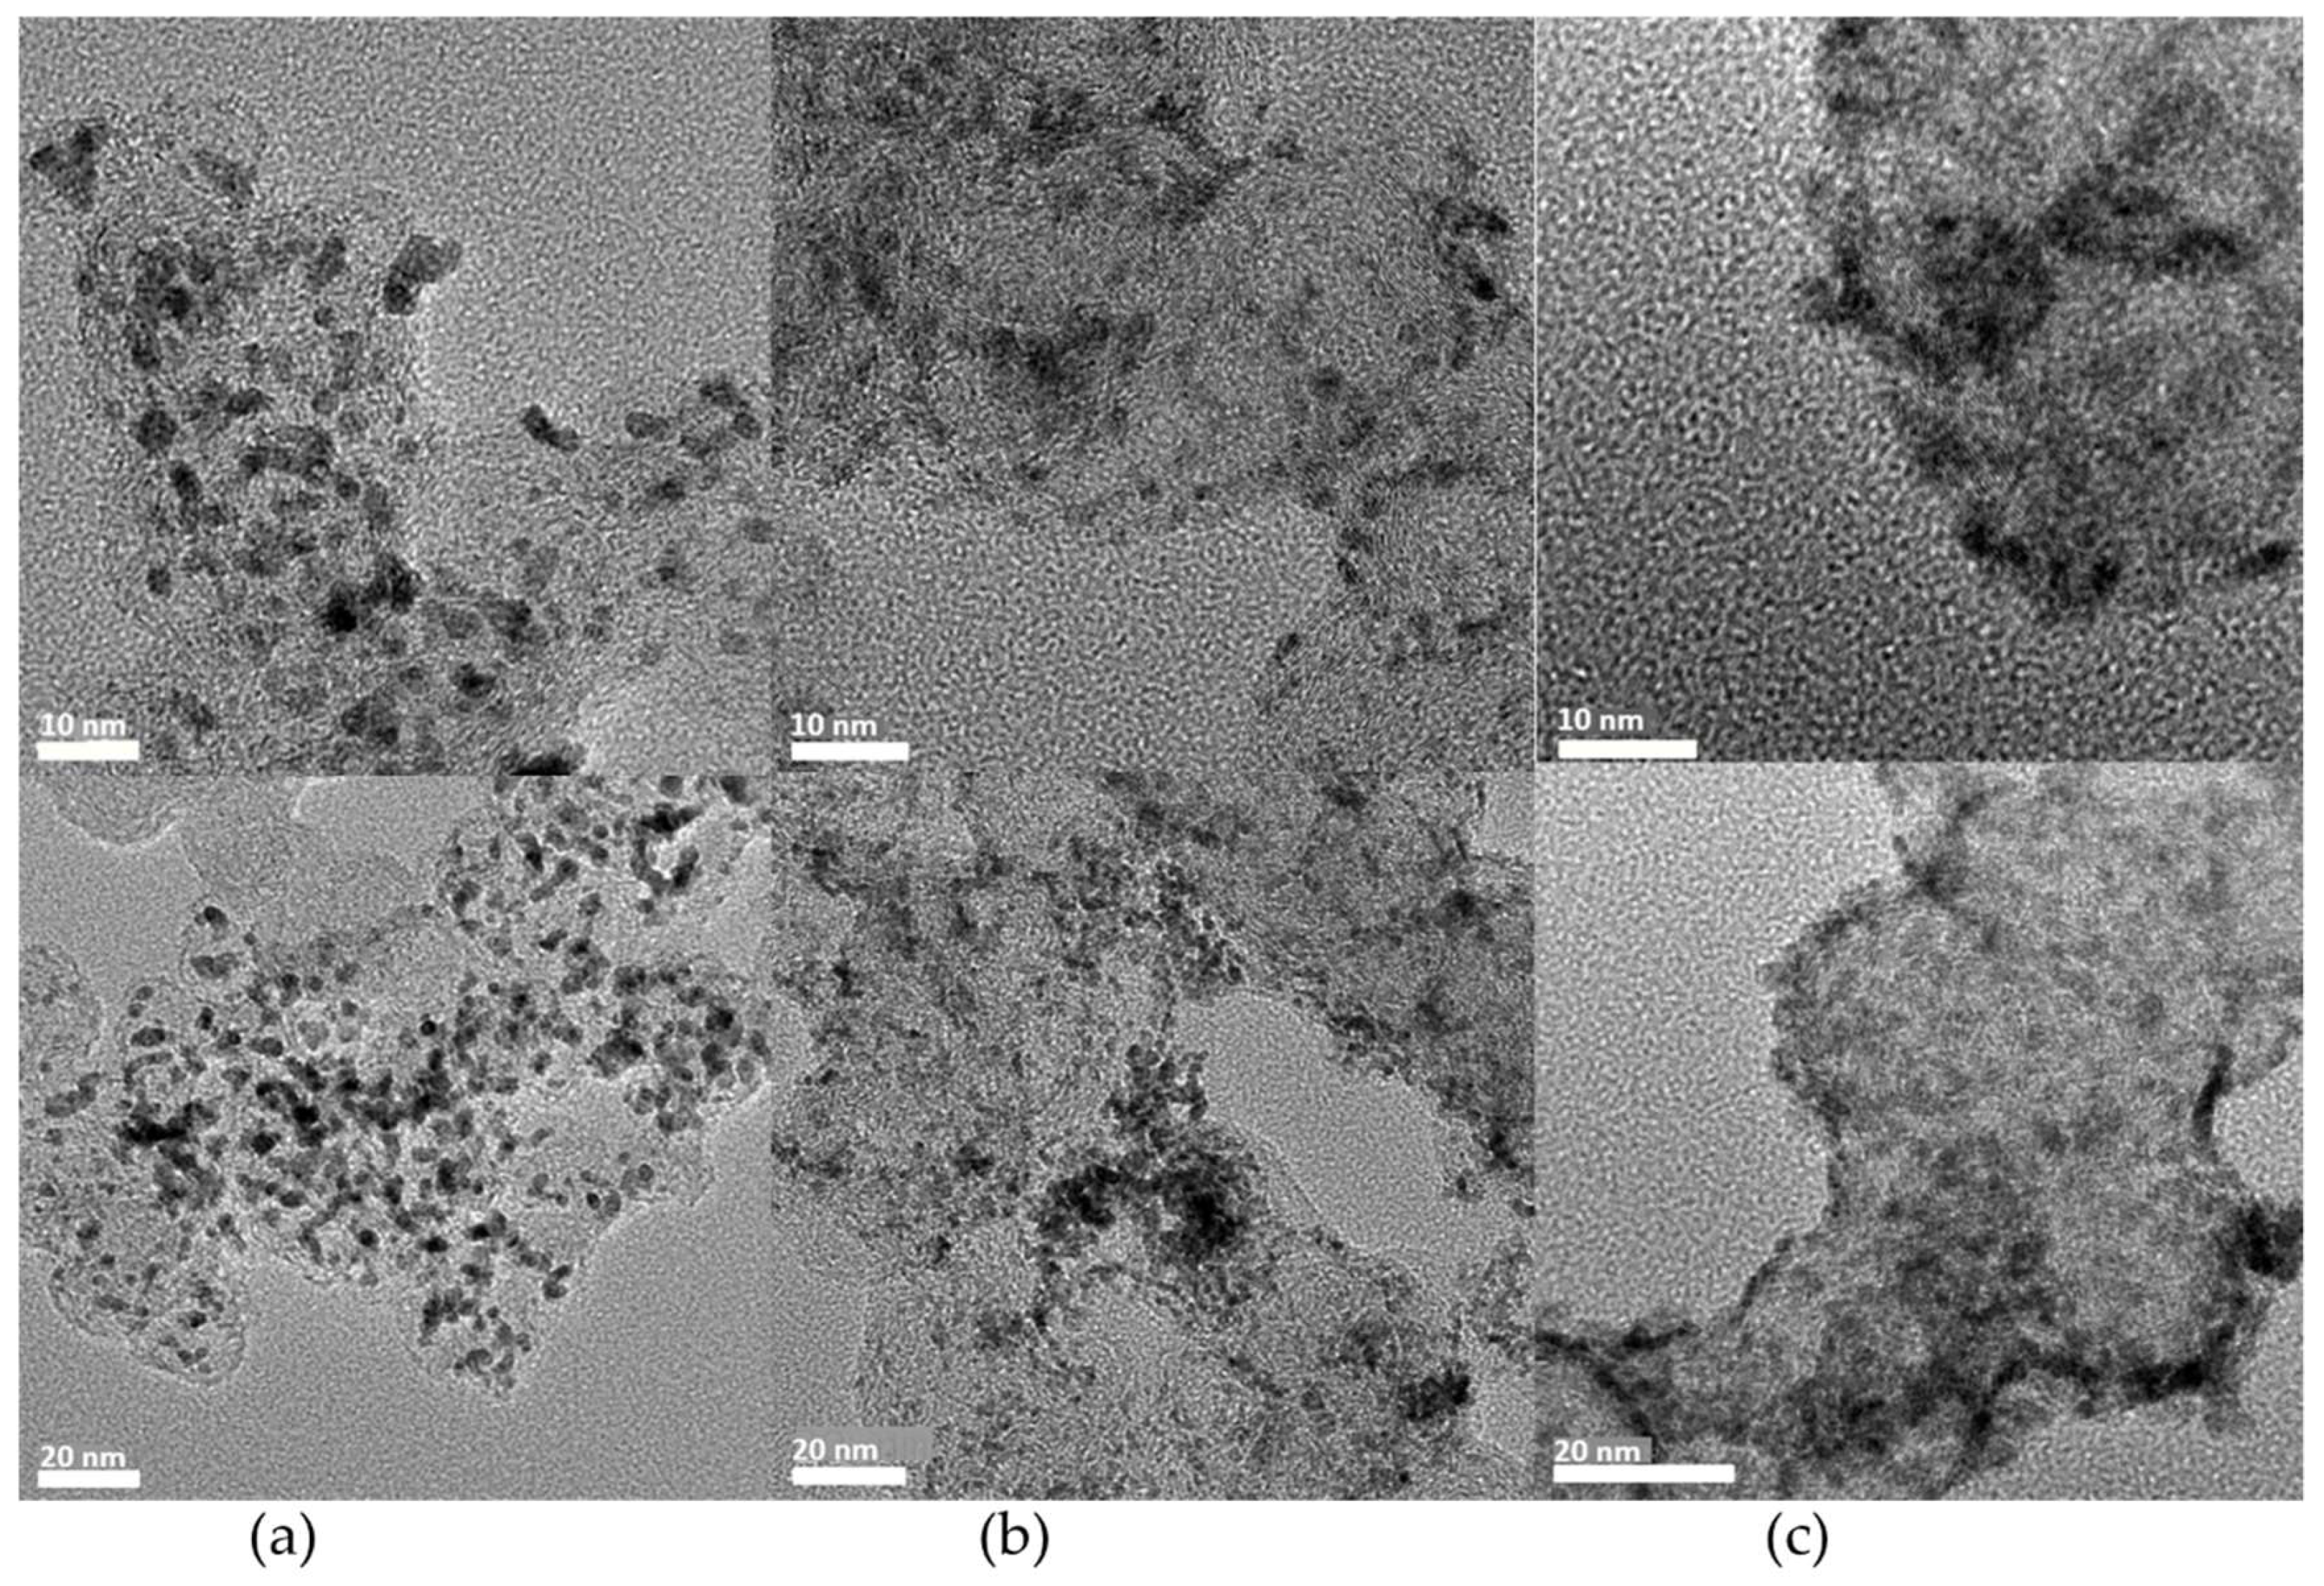
The metal particle size of each sample is listed in Table 2. Figure 4 shows the TEM images of the samples reduced by various agents. The sample reduced by NaBH4 had large particles and low metal dispersion. The sample reduced by HCHO had particles smaller than 3 nm, even though it has low amount of function groups. However, its PtRu metal dispersion is not high. The TEM image shows that it had some big particles. The sample reduced by NaH2PO2 had particles smaller than 3 nm. It has high metal dispersion. The results show that the sample reduced by NaH2PO2 can yield small particles and high metal dispersion.
The difference in metal particle sizes is caused by the different reduction rates. The reduction rate by NaBH4 is very fast. Metal cations were reduced before distribution homogeneously, and resulted in the non-homogeneous distribution of metal particles. The reduction rate by HCHO was slow, and it resulted in small metal particles. The reduction rate by NaH2PO2 was fast, but phosphorus could cover the surface of the carbon black [16]. It could thus regulate the metal particle size, and suppressed the growth of metal particles. Therefore, the metal particle was small and homogeneously distributed on the surface of the carbon black. In conclusion, NaH2PO2 is the best reducing agent among all samples in this study.
3.2.3. Effect of Phosphorus Content in Reduction on the Activity of the Catalyst
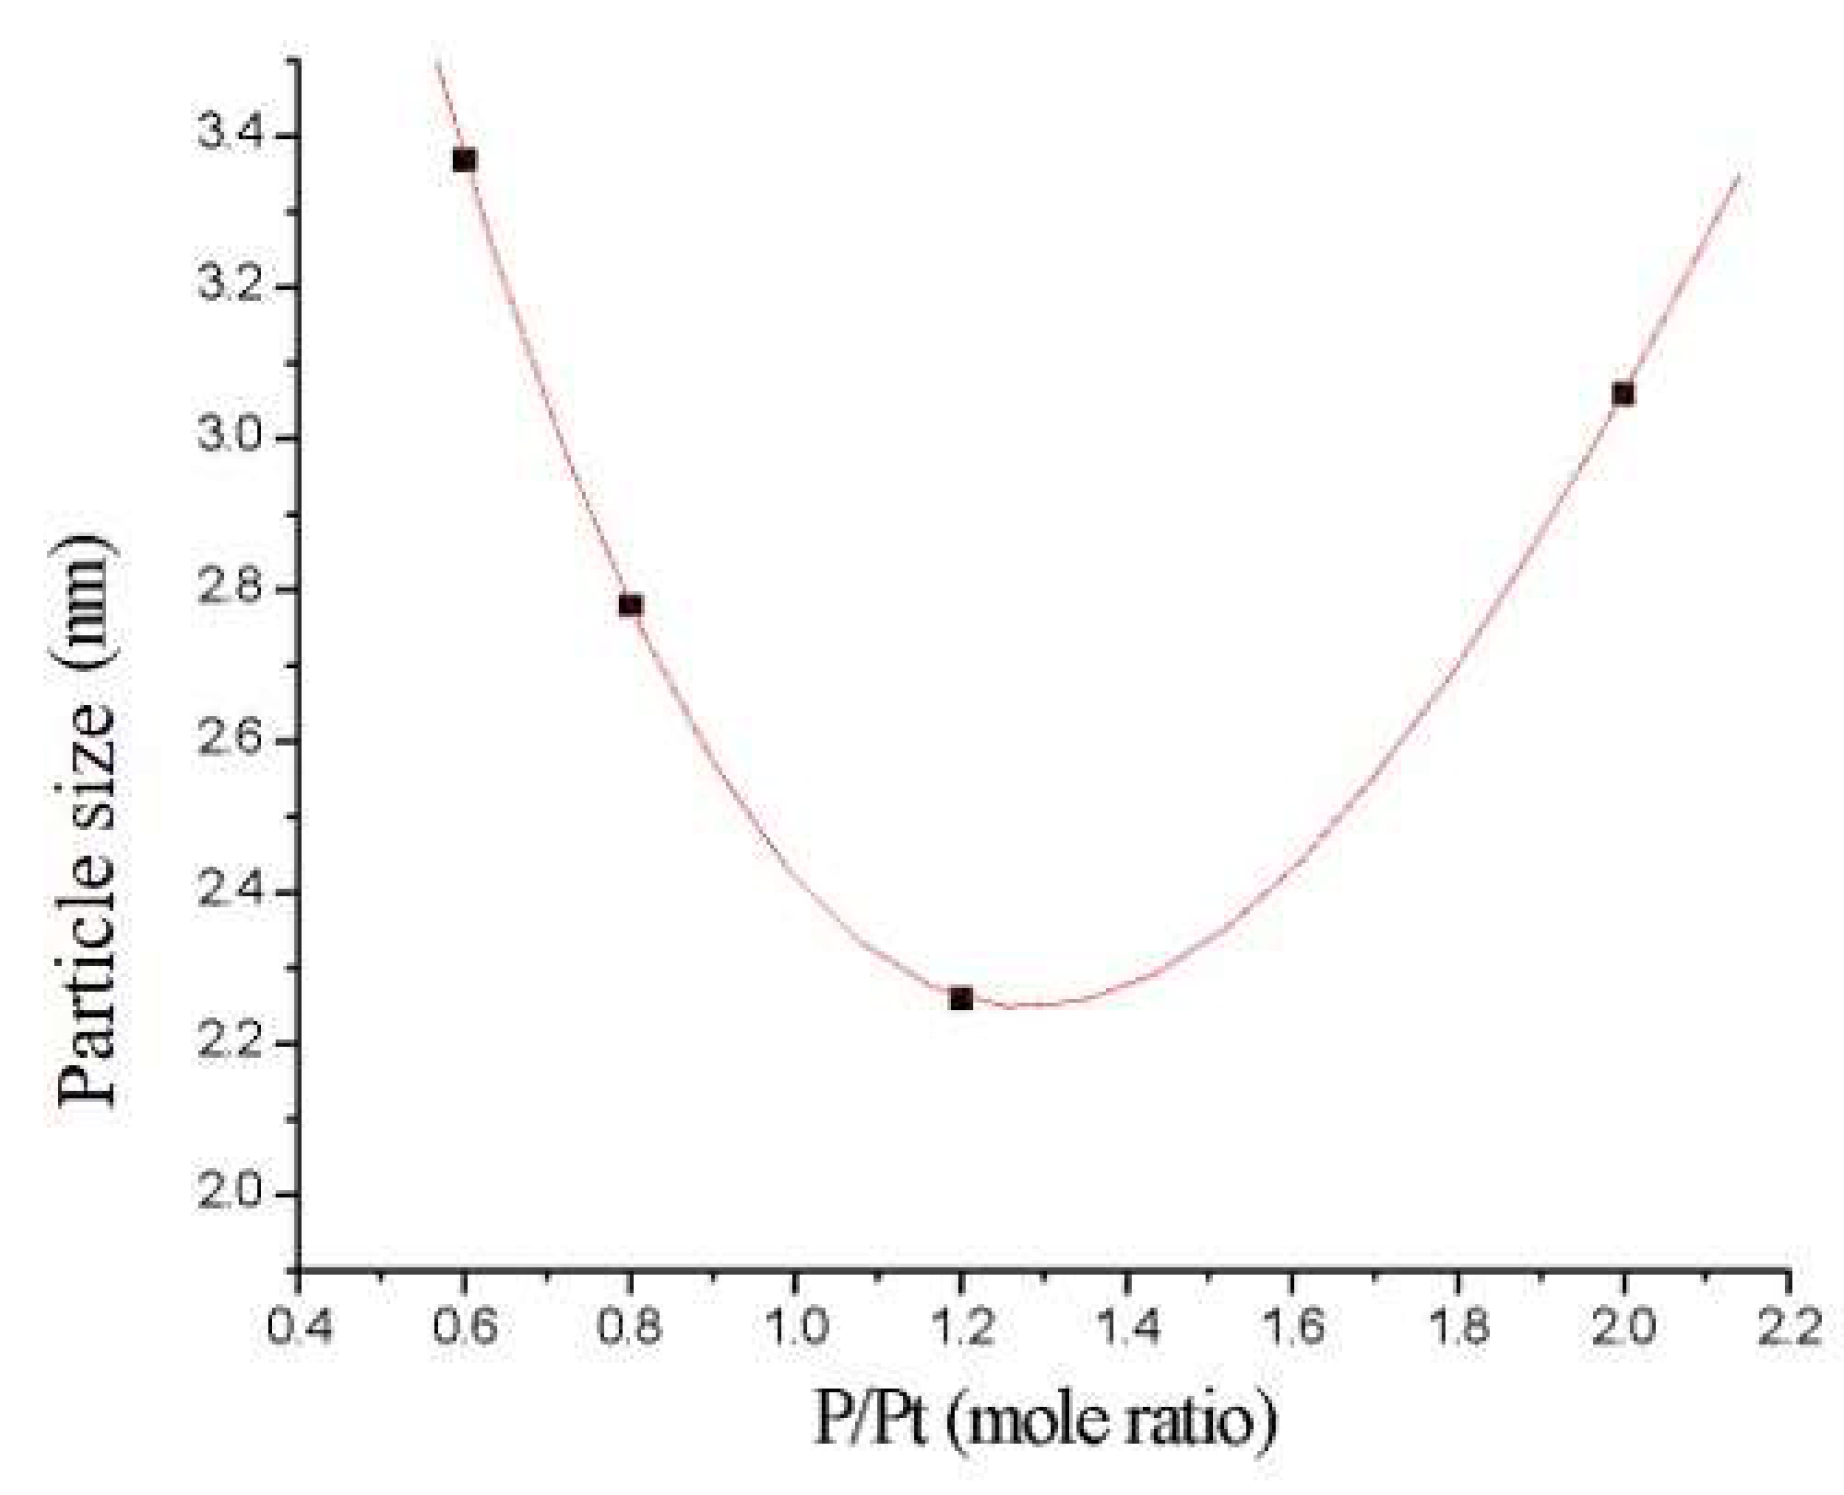
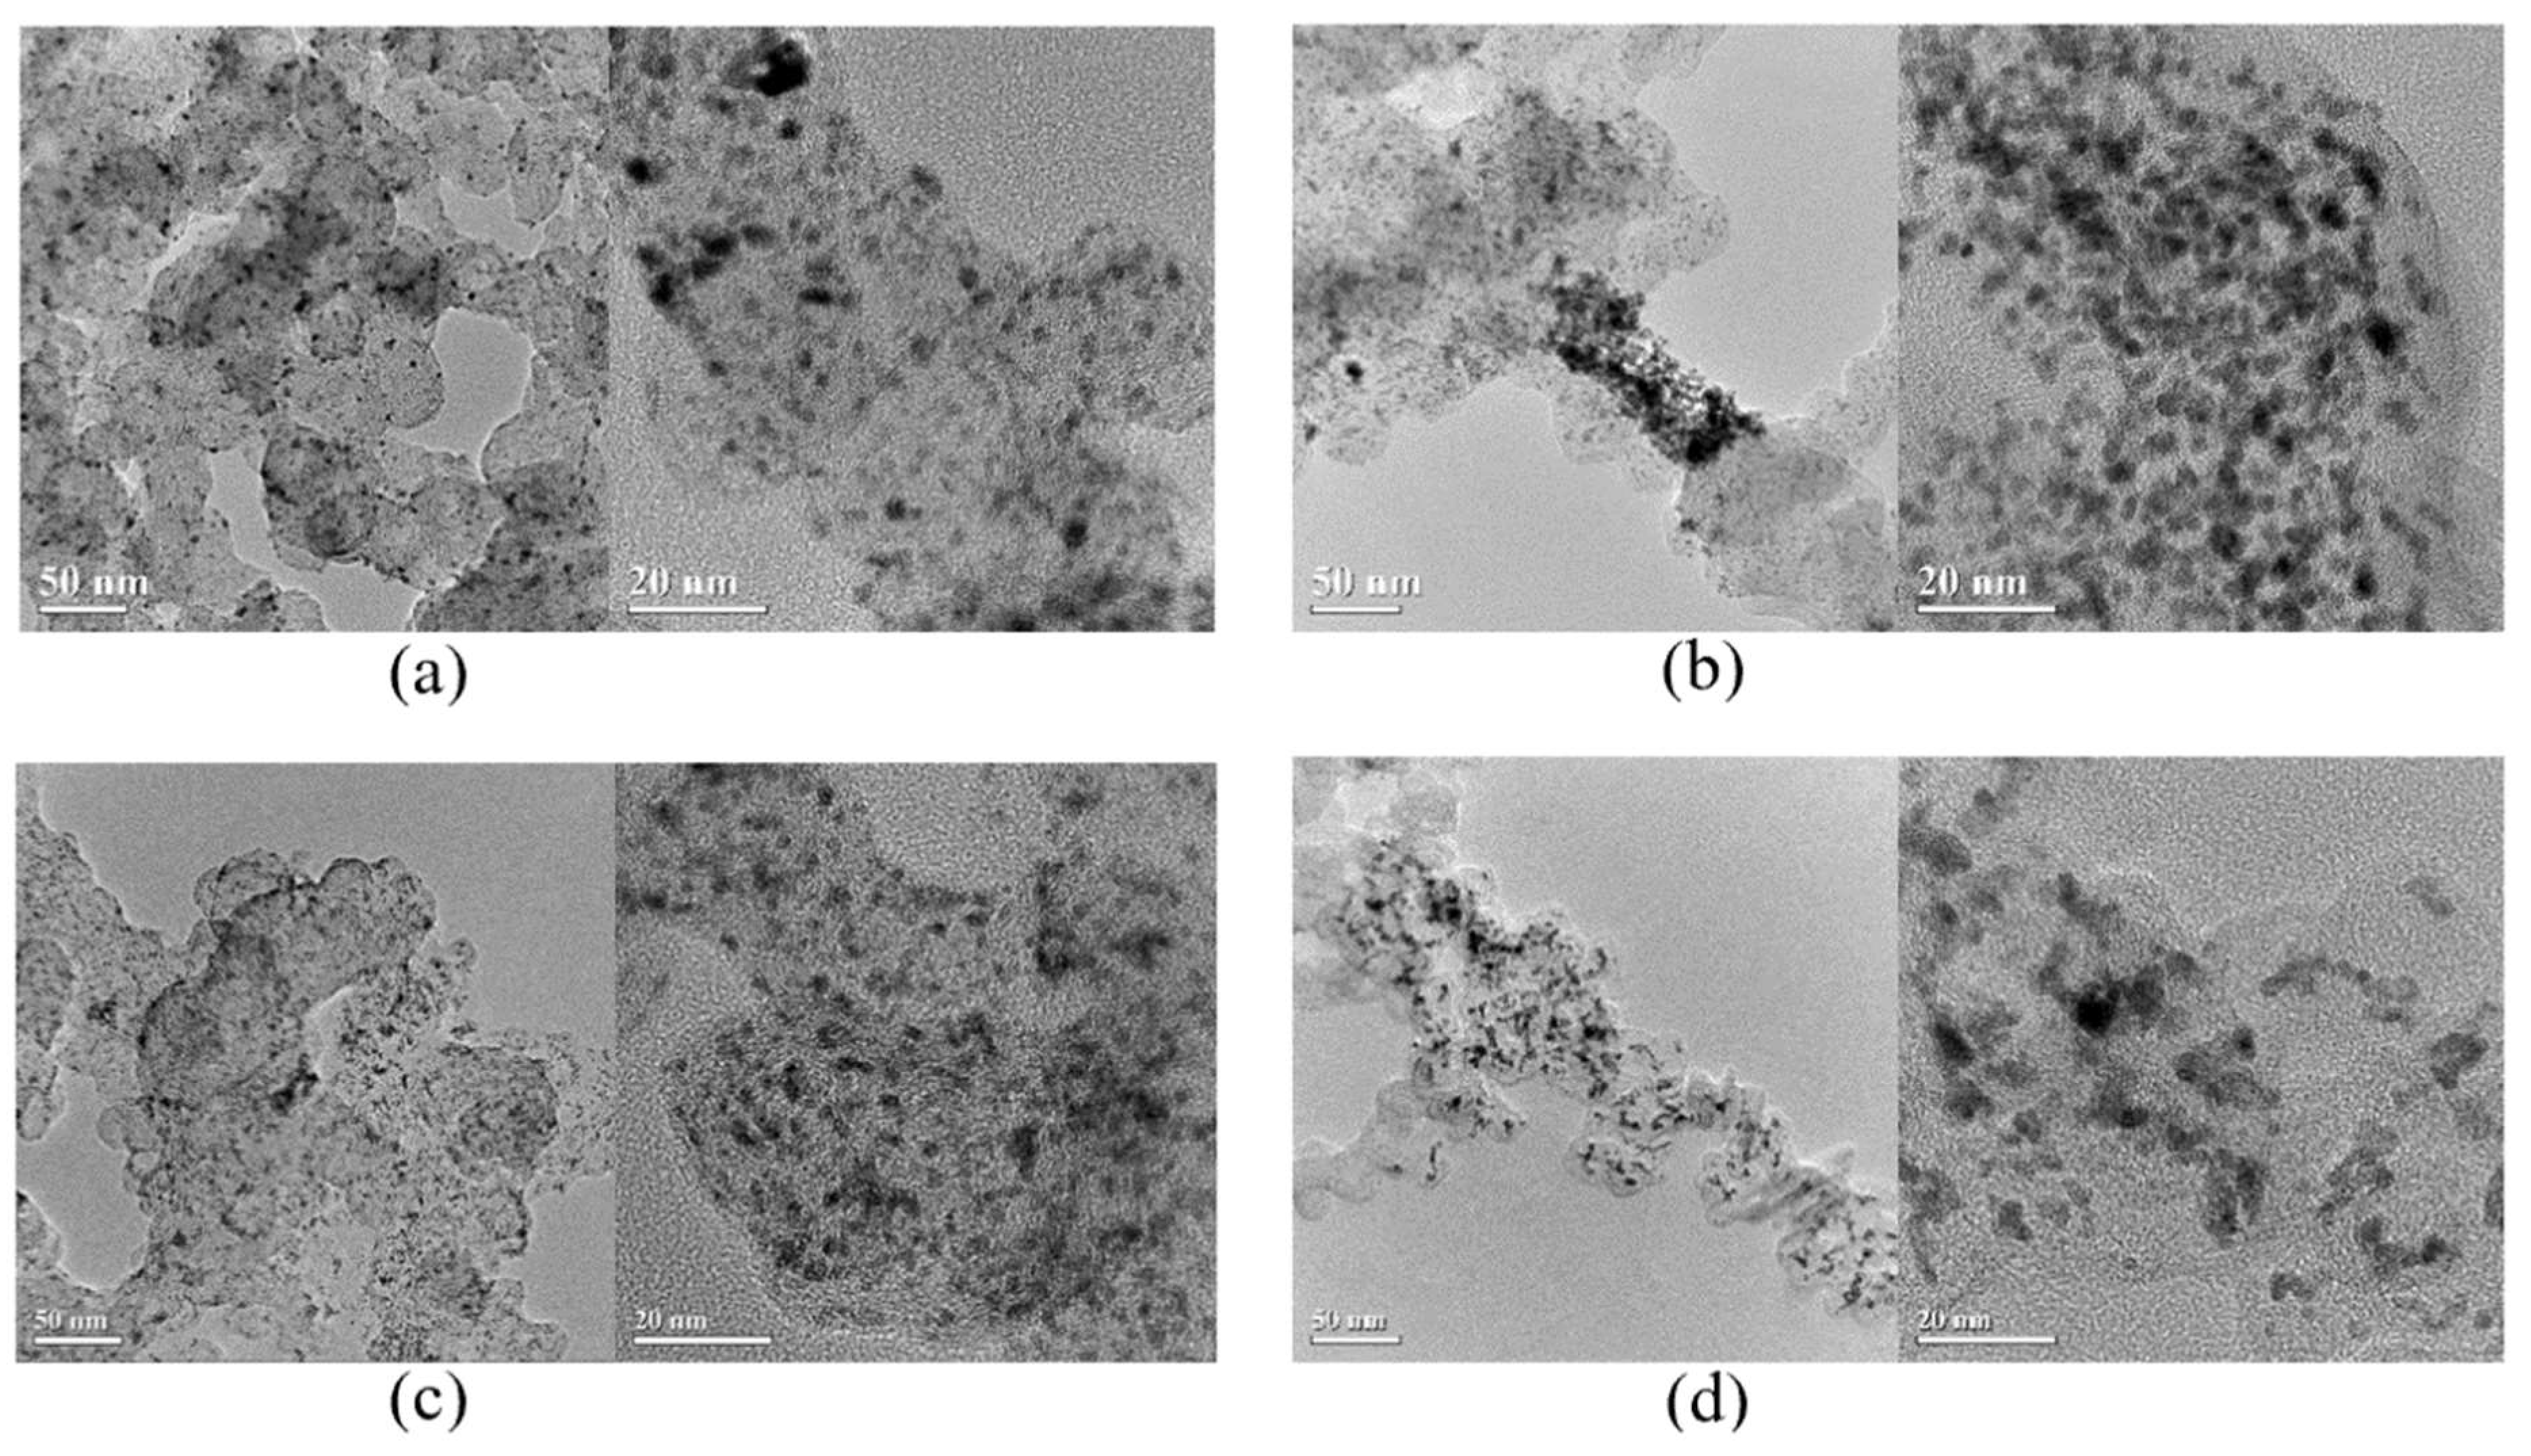
Some samples were reduced by various amounts of NaH2PO2 and resulted in various amounts of P in the sample [19]. Table 3 and Figure 5 show that the metal particle size decreased with increasing phosphorus content in the reducing agent. However, when the P/Pt atomic ratio was 2, the metal particle size increased. When the P/Pt atomic ratio was less than 1, phosphorus content was not high enough to suppress metal growth. Figure 6a shows that as the phosphorus content increased, the number of big particles decreased, and the number of small particles increased. When the P/Pt ratio was 1.2, it had the smallest metal particles among all samples. Figure 6d shows that the sample with a P/Pt ratio of 1.2 had a very uniform particle size distribution.
3.2.4. TGA and XRF
One can obtain the metal loadings of PtRu on the carbon black from TGA. The weight loss between 0 and 200 °C was due to the adsorbed moisture on the sample. The weight loss between 200 and 500 °C was due to the oxidation of metal salts. The final product of TGA was analyzed by XRD. The XRD patterns show that the peaks did not shift compared to those of Pt/carbon black. This confirms that Pt was in a metallic state on the surface of carbon black, and Ru particles were small.
The metal Pt and Ru metal loadings from TGA and XRF analysis are listed in Table 4. The overall real metal loadings are close to the nominal loadings.
3.2.5. XPS
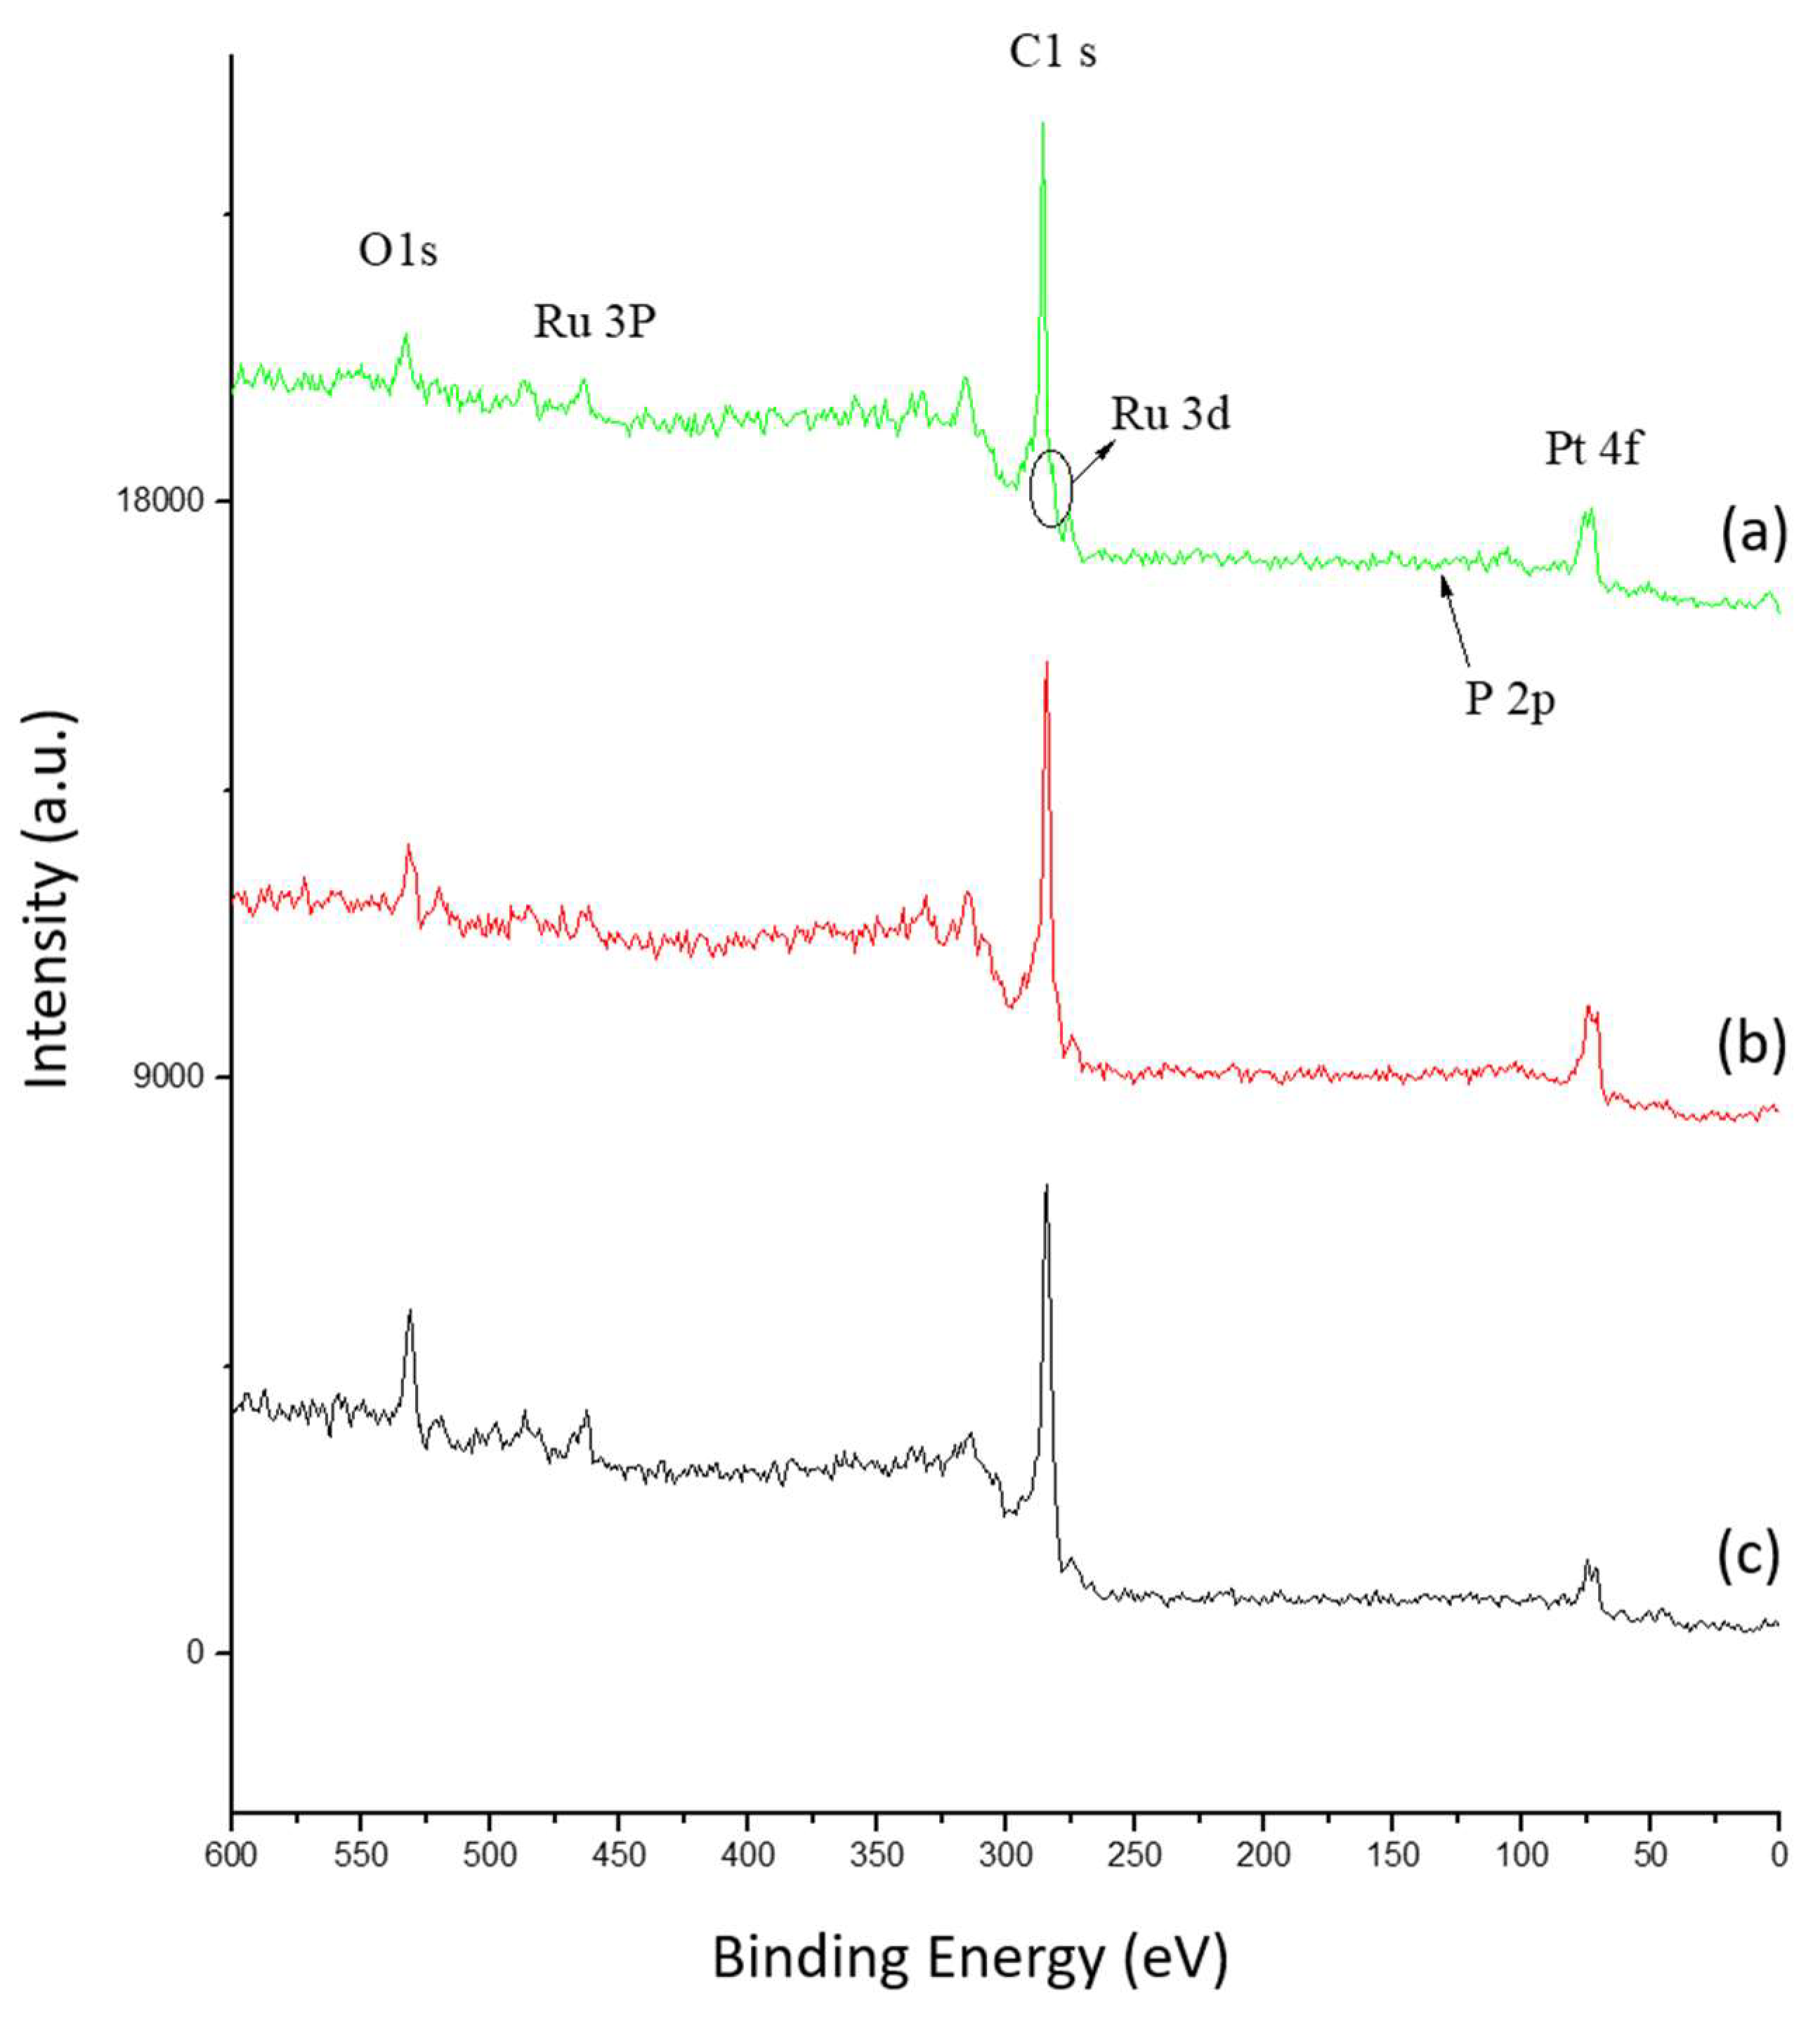
XPS was used to analyze the surface compositions and electronic states of the samples [19,20,21,23]. The XPS spectra of the samples are shown in Figure 7.
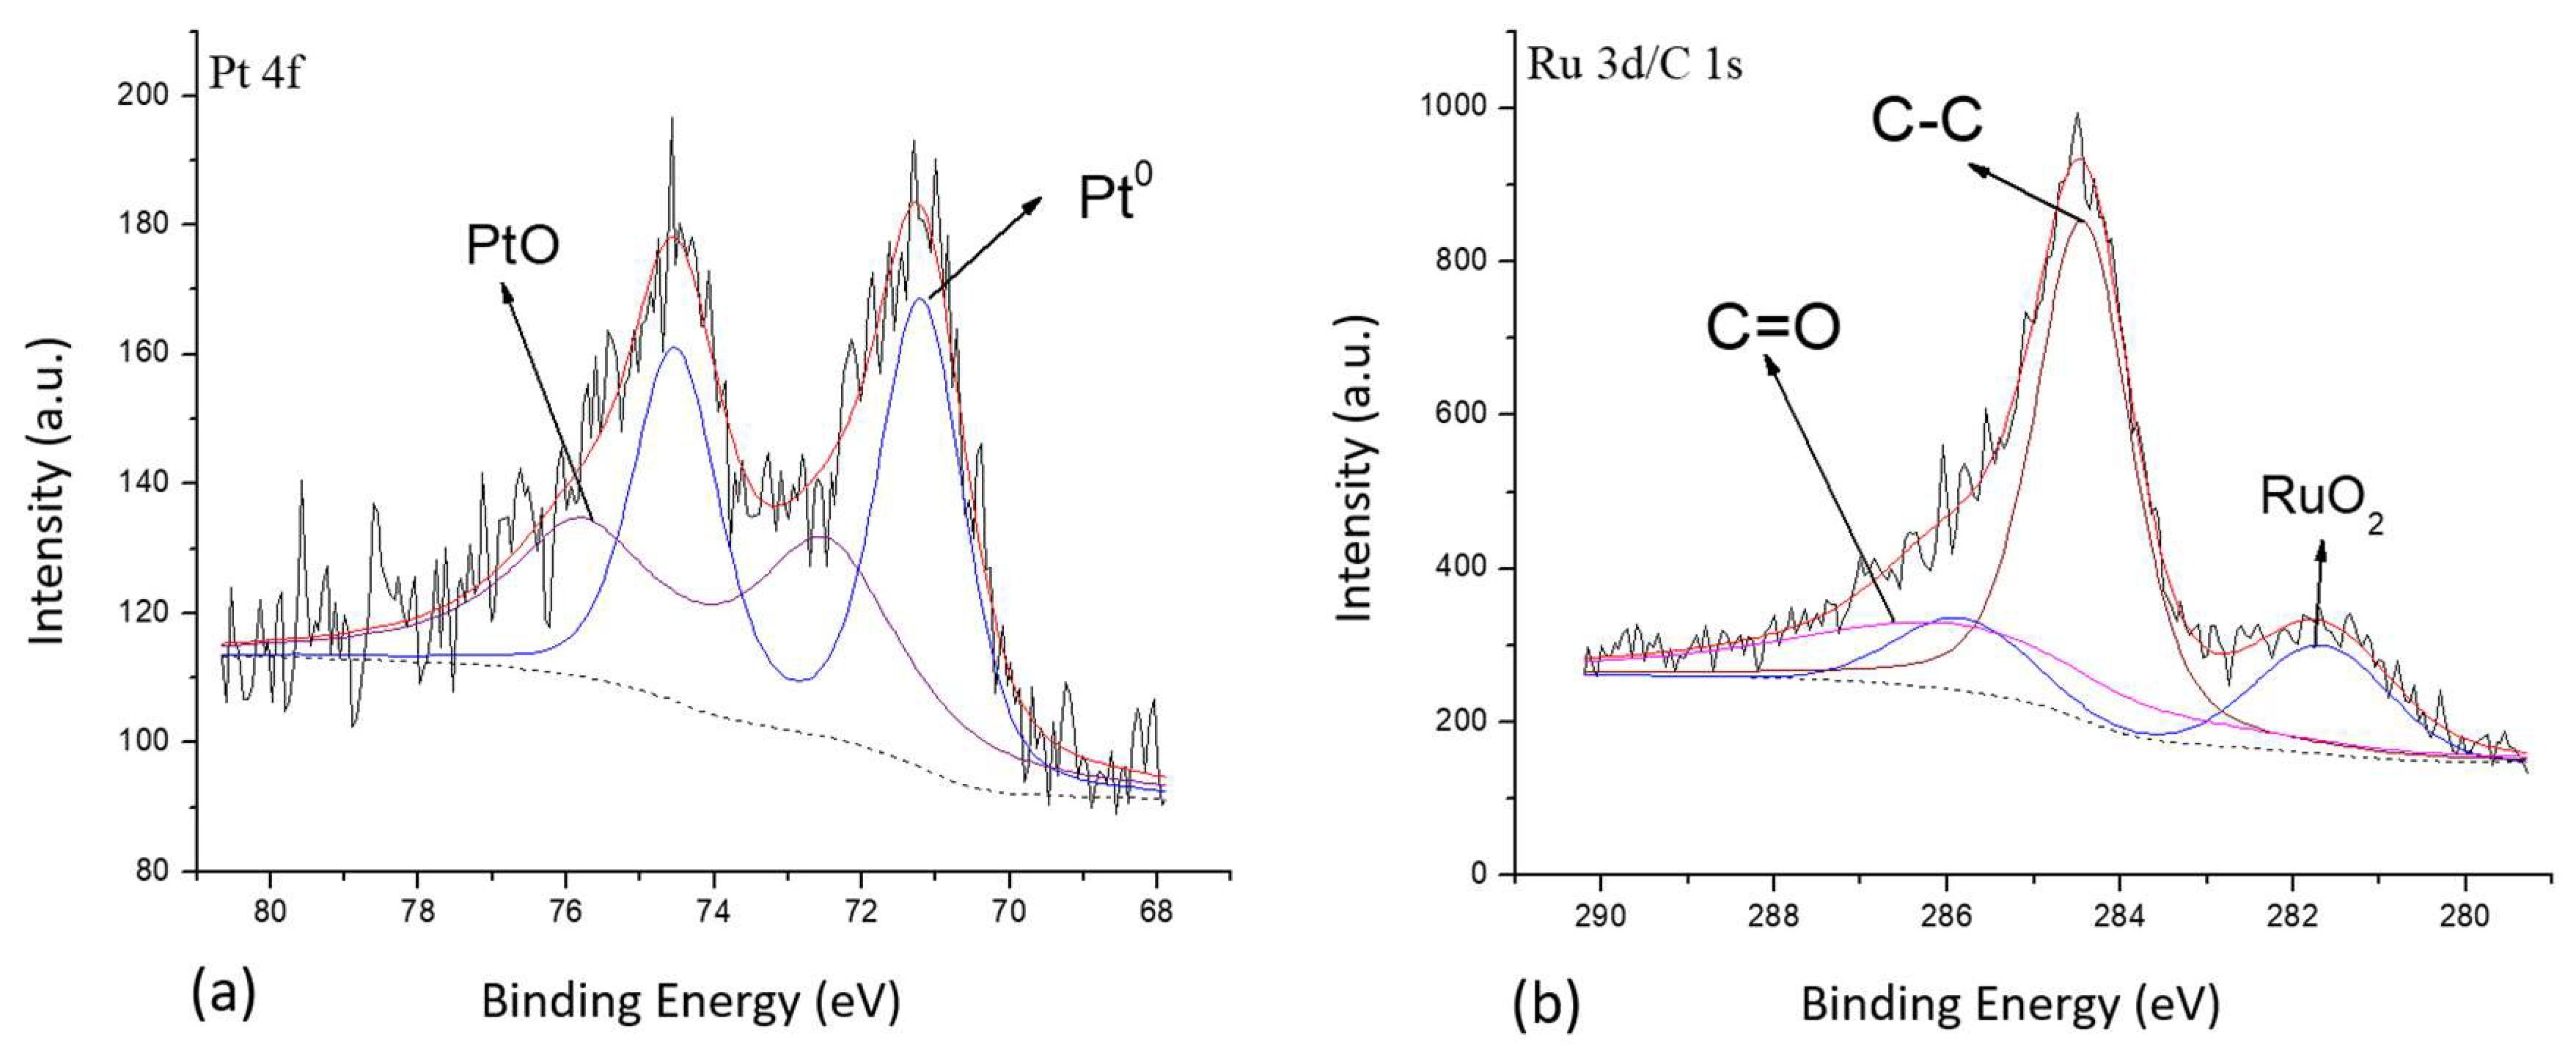
Table 5 lists the compositions of three samples with various phosphorus contents. PtRuP/carbon (0.6) had a Pt:Ru:P ratio of 1:1:0.6; PtRuP/carbon (1.2) had a ratio of 1:1:1.2; and PtRuP/carbon (2) had a ratio of 1:1:2. Figure 8 shows that the Pt 4f peak of the PtRuP/carbon (1.2) sample was higher than those of PtRuP/carbon (0.6) and PtRuP/carbon (2), indicating that this PtRuP/carbon (1.2) sample had a high content of Pt. The PtRuP/carbon (0.6) sample had the lowest peak area of Pt 4f among all the samples, indicating that it had the lowest Pt content. The peak area of O 1s of the PtRuP/carbon (0.6) sample was the highest among the three samples, and it had the highest oxygen content. All three samples did not have the peak of P 2p, inferring that the P content was very small.
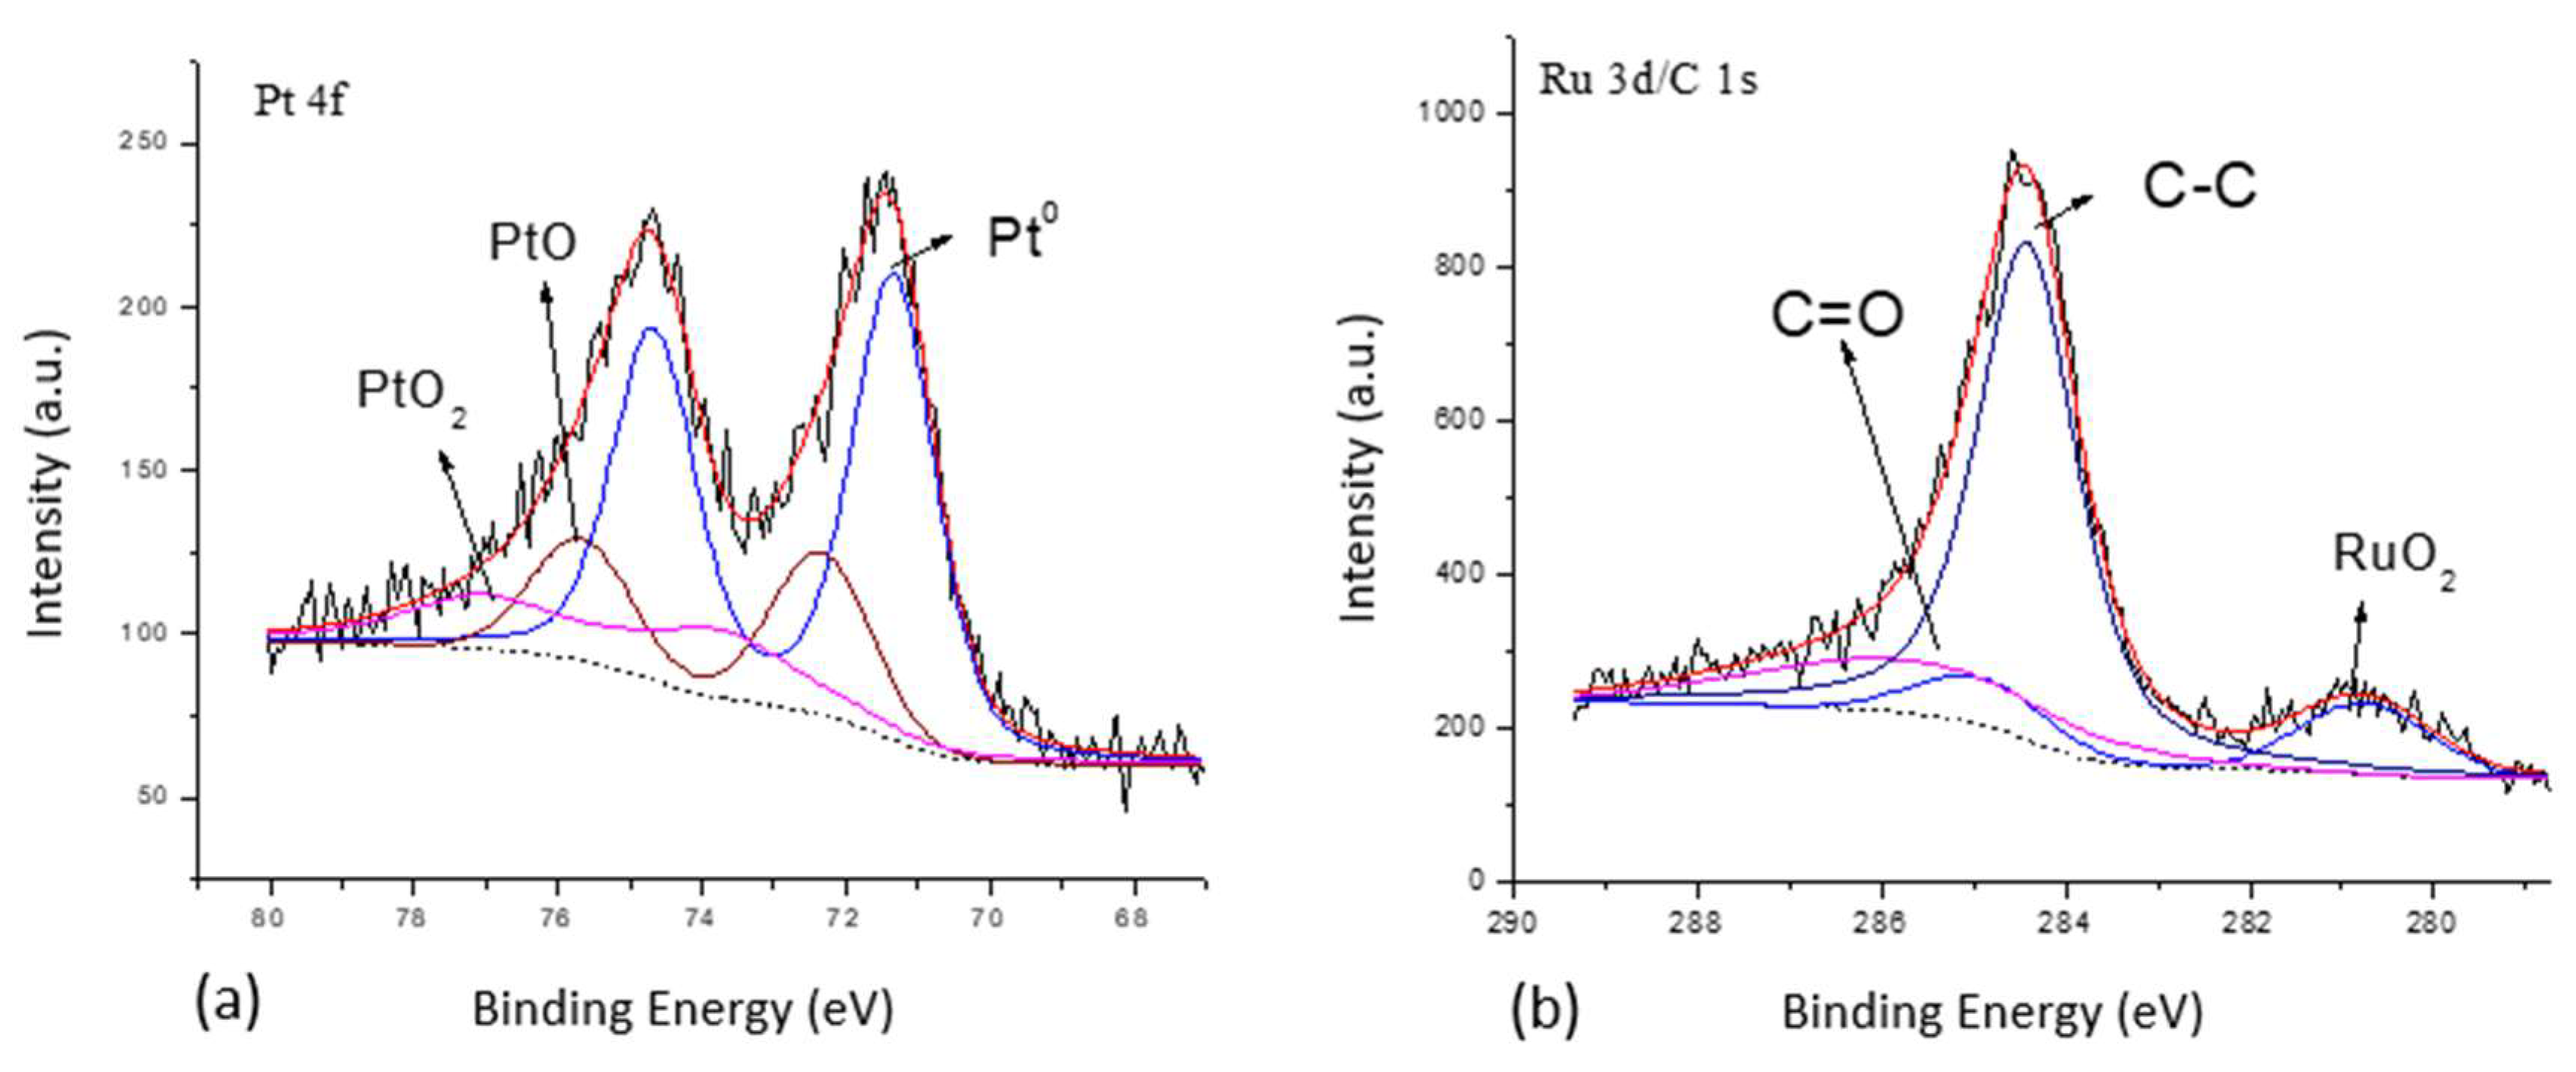
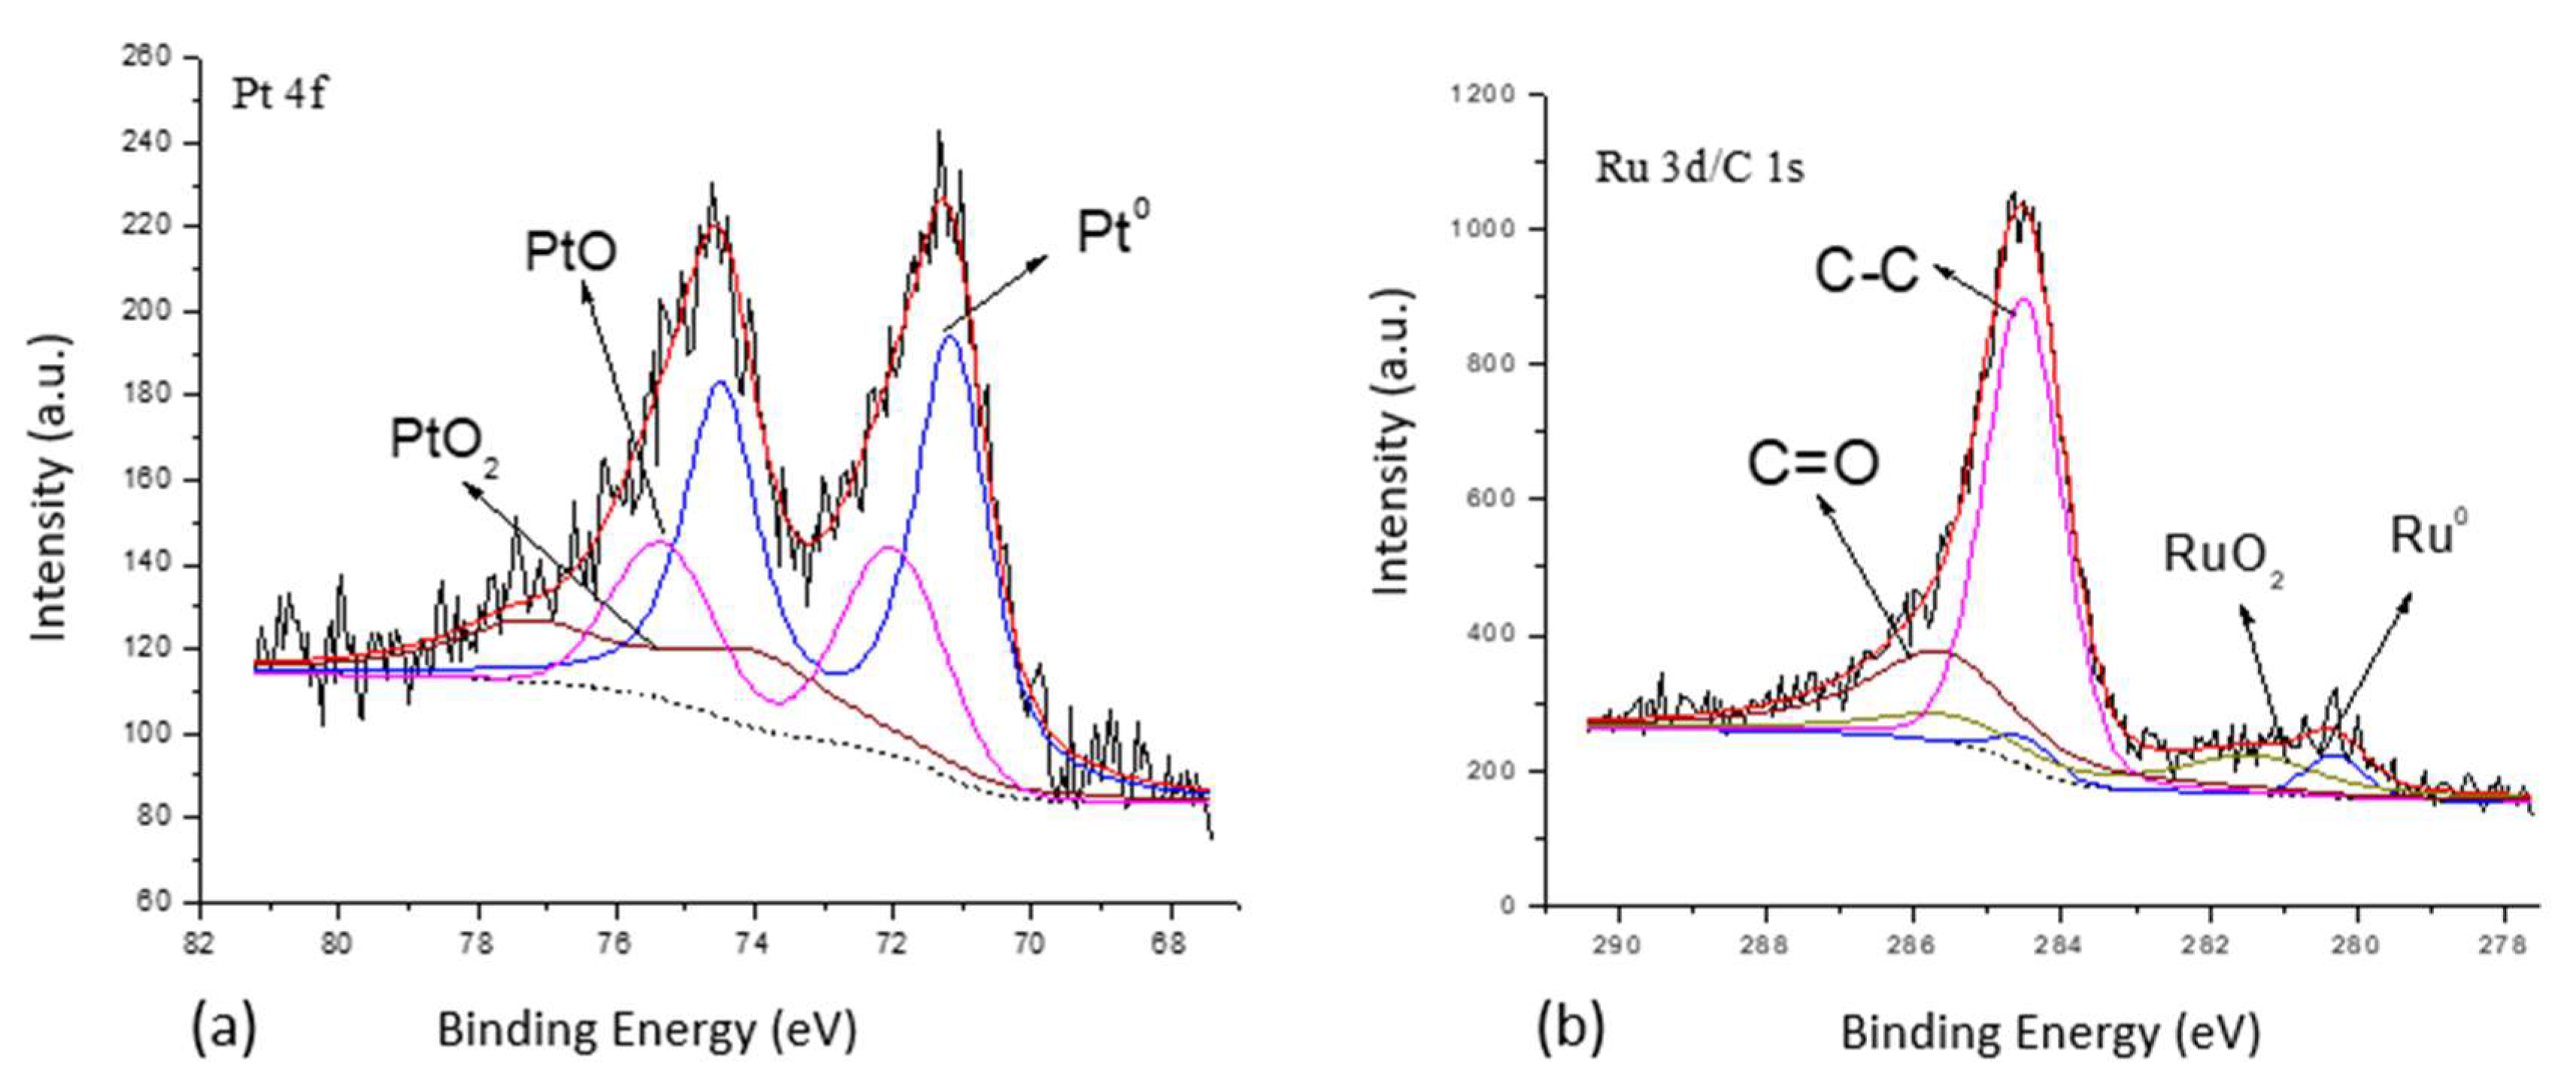
In the literature [19], it shows that Pt-Ru-P had interactions among the three elements, and the binding energy of Pt 4f became higher. The theoretical value of binding energy of Pt 4f is 71.1 [20,21,22,23,24]. The binding energy of Pt 4f7/2 at 71.2 eV was assigned to Pt0, that at ~72.5 eV was assigned to PtO, and the peak at ~73.8 was attributed to PtO2. The binding energy of Pt 4f7/2 in the PtRuP/carbon (0.6) sample was 71.2 eV (Figure 8), PtRuP/carbon (1.2) was 71.3 eV (Figure 9), and PtRuP/carbon (2) was 71.2 eV (Figure 10). The Pt 4f7/2 peak of PtRuP/carbon (1.2) (Figure 9) had a high binding energy shift compared to other samples (Figure 8 and Figure 10). The PtRuP/carbon (1.2) sample had the highest amount of Pt0 among all samples, consistently with the results in Table 5.
Since Pt should form an alloy with Ru to prevent poisoning, the electronic state of Ru was investigated. Most researchers have used Ru 3p to examine the electronic state of Ru, because Ru 3d peak is overlapped with C 1s. The Ru 3p peak intensity was weak, and the noise was significant. In this study, Ru 3d5/2 peaks were studied. The peak at 280 eV was assigned to Ru0; and the peak at 281 eV was assigned to RuO2. All peak intensities were divided by ASF (atomic sensitivity factor), and C 1s peak intensity was used as a basis for comparison. The results in Table 5 show that the PtRuP/carbon (0.6) sample had the least amount of Pt0 among all samples, PtRuP/carbon (2) had the second least, and PtRuP/carbon (1.2) sample had the highest amount of Pt0. The PtRuP/carbon (1.2) sample also had the highest amount of Pt-RuO2 on the surface among all samples. It contained 1.57% Pt and 1.33% RuO2.
3.2.6. EXAFS
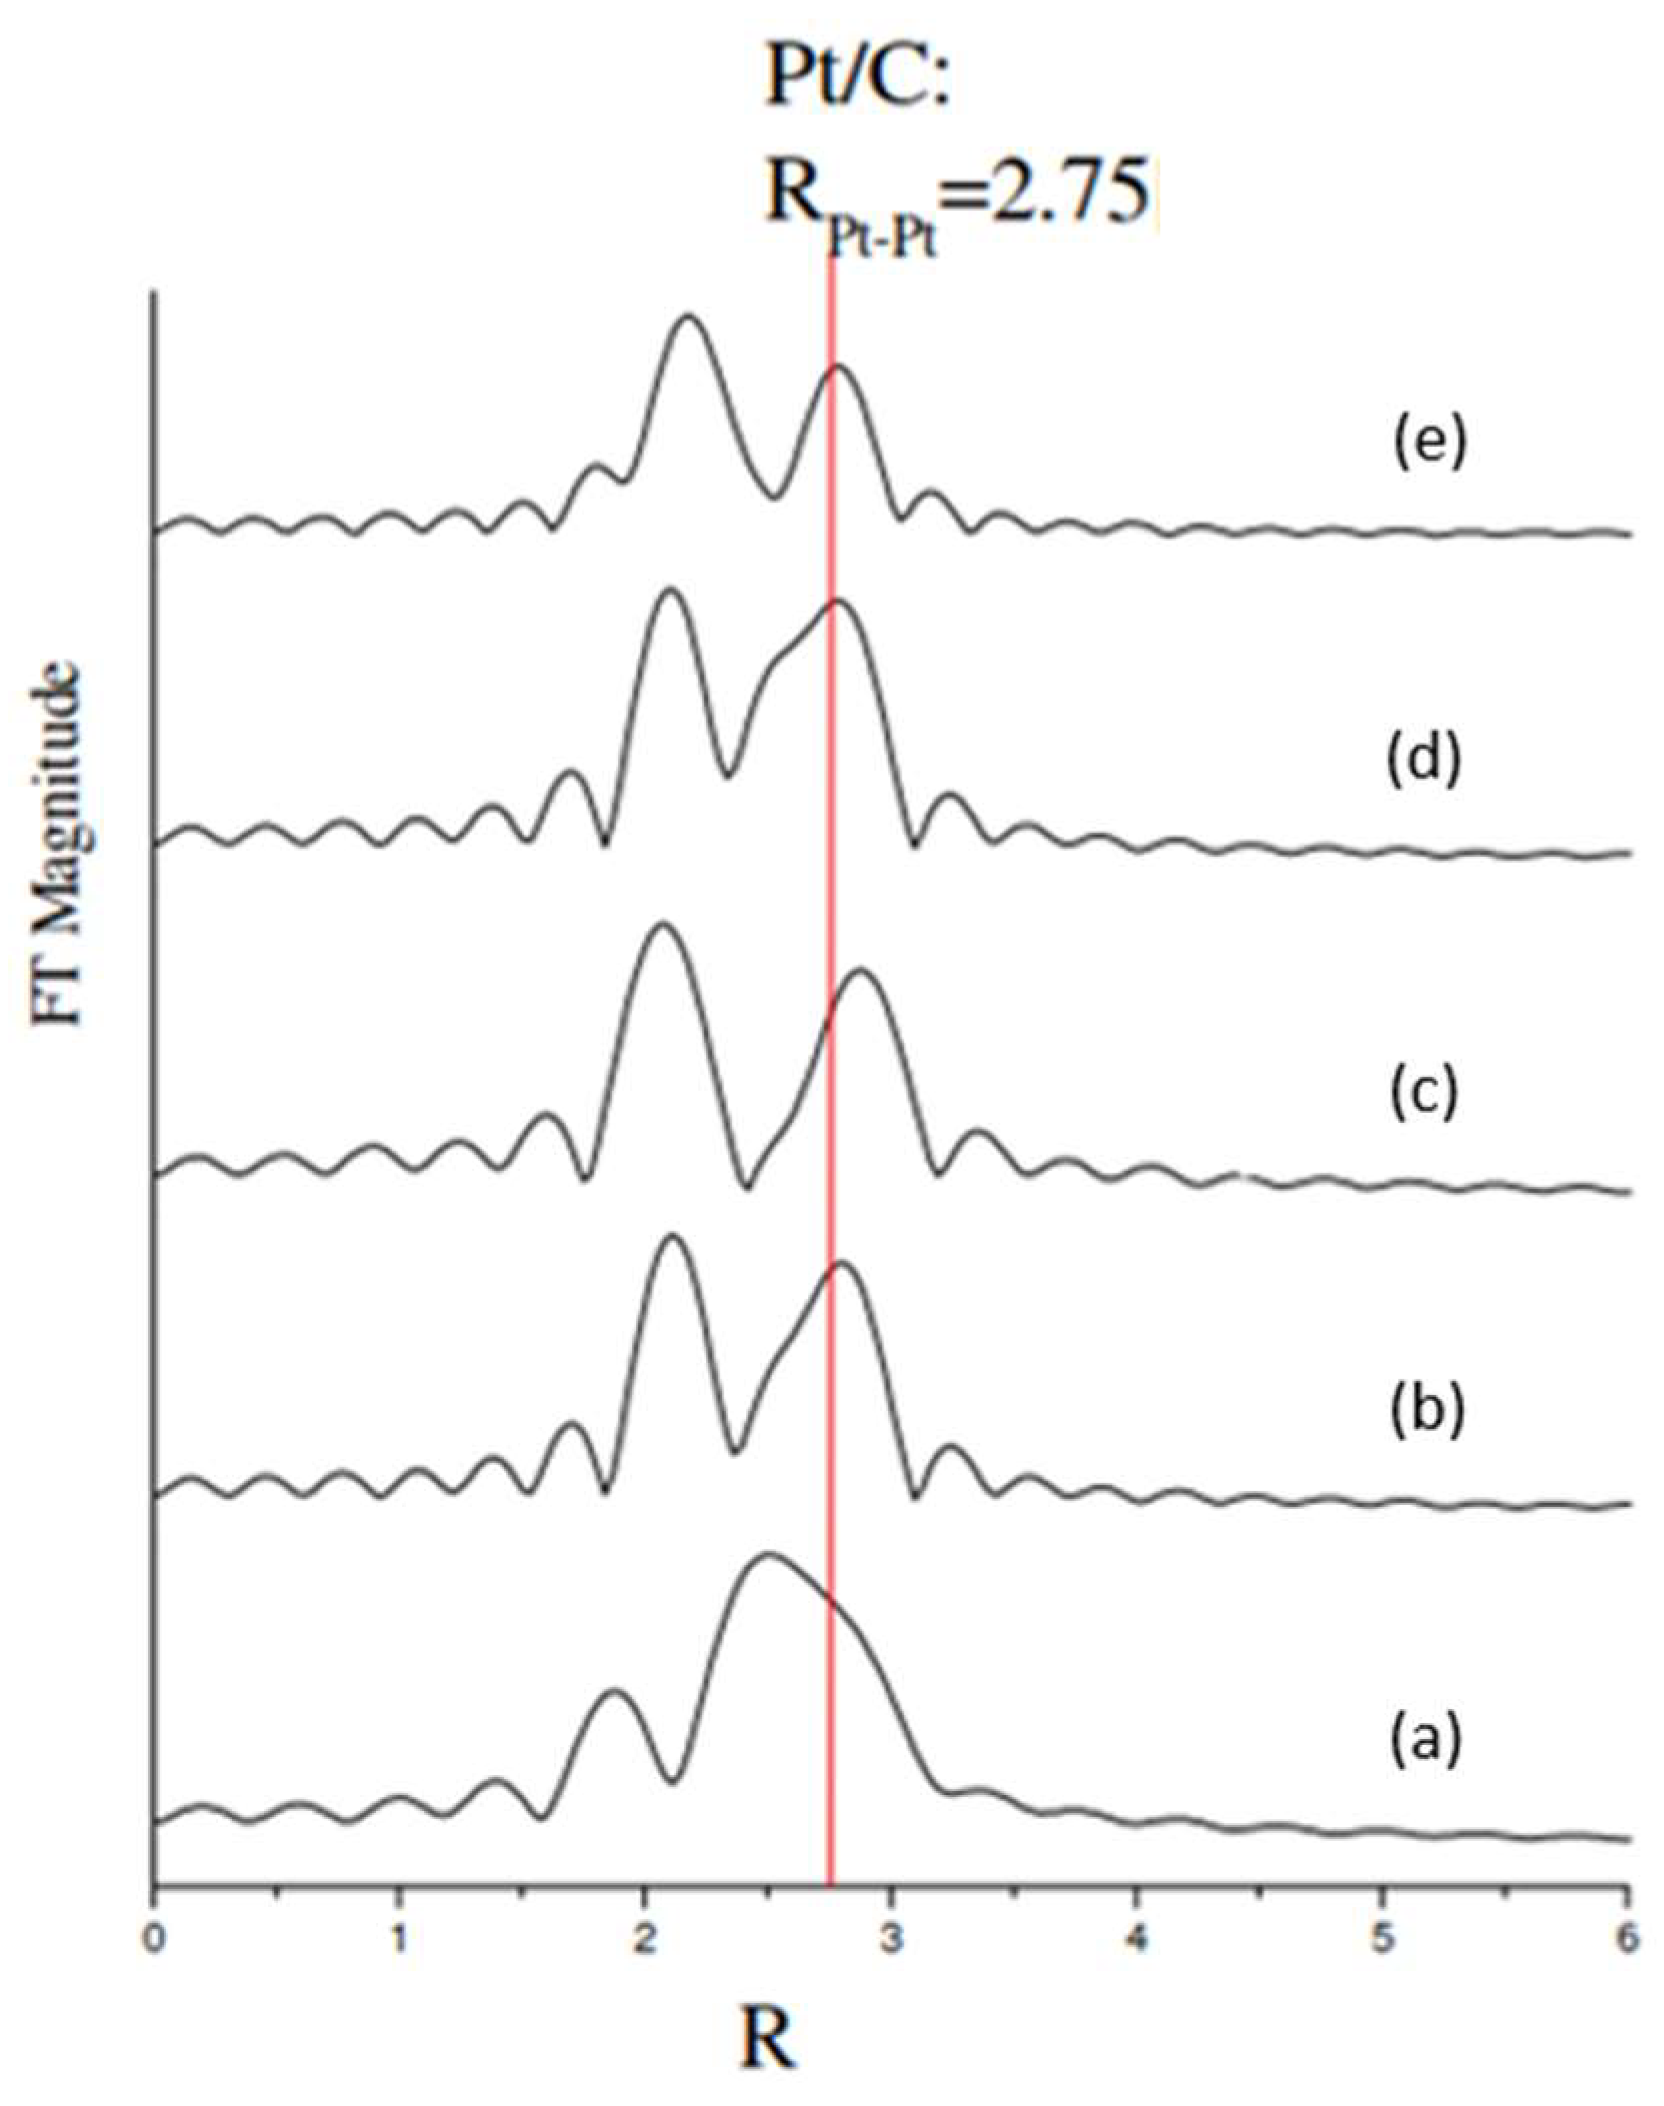
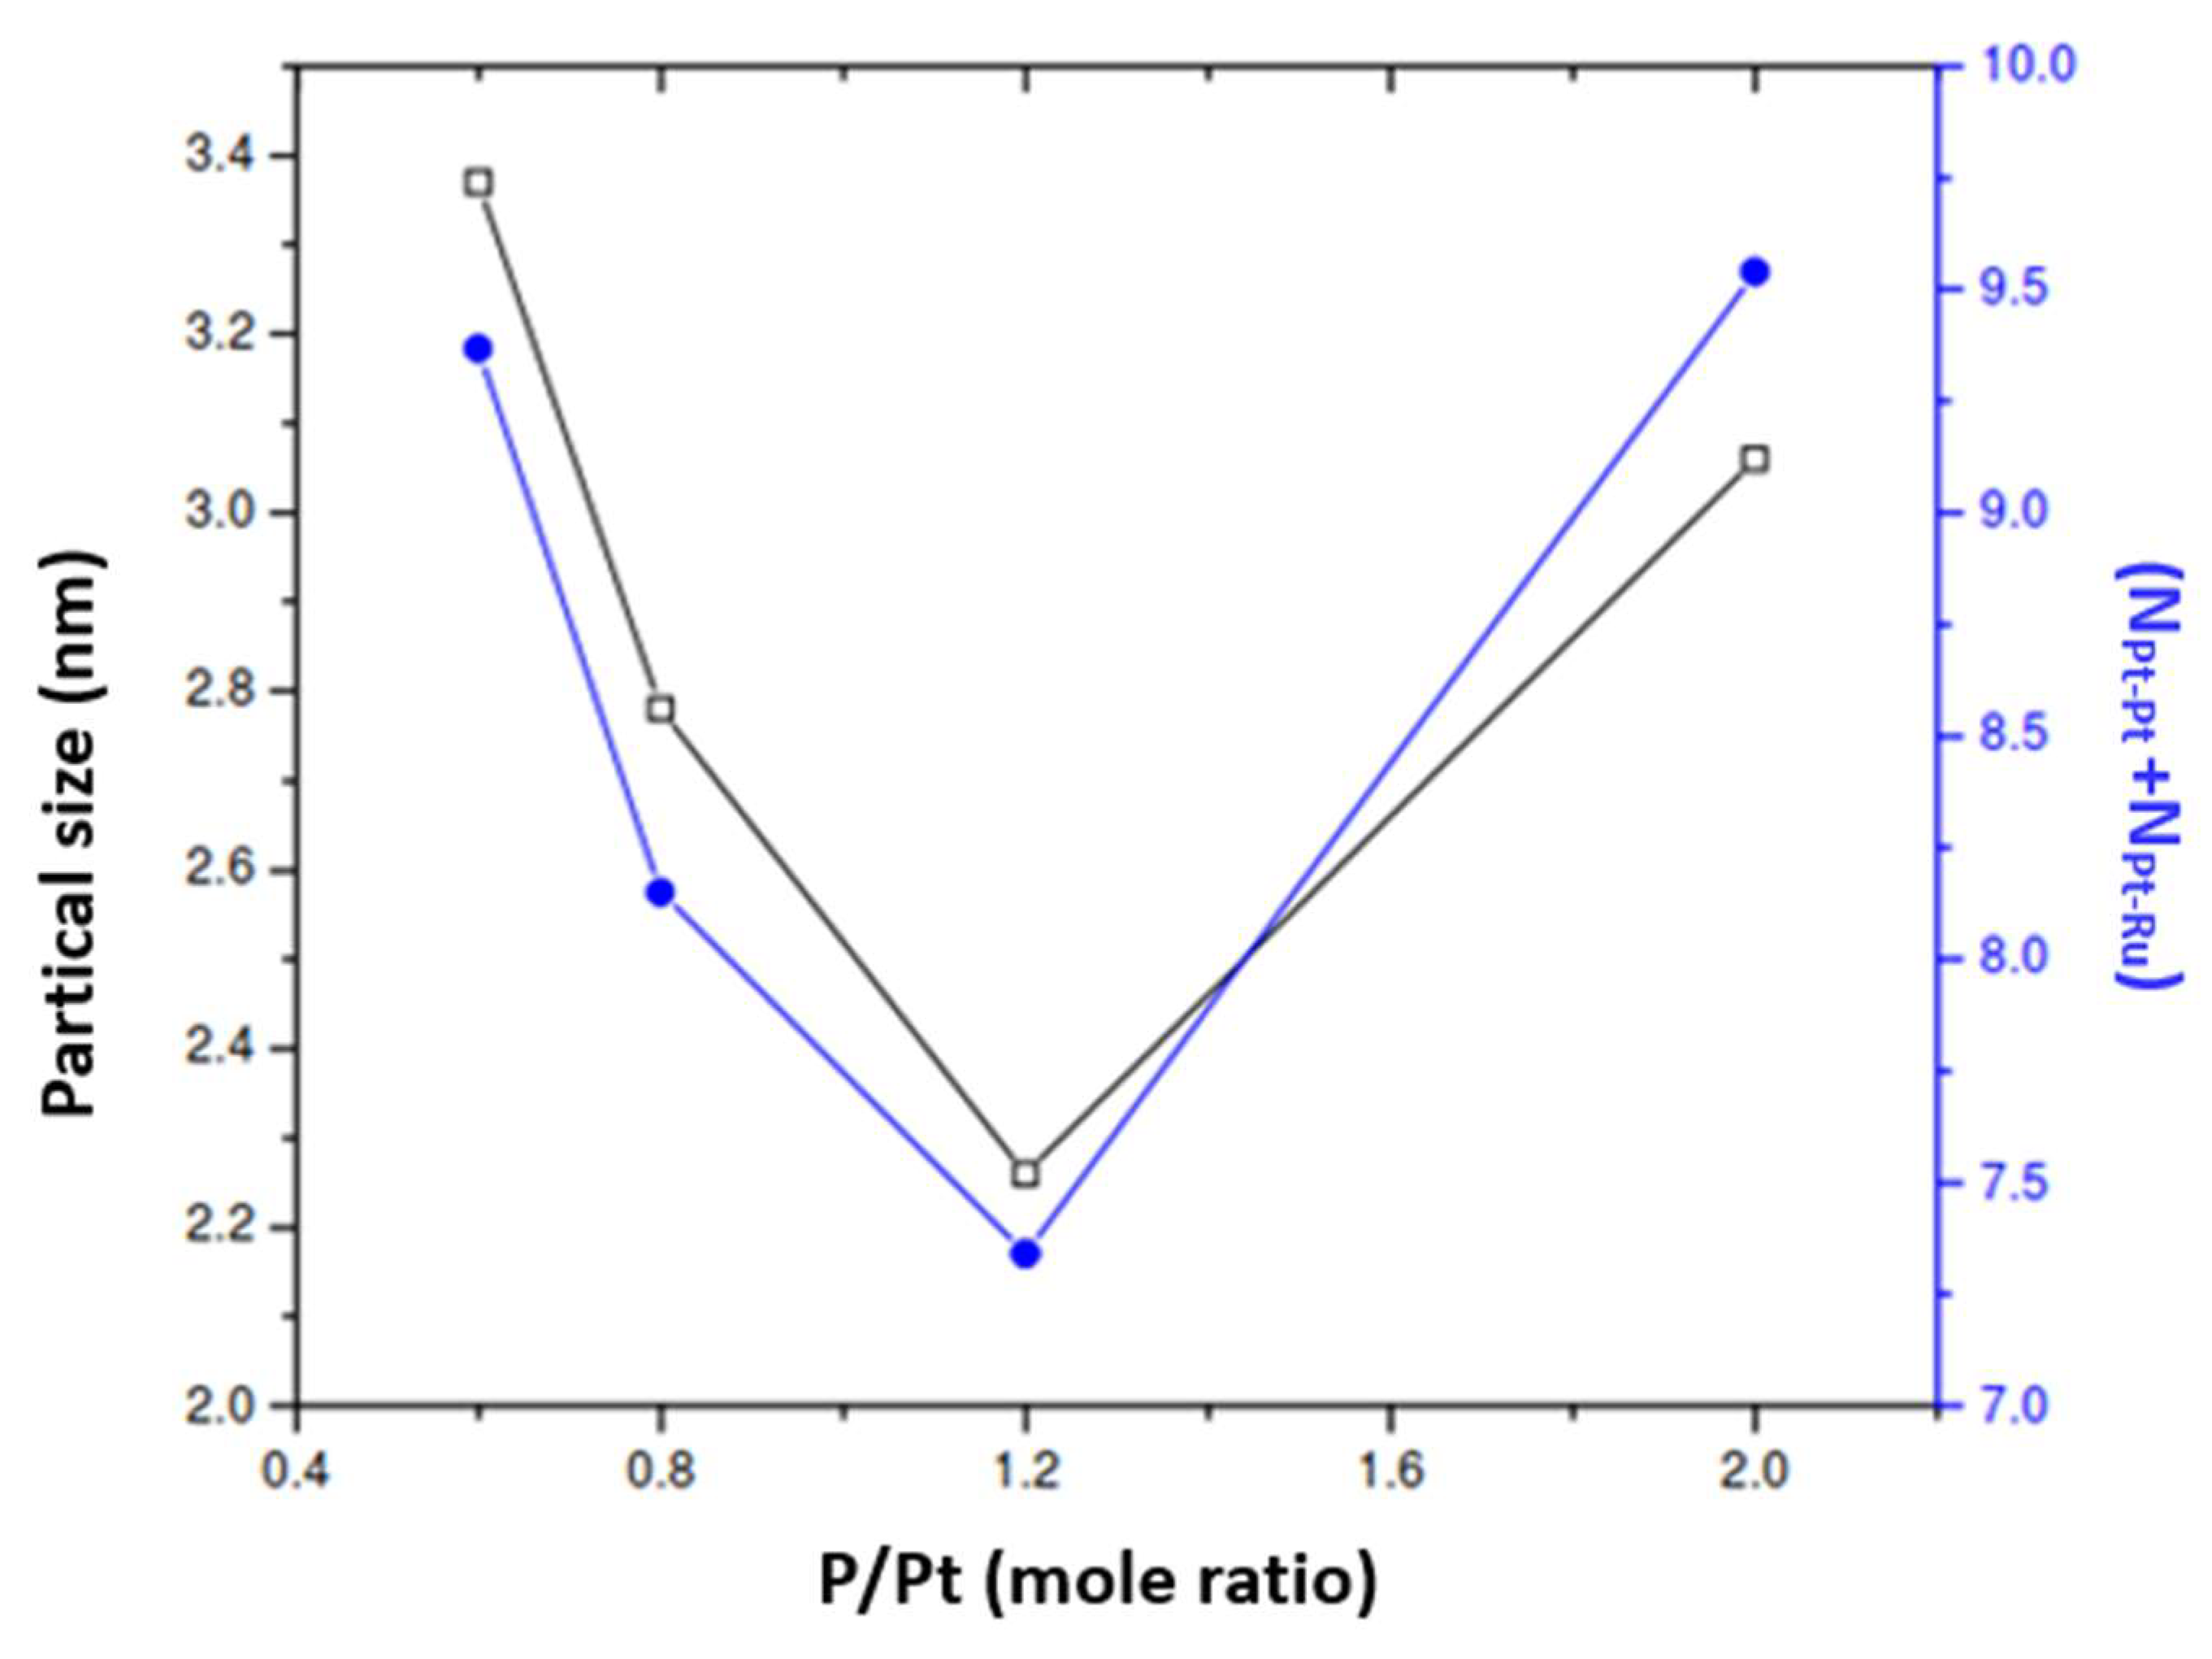
EXAFS was used to determine the state of Pt in alloy catalysts [25,26]. Table 6 summarizes the coordination numbers of Pt of the 60 wt.% PtRu-P/carbon black catalysts. N denotes the coordination number of Pt, and D is the metal particle size obtained from the TEM image. ΔE0 is the difference between experimental and theoretical values of bonding energy. Δσj2 is the error of the thermal vibration of atoms. Figure 11 shows the Pt LIII edge k3 of 60 wt.% PtRu-P/carbon black with various phosphorus content. It shows that all samples had a larger Pt-Pt distance than the theoretical value, which was obtained from the Pt/carbon black sample. This is because the intermixing of Pt and Ru atoms in the samples. It also confirms the formation of the Pt-Ru alloy. Figure 12 shows that the sample with a P/Pt atomic ratio of 1.2 had the smallest metal particle size and the lowest overall coordination number (NPt-Pt + NPt-Ru) among all samples.
3.3. Catalytic Activity of the PtRu Catalysts
Table 7 shows that the sample reduced by NaBH4 was 3.5 nm in size, that reduced by HCHO was 2.7 nm in size, and that reduced by NaH2PO2 was 2.5 nm in size. Their activities had a reverse trend. The activities were 84.95 A/g for the catalyst reduced by NaBH4, 147.71 A/g for that reduced by HCHO, and 309.05 A/g for that reduced by NaH2PO2. In conclusion, the smaller the metal particle size is, the higher the activity is. The catalyst reduced by NaH2PO2 had the smallest particle size and the highest activity among all samples.
3.4. Effects of Phosphorus Content on the Activity
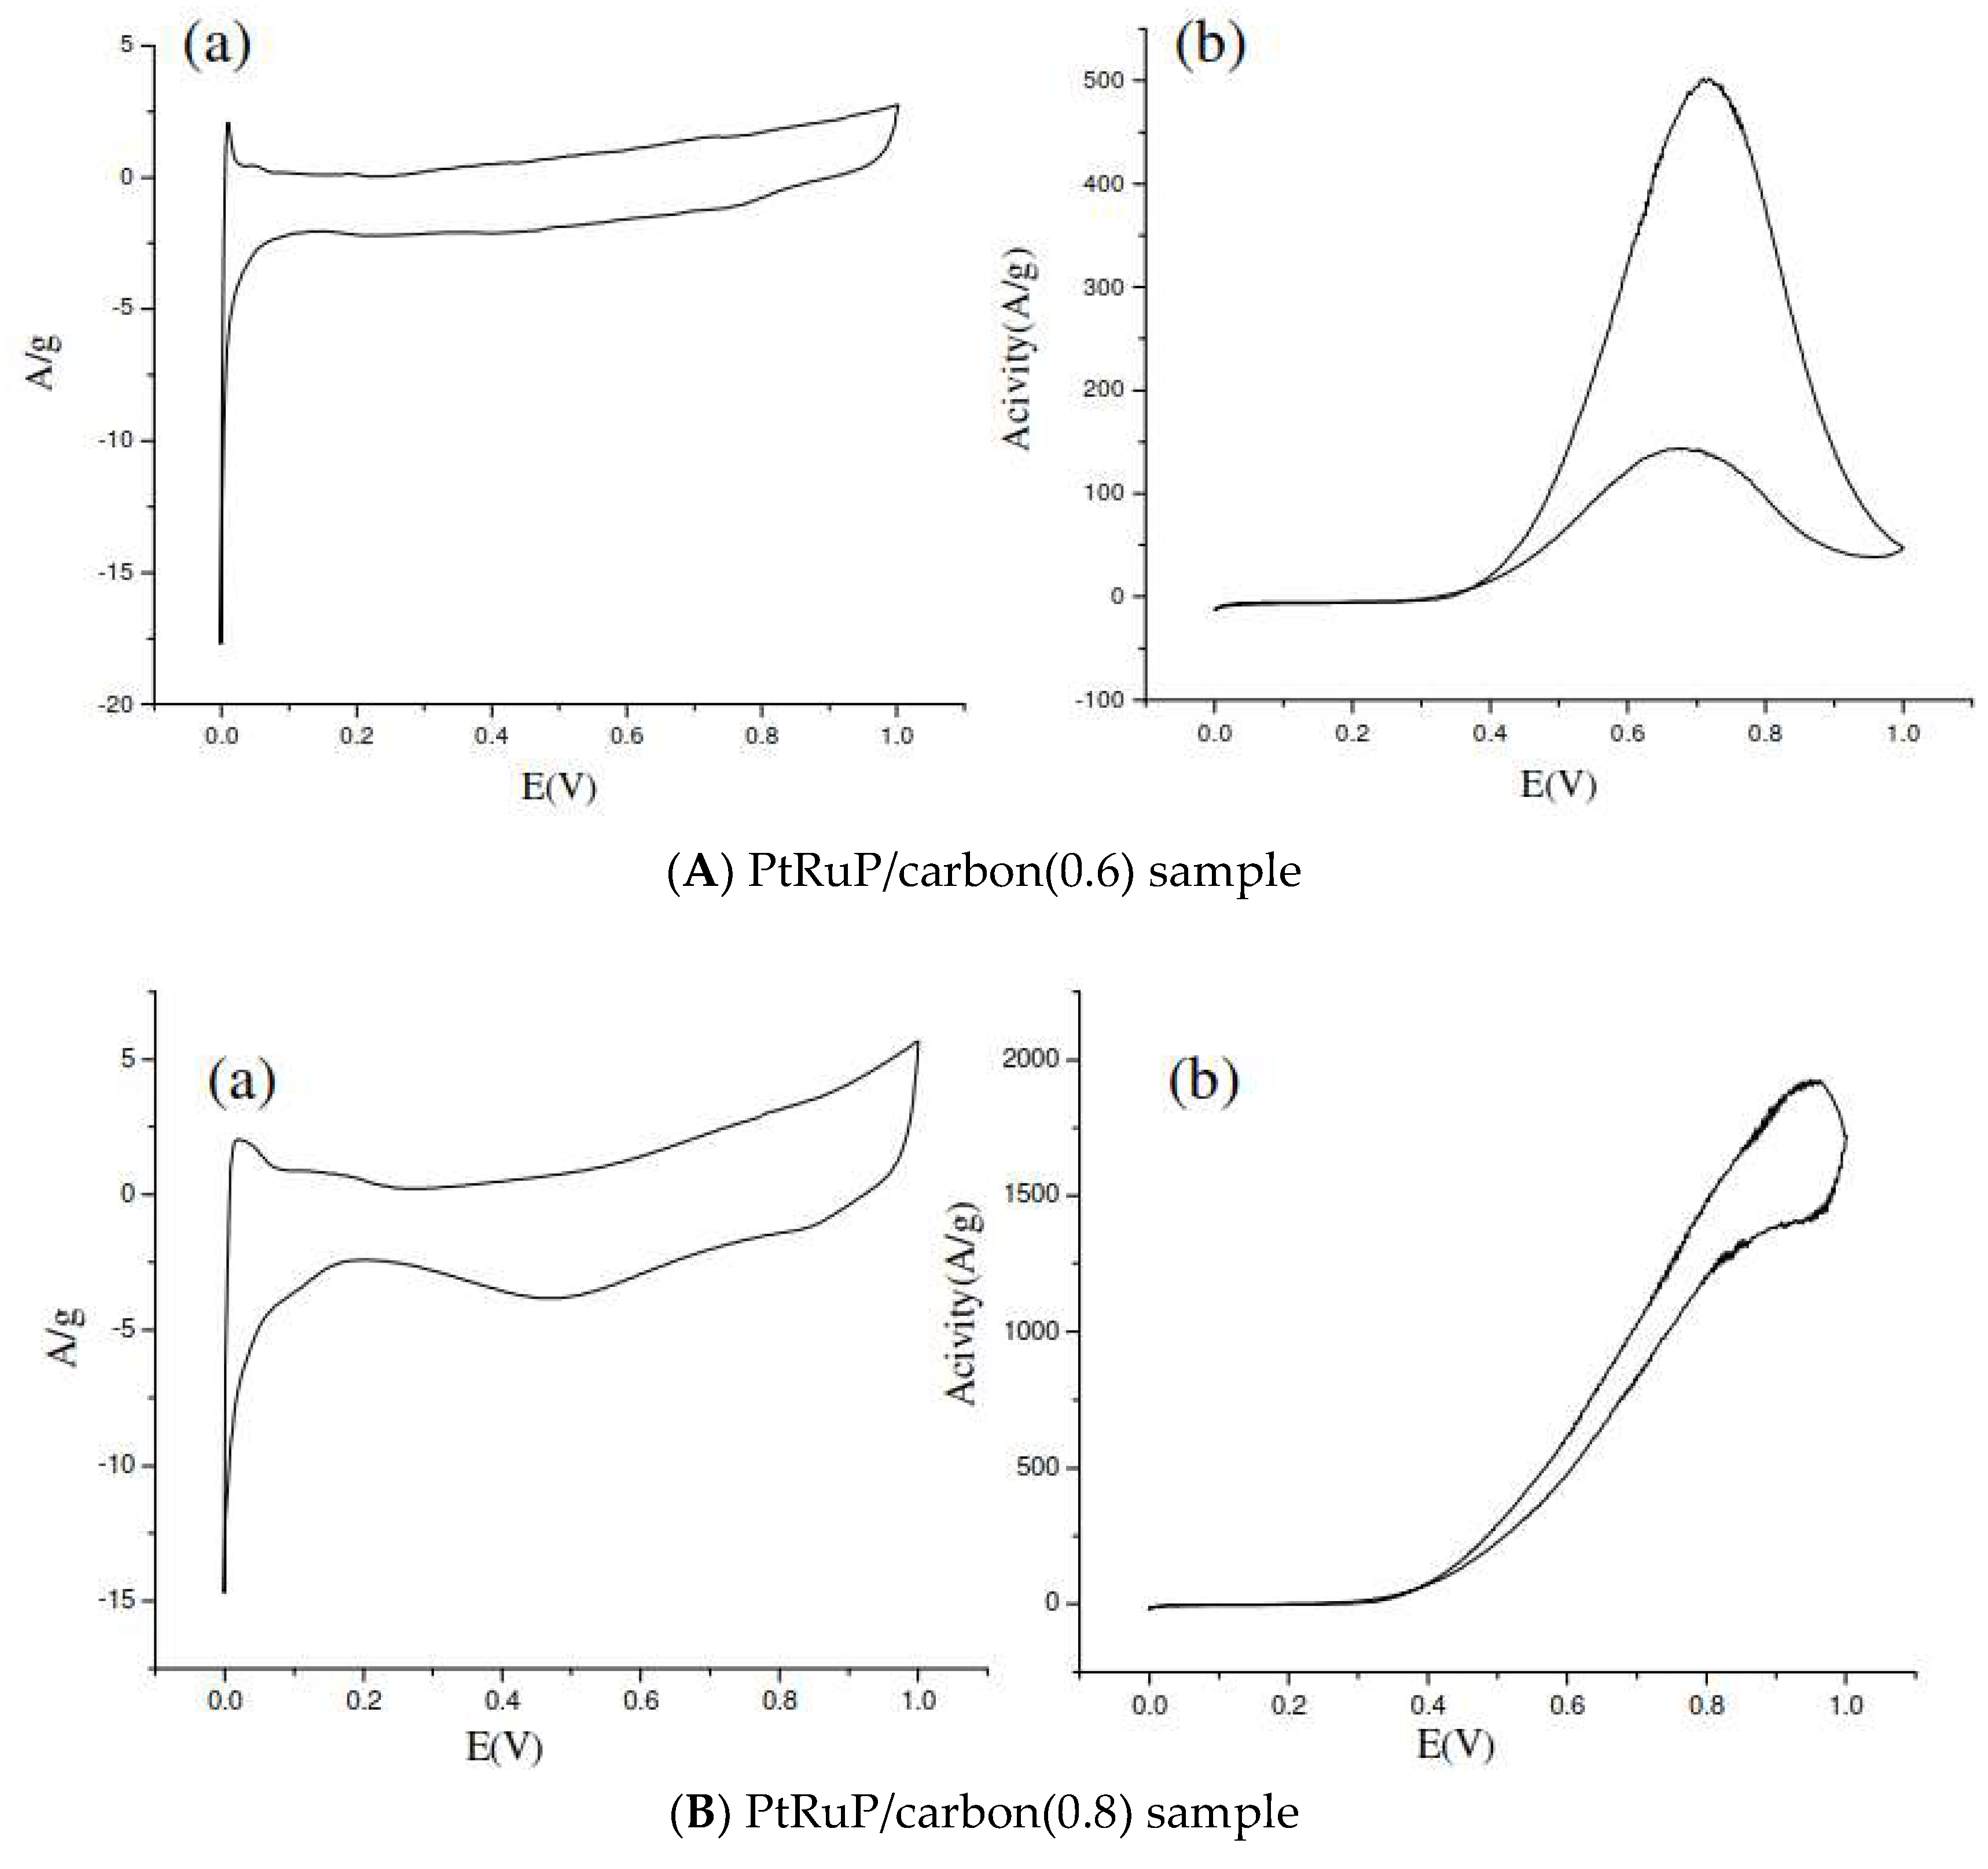
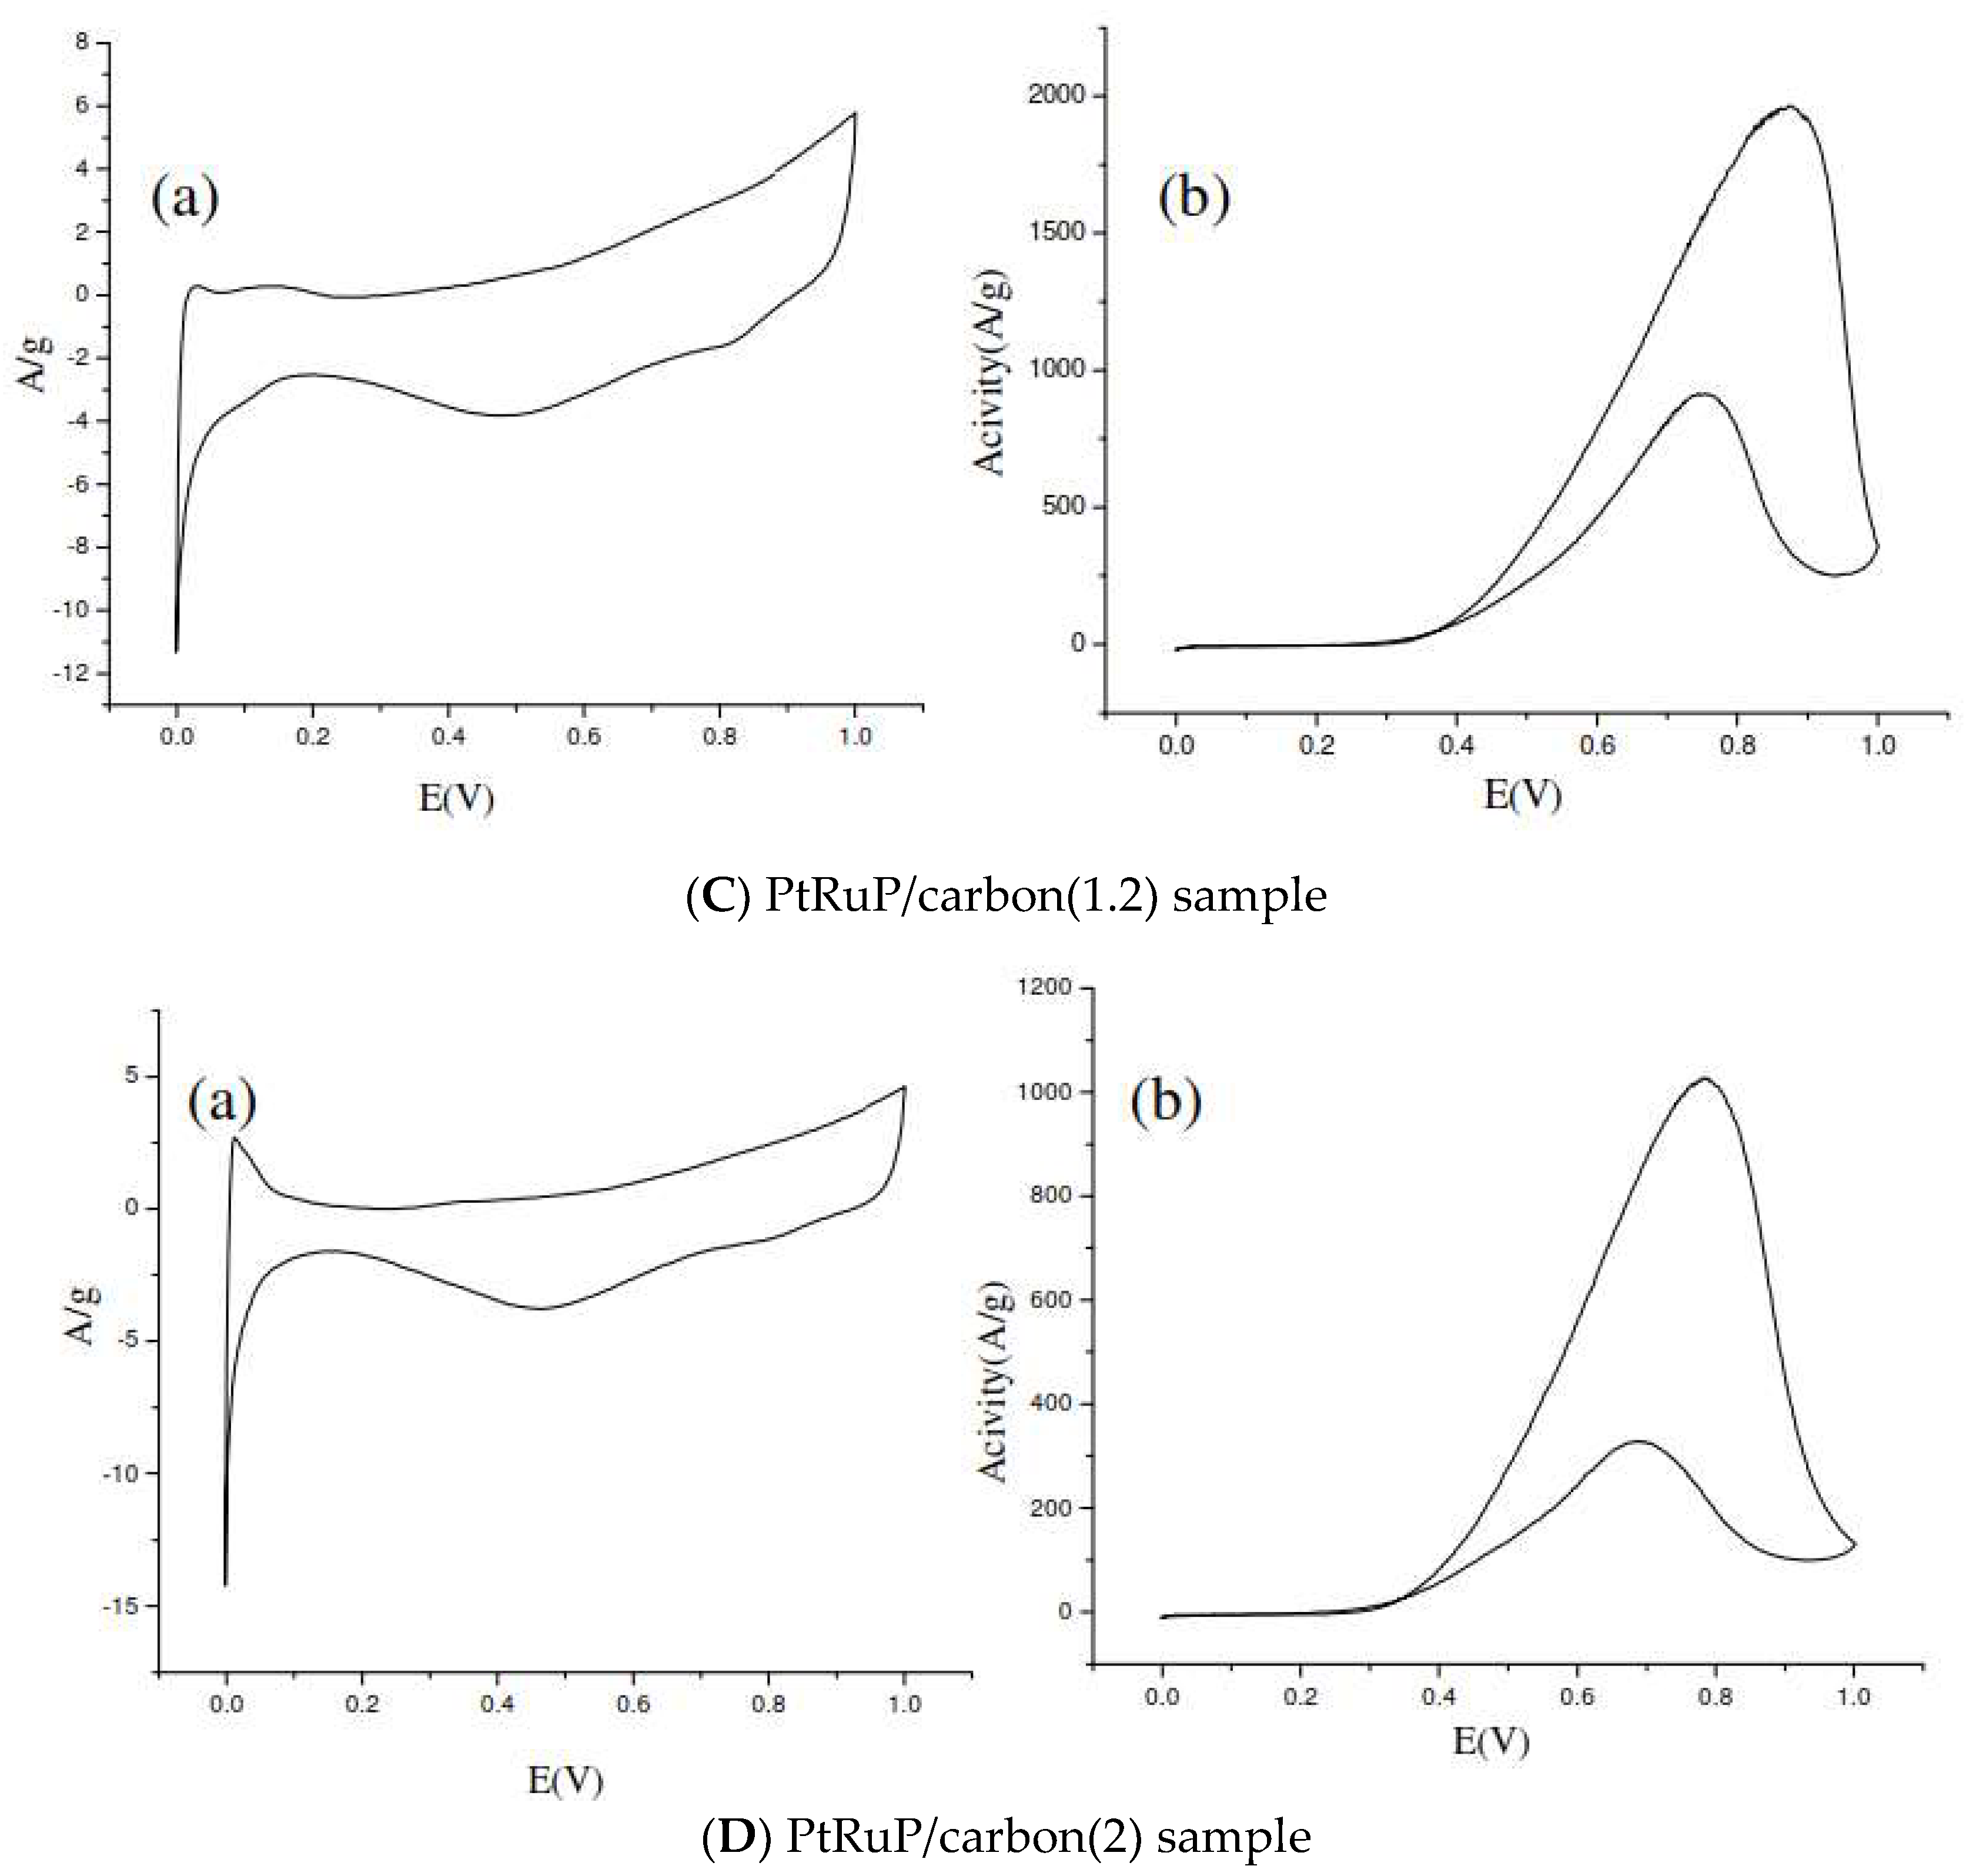
The CV curves of all the samples are shown in Figure 13. Table 8 shows the results of 60 wt.% PtRu-P/carbon black reduced by various amounts of NaH2PO2. The metal particle size of the sample decreased with an increase in the amount of NaH2PO2, consistent with that reported in the literature [19], i.e., the presence of P could suppress the growth of metal particles. The literature [19] did not mention why the metal particles became large when the P/Pt ratio was greater than 2. The XRD and TEM results show that the metal particle size of the sample decreased with an increasing amount of P. The TEM images also show that the metal particle size distribution was very uniform when the P/Pt atomic ratio was 1.2. However, the particles started agglomerate when the P/Pt ratio was 2. Table 7 shows that the activity decreased with an increase in metal particle size.
The XPS results show that the PtRuP/carbon (0.6) sample had a small amount of Pt0 (mole ratio 0.68%). Although its RuO2 content was high (mole ratio 1.9%), methanol oxidation activity was mainly occurred on Pt. The PtRuP/carbon (1.2) sample’s surface had the highest amount of Pt0 (mole ratio 1.57%) among all samples. PtRuP/carbon (2) only had 1.16% (mole ratio) Pt0. The results show that the higher the amount of Pt0-RuO2 is, the higher the activity is.
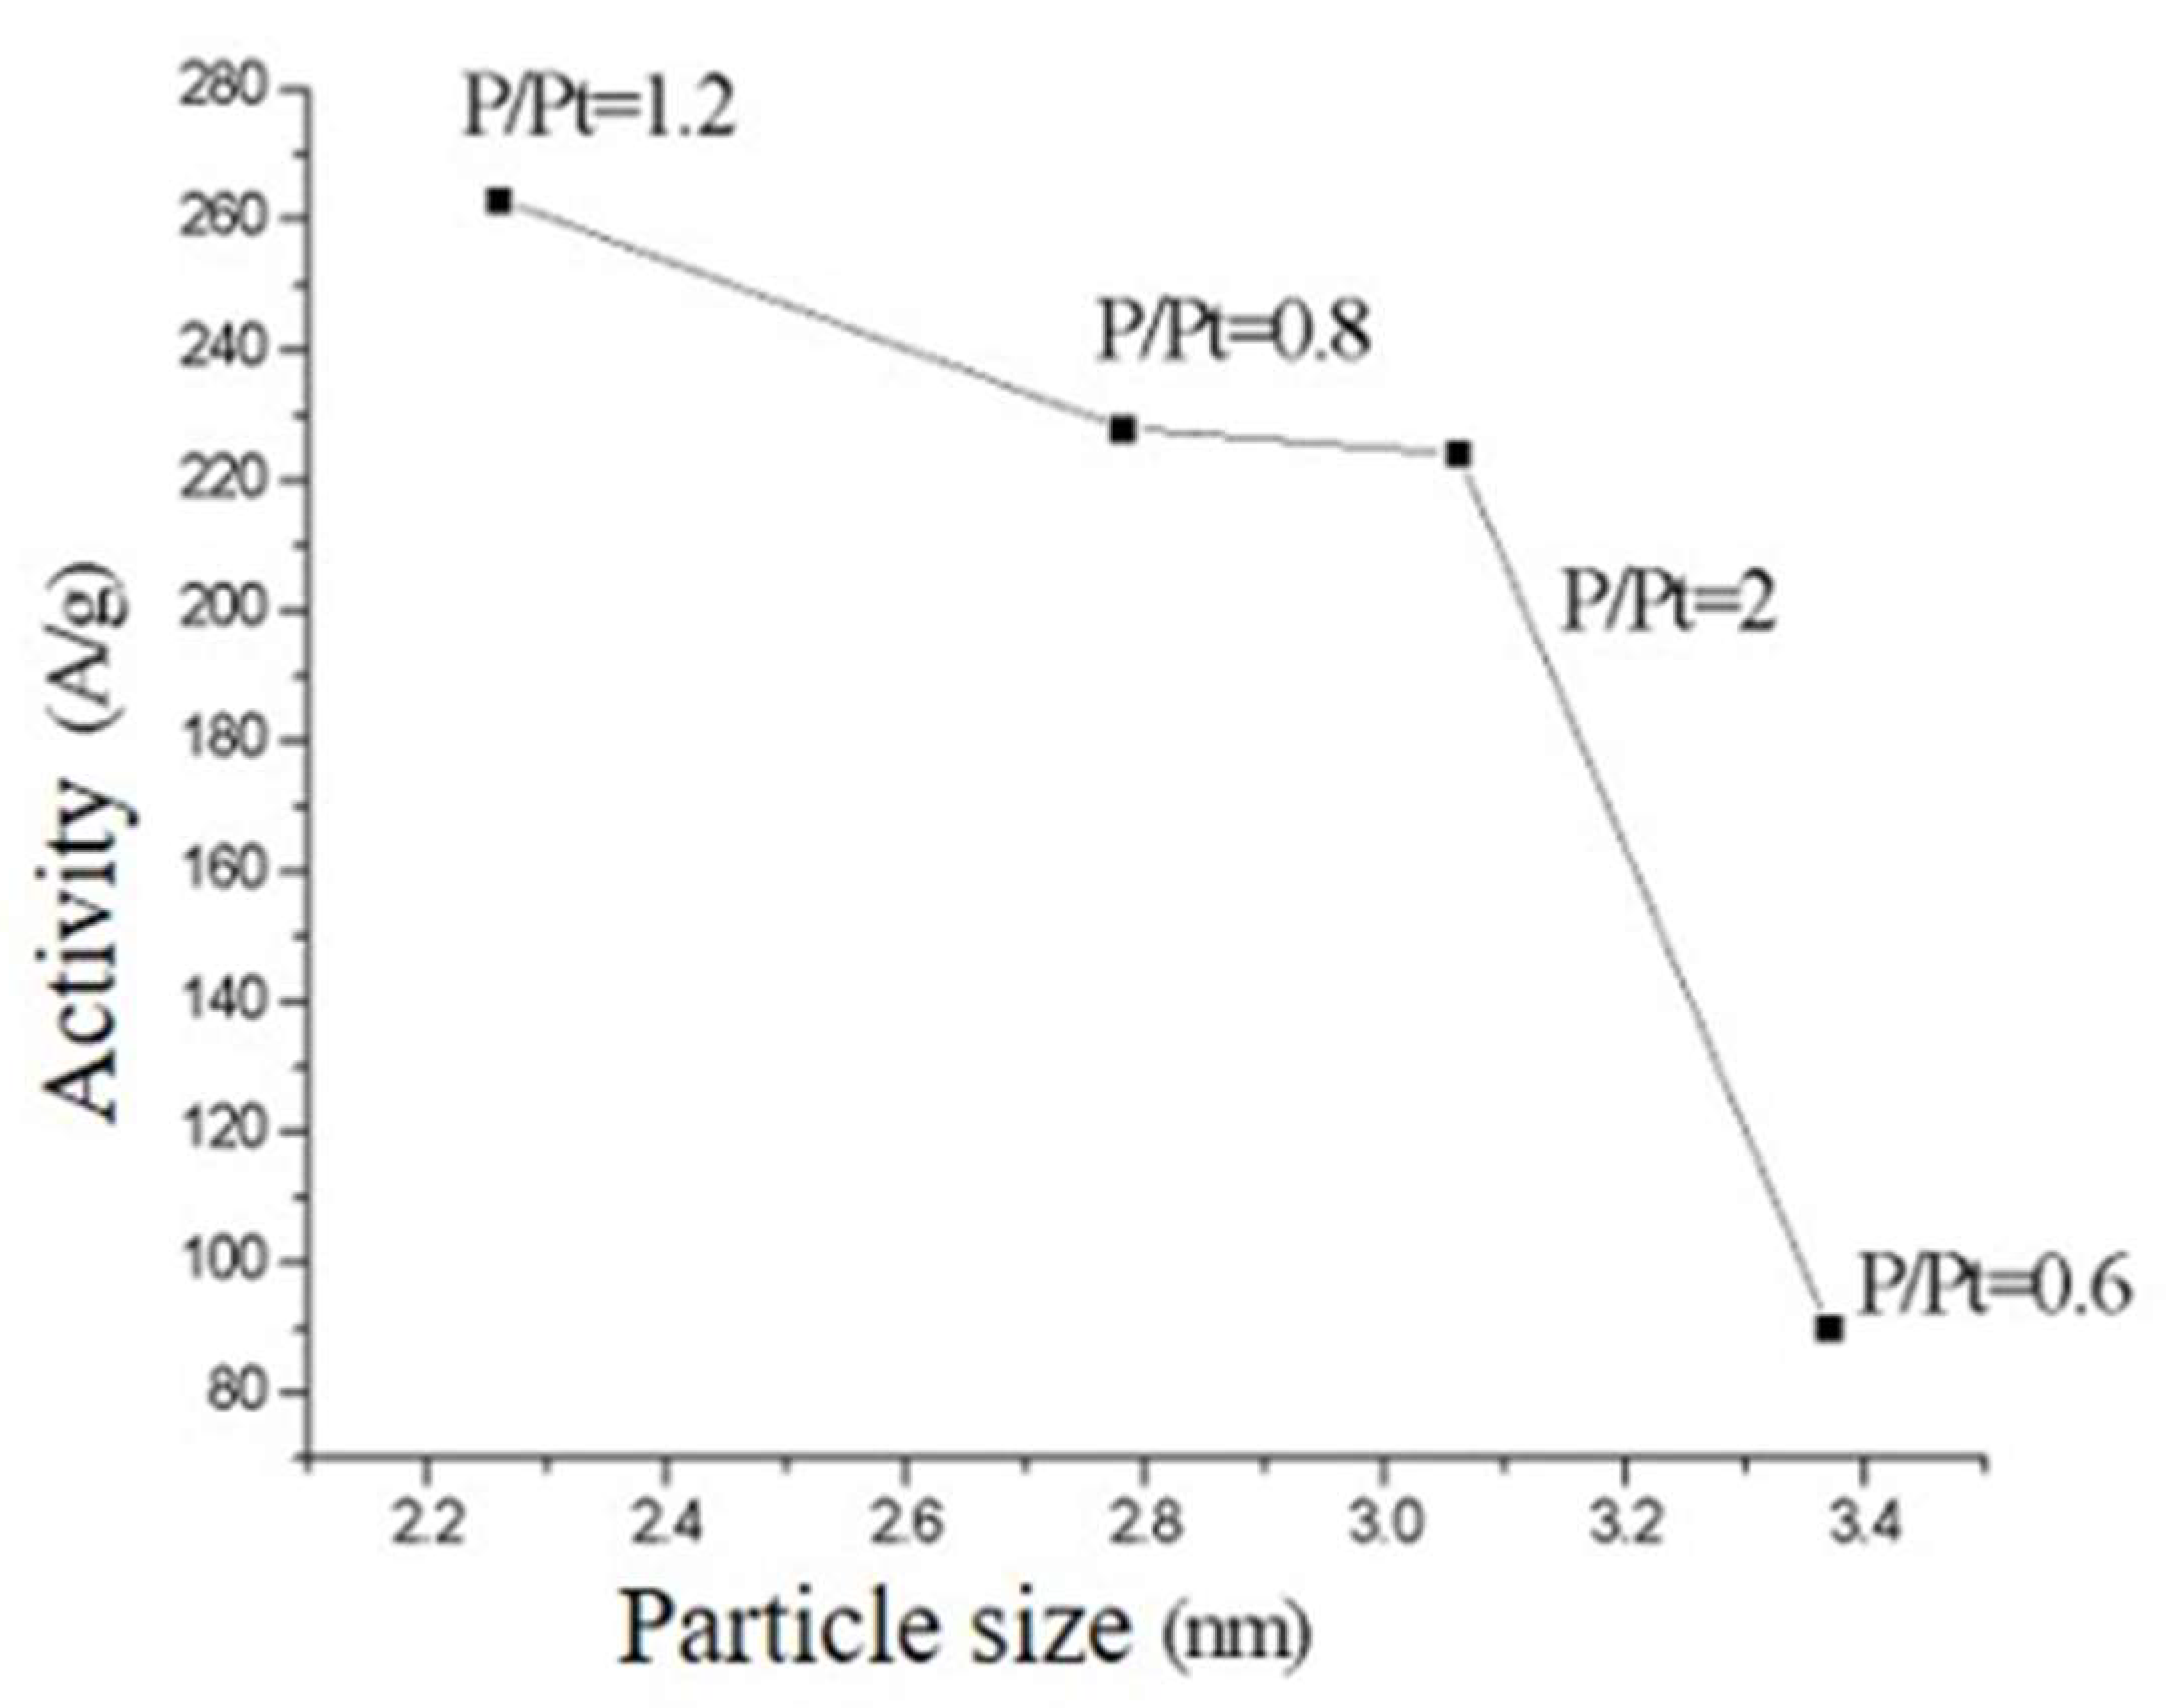
Figure 14 shows that when the P/Pt mole ratio was 1.2, the activity was the highest among all samples. When the P/Pt mole ratio increased up to 2, the activity dropped, since the particle size was large and the degree of the alloy was low. In conclusion, the 60 wt.% PtRu-P/carbon sample reduced by NaH2PO2 with a P/Pt ratio of 1.2 had very high activity—its activity (263.12 A/g at 0.5 V) was higher than the commercial catalyst from Johnson Matthey with 60 wt.% PtRu/carbon (251.32 A/g).
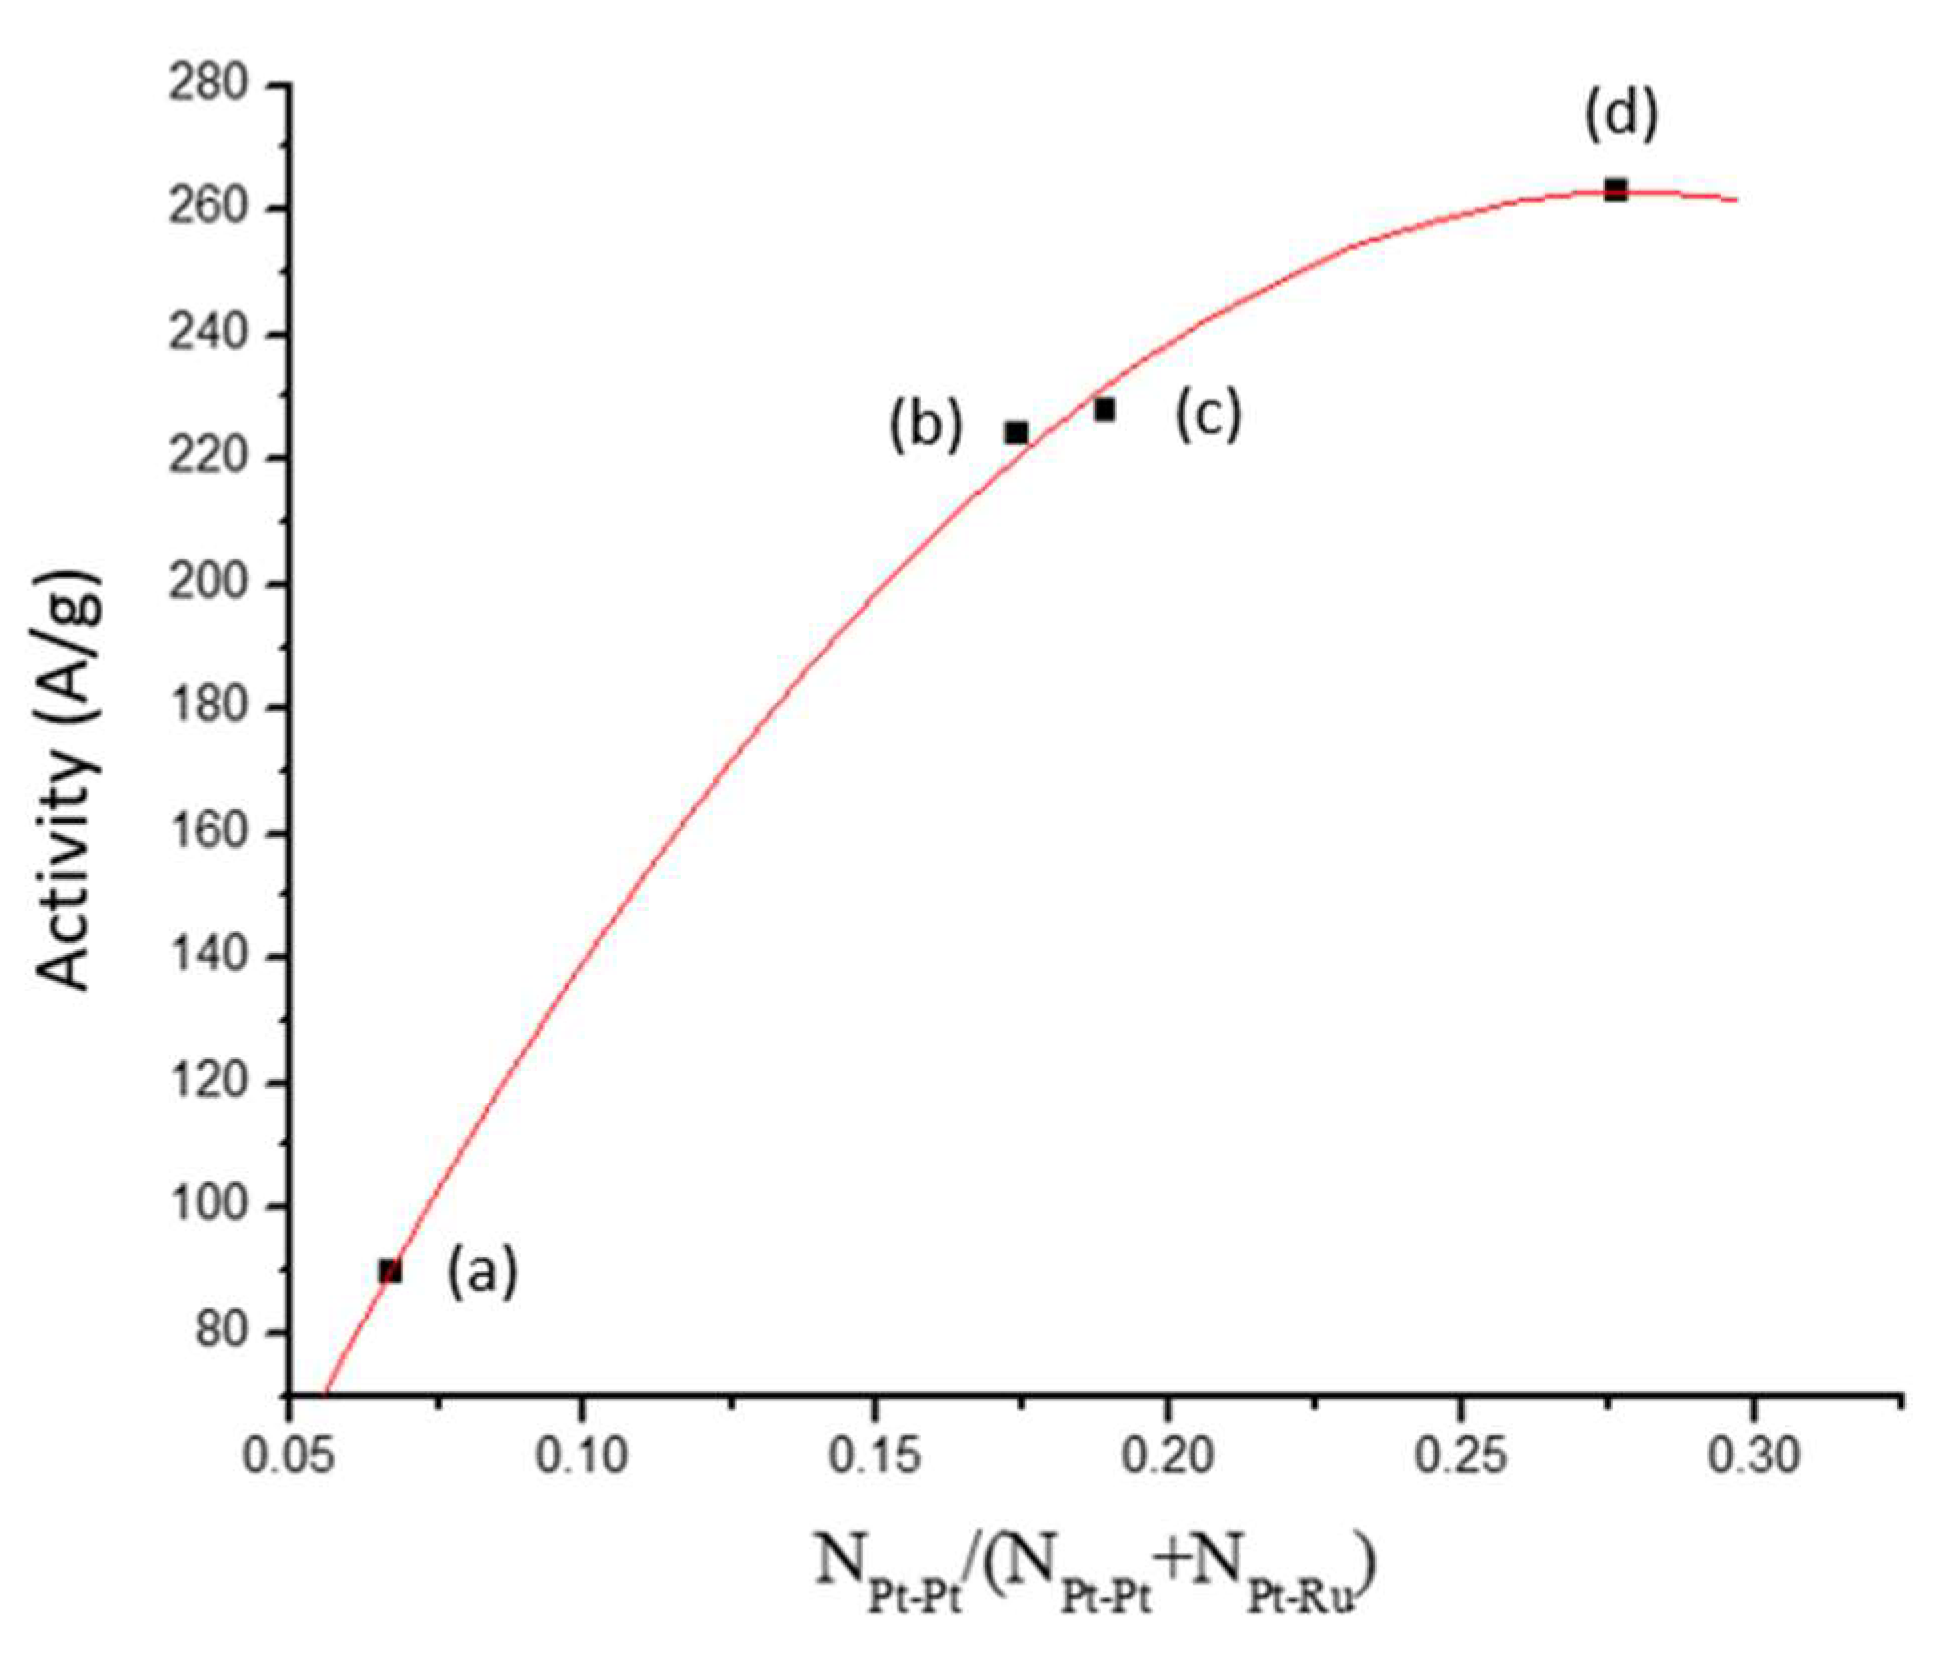
One can calculate the fraction of the coordination number of Pt-Pt among all coordination numbers. The activity of catalyst vs. the fraction of the coordination number of Pt-Pt among all coordination numbers is shown in Figure 15. It shows that the activity increased as the fraction of the coordination number of Pt-Pt increased.
4. Conclusions
PtRu/carbon was reduced by NaBH4, HCHO, and NaH2PO2, respectively. The sample reduced by NaH2PO2 had small metal particles and high methanol oxidation activity. When using NaH2PO2 as the reducing agent, the P/Pt ratio was crucial. Phosphorus would deposit on the surface of the carbon black, and suppressed the agglomeration of PtRu metal. The catalyst reduced by NaH2PO2 with a P/Pt raio of 1.2 had the highest activity among all catalysts. It had the higher Pt0 and Ru0 contents and smaller metal particle size than other catalysts. The carbon black-supported PtRu catalyst with NaH2PO2 as the reducing agent had the highest activity (263.12 A/g) among all catalysts in this study, which is higher than the commercial catalyst (Johnson Matthey H10100, 251.32 A/g).
Author Contributions
Conceptualization, Y.-W.C.; methodology, Y.-W.C.; validation, Y.-W.C. and H.-G.C.; formal analysis, H.-G.C.; investigation, Y.-W.C.; resources, Y.-W.C.; data curation, Y.-W.C.; writing—original draft preparation, Y.-W.C.; writing—review and editing, Y.-W.C. All authors have read and agreed to the published version of the manuscript.
Funding
This research was funded by Industrial Technology Research Institute, Hsinchu, Taiwan.
Conflicts of Interest
The authors declare no conflict of interest.
References
- Alias, M.S.; Kamarudin, S.K.; Zainoodin, A.M.; Masdar, M.S. Active direct methanol fuel cell: An overview. Int. J. Hydrogen Energy 2020, 45, 19620–19641. [Google Scholar] [CrossRef]
- Parthiban, V.; Sahu, A.K. Performance enhancement of direct methanol fuel cells using a methanol barrier boron nitride–Nafion hybrid membrane. New J. Chem. 2020, 44, 7338–7349. [Google Scholar] [CrossRef]
- Dyer, C.K. Fuel cells for portable applications. J. Power Sources 2002, 106, 31–34. [Google Scholar] [CrossRef]
- Chen, Y.W.; Chen, H.G.; Lo, M.Y.; Chen, Y.C. Modification of carbon black with hydrogen peroxide for high performance anode catalyst of direct methanol fuel cell. Materials 2021, 14, 3902. [Google Scholar] [CrossRef]
- Arico, A.S.; Srinivasan, S.; Antonucci, V. DMFCs: From fundamental aspects to technology development. Fuel Cells 2001, 1, 133–161. [Google Scholar] [CrossRef]
- Dinesh, J.; Easwaramoorthi, M.; Muthukumar, M. State of research developments in direct methanol fuel cell. Int. J. Eng. Trends Technol. 2017, 43, 284–296. [Google Scholar] [CrossRef]
- Verde, Y.; Alonso, G.; Ramos, H.; Zhang, H.; Jacobson, A.J.; Keer, A. Pt/C obtained from carbon with different treatments and (NH4)(2)PtCl6 as a Pt precursor. Appl. Catal. A Gen. 2004, 277, 201–207. [Google Scholar] [CrossRef]
- Ralph, T.R.; Hogarth, M.P. Catalysis for low temperature fuel cells, part II: The anode challenges. Platin. Metal Rev. 2002, 46, 3–32. [Google Scholar]
- Steele, B.C.H.; Heinzel, A. Materials for fuel-cell technologies. Nature 2001, 414, 345–354. [Google Scholar] [CrossRef] [PubMed]
- Gómez de la Fuente, J.L.; Martínez-Huerta, M.V.; Rojas, S.; Terreros, P.; Fierro, J.L.G.; Peña, M.A. Methanol electrooxidation on PtRu nanoparticles supported on functionalised carbon black. Catal. Today 2006, 116, 422–432. [Google Scholar] [CrossRef]
- Lian, Y.; Zhang, H.; Yi, B.; Zhang, Z.; Tan, Z. Preparation and characterization of multi-walled carbon nanotubes supported PtRu catalysts for proton exchange membrane fuel cells. Carbon 2005, 43, 3144–3152. [Google Scholar] [CrossRef]
- Wang, Z.B.; Yin, G.P.; Shi, P.F. Effects of ozone treatment of carbon support on Pt–Ru/C catalysts performance for direct methanol fuel cell. Carbon 2006, 44, 133–140. [Google Scholar] [CrossRef]
- Yao, W.; Jiang, X.; Li, M.; Li, Y.; Liu, Y.; Zhan, X.; Fu, G.; Tang, Y. Engineering hollsow porous platinum-silver double-shelled nanocages for efficient electro-oxidation of methanol. Appl. Catal. B Environ. 2021, 282, 11959–11972. [Google Scholar] [CrossRef]
- Li, Z.; Jiang, X.; Wang, X.; Hu, J.; Liu, Y.; Fu, G.; Tang, Y. Concave PtCo nanocrosses for methanol oxidation reaction. Appl. Catal. B Environ. 2020, 277, 119135–119147. [Google Scholar] [CrossRef]
- Li, M.; Li, Z.; Fu, G.; Tang, Y. Recent advances in amino-based molecules assisted control of noble-metal electrocatalysts. Small 2021, 17, 2007179–2007198. [Google Scholar] [CrossRef] [PubMed]
- Qiao, H.; Kunimatsu, M.; Fujiwara, N.; Okada, T. Novel heat-treatment process for performance enhancement of a microtubular DMFC anode prepared by impregnation-reduction method, Electrochem. Solid-State Lett. 2005, 8, A175–A183. [Google Scholar] [CrossRef]
- Liu, H.S.; Song, C.J.; Zhang, L.; Zhang, J.J.; Wang, H.J.; Wilkinson, D.P. A review of anode catalysis in the direct methanol fuel cell. J. Power. Sources 2006, 155, 95–110. [Google Scholar] [CrossRef]
- Kawaguchi, T.; Sugimoto, W.; Murakami, Y.; Takasu, Y. Particle growth behavior of carbon-supported Pt, Ru, PtRu catalysts prepared by an impregnation reductive-pyrolysis method for direct methanol fuel cell anodes. J. Catal. 2005, 229, 176–184. [Google Scholar] [CrossRef] [Green Version]
- Xue, X.; Ge, J.; Liu, C.P.; Xing, W.; Lu, T. Novel chemical synthesis of Pt–Ru–P electrocatalysts by hypophosphite deposition for enhanced methanol oxidation and CO tolerance in direct methanol fuel cell. Electrochem. Commun. 2006, 8, 1280–1286. [Google Scholar] [CrossRef]
- Burguete, C.P.; Solano, A.L.; Reinoso, F.R.; Lecea, C.S. The effect of oxygen surface groups of the support on platinum dispersion in Pt/carbon catalysts. J. Catal. 1989, 115, 98–106. [Google Scholar]
- Kawaguchi, T.; Sugimoto, W.; Murakami, Y.; Takasu, Y. Temperature dependence of the oxidation of carbon monoxide on carbon supported Pt, Ru, and PtRu. Electrochem. Commun. 2004, 6, 480–483. [Google Scholar] [CrossRef]
- Aksoylu, E.; Madalena, M.; Freitas, A.; Figueiredo, J.L. Bimetallic Pt–Sn catalysts supported on activated carbon. Appl. Catal. A Gen. 2000, 192, 29–42. [Google Scholar] [CrossRef]
- Watanabe, M.; Uchida, M.; Motoo, S. Preparation of highly dispersed Pt + Ru alloy clusters and the activity for the electrooxidation of methanol. J. Electroanal. Chem. 1987, 229, 395–406. [Google Scholar] [CrossRef]
- Liu, Z.; Lee, J.Y.; Han, M.; Chen, W.; Gan, L.M. Synthesis and characterization of PtRu/C catalysts from microemulsions and emulsions. J. Mater. Chem. 2002, 12, 2453–2458. [Google Scholar] [CrossRef]
- Liu, D.G.; Lee, J.F.; Tang, M.T. Characterization of Pt-Ru/C catalysts by X-ray absorption spectroscopy and temperature-programmed surface reaction. J. Mol. Catal. A Chem. 2005, 240, 197–206. [Google Scholar] [CrossRef]
- Nitani, H.; Nakagawa, T.; Daimon, H.; Kurobe, Y.; Ono, T.; Honda, Y.; Koizumi, A.; Seino, S.; Yamamoto, T.A. Methanol oxidation catalysis and substructure of PtRu bimetallic nanoparticles. Appl. Catal. A Gen. 2007, 326, 194–201. [Google Scholar] [CrossRef]
Figure 1.
TPD profile of CO and CO2 on the carbon black.

Figure 2.
The XRD patterns of 60 wt.% PtRu supported on carbon black and reduced by various reductants. (a) PtRu/carbon-NaBH4, (b) PtRu/carbon-HCHO, and (c) PtRu/carbon-NaH2PO2.
Figure 2.
The XRD patterns of 60 wt.% PtRu supported on carbon black and reduced by various reductants. (a) PtRu/carbon-NaBH4, (b) PtRu/carbon-HCHO, and (c) PtRu/carbon-NaH2PO2.

Figure 3.
Catalysts containing 60 wt.% PtRuP/carbon black reduced with various amounts of NaH2PO2, (A) XRD patterns, (B) the comparison of the intensities of (220) XRD peaks. (a) PtRuP/carbon (0.6), (b) PtRuP/carbon (0.8), (c) PtRuP/carbon (1.2), (d) PtRuP/carbon (2).
Figure 3.
Catalysts containing 60 wt.% PtRuP/carbon black reduced with various amounts of NaH2PO2, (A) XRD patterns, (B) the comparison of the intensities of (220) XRD peaks. (a) PtRuP/carbon (0.6), (b) PtRuP/carbon (0.8), (c) PtRuP/carbon (1.2), (d) PtRuP/carbon (2).


Figure 4.
TEM images of the samples reduced by various reducing agents, (a) sample reduced by NaBH4, (b) sample reduced by HCHO, and (c) sample reduced by NaH2PO2.
Figure 4.
TEM images of the samples reduced by various reducing agents, (a) sample reduced by NaBH4, (b) sample reduced by HCHO, and (c) sample reduced by NaH2PO2.

Figure 5.
Metal particle size as a function of the amount of phosphorus used in the reduction process.
Figure 5.
Metal particle size as a function of the amount of phosphorus used in the reduction process.

Figure 6.
TEM images of the samples reduced by NaH2PO2 with various amounts of phosphorus in the reducing agent. (a) PtRu/carbon (0.6) (b) PtRu/carbon (0.8), (c) PtRu/carbon (1.2), and (d) PtRu/carbon (2).
Figure 6.
TEM images of the samples reduced by NaH2PO2 with various amounts of phosphorus in the reducing agent. (a) PtRu/carbon (0.6) (b) PtRu/carbon (0.8), (c) PtRu/carbon (1.2), and (d) PtRu/carbon (2).

Figure 7.
XPS spectra of the PtRuP/carbon catalysts reduced by NaH2PO2 with various phosphorus contents. (a) PtRuP/carbon (2), (b) PtRuP/carbon (1.2), and (c) PtRuP/carbon (0.6).
Figure 7.
XPS spectra of the PtRuP/carbon catalysts reduced by NaH2PO2 with various phosphorus contents. (a) PtRuP/carbon (2), (b) PtRuP/carbon (1.2), and (c) PtRuP/carbon (0.6).

Figure 8.
XPS spectra of the PtRuP/carbon (0.6) sample; (a) Pt 4f spectra; (b) Ru 3d/ C 1s spectra.

Figure 9.
XPS spectra of PtRuP/carbon (1.2), (a) Pt 4f spectra; (b) Ru 3d/ C 1s spectra.

Figure 10.
XPS spectrum of PtRuP/carbon (2), (a) Ru 3d/C 1s spectrum, (b) Pt 4f spectrum.

Figure 11.
Pt LIII edge k3 of 60 wt.% PtRu-P/carbon black with various phosphorus content. (a) PtRuP/carbon (0.6), (b) PtRuP/carbon (0.8), (c) PtRuP/carbon (1.2), (d) PtRuP/carbon (2), (e) JM60 (JM60 stands for the sample Johnson Matthey 60 wt.% PtRu/C catalyst).
Figure 11.
Pt LIII edge k3 of 60 wt.% PtRu-P/carbon black with various phosphorus content. (a) PtRuP/carbon (0.6), (b) PtRuP/carbon (0.8), (c) PtRuP/carbon (1.2), (d) PtRuP/carbon (2), (e) JM60 (JM60 stands for the sample Johnson Matthey 60 wt.% PtRu/C catalyst).

Figure 12.
Metal particle size and (NPt-Pt + NPt-Ru) versus P/Pt in the catalyst.

Figure 13.
CV plots of the samples, (a) background of the 10th cycle, (b) activity of the 10th cycle.
Figure 13.
CV plots of the samples, (a) background of the 10th cycle, (b) activity of the 10th cycle.


Figure 14.
Catalyst activity vs. metal particle size.

Figure 15.
Catalyst activity vs. the fraction of coordination number of Pt-Pt among all coordination number. (a) PtRuP(0.6); (b) PtRuP(2); (c) PtRuP(0.8); and (d) PtRuP(1.2).
Figure 15.
Catalyst activity vs. the fraction of coordination number of Pt-Pt among all coordination number. (a) PtRuP(0.6); (b) PtRuP(2); (c) PtRuP(0.8); and (d) PtRuP(1.2).


Table 1.
Conductivity and the amounts of functional groups on carbon black.
| Sample | [O] (mmol/g) | Conductivity (S/cm) | ||
|---|---|---|---|---|
| CO | CO2 | Total | ||
| Carbon black | 0.4915 | 0.0905 | 0.5820 | 12.11 |
Table 2.
Effect of reducing agents on the particle size of the metal.
| Sample | Reduction | Particle Size (nm) | Metal Dispersion | |||
|---|---|---|---|---|---|---|
| Agent | T (°C) | Time (h) | TEM | XRD | ||
| PtRu/carbon-NaBH4 | NaBH4 | RT | 2 | 3.5 | 2.57 | low |
| PtRu/carbon-HCHO | HCHO | 85 °C | 3 | 2.7 | N.D. | not good |
| PtRu/carbon-NaH2PO2 | NaH2PO2 | 90 °C | 10 | 2.59 | 2.03 | good |
Table 3.
Effect of phosphorus content in reducing agent on the metal particle size.
| Sample | P/Pt (Atomic Ratio) | Metal Particle Size (nm) |
|---|---|---|
| PtRu/carbon (0.6) | 0.6 | 3.37 |
| PtRu/carbon (0.8) | 0.8 | 2.26 |
| PtRu/carbon (1.2) | 1.2 | 2.78 |
| PtRu/carbon (2) | 2 | 3.06 |
Table 4.
TGA results of PtRu samples supported on carbon black and reduced by various amounts of NaH2PO2.
Table 4.
TGA results of PtRu samples supported on carbon black and reduced by various amounts of NaH2PO2.
| Sample | P/Pt (Atomic Ratio) | Metal Oxide Content (wt.%) | XRF (mol. %) | Loading (wt.%) | ||
|---|---|---|---|---|---|---|
| Pt | Ru | Nominal | Real | |||
| PtRuP/carbon (0.6) | 0.6 | 64.01 | 54 | 46 | 60.08 | 57.92 |
| PtRuP/carbon (0.8) | 0.8 | 67.75 | 58 | 42 | 60.01 | 59.08 |
| PtRuP/carbon (1) | 1 | 62.05 | 47 | 53 | 60.01 | 55.91 |
| PtRuP/carbon (1.2) | 1.2 | 62.15 | 52 | 48 | 60.03 | 56.15 |
| PtRuP/carbon (2) | 2 | 65.9 | 52 | 48 | 59.59 | 59.55 |
Table 5.
Effect of phosphorus content on the surface compositions (%) of the catalysts.
| Sample | Pt 4f7/2 | Ru 3d5/2 | |||
|---|---|---|---|---|---|
| 71.2 eV | 72.5 eV | 73.8 eV | 280 eV | 281 eV | |
| PtRuP/carbon (0.6) | 54.79% | 45.21 | 0 | 0 | 100% |
| PtRuP/carbon (1.2) | 60.04 | 22 | 0 | 100 | |
| PtRuP/carbon (2) | 53.50 | 26.66 | 19.85 | 24.55 7 | 75.45 |
Table 6.
Coordination numbers of various carbon black samples.
| Sample | Shell | N | Å | D (nm) | ΔE0 (eV) | Δσj2 (A2) | r-Factor |
|---|---|---|---|---|---|---|---|
| PtRuP/carbon (2) | Pt-Pt | 7.89 | 2.74 | 3.06 | 3.16 | 0.007 | 0.30% |
| Pt-Ru | 1.66 | 2.69 | 0.55 | 0.004 | |||
| PtRuP/carbon (1.2) | Pt-Pt | 5.31 | 2.75 | 2.26 | 4.79 | 0.005 | 0.18% |
| Pt-Ru | 2.03 | 2.71 | 2.77 | 0.004 | |||
| PtRuP/carbon (0.8) | Pt-Pt | 6.61 | 2.74 | 2.78 | 3.54 | 0.006 | 0.05% |
| Pt-Ru | 1.54 | 2.7 | 1.81 | 0.003 | |||
| PtRuP/carbon (0.6) | Pt-Pt | 8.74 | 2.72 | 3.37 | 0.73 | 0.006 | 0.10% |
| Pt-Ru | 0.62 | 2.70 | 19 | 0.0006 |
Table 7.
Effects of reducing agent on the metal particle size and activity.
| Sample | Reduction Condition | Particle Size (nm) | XRF (Atomic %) | Loading (wt.%) | Activity (A/g) | |||||
|---|---|---|---|---|---|---|---|---|---|---|
| Reducing Agent | Temp. | pH | Time (h) | TEM | Pt | Ru | Nominal | TGA | ||
| Result | ||||||||||
| PtRu/carbon | NaBH4 | RT | 12.1 | 2 | 3.5 | 63 | 37 | 59.9 | 57.72 | 84.95 |
| PtRu/carbon | HCHO | 85 °C | 12.2 | 3 | 2.7 | 61 | 39 | 60.1 | 46.17 | 147.71 |
| PtRu/carbon | NaH2PO2 | 90 °C | 11.3 | 10 | 2.5 | 57 | 43 | 59.8 | 55.02 | 238.2 |
* Nominal metal ratio Pt:Ru = 50:50.
Table 8.
Effect of phosphorus amount on the activity.
| Sample | P/Pt | Metal Particle Size (nm) | XRF | Loading (%) | Activity (A/g) | |||
|---|---|---|---|---|---|---|---|---|
| TEM | XRD | Pt (%) | Ru (%) | Nominal | TGA | |||
| PtRuP/carbon (2) | 2 | 3.06 | 3.55 | 52 | 48 | 59.59 | 59.47 | 224.23 |
| PtRuP/carbon (1.2) | 1.2 | 2.26 | N.D. | 52 | 48 | 60.03 | 56.11 | 263.12 |
| PtRuP/carbon (0.8) | 0.8 | 2.78 | N.D. | 58 | 42 | 60.01 | 58.3 | 228.06 |
| PtRuP/carbon (0.6) | 0.6 | 3.37 | 3.48 | 54 | 46 | 60.08 | 57.77 | 89.9 |
Publisher’s Note: MDPI stays neutral with regard to jurisdictional claims in published maps and institutional affiliations. |
© 2021 by the authors. Licensee MDPI, Basel, Switzerland. This article is an open access article distributed under the terms and conditions of the Creative Commons Attribution (CC BY) license (https://creativecommons.org/licenses/by/4.0/).
Share and Cite
MDPI and ACS Style
Chen, Y.-W.; Chen, H.-G. Effects of Reducing Agent on the Activity of PtRu/Carbon Black Anode Catalyst of Direct Methanol Fuel Cell. C 2021, 7, 72. https://0-doi-org.brum.beds.ac.uk/10.3390/c7040072
AMA Style
Chen Y-W, Chen H-G. Effects of Reducing Agent on the Activity of PtRu/Carbon Black Anode Catalyst of Direct Methanol Fuel Cell. C. 2021; 7(4):72. https://0-doi-org.brum.beds.ac.uk/10.3390/c7040072
Chicago/Turabian StyleChen, Yu-Wen, and Han-Gen Chen. 2021. "Effects of Reducing Agent on the Activity of PtRu/Carbon Black Anode Catalyst of Direct Methanol Fuel Cell" C 7, no. 4: 72. https://0-doi-org.brum.beds.ac.uk/10.3390/c7040072
Note that from the first issue of 2016, this journal uses article numbers instead of page numbers. See further details here.