Article

Crystallization Kinetics of Poly(lactic acid)–Graphene Nanoscroll Nanocomposites: Role of Tubular, Planar, and Scrolled Carbon Nanoparticles

1
Intel Corporation, Hillsboro, OR 97124, USA
2
Institute for Materials Research and Innovation, Chemical Engineering Department, Lafayette, LA 70503, USA
3
Mechanical Engineering Department, University of Louisiana at Lafayette, P.O. Box 44130, Lafayette, LA 70504, USA
*
Author to whom correspondence should be addressed.
Submission received: 31 August 2021 / Revised: 19 October 2021 / Accepted: 26 October 2021 / Published: 31 October 2021

Abstract

:
Graphene nanoscrolls (GNS) are 1D carbon-based nanoparticles. In this study, they were investigated as a heterogeneous nucleating agent in the poly(lactic acid) (PLA) matrix. The isothermal and non-isothermal melting behavior and crystallization kinetics of PLA-GNS nanocomposites were investigated using a differential scanning calorimeter (DSC). Low GNS content not only accelerated the crystallization rate, but also the degree of crystallinity of PLA. The Avrami model was used to fit raw experimental data, and to evaluate the crystallization kinetics for both isothermal and non-isothermal runs through the nucleation and growth rate. Additionally, the effect of the dimensionality and structure of the nanoparticle on the crystallization behavior and kinetics of PLA is discussed. GNS, having a similar fundamental unit as CNT and GNP, were observed to possess superior mechanical properties when analyzed by the nanoindentation technique. The scrolled architecture of GNS facilitated a better interface and increased energy absorption with PLA compared to CNTs and GNPs, resulting in superior mechanical properties.

1. Introduction

PLA, being a bio-based and biodegradable polymer, has attracted significant interest due to its comparably excellent material properties such as high stiffness, high optical transparency, and easy processability [1,2,3,4]. PLA is a linear aliphatic thermoplastic polyester prepared by the ring-opening polymerization of lactide [5,6]. PLA typically has a slow crystallization rate, which causes low heat distortion temperature, high gas diffusion, and unstable mechanical properties such as brittleness due to its low glass transition temperature [2]. Therefore, crystallization is enhanced by the addition of nucleating agents that can lower the surface free energy barrier and thus allow crystallization to occur at higher temperatures [2,7]. PLA mostly crystallizes into α and α’ crystalline forms, with the α’ form being less organized and having a lower Young’s modulus than the α form.
Improvements in the mechanical properties and crystallization kinetics were reported due to the inclusion of nanoparticles such as nanoclays, talc, and carbon-based nanoparticles [1,8,9]. Crystallization can also be improved by subjecting PLA to a wide range of thermal treatments. However, these methods yield moderate results and are time consuming, as the crystallization of PLA is slow. The most effective method to achieve superior mechanical properties is the filling of a PLA matrix with inorganic nanoparticles such as clay, carbon nanotubes, graphene, and spherical nanoparticles. Upon good dispersion in the polymer matrix, such nanoparticles have been found to increase both the rate and degree of crystallization, as they act as extra crystallization nuclei. The improvements in crystallization and physical properties of polymers are not only related to the characteristics of the fillers (geometry, aspect ratio, specific surface area), but also to the formed polymer/filler interfacial strength.
Graphene nanoscrolls (GNS) are an increasingly important one-dimensional open ended tubular structure [10,11,12,13]. GNS consist of tubular layers of graphene sheets, formed by rolling in a continuous manner, that are distinct from the 1D multiwalled carbon nanotube (MWCNT) [13,14]. The open ends and expansions in the interlayer surface area allows for solvent and molecule accessibility just by facile infiltration [10,11,15]. Non-covalent interactions between overlapping areas provide GNS with structural stability and prevents them from reverting back to initial planar morphology. Li et al. reports that GNS could potentially possess the most superior adhesion property in the carbon family, with values of 0.45, 0.31, and 0.33 J m−2 for graphene, graphite, and multiwall carbon nanotubes, respectively [16]. Moreover, in thicker GNS, adhesion energy was observed to also be higher, at 1.72 ± 0.12 J m−2, compared to 0.62 ± 0.02 J m−2 in smaller diameter GNS (Figure S2). The synthesis of GNSs can be conducted through a variety of processes, namely, rolling of graphene on a substrate surface [11], well-controlled lyophilization [13], the Langmuir–Blodgett process [15], exfoliation or interaction of graphitic interlayers, and chemical vapor deposition [17]. GNS’ favorable properties render it an attractive carbon-based nucleating agent in the crystallization performance of PLA.
To the best of author’s knowledge, no study has reported the investigation of the crystallization kinetics of PLA induced by GNS. An in-depth study on the GNS-induced crystallization kinetics of PLA is required to fully realize the potential of PLA. The objective of this study was to investigate the melting behavior and crystallization kinetics of the PLA nanocomposite under isothermal and non-isothermal conditions. It is important to understand the fundamentals of the crystallization kinetics of a polymer affected by crystal structure and morphology induced by a nucleating agent [18]. The crystallization kinetics of PLA-GNS was modeled using the Avrami model, and dimensionality and growth rate were obtained from isothermal and non-isothermal experiments. Another aim was to conduct preliminary studies on the comparative analysis of PLA incorporated with GNS, carbon nanotubes (CNTs), and graphene nanoplatelet (GNPs), which are nanoparticles possessing similar fundamental units.

2. Materials and Methods

2.1. Materials

Poly(lactic acid) (PLA) was procured from Nature-Works (4032D grade). According to the technical data sheet provided by the supplier, its melting point is ~180 °C, glass transition temperature is 55–60 °C, melt flow index range is 190 °C, and density is 1.25 g cm−3. Graphene nanoplatelets (GNPs) having an average of 5–7 atomic layers of 2D graphite were acquired from Sigma-Aldrich, with a lateral size of 0.5–5 µm and BET surface area >500 m2·g−1. Toluene (≥99.5%) and tetrahydrofuran (THF) were obtained from Sigma-Aldrich. Carbon nanotubes (CNTs) with diameter 1.5 nm and length 1–5 µm were obtained from Sigma Aldrich (St. Louis, MO, USA).

2.2. Preparation of PLA-GNS Polymer Nanocomposite

Graphene nanoplatelets (GNPs) were converted into graphene nanoscrolls (GNS), using our previously reported procedure [19]. Thereafter, 0.5 g of PLA was dissolved in 15 mL THF using a magnetic stirrer for 60 min at 60 °C in an oil bath. Simultaneously, the resultant GNS powder was dispersed in 10 mL THF and sonicated in an SRA TruPower UC-20D (SRA Shops, Walpole, MA, USA) Digital Ultrasonic Cleaner at room temperature. After 60 min of sonication, the GNS-THF dispersion was added to the PLA-THF solution and heated at 60 °C for 120 min using a magnetic stirrer. PLA-GNS samples were prepared with different weight ratios: PLA-GNS-0.1, PLA-GNS-0.5, PLA-GNS-1, and PLA-GNS-2. The solution was subsequently poured into glass petri dishes to allow for solvent evaporation at room temperature under atmospheric pressure overnight. The residual solvent was then removed by placing the nanohybrid membranes in a vacuum oven at 40 °C for 60 min. Similarly, pure PLA was processed under the same conditions by dissolving 0.5 g PLA in 25 mL THF at 60 °C for 3 h. For comparative analysis, PLA-CNT and PLA-GNP samples were prepared following the same solution-mixing method for 2 weight percent of nanoparticle in PLA matrix.

2.3. Differential Scanning Calorimeter (DSC)

Thermal analyses of PLA-GNS (~5 mg) were carried out using a Perkin-Elmer 4000 (Perkin Elmer, Houston, TX, USA) Differential Scanning Calorimeter (DSC). The calorimeter was calibrated with indium and experiments were carried out under a constant inert nitrogen gas flow of 19.8 mL min−1. Isothermal crystallization studies were carried out by heating pure PLA and PLA-GNS nanocomposite samples to 180 °C at a heating rate of 10 °C min−1 and kept at this temperature for 5 min to completely erase the thermal history. Thereafter, the samples were quenched to the desired crystallization temperature, Tc of 90, 100, and 110 °C, at a cooling rate of 40 °C min−1 and kept under isothermal conditions for 60 min. The samples were then cooled to room temperature and heated once again to 180 °C at 10 °C min−1. The degree of crystallinity, Xc, of samples was determined by Equation (1):
X c ( % ) = Δ H f Δ H c Δ H f 0 × 100
where Δ H f is the melting enthalpy, Δ H f 0 is the melting enthalpy of pure crystalline PLA (100% crystalline polylactide = 93 J/g), and Δ H c is the crystallization enthalpy.
The non-isothermal crystallization measurements were carried out in a Perkin-Elmer 4000 (Perkin Elmer, Houston, TX, USA) calorimeter. The calorimeter was calibrated using an indium standard to ensure reliability of data, and experiments were carried out under a constant flow of nitrogen gas at the rate of 19.8 mL min−1. The sample weight was kept at ~5 mg, sealed hermetically in aluminum pans. For crystallization studies, samples were first heated from 30 to 180 °C at 10 °C min−1 and held at 180 °C for 5 min to completely erase the thermal history. Subsequent cooling to 30 °C was undertaken at cooling rates of 2, 5, 7.5, 10, 15, 20, 25, 30, 35, 40, 45, and 50 °C min−1. In order to study the melting behavior after crystallizing, samples underwent a second heating to 180 °C at 10 °C min−1 and held for a minute.

2.4. Nanoindentation

A Nano Indenter G200 instrument (Agilent, Santa Clara, CA, USA) provided by Agilent-MTS, compliant with ISO 14577, was utilized to measure the elastic modulus and hardness of pure PLA and PLA-GNP, PLA-CNT, and PLA-GNS nanocomposites. Its specifications were as follows: load range of 0.4–500 mN, displacement resolution of less than 0.01 nm, and load resolution of 50 nN. The instrument was equipped with a three-sided pyramidal-shaped Berkovich indenter with a tip radius of about 100 nm. Thin film samples were attached to an aluminum-testing stub using a very thin layer of crystal bond glue. Small indentation loads of 0.5 mN were applied to films with thickness of 50 to 100 μm, to minimize the effect of substrate on the properties of the thin films. The resulting indentation depths were in the range of 200 nm to 1 μm for all the samples. Fifty indentations were conducted at random locations, and average and standard deviation are reported. Poisson’s ratio of PLA was 0.33.

3. Results and Discussion

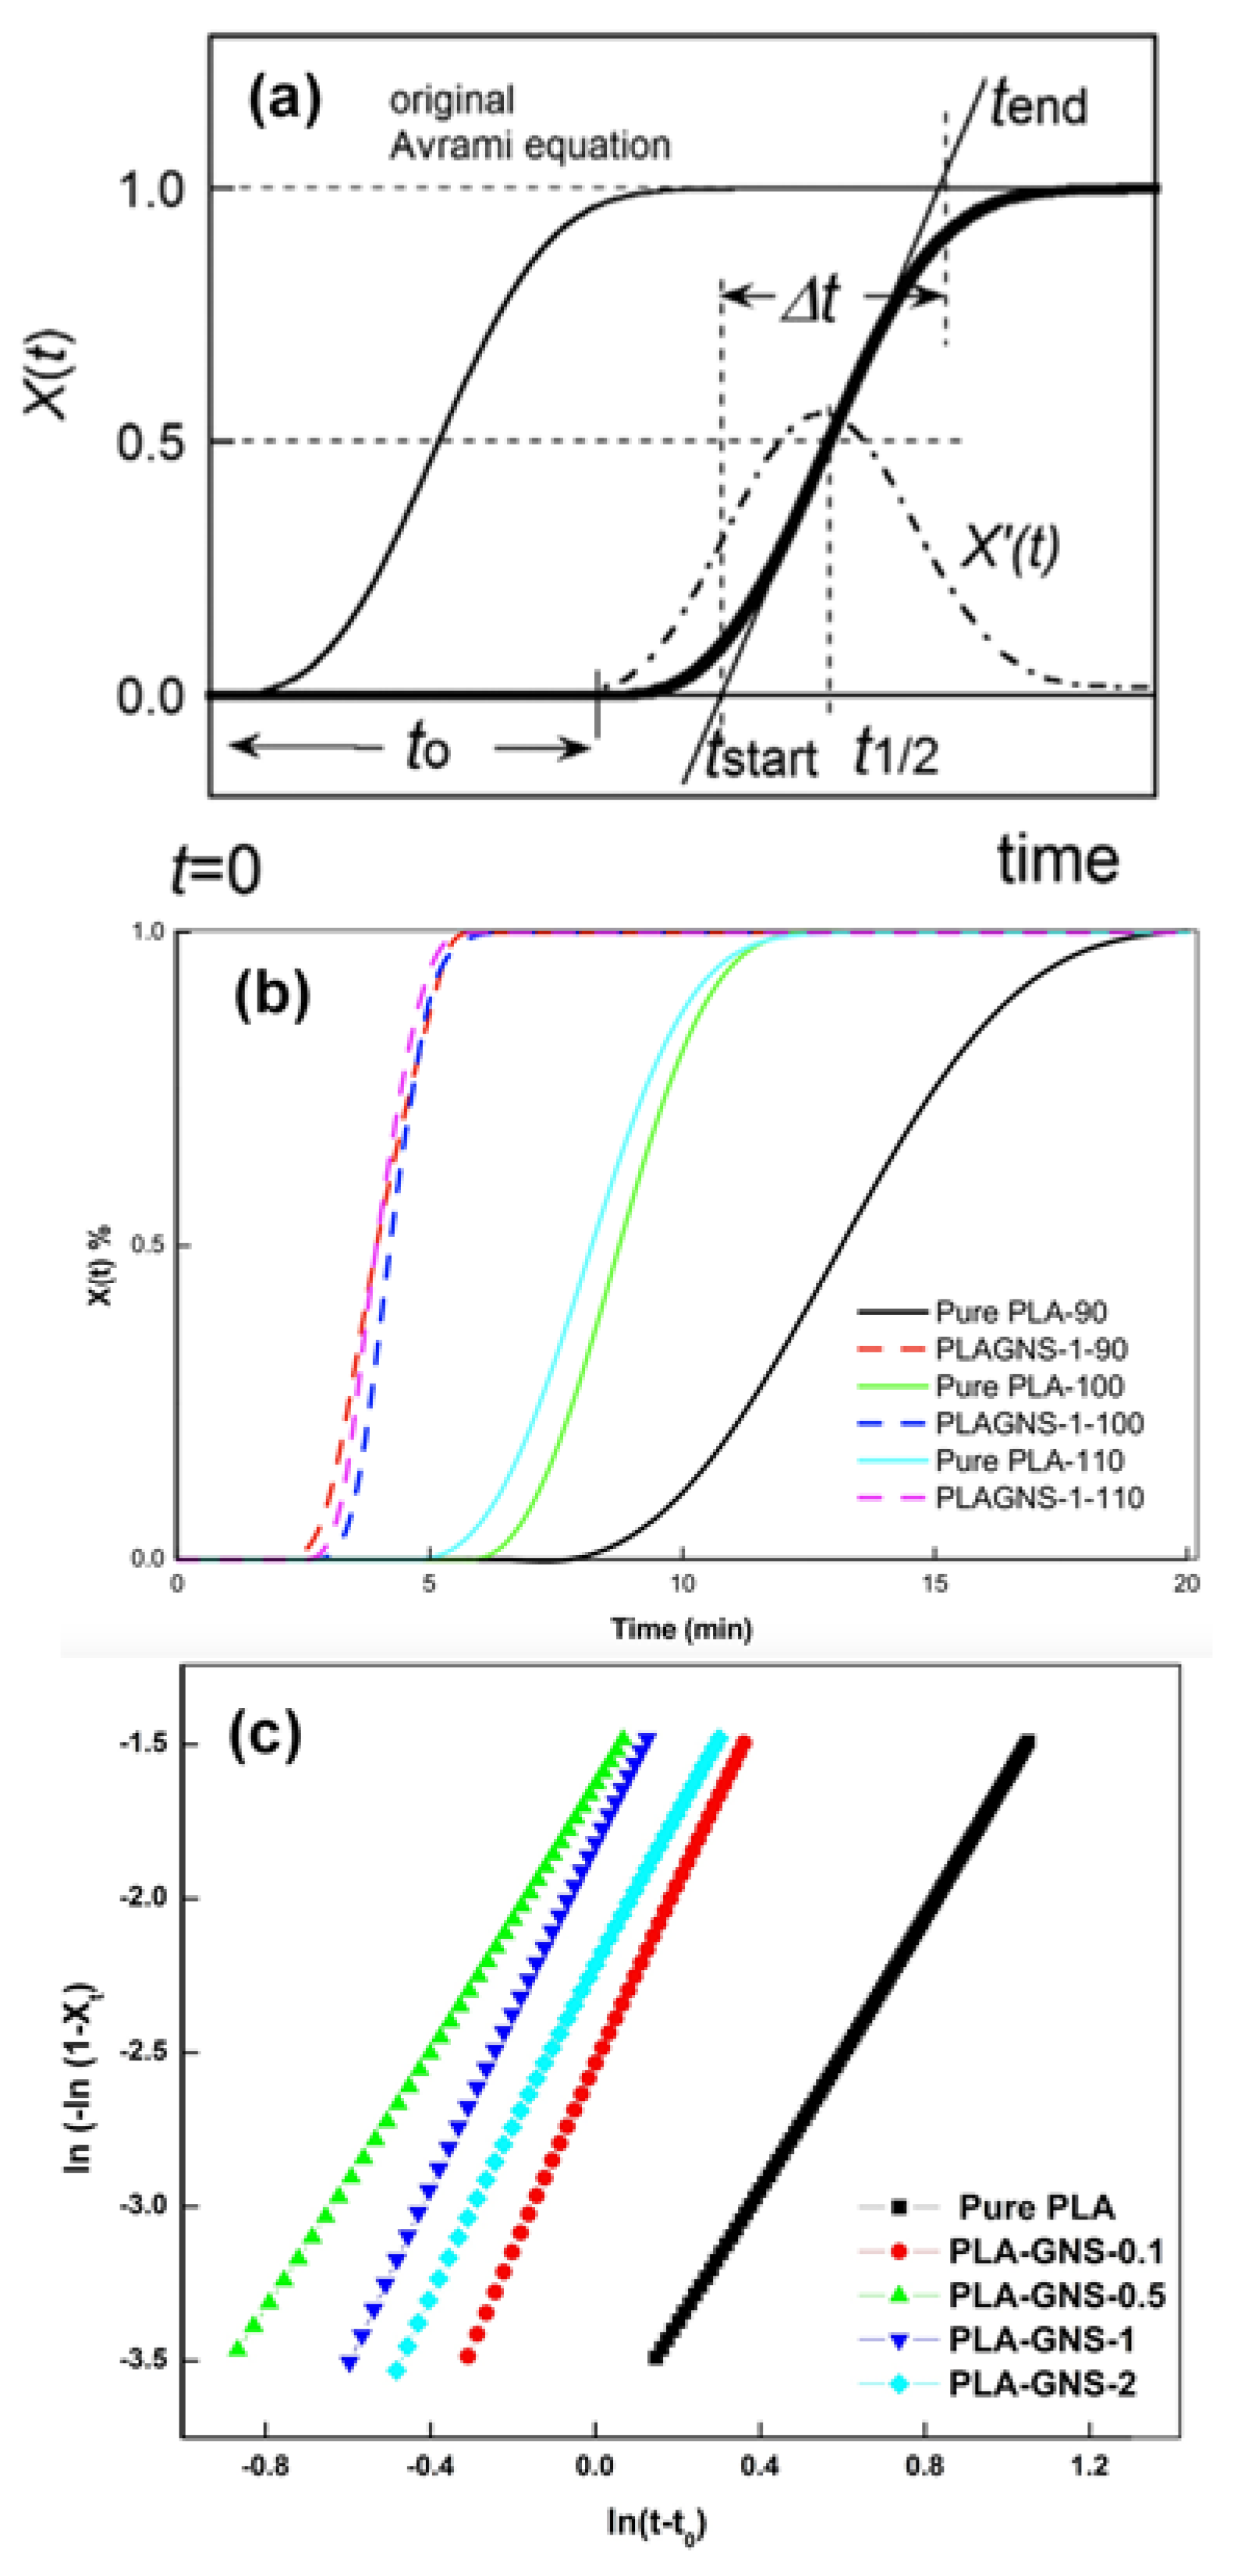
3.1. Isothermal Crystallization Studies

Table 1 presents the Avrami parameters, n and k , for the Avrami exponent and rate constant, respectively. The Avrami equation describes the phase changes during isothermal crystallization [20]. The analysis was performed using the un-subtracted heat flow curve obtained from DSC during isothermal studies and the relative crystallinity, Xt, as a function of time was obtained using the following relation [21,22]:
X ( t ) = Q t Q = 0 t   d H d t   d t 0   d H d t   d t
where Q t and Q are the amounts of enthalpy generated at time t and infinite time, t , respectively, with d H / d t as the rate of heat or enthalpy evolution. The Avrami equation, which is primarily used to model this isothermal crystallization process, is given by [22,23,24]:
1 X ( t ) = exp ( k t n )
where X ( t ) is the relative crystallinity as a function of time, k is the Avrami rate constant, and n is the Avrami exponent. Relative crystallinity, X ( t ) , is the fractional amount of relative volume fraction of polymer matrix crystallized. The Avrami relation takes into consideration a constant nucleation rate and constant linear growth [23]. The linearized form of the Avrami equation can be expressed as:
L o g [ ln { 1 X ( t ) } ] = n l o g   t + log k
The rate constant, k and the exponent, n are determined from the slope and intercept, respectively. The reaction half time of crystallization is denoted by:
t 1 / 2 = ( l n   2 k ) 1 / n
The Avrami fits were performed for a relative crystallinity range of 0.03–0.2 for an accurate evaluation of primary crystallization in PLA and PLA-GNS nanocomposites. The Avrami equation cannot account for a period where no crystallization occurs; therefore, induction time, t0, denotes the initial time at which crystallization begins. An induction period in the early stage of crystallization is required for creation of nuclei and is estimated by calculating the first derivative d X / d t , because it should be zero and denote the start of nucleation; therefore, t = t0 (Figure 1a) [25]. From Table 1, the induction time (t0) decreases for the PLA-GNS nanocomposites; therefore, we can infer that the scrolled conformation of GNS aided the induction period for PLA chains to adsorb and orient on the GNS curved surface. Relative crystallinity plots for pure PLA and PLA-GNS nanocomposites depict the different phases of crystallization occurring as a sigmoidal evolution (Figure 1b). The values of relative crystallinity are in the range of 0–100%, with 0% being the beginning, and 100% the impingement of crystals and crowding that occurs at the end stages of crystallization. The half time of crystallinity is the time at which X ( t ) is 0.5 or 50%, and in all cases the time it takes for the evolution to plateau is shortest in PLA-GNS when compared with pure PLA. GNS plays an active role in the crystal growth and nucleation by reducing the activation energy and acting as the surface on which PLA can orient its chains and assist in helical chain packing. The log-log plots in Figure 1c depict the linear portions of the relative crystallinity plots, and the Avrami exponent and rates are obtained from the slope and intercept, respectively.
The n values obtained for pure PLA and PLA-GNS nanocomposites are in the ranges of 2.1–2.3 and 2.1–3.6, respectively (Table 1). This indicates that GNS has an evident nucleating effect on PLA, because the n depicts the dimensionality of inner crystal growth and structure. From the n values obtained, PLA-GNS nanocomposites followed three-dimensional heterogeneous nucleation and sporadic growth [26].

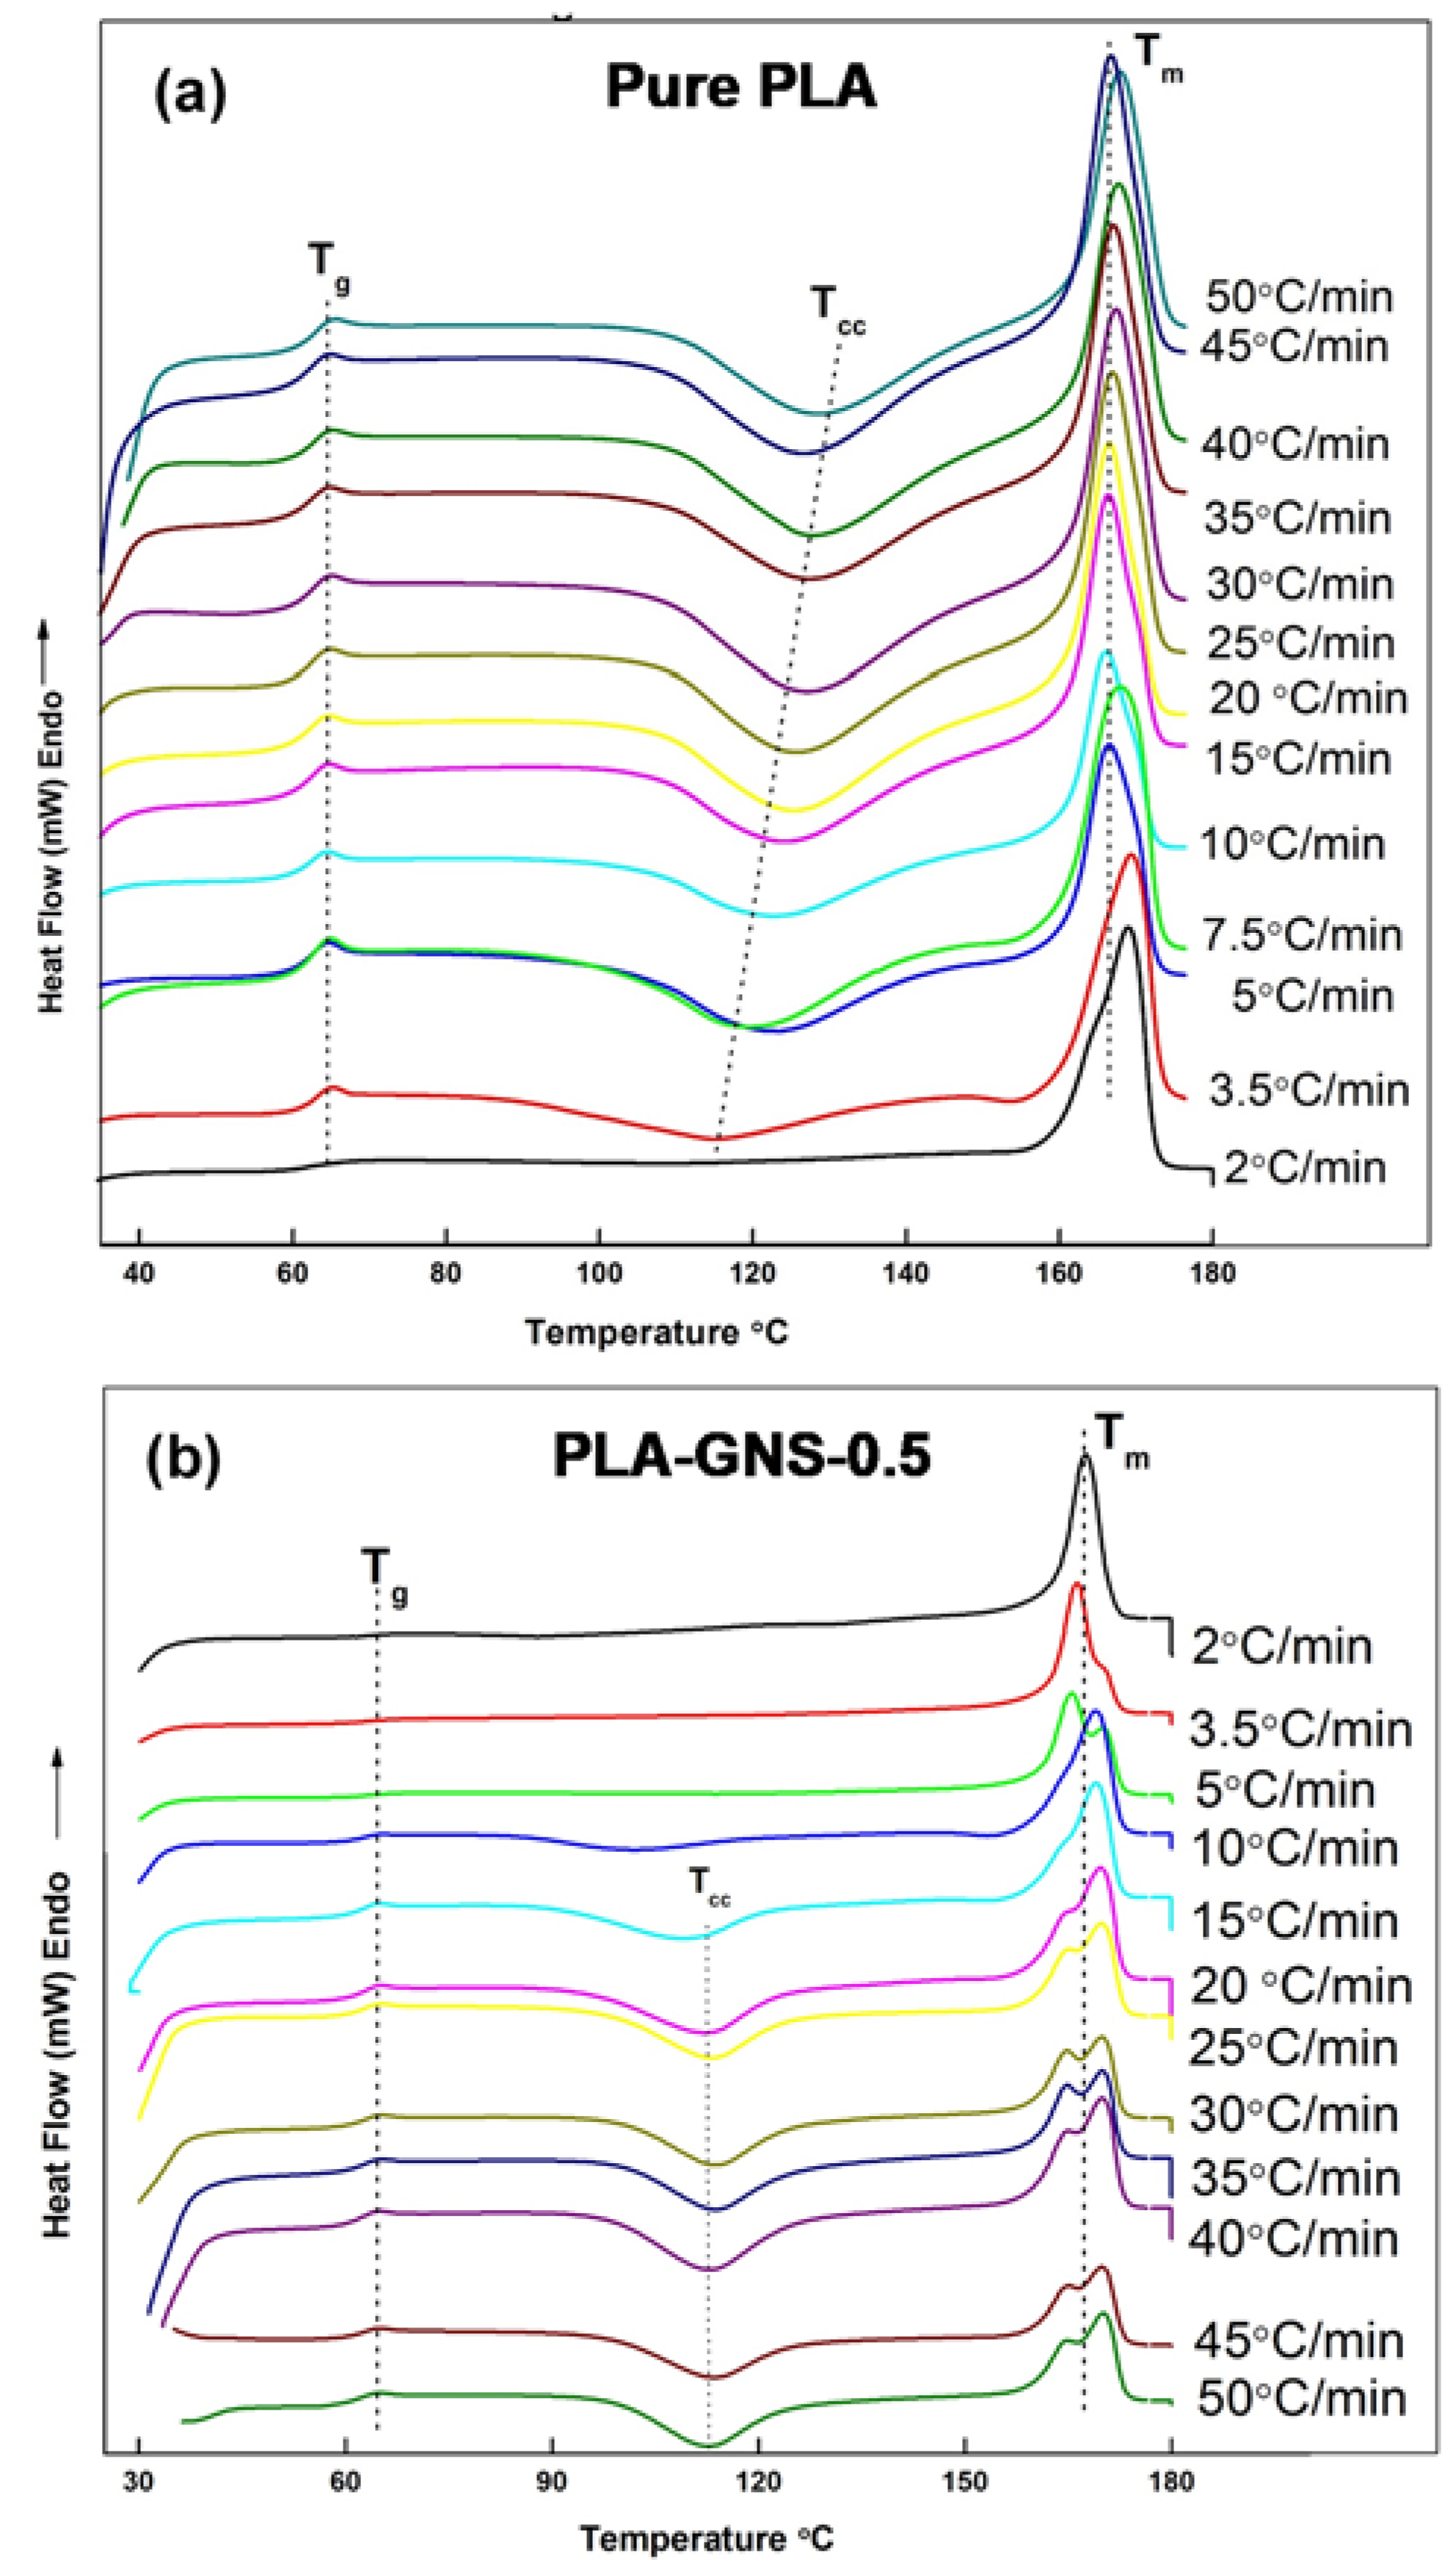
3.2. Non-Isothermal Crystallization Studies

Nonisothermal crystallization of pure PLA and PLA-GNS nanocomposites was analyzed with scan rates ranging from 2 to 50 °C min−1. It is essential to understand the kinetics of nonisothermal crystallization because most polymer processing applications are carried out under nonisothermal conditions. PLA is known to crystallize very slowly; therefore, we quantified the role of GNS in the polymer matrix during nonisothermal conditions.
Figure 2 presents second melting curves for pure PLA and PLA-GNS-0.5, and thermal parameters are summarized in Table 2. Firstly, pure PLA melting endotherms possessed single peaks, Tm1, and cold crystallization (Tcc), which is marked by an increased intensity and a broad area with increasing cooling rates (Figure 2a).
By comparison, the presence of double melting peaks (at higher cooling rates) in PLA-GNS-0.5, as seen in Figure 2b, is due to the presence of disordered α’-crystals. The formation of these crystals is kinetically favored compared to the ordered and stable α-crystals. Lower temperatures favor the disordered α’-crystals, whereas higher temperatures favor the ordered α-crystal [27]. Moreover, for PLA-GNS-0.5 there is an absence of cold crystallization peaks, Tcc, until the cooling rate increases to 10 °C min−1, which is due to the phase transition occurring from α’ to α-crystals during the melting process. This suggests that GNS enhanced nucleation and crystal growth in PLA as cooling rates increased. Maximum crystallinity was observed at about 49% for PLA-GNS-0.1 at a cooling rate of 2 °C min−1 compared to pure PLA at 33%. The glass transition temperatures, Tg, listed in Table 2 for pure PLA and PLA-GNS nanocomposites are 62.7 ± 1.7 °C. Results indicate that the presence of GNS in the polymer matrix has little to no effect on the glass transition temperature. Previous research reports similar observations [28].
The Avrami model describes the free growth of crystals prior to impingement, which were obtained for relative crystallinity, X ( t ) , at 10–50%. The rate constant, k, and exponent, n, determined from the slope and intercept, respectively, are listed in Table 3. A relationship between the crystallization temperatures T extracted from DSC and time t is given by Equation (5) during non-isothermal crystallization. The relationship between crystallization time, t, and corresponding temperature during the nonisothermal crystallization is represented as:
t = T 0 T ϕ
where T0 is the onset of crystallization, T is the temperature at crystallization time t, and ϕ is the cooling rate [28].
For pure PLA, the dimensionality of growth for the nonisothermal process is seen in n values in the range of 1.24–2.79, as seen in Table 3, and PLA-GNS nanocomposites, with n values in the range of 1.96–4.4. These values also decreased at faster cooling rates due to higher undercooling. PLA has a very slow crystallization rate, however, at a cooling rate of 2 °C min−1, and the half time of crystallization, t1/2, was 30.25 min for pure PLA and 28.2 min for PLA-GNS-0.1. The enhanced crystallization rate was even more evident at higher scan rates, such as at 3.5 °C min−1, where the t1/2 of pure PLA was 23.05 min and of PLA-GNS-0.1 was 17.77 min. GNS plays a heterogeneous nucleating role by reducing the activation energy required for surface nucleation to occur, and aiding polymer diffusion and packing on the nanoparticle.

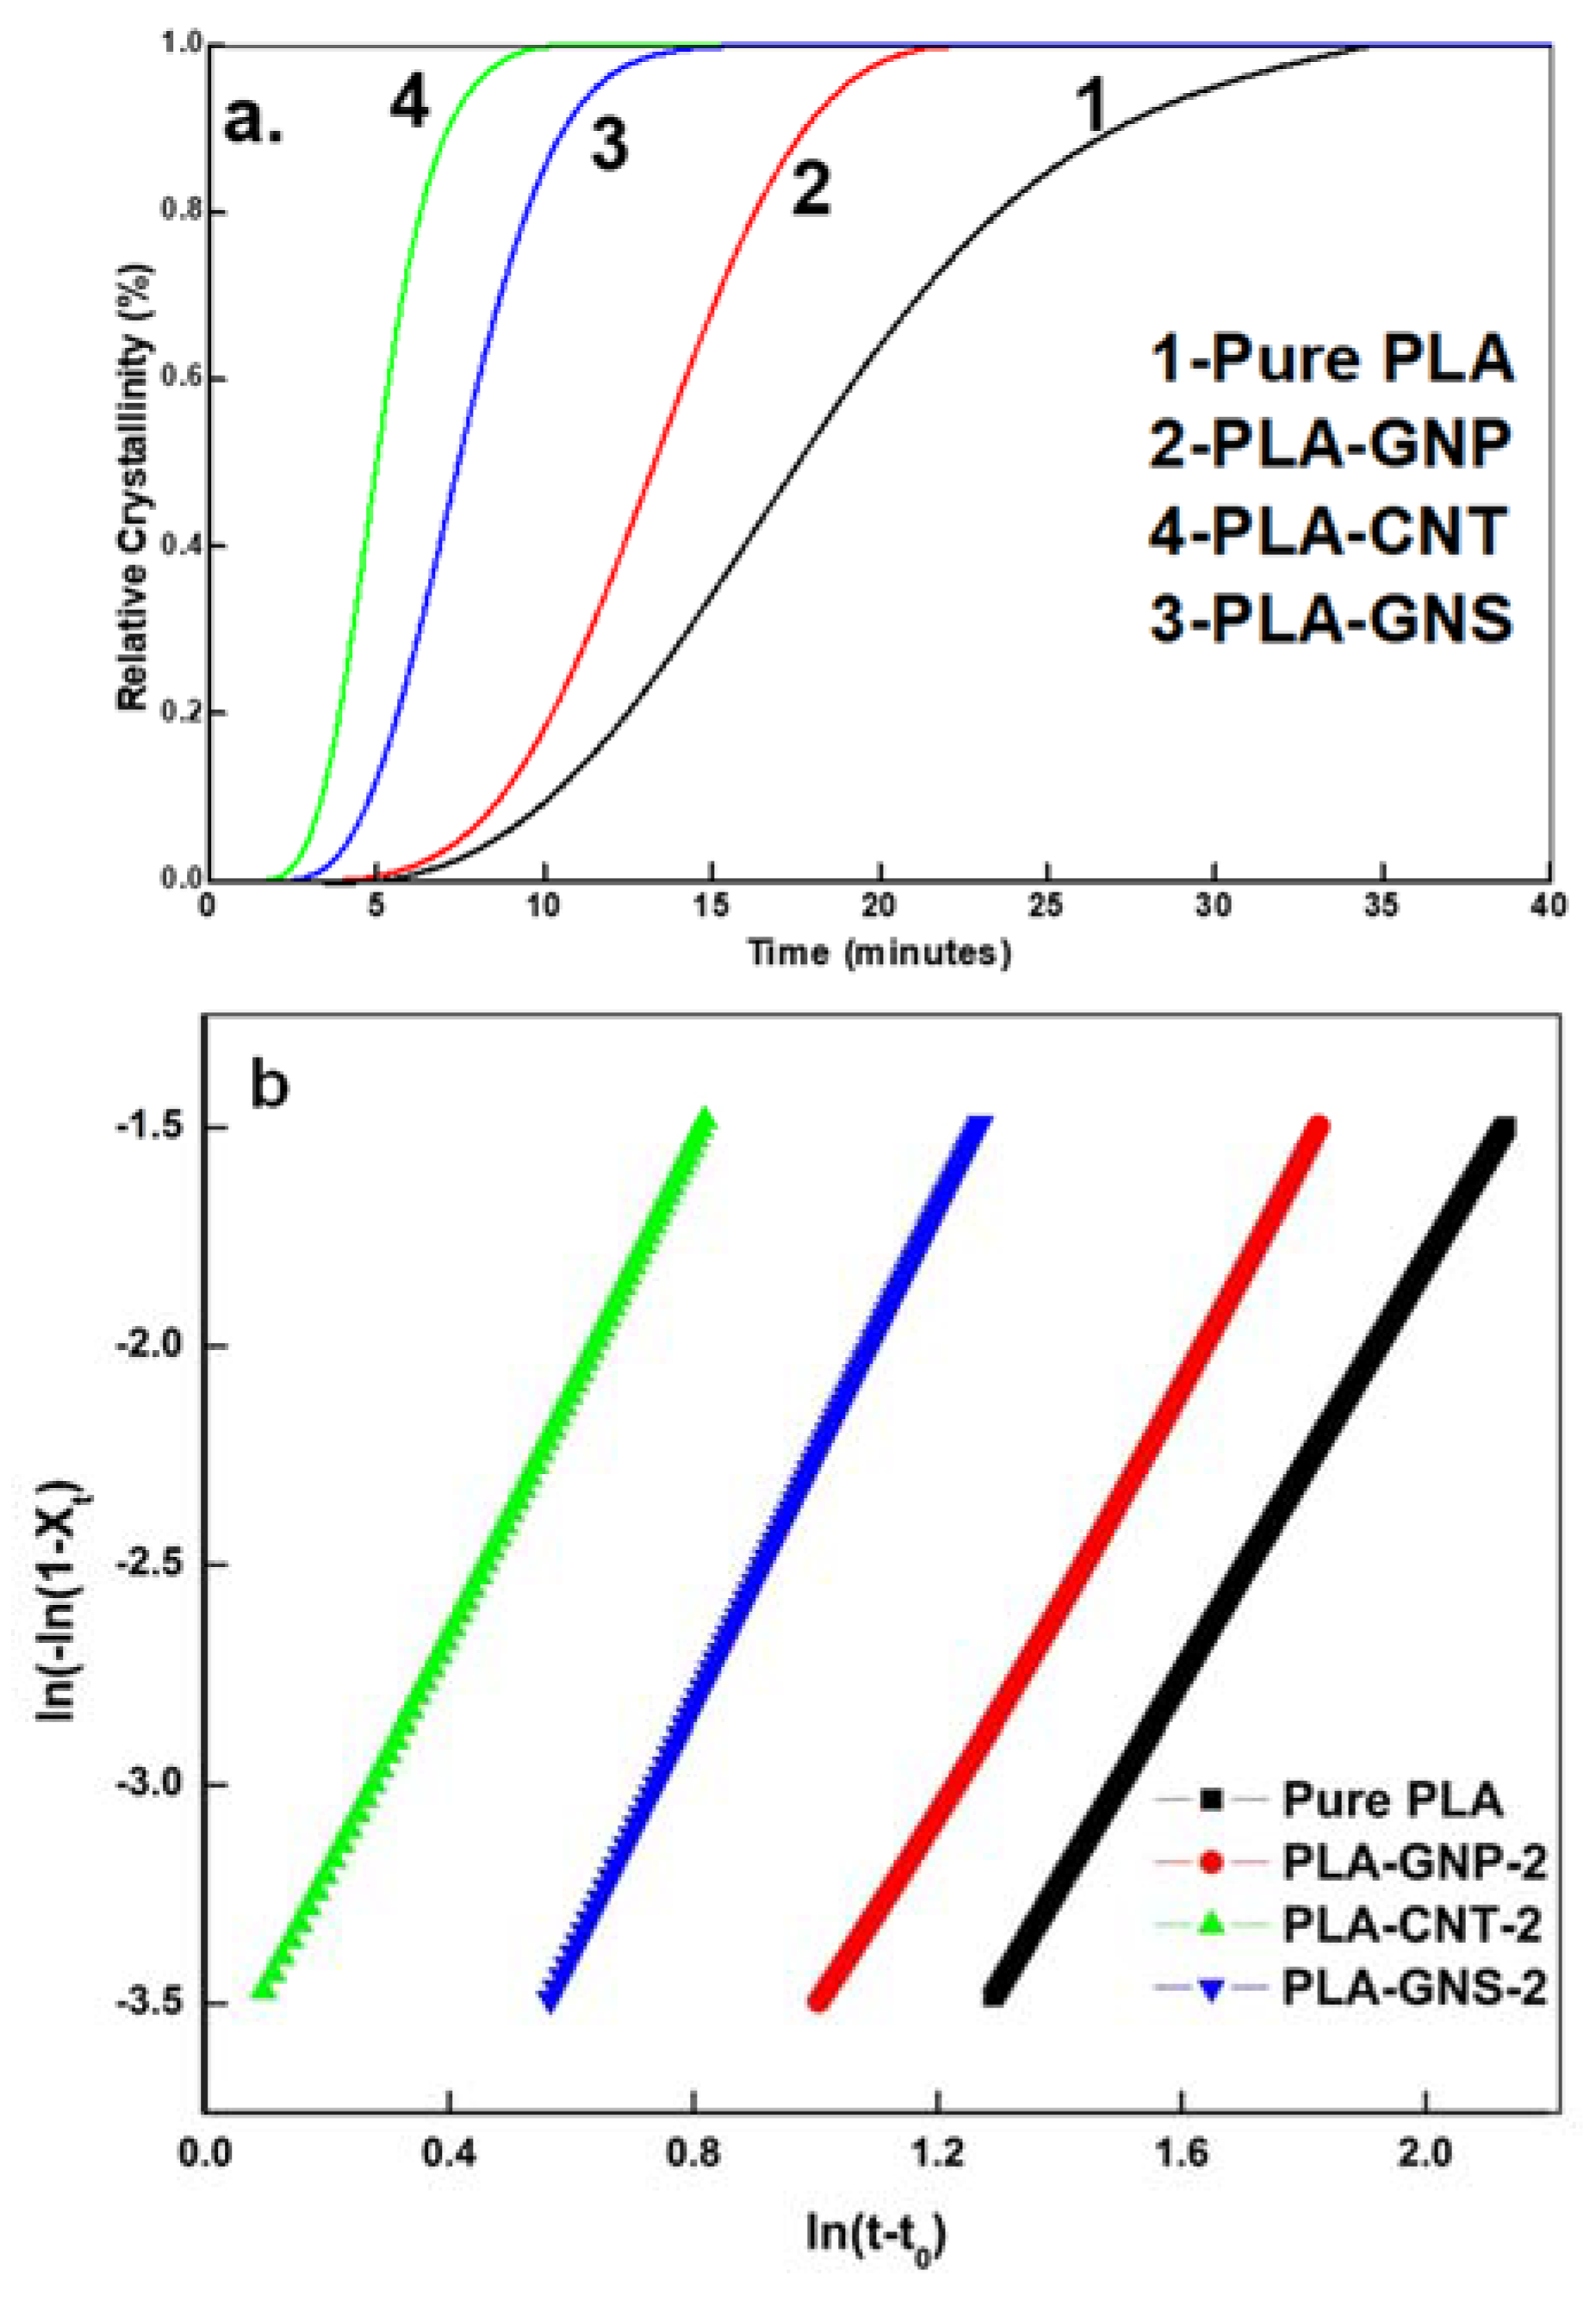
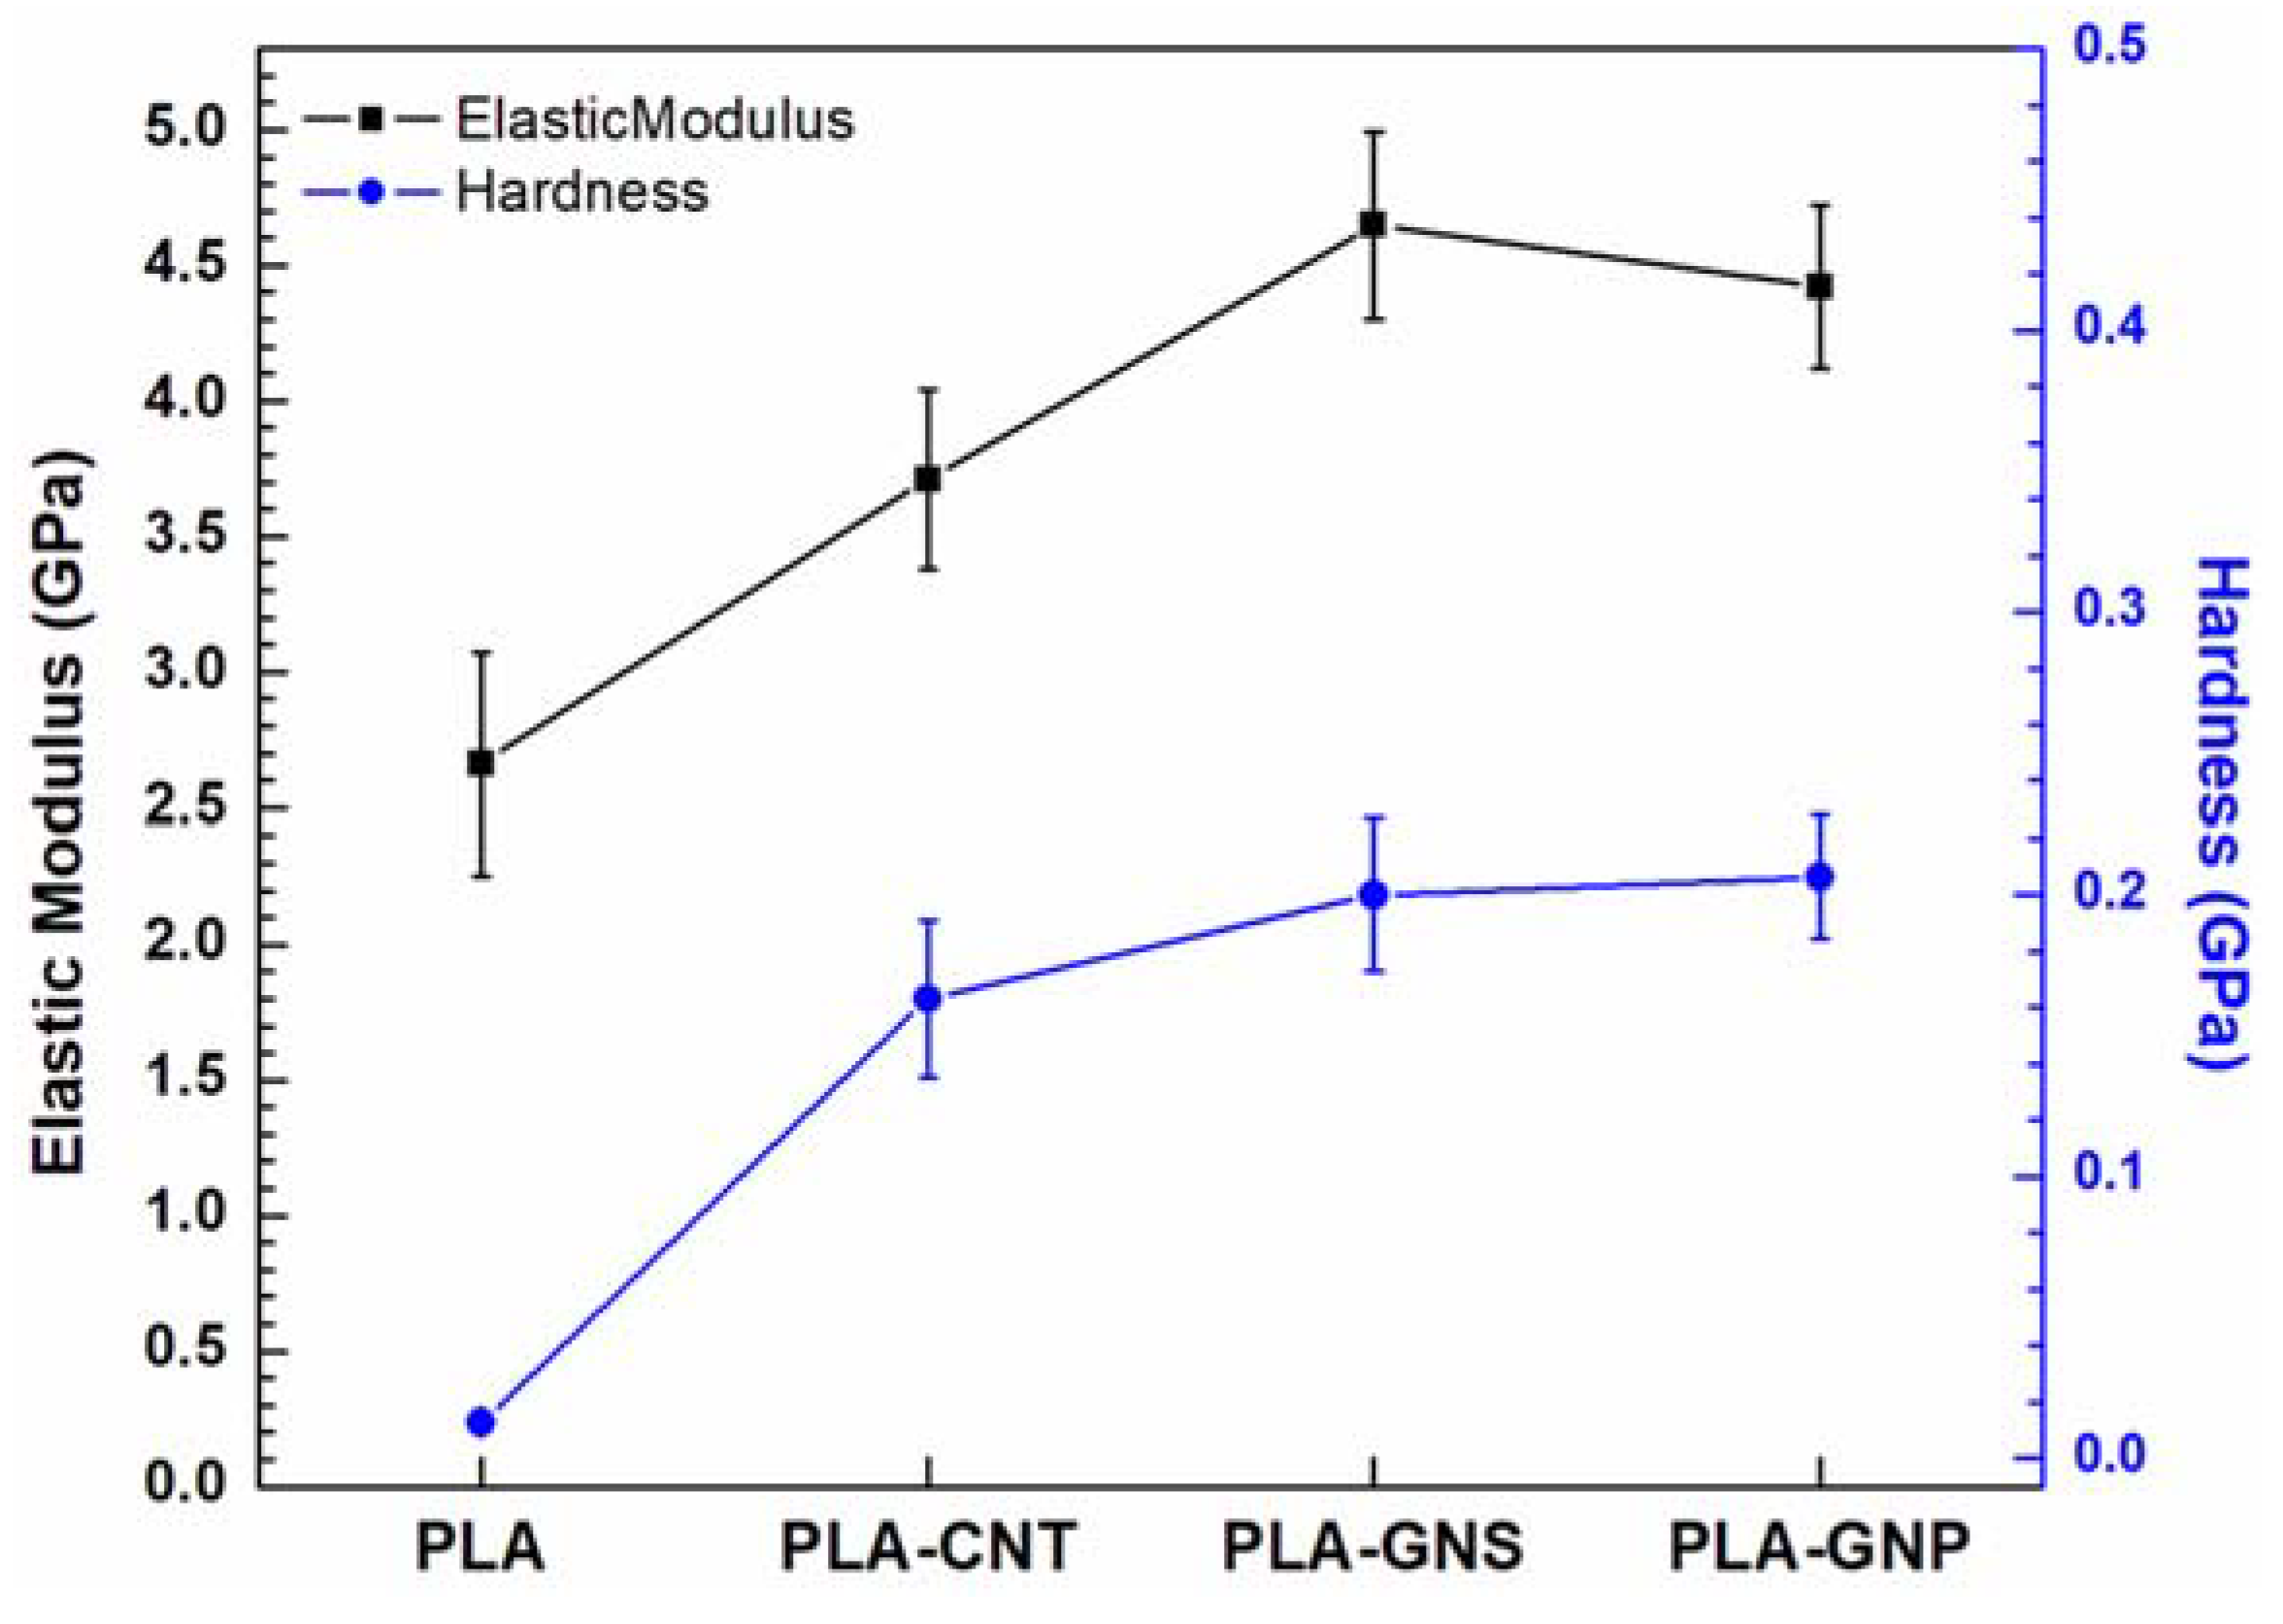
3.3. Comparative Analysis of PLA-GNS, PLA-CNT, PLA-GNP

Structurally, GNPs, CNTs, and GNS are made up of graphite layers, and therefore have the same fundamental structural unit [29]. GNPs have a two-dimensional surface made up of several atom layers of graphene sheets, whereas CNTs consist of curled graphite layers with two half fullerenes capping either end of the tube [30]. A GNS, which is very similar to a CNT, is a one-dimensional nanoparticle made up of rolled-or-scrolled GNPs with open ended tubular topology. In order to investigate the influence of the varying dimensional features of these nanoparticles on the crystallization behavior of PLA, isothermal crystallization was quantified to compare the crystallization kinetics of PLA induced by these three nanoparticles having different dimensions.
In order to compare the crystallization kinetics, the primary crystallization of PLA incorporated with GNPs, CNTs, and GNS was modelled using the Avrami equation. Figure 3a,b depicts the relative crystallinity curves and log-log plots of pure PLA, PLA-GNP, PLA-CNT, and PLA-GNS. As indicated in Table 4 and Figure 3a,b, crystallization occurs much faster in PLA-CNT with a half time of crystallization, t1/2, = 5 min. This may be due to the large surface curvature of CNT having a diameter of ~2 nm, which allows polymer chains to orient along the tube axis. This leads to a phenomenon called soft epitaxy, in which strict lattice matching is not required [31].
The planar geometry and scrolled architecture of GNPs and GNS are shown in the Supplementary Figure S1a,b, respectively. Similarly, the morphology of pure PLA and PLA-GNS is shown in Figure S1c,d. Geometric confinement plays a major role because it dictates the polymer chain orientation on the nanoparticle with high surface curvature. Compared to the GNS and CNT, the GNP is a 2D flat surface with no surface curvature; hence, polymer chains would require strict lattice matching and epitaxy as the main growth mechanism. The epitaxial growth of polymer crystals leads to different orientations of the polymer chains, thereby increasing the rate of crystallization [31]. The Avrami exponent, n, depicts the multidimensionality of crystal growth with the addition of the heterogeneous nucleating agents. The requirement for strict lattice matching may have resulted in the decline in crystal nucleation and growth in the GNP due to low surface curvature. This is because of the confined nucleation and growth of PLA lamella between the GNP layers [32]. PLA chains absorbed on the surface of GNP needed more time to adjust their conformation, making the nucleation process more complex and decreasing the rate of crystallization; thus, t1/2 was larger in PLA-GNP at ~13 min. Further, due to the variation in the diameters of the GNS, geometric confinement would have played a role in areas of smaller diameter, d2, and strict lattice matching and size-dependent epitaxy in areas of larger diameter, d1. It has previously been found that the overall kinetics of crystallization was accelerated by both graphene and CNTs; however, the ability to accelerate was much stronger for CNTs than that for graphene [29,30]. Our results indicated that the crystallinity is affected by the better interfacial adhesion between the PLA and GNS, whereas the crystallization half time (t1/2) is controlled by epitaxy; the scrolled GNS surface helps in the crystallization, whereas the time to crystallize was intermediate in the CNTs and GNPs.
A mechanical comparison using the load control nanoindentation technique was undertaken to test the elastic modulus and hardness of pure PLA and PLA-GNS-0.5 using the Oliver and Phar method (Figure 4). Incorporating GNS in PLA increases the elastic modulus by 81% to 4.7 GPa and hardness by 90% in the polymer nanocomposite. CNT improved elastic modulus by ~42% and hardness by 70%, whereas GNP increased the elastic modulus and hardness by ~69% and 95%, respectively.
GNS possesses higher structural stability, which provides it with the capability to overcome non-uniform dispersion and poor adhesion of their planar and tubular counterparts. Unlike the bamboo-like compartments of CNTs, the continuity of a rolled-up graphene sheet provides a uniform response with superior mechanical, thermal, and electrical properties. PLA is known to fail by crazing and has low resistance to crack initiation and propagation. Moreover, in PLA nanohybrids, crystallites can be stress concentration initiators and decrease impact strength. Cracks propagate through each uniformly distributed nanofiller, resulting in dissipation of energy throughout the polymer matrix, because the cracks must pass through the nanofillers while adhering well to the PLA matrix. Because strong interface favors the increase in energy absorption by nanofillers, the greatest improvement was observed in PLA-GNS because GNS presented a better interface with PLA than CNTs and GNPs. Similar to crazes, defects at interfaces dissipate energy. We previously reported that GNS provides a scrolled surface with higher strained surface, which not only provides a better interface, but also facilitates trans-crystallization, resulting in a trans-crystalline layer of PLA on GNS [19]. This is evident by the planar and wrapped surface morphology of crystallized PLA on GNS (Figure S2d). Trans-crystallization is known to avoid crazing propagation [33]. Thus, the presence of GNS diminishes the apparition of crazes, defects, and voids, which normally dissipate crack energy and increase impact strength.
He et al. suggests that GNS possesses superior adhesion due to the strain generated during scrolling within graphene monolayers [34]. Its well-defined radius of curvature builds up strain in the curved walls and, compared to planar pristine graphene, the adhesion force is 2.5-fold stronger and allows enhanced bonding interfaces between PLA and graphene. These obtained results strongly suggest GNS not only enhanced the elastic modulus and hardness of PLA, but its overall mechanical properties surpassed that of its PLA-CNT and PLA-GNP counterparts.

4. Conclusions

The incorporation of GNS as a nucleating agent accelerated the crystallization rate of the PLA under isothermal and non-isothermal conditions. The increase in the crystallization rates was reflected in the decreased induction time and half times of crystallization. The melting behavior of PLA-GNS nanocomposites suggested that GNS did not alter the polymorphic nature of PLA. During non-isothermal conditions, however, the inclusion of GNS resulted in the formation of imperfect α’-crystals. Overall crystallinity was enhanced in the polymer nanocomposite, suggesting that GNS assisted in the ordering of PLA chains. GNS, CNT, and GNP served as heterogeneous nucleating agents by shortening the induction time and accelerating the crystallization rate in the PLA matrix.

Supplementary Materials

The following are available online at https://0-www-mdpi-com.brum.beds.ac.uk/article/10.3390/c7040075/s1. Figure S1: Schematic illustration of the structure of graphene nanoscrolls indicating the smaller diameter (d1) and larger diameter (d2), Figure S2: Transmission electron micrographs of (a) graphene nanoplatelets (GNP), (b) graphene nanoscrolls (GNS) and scanning electron micrographs of (c) pure PLA and (d) PLA crystallized on GNS, Figure S3: FTIR spectra of pure PLA and its various nanohybrids with carbon nanoparticles, Figure S4: X-ray diffraction (XRD) patterns of pure PLA and its various nanohybrids with carbon nanoparticles.

Author Contributions

Conceptualization, O.A. and D.D.; methodology, O.A.; software, O.A., C.W., R.M., P.N.; validation, O.A., D.D., P.N. and R.M.; formal analysis, O.A.; investigation, O.A.; resources, D.D.; data curation, O.A.; writing—original draft preparation, O.A.; writing—review and editing, D.D.; visualization, O.A. and C.W.; supervision, D.D.; project administration, D.D.; funding acquisition, D.D. All authors have read and agreed to the published version of the manuscript.

Funding

This research was funded by Louisiana Board of Regents, grant number LEQSF (2020-21)-ENH-DE-20.

Conflicts of Interest

The authors declare no conflict of interest. The funders had no role in the design of the study; in the collection, analyses, or interpretation of data; in the writing of the manuscript, or in the decision to publish the results.

References

  1. Murariu, M.; Dubois, P. PLA composites: From production to properties. Adv. Drug Deliv. Rev. 2016, 107, 17–46. [Google Scholar] [CrossRef]
  2. Feng, Y.; Ma, P.; Xu, P.; Wang, R.; Dong, W.; Chen, M.; Joziasse, C. The crystallization behavior of poly(lactic acid) with different types of nucleating agents. Int. J. Biol. Macromol. 2018, 106, 955–962. [Google Scholar] [CrossRef]
  3. Farah, S.; Anderson, D.G.; Langer, R. Physical and Mechanical Properties of PLA, and Their Functions in Widespread Applications—A Comprehensive Review. Adv. Drug. Deliv. Rev. 2016, 107, 367–392. [Google Scholar] [CrossRef] [PubMed] [Green Version]
  4. Hamad, K.; Kaseem, M.; Yang, H.W.; Deri, F.; Ko, Y.G. Properties and medical applications of poly(lactic acid): A review. Express Polym. Lett. 2015, 9, 435–455. [Google Scholar] [CrossRef]
  5. Wachirahuttapong, S.; Thongpin, C.; Sombatsompop, N. Effect of PCL and compatibility contents on the morphology, crystallization and mechanical properties of PLA/PCL blends. Energy Procedia 2016, 89, 198–206. [Google Scholar] [CrossRef] [Green Version]
  6. Saeidlou, S.; Huneault, M.A.; Li, H.; Park, C.B. Poly(lactic acid) crystallization. Prog. Polym. Sci. 2012, 37, 1657–1677. [Google Scholar] [CrossRef]
  7. Li, H.; Huneault, M.A. Effect of nucleation and plasticization on the crystallization of poly(lactic acid). Polymer 2007, 48, 6855–6866. [Google Scholar] [CrossRef] [Green Version]
  8. Nampoothiri, K.M.; Nair, N.R.; John, R.P. An overview of the recent developments in polylactide (PLA) research. Bioresour. Technol. 2010, 101, 8493–8501. [Google Scholar] [CrossRef]
  9. Castro-Aguirre, E.; Iniguez-Franco, F.; Samsudin, H.; Fang, X.; Auras, R. Poly(lactic acid)—Mass production, processing, industrial applications, and end of life. Adv. Drug Deliv. Rev. 2016, 107, 333–366. [Google Scholar] [CrossRef] [PubMed] [Green Version]
  10. Zheng, B.; Xu, Z.; Gao, C. Mass production of graphene nanoscrolls and their application in high rate performance supercapacitors. Nanoscale 2016, 8, 1413–1420. [Google Scholar] [CrossRef]
  11. Dhar, P.; Gaur, S.S.; Kumar, A.; Katiyar, V. Cellulose nanocrystal templated graphene nanoscrolls for high performance supercapacitors and hydrogen storage: An experimental and molecular simulation study. Sci. Rep. 2018, 8, 1–15. [Google Scholar] [CrossRef] [Green Version]
  12. Zheng, B.N.; Gao, C. Preparation of graphene nanoscrolls/poly(aniline) composites and their use in high performance super capacitors. New Carbon Mater. 2016, 31, 315–320. [Google Scholar] [CrossRef]
  13. Xu, Z.; Zheng, B.; Chen, J.; Gao, C. Highly efficient synthesis of neat graphene nanoscrolls from graphene oxide by well-controlled lyophilization. Chem. Mater. 2014, 26, 6811–6818. [Google Scholar] [CrossRef]
  14. Zhao, J.; Yang, B.; Yang, Z.; Zhang, P.; Zheng, Z.; Ren, W.; Yan, X. Facile preparation of large-scale graphene nanoscrolls from graphene oxide sheets by cold quenching in liquid nitrogen. Carbon 2014, 79, 470–477. [Google Scholar] [CrossRef]
  15. Gao, Y.; Chen, X.; Xu, H.; Zou, Y.; Gu, R.; Xu, M.; Jen, A.K.Y.; Chen, H. Highly efficient fabrication of nanoscrolls from functionalized graphene oxide by Langmuir Blodgett method. Carbon 2010, 48, 4475–4482. [Google Scholar] [CrossRef]
  16. Li, H.; Papadakis, R.; Jafri, S.H.M.; Thersleff, T.; Michler, J.; Ottosson, H.; Leifer, K. Superior adhesion of graphene nanoscrolls. Commun. Phys. 2018, 1, 44. [Google Scholar] [CrossRef]
  17. Chen, X.; Li, L.; Sun, X.; Kia, H.G.; Peng, H. A novel synthesis of graphene nanoscrolls with tunable dimension at a large scale. Nanotechnology 2012, 23, 055603. [Google Scholar] [CrossRef]
  18. Liu, M.; Zhao, Q.; Wang, Y.; Zhang, C.; Mo, Z.; Cao, S. Melting behaviors, isothermal and non-isothermal crystallization kinetics of nylon 1212. Polymer 2003, 44, 2537–2545. [Google Scholar] [CrossRef]
  19. Ajala, O.; Werther, C.; Nikaeen, P.; Singh, R.P.; Depan, D. Influence of graphene nanoscrolls on the crystallization behavior and nano-mechanical properties of poly(lactic acid). Polym. Adv. Technol. 2019, 30, 1825–1835. [Google Scholar] [CrossRef]
  20. Bianchi, O.; Oliveira, R.V.B.; Fiorio, R.; Martins, J.D.N.; Zattera, A.J.; Canto, L.B. Assessment of Avrami, Ozawa and Avrami–Ozawa equations for determination of EVA crosslinking kinetics from DSC measurements. Polym. Test. 2008, 27, 722–729. [Google Scholar] [CrossRef]
  21. Jiang, X.L.; Luo, S.J.; Sun, K.; Chen, X.D. Effect of nucleating agents on crystallization kinetics of PET. Express Polym. Lett. 2007, 1, 245–251. [Google Scholar] [CrossRef]
  22. Wu, D.; Cheng, Y.; Feng, S.; Yao, Z.; Zhang, M. Crystallization behavior of polylactide/graphene composites. Ind. Eng. Chem. Res. 2013, 52, 6731–6739. [Google Scholar] [CrossRef]
  23. Lorenzo, A.T.; Arnal, M.L.; Albuerne, J.; Müller, A.J. DSC isothermal polymer crystallization kinetics measurements and the use of the Avrami equation to fit the data: Guidelines to avoid common problems. Polym. Test. 2007, 26, 222–231. [Google Scholar] [CrossRef]
  24. Barrau, S.; Vanmansart, C.; Moreau, M.; Addad, A.; Stoclet, G.; Lefebvre, J.M.; Seguela, R. Crystallization behavior of carbon nanotube-polylactide nanocomposites. Macromolecules 2011, 44, 6496–6502. [Google Scholar] [CrossRef]
  25. Kummara, S.; Tashiro, K.; Monma, T.; Horita, K. Isotope Effect on the Melt–Isothermal Crystallization of Polyoxymethylene D/H Random Copolymers and D/H Blend Samples. Macromolecules 2015, 48, 8070–8081. [Google Scholar] [CrossRef]
  26. Sperling, L.H. Introduction to Physical Polymer Science, 4th ed.; John Wiley & Sons, Inc.: Hoboken, NJ, USA, 2005. [Google Scholar]
  27. Kawai, T.; Rahman, N.; Matsuba, G.; Nishida, K.; Kanaya, T.; Nakano, M.; Okamoto, H.; Kawada, J.; Usuki, A.; Honma, N.; et al. Crystallization and melting behavior of poly(L-lactic acid). Macromolecules 2007, 40, 9463–9469. [Google Scholar] [CrossRef]
  28. Wang, H.; Qiu, Z. Crystallization behaviors of biodegradable poly(L-lactic acid)/graphene oxide nanocomposites from the amorphous state. Thermochim. Acta 2011, 526, 229–236. [Google Scholar] [CrossRef]
  29. Xu, Z.; Niu, Y.; Yang, L.; Xie, W.; Li, H.; Gan, Z.; Wang, Z. Morphology, rheology and crystallization behavior of polylactide composites prepared through addition of five-armed star polylactide grafted multiwalled carbon nanotubes. Polymer 2010, 51, 730–737. [Google Scholar] [CrossRef]
  30. Xu, J.Z.; Chen, T.; Yang, C.L.; Li, Z.M.; Mao, Y.M.; Zeng, B.Q.; Hsiao, B.S. Isothermal crystallization of poly(L-lactide) induced by graphene nanosheets and carbon nanotubes: A comparative study. Macromolecules 2010, 43, 5000–5008. [Google Scholar] [CrossRef]
  31. Li, L.; Li, C.Y.; Ni, C. Polymer crystallization-driven, periodic patterning on carbon nanotubes. J. Am. Chem. Soc. 2006, 128, 1692–1699. [Google Scholar] [CrossRef]
  32. Xin, S.; Li, Y.; Zhao, H.; Bian, Y.; Li, W.; Han, C.; Dong, Q.; Ning, Z.; Dong, L. Confinement crystallization of poly(lactide) induced by mutiwalled carbon nanotubes and graphene nanosheets. J. Therm. Anal. Calor. 2015, 122, 379–391. [Google Scholar] [CrossRef]
  33. Zafeiropoulos, N.E.; Baillie, C.A.; Matthews, F.L. A study of transcrystallinity and its effect on the interface in flax fiber reinforced composite materials. Composite A Appl. Sci. Manufact. 2015, 32, 525–543. [Google Scholar] [CrossRef]
  34. He, Y.; Chen, W.F.; Yu, W.B.; Ouyang, G.; Yang, G.W. Anomalous interface adhesion of graphene membranes. Sci. Rep. 2013, 3, 2660. [Google Scholar] [CrossRef] [PubMed]
Figure 1. (a) Schematic illustration of extraction of the Avrami exponent, (b) relative crystallinity vs. time as obtained from the Avrami equation, and (c) log plots of PLA and its nanohybrids.
Carbon 07 00075 g001
Figure 2. (a) DSC thermograms of pure PLA crystallized at various cooling rates, while (b) represents DSC thermograms of PLA-GNS nanohybrid at various cooling rates.
Carbon 07 00075 g002
Figure 3. (a) Relative crystallinity vs. time plots of pure PLA and its hybrids with various nanoparticles; (b) log plots of PLA and its nanohybrids.
Carbon 07 00075 g003
Figure 4. Elastic modulus and hardness curves of pure PLA and its hybrids with various nanoparticles via the nanoindentation test.
Carbon 07 00075 g004
Table 1. Collated values of heat of fusion ( Δ H f ), degree of crystallinity (Xc), induction time (t0), and half time of crystallization (t1/2) and Avrami parameters for pure PLA and PLA-GNS nanocomposites at different isothermal crystallization temperatures, Tc.
SamplesTc (°C) Δ H f   ( J / g ) Xc (%)t0 (min)t1/2 (obs) (min)t1/2 (calc) (min)nk (min−n)
Pure PLA9038.040.84.0617.5817.652.371.44 × 10−3
10033.841.71.836.466.592.222.16 × 10−2
11033.336.01.706.346.492.182.29 × 10−2
PLA-GNS-0.19047.250.72.217.067.102.351.66 × 10−2
10039.642.51.353.523.442.967.84 × 10−2
11034.436.91.703.002.952.651.63 × 10−1
PLA-GNS-0.59056.660.71.496.786.642.511.14 × 10−2
10034.336.81.032.812.852.131.94 × 10−1
11038.541.41.032.602.522.762.32 × 10−1
PLA-GNS-19051.154.91.686.806.513.642.25 × 10−3
10042.145.21.353.103.032.791.62 × 10−1
11034.336.81.172.432.392.733.99 × 10−1
PLA-GNS-29050.153.82.097.477.382.846.12 × 10−3
10041.444.51.373.563.422.591.07 × 10−1
11033.636.01.242.242.282.246.37 × 10−1
Table 2. Thermal parameters of pure PLA and PLA-GNS nanocomposites at different cooling rates.
Sample ϕ
(°C min−1)
Tg (°C)Tm1 (°C)Tm2 (°C)Tcc (°C)ΔHf (J g−1)ΔHc (J g−1)Xc (%)
Pure PLA262.7168.9- 30.7 33.02
3.562.7169.3-115.235.7−16.520.58
562.3167.9-119.340.2−31.79.15
7.562.2166.5-123.630.2−29.30.98
1061.8166.1-123.024.0−21.22.99
1561.9166.4-124.329.6−29.6−0.09
2061.9166.5-125.531.4−32.1−0.72
2562.4166.9-125.933.2−30.82.58
3061.5166.7-126.633.1−32.50.63
3562.2167.4-127.135.4−33.71.81
4062.0167.0-127.432.5−31.01.61
4562.6167.6-128.030.3−32.8−2.78
5062.6168.0-128.429.7−24.35.77
PLA-GNS-0.1262.9167.6--45.3-48.61
3.563.7166.2--33.2-35.62
562.6165.1169.9-29.3-31.52
7.562.4168.9-105.440.8−11.831.17
1061.9168.3-101.037.1−9.929.23
1562.2165.3169.1115.432.5−30.22.52
2062.1165.0169.5117.034.5−33.01.63
2562.3165.1169.6116.433.4−35.9−2.75
3061.8164.6169.8114.129.5−30.7−1.29
3562.0164.3169.9113.931.3−32.7−1.49
4063.0164.8170.3114.430.6−30.9−0.27
4562.9165.8170.3117.336.6−41.2−4.98
5061.9165.1170.2114.834.5−37.4−3.14
PLA-GNS-0.5263.6167.3--39.9-42.87
3.562.7166.0--32.2-34.58
563.5165.4170.0-32.6-35.00
1062.7168.9-101.939.5−10.331.38
1562.4168.9-108.935.7−24.112.52
2062.4164.5169.6112.238.4−32.16.74
2562.3164.9169.8113.532.0−30.71.41
3062.3164.7169.8113.728.8−29.9−1.20
3562.5164.7170.0113.730.1−29.11.14
4062.5164.8169.8113.037.8−36.71.17
4562.8164.8169.8113.527.0−26.01.05
5062.6164.6170.1112.829.6−26.03.89
PLA-GNS-1262.4166.1--33.5-36.02
3.562.2165.5--36.0-38.71
563.5164.8169.8-23.5-25.25
7.561.0163.6169.0-31.2−3.030.29
1062.4164.3169.2111.335.0−23.512.37
1561.4163.4168.5111.133.5−13.821.20
2062.7164.2170.0111.631.6−25.96.06
2562.3164.2169.6113.429.2−23.26.46
3062.6165.0170.3111.948.0−47.01.07
3562.4164.6170.3113.835.1−37.3−2.33
4062.7165.0170.4114.729.9−29.50.45
4562.8165.0170.3115.236.1−37.1−1.11
5062.5163.9170.0112.636.9−38.2−1.39
PLA-GNS-2264.4166.9--33.2-35.70
3.563.0165.3169.8-28.2-30.31
562.9165.0170.1-31.4-33.77
7.562.0164.6169.4-24.5−2.124.07
1062.3-168.6105.835.5−15.421.55
1562.3-169.2109.537.2−22.615.66
2061.9-169.7110.436.6−30.66.42
2562.1163.8169.8112.032.0−27.84.49
3062.1163.8169.8110.825.9−23.92.14
3562.3164.7170.3113.945.1−41.43.89
4061.7162.8169.3109.022.7−19.83.18
4562.6163.3169.8110.527.8−27.00.86
5062.6163.5170.4109.738.7−35.73.16
Table 3. Avrami parameters, n and k, of pure PLA and PLA-GNS nanocomposites at selected cooling rates.
ϕ (°C min−1)SamplenkR2t1/2
2Pure PLA1.811.54 × 10−30.999930.25
PLA-GNS-0.13.765.19 × 10−3128.82
PLA-GNS-0.54.322.56 × 10−30.999829.2
PLA-GNS-13.464.00 × 10−3130.32
PLA-GNS-22.728.30 × 10−30.993530.6
3.5Pure PLA2.795.37 × 10−20.99923.05
PLA-GNS-0.14.047.23 × 10−3117.77
PLA-GNS-0.53.561.02 × 10−1117.97
PLA-GNS-13.458.32 × 10−20.999918.42
PLA-GNS-23.476.99 × 10−2118.42
5Pure PLA1.247.07 × 10−20.998515.73
PLA-GNS-0.13.18.70 × 10−10.999913.33
PLA-GNS-0.52.942.40 × 10−10.993114.32
PLA-GNS-14.49.30 × 10−20.99813.78
PLA-GNS-24.113.55 × 10−10.999613.32
7.5Pure PLA1.551.85 × 10−10.997512.73
PLA-GNS-0.12.636.43 × 10−20.999910.62
PLA-GNS-0.52.143.87 × 10−1110.07
PLA-GNS-12.897.29 × 10−20.99819.72
PLA-GNS-22.978.52 × 10−20.99949.6
10Pure PLA2.343.08 × 1000.998311.5
PLA-GNS-0.12.748.97 × 10018.33
PLA-GNS-0.52.791.12 × 1010.99978.25
PLA-GNS-12.526.81 × 1000.99778.57
PLA-GNS-22.571.09 × 1010.99918.55
Table 4. Thermal parameters for isothermal crystallization at Tc = 90 of pure PLA, PLA-GNS, PLA-GNP, and PLA-CNT.
SchemeParametersPLA-GNSPLA-CNTPLA-GNP
n 2.842.762.46
k (min−n)6.12 × 10−32.34 × 10−22.43 × 10⁻³
R210.99980.9989
t0 (minutes)5.43.49.2
t1/2 (minutes)7.5513.3
ΔHf (J g−1)51.343350.956648.3337
Xc (%)55.14954.73351.916
Tm (°C)168.35168.35167.97
Tg (°C)66.1364.465.5
Publisher’s Note: MDPI stays neutral with regard to jurisdictional claims in published maps and institutional affiliations.

