Article

Impact of Saccharomyces cerevisiae Strains on Health-Promoting Compounds in Wine

1
Department of Management of Agricultural, Food and Forestry Systems (GESAAF) P.le delle Cascine, 24, University of Florence, 50144 Florence, Italy
2
FoodMicroTeam s.r.l, Academic Spin-Off of University of Florence, Via Santo Spirito 14, 50125 Florence, Italy
3
Department of Biomedical, Experimental and Clinical Sciences “Mario Serio”, Viale Morgagni 50, University of Florence, 50134 Firenze, Italy
*
Author to whom correspondence should be addressed.
Submission received: 28 February 2018 / Revised: 4 April 2018 / Accepted: 5 April 2018 / Published: 9 April 2018
(This article belongs to the Special Issue Microbiota of Fermented Beverages)

Abstract

:
Moderate wine consumption is associated with human health benefits (reduction of cardiovascular risk and neurodegenerative diseases, decrease of onset of certain cancers) attributed to a series of bioactive compounds, mainly polyphenols, with antioxidant power capable of counteracting the negative action of free radicals. Polyphenols are naturally present in the grapes, but an additional amount originates during winemaking. The aim of this work was to assess the ability of four commercial and two indigenous Saccharomyces cerevisiae strains to produce bioactive compounds (tyrosol, hydroxytyrosol, tryptophol, melatonin and glutathione) during alcoholic fermentation. In order to exclude the fraction of antioxidant compounds naturally occurring in grapes, the strains were inoculated in a synthetic must. At the end of fermentation the bioactive compounds were analysed by High-Performance Liquid Chromatography, while antioxidant activity was measured by 2,2-diphenyl-1-picrylhydrazyl (DPPH) assay. Moreover, freeze-dried samples, originating from the experimental wines, were used to perform ex-vivo assays on cultured cells (RAW 264.7 murine macrophages) with the aim to evaluate their antioxidant and anti-inflammatory activities. The results indicated that the production of the considered bioactive compounds is a strain-specific property; therefore, the different yeast strains utilized during fermentation have different capabilities to modify the antioxidant and anti-inflammatory properties of the wine.

Graphical Abstract

1. Introduction

The possible effects of wine on human health have stimulated many studies in the last 30 years. The beginning dates back to 1992, when Renaud and de Lorgeril published a study in The Lancet [1] revealing that a higher wine consumption in the French population in comparison with other industrialized countries caused a lower incidence of coronary heart disease, despite the intake of high levels of saturated fat associated with the traditional French diet. This finding constituted the so-called “French paradox”. From then on, many epidemiological studies were carried out on wine demonstrating that individuals consuming daily moderate amounts of wine (i.e., 30 g of ethanol for men and 15 g for women), display a reduction of cardiovascular mortality and an improvement of antioxidant parameters, when compared with individuals who abstain or who drink alcohol to excess [2,3,4,5]. These health benefits are attributed to a series of phenolic compounds, mainly flavonoids (such as anthocyanins and flavan-3-ols) and non-flavonoids (such as resveratrol, cinnamates, and gallic acid), with antioxidant power capable of counteracting the negative action of free radicals. Actually, red wine is known as one of the most important sources of dietary polyphenols [6,7,8] and their health-promoting properties on several human disorders like cardiovascular and neurodegenerative diseases, some cancers, obesity, diabetes, allergies, and osteoporosis are reported in literature [7,9,10,11,12,13,14]. Phenolic compounds are naturally present in grape berries and seeds and their amounts are affected by wide range of factors involving grape variety, geopedological characteristics, climate and agronomical practices. Moreover, differences in phenolic content usually occur during the whole winemaking process as a consequence of oenological practices such as the fermentation temperature, maceration length, use of clarifying agents, oak-wood aging, duration of wine aging and storage procedures [4,15,16,17]. Finally, native phenols undergo modifications and other phenolic compounds are formed by either enzymatic reactions or metabolic activities of yeasts. Indeed, because of such reactions, during the winemaking process, and in particular during alcoholic fermentation, wines are enriched in molecules characterised by specific chemical and biological properties, thus leading to a greater number of bioactive compounds than those of corresponding grapes [15,18,19]. Some authors believe that the benefits due to polyphenols may be enhanced in wine due to ethanol produced during fermentation process that increases their bioavailability [4]. Therefore, wine, and in particular red wine, can be considered as a complex mixture containing phenolic and alcohol compounds that possess health-enhancing properties and are able to act synergistically to produce health benefits [3,7,14].
More recently, some studies focused on further bioactive compounds deriving from the yeast metabolism of aromatic amino acids during alcoholic fermentation including higher alcohols, such as tryptophol and tyrosol that originate from tyrosine, and melatonin, an indoleamine, synthesized from l-tryptophan [19,20,21]. Nevertheless, the contribution of Saccharomyces cerevisiae, the main yeast responsible for alcoholic fermentation, to producing these health-promoting compounds as well as their physiological effects have been poorly investigated [20].
Therefore, the aim of this study was at first to assess the ability of four commercial and two indigenous S. cerevisiae strains to produce bioactive compounds such as tyrosol, hydroxytyrosol, tryptophol and melatonin during alcoholic fermentation of a synthetic must, which was used in order to exclude the fraction of antioxidant compounds naturally occurring in grapes.
Moreover, reduced-glutathione, which is another important antioxidant compound occurring in grapes and wine, has been taken into consideration because its content seems to depend on the different quantities assimilated or secreted by various S. cerevisiae strains carrying out alcoholic fermentation [22,23]. After evaluating the content of the different bioactive compounds at the end of alcoholic fermentations, freeze-dried samples originating from the experimental wines, re-suspended in water, were utilized to perform ex-vivo assays on cultured cells (RAW 264.7 murine macrophages) with the aim to evaluate their antioxidant and anti-inflammatory activity.

2. Materials and Methods

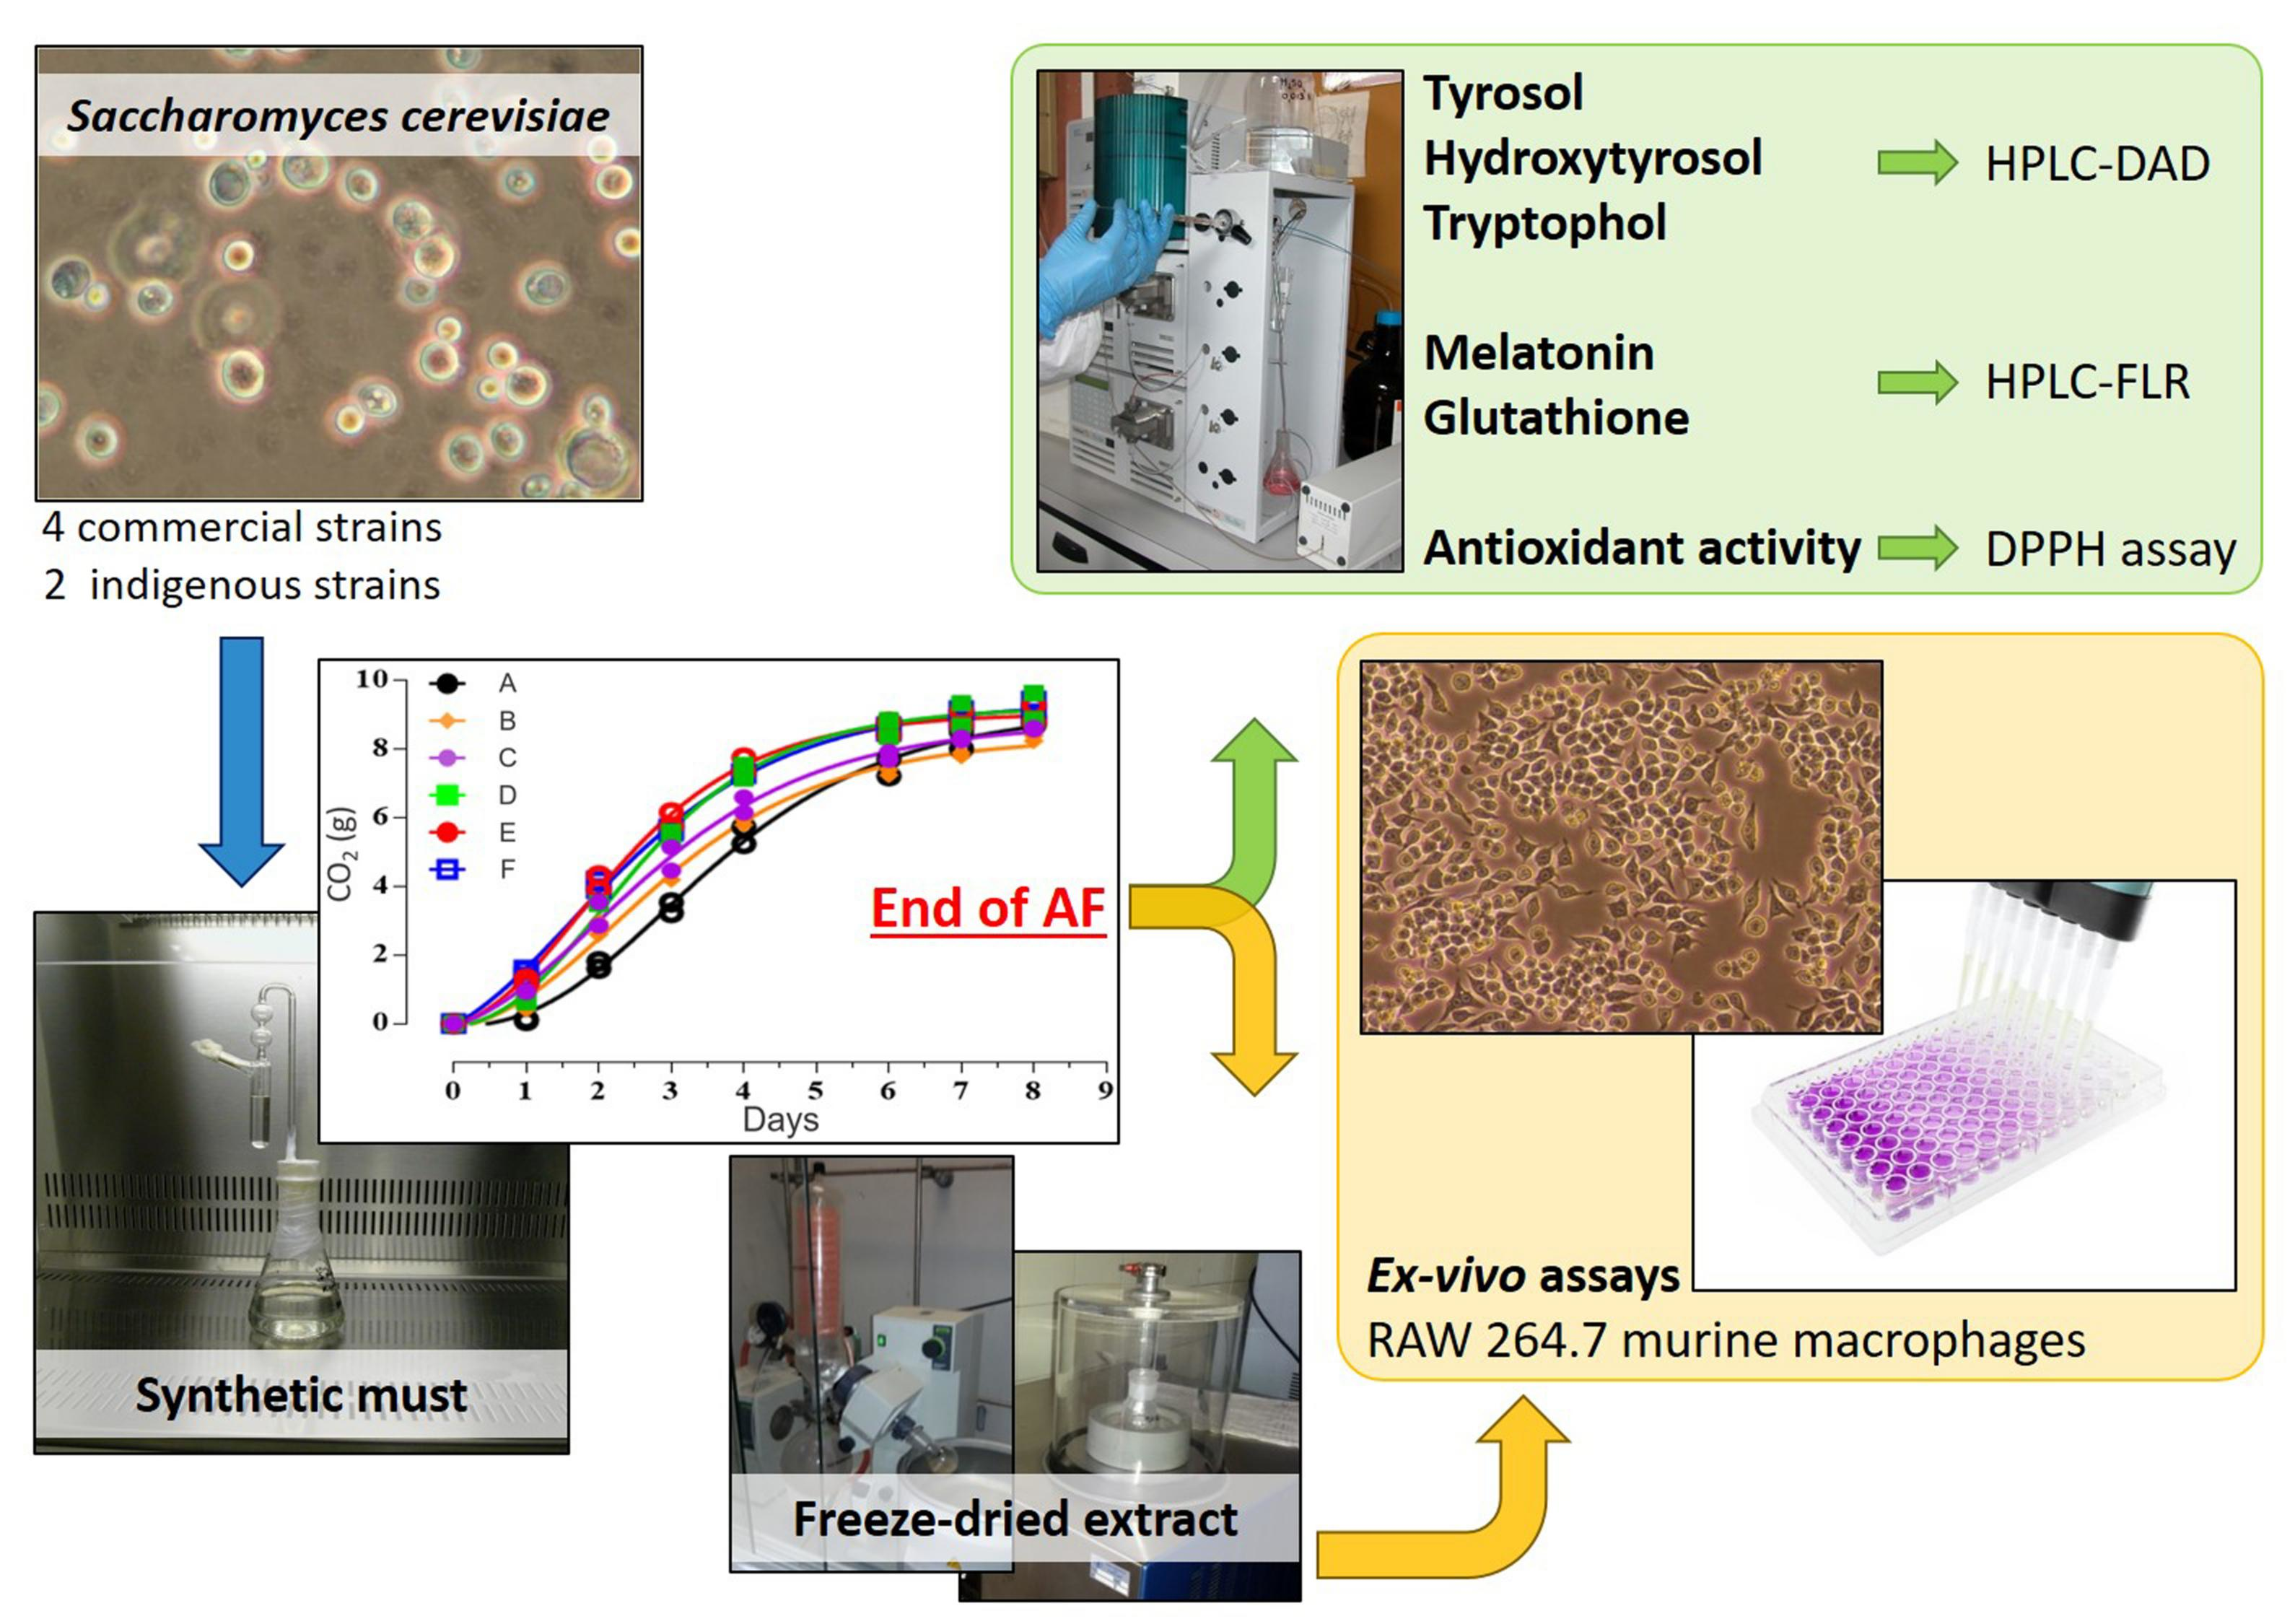
2.1. Experimental Design

The experimental design was structured as follows: 6 strains of Saccharomyces cerevisiae were used for the experimental fermentations of a synthetic medium carried out in triplicate. At the end of the alcoholic fermentation, after chemical characterizations, the three replicated samples were combined, and they were concentrated and lyophilized. Finally, the samples were used for the ex-vivo assays carried out in triplicates and each replicate was measured in duplicate.

2.2. Yeast Strains

Four commercial and two indigenous Saccharomyces cerevisiae strains were used. The commercial strains, commonly utilized as starter cultures in many Italian wineries, were: Lalvin BM45®, Lalvin EC1118® (Lallemand Inc., Montreal, QC, Canada), Premium® Zinfandel (Enologica Vason, Verona, Italy), and Zymaflore VL1® (Laffort, Alessandria, Italy). The two indigenous strains (S. cerevisiae R6 and S. cerevisiae P8) belonging to the yeast culture collection of the Department of Agricultural, Food and Forestry Systems (GESAAF, University of Florence, Florence, Italy) were isolated from spontaneous alcoholic fermentations.

2.3. Laboratory-Scale Fermentations

The medium used for laboratory-scale fermentations was the chemically defined grape juice medium reported in Table 1 of the Resolution OIV-OENO 370-2012 [24] but modified in sugar content, which was 200 g/L. The synthetic medium was buffered to pH 3.3 using HCl 1N and was sterilized by filtration. Fermentation experiments were carried out in duplicate in 250-mL Erlenmeyer flasks containing 160 mL of the medium. The flasks were inoculated with the S. cerevisiae strains in axenic cultures at the concentration of 1 × 10⁶ cells/mL from pre-cultures grown for 24 h in the same medium. After inoculation, the flasks were sealed with a Müller trap previously filled with sulphuric acid to allow only CO2 to evolve and they were incubated at 28 °C. The fermentation progress was followed by determining the weight loss due to CO2 release until the weight remained constant. The CO2 values, detected during the time for each fermentation, were fitted to the modified Gompertz model using using GraphPadPrism 5 (version 6.01, 2012, GraphPad software Inc., La Jolla, CA, USA). Every two hours, viable cells were determined by a Thoma counting chamber and fluorescence microscopy to monitor the yeast growth as reported by Granchi et al. [25]. At the end of fermentation, chemical analyses were performed by HPLC to quantify the carbohydrates degraded and the ethanol produced [26].

2.4. Chemical Analysis

2.4.1. Chemicals and Reagents

All the chemicals used in this study were of analytical grade. Acetonitrile, methanol and water were gradient grade and were purchased from Carlo Erba reagents (Milan, Italy). Acetone was purchased from Carlo Erba Reagents (Milan, Italy); iodoacetic acid, reduced glutathione (GSH), oxidized glutathione (GSSG), and melatonin, 1,1-Diphenyl-2-picryl-hydrazyl (DPPH), gallic acid from Sigma-Aldrich (Milan, Italy); dansyl chloride from EMD Millipore Corporation (USA, Affiliate of Merck KGaA, Darmstadt, Germany), Na2B4O7·10H2O from Merck (Darmstadt, Germany), CH3COONa from Fluka Chemie AG (Buchs, Switzerland), acetic acid from BDH Laboratory Supplies (Poole, UK), and chloroform and formic acid from J.T. Baker (Deventer, Holland).

2.4.2. Analysis of Tyrosol, Hydroxytyrosol and Tryptophol

Tyrosol, hydroxytyrosol and tryptophol were determined according to Hernández et al. [27]. After the extraction of the experimental wines with ethyl acetate and diethyl ether, the samples were injected in a HPLC (Varian Pro-star 210) equipped with a Diode Array Detector and a reversed phase column Chromsep Omnisphere (5 µm particle, 250 × 4.6 mm; Varian Inc., Lake Forest, CA, USA), maintained at 25 °C. The mobile phase comprised (A) acetonitrile and (B) 2% (v/v) acetic acid. The gradient program was the follow: 0–55 min, 100–80% B; 55–70 min, 80–50% B; 70–80 min, 50–5% B, followed by a washing phase carried out with acetonitrile and re-equilibration of the column from 110 to 125 min. The flow rate was 1 mL/min from the beginning to 60 min and 1.2 mL/min from this point to the end. The three higher alcohols were identified by scanning from 210 to 400 nm. Hydroxytyrosol was quantified using tyrosol as a standard.

2.4.3. Analysis of Melatonin

The HPLC apparatus used was a Varian ProStar 210 (Palo Alto, CA, USA) equipped with a fluorimeter (821-FP, Jasco, Japan spectroscopic Co. Ltd., Tokyo, Japan) recording wavelengths of 285 nm for excitation and 345 nm for emission [28,29] and a reverse phase column (Kinetex, 5 µm particle, 150 × 4.6 mm, 100 Å, Phenomenex Inc., Torrance, CA, USA) set at 25 °C and preceded by a SecurityGuard ULTRA guard cartridge (UHPLC C18, Phenomenex Inc., Torrance, CA, USA). Chromatographic separation was performed using a binary gradient consisting of (A) aqueous formic acid (0.1% v/v), and (B) methanol. The elution profile was: from 5% B to 20% B for 20 min, to 100% B until 65 min, and maintained at 100% B until 75 min. The flow rate was 0.8 mL/min. Samples were stored frozen (−20 °C) and filtered (0.45 µm) prior to analysis. The injected volume was 20 µL. The quantitative analysis was performed using the external standard method; the stock standard solutions were prepared in methanol and stored at −20 °C until use.

2.4.4. Analysis of Reduced (GSH) and Oxidized Glutathione (GSSG)

The method used consists of the alkylation of the sulfhydryl group with iodoacetic acid to prevent GSH oxidation as described by Jones et al. [30], subsequent derivatization of the amino group with dansyl chloride as reported by Jones et al. [30,31] and finally HPLC analysis. The reaction mixture was prepared adding 700 µL of 0.2 M Na2B4O7·10H2O (pH 9.3) solution to 20 µL of 40 mM iodoacetic acid solution and 100 µL of sample. After 20 min (in the dark), 200 µL of dansyl chloride solution (20 mg in 1 mL acetone) was added and the reaction mixture was mixed and incubated 24 h in the dark. Chloroform (500 µL) was finally added to extract the unreacted dansyl chloride, and after centrifugation, the upper layer was injected in the HPLC. The HPLC determination was performed with an HPLC ProStar 210 equipped with and a Varian UV detector 340 (Palo Alto, CA, USA) with wavelength set at 254 nm and a fluorimeter (821-FP, Jasco, Japan spectroscopic Co. Ltd., Tokyo, Japan) with wavelength set at 335 nm (Ex) and 515 nm (Em). Chromatographic separation was performed in a reverse phase column (Kinetex, 5 µm particle, 150 × 4.6 mm, 100 Å, Phenomenex Inc., Torrance, CA, USA) set at 25 °C and preceded by a SecurityGuard ULTRA guard cartridge (UHPLC C18, Phenomenex Inc., Torrance, CA, USA) The binary gradient was that described by Tuberoso et al. [31] consisting of (A) pH 4.1 acetate buffer (6.25 mL CH3COOH 1.97 g CH3COONa 200 mL acetonitrile and water up to 1 L), and (B) acetonitrile. The elution profile was: 0% B for 9 min, to 20% B until 20 min, to 100% B until 25 min, and maintained at 100% B until 30 min. The flow rate was 0.8 mL/min. The injected volume was 20 µL. The quantitative analysis was performed using the external standard method; the stock standard solutions were prepared in 0.1 M HCl/Methanol (1:1, v/v) and stored at −20 °C until use.

2.4.5. DPPH Antioxidant Assay

The DPPH assay was used to measure the free radical-scavenging capacity of the synthetic wines, according to a previously reported method [32] with some modifications: 100 µL of sample was added to 3.3 mL of DPPH solution (6 × 10⁻⁵ mol·L−1 in pH 5.5 buffered methanol) prepared daily. Spectrophotometric measurements were done after 25 min at 515 nm with a Varian Cary 50 Scan spectrophotometer (Palo Alto, CA, USA) measuring the percentage of absorbance decrease at 515 nm. Quantification of antioxidant capacity was performed by calibration curves obtained from ethanolic solutions of gallic acid.

2.5. Cell Cultures for Ex-Vivo Assays and Treatment

RAW 264.7 murine macrophage were purchased from Sigma Aldrich (91062702) and they were cultured in standard conditions under humidified atmosphere (5% CO2, 37 °C) using Dulbecco’s modified Eagle medium (DMEM) supplemented with 10% (w/v) foetal bovine serum (FBS), 1 mM glutamine, and 100 µg/mL penicillin/streptomycin. Cells were routinely passed every 2 days and the medium was changed at least twice a week. Passage was performed when cells reached 80% confluence. Experimental wine samples obtained from each S. cerevisiae strain (250 mL) were firstly concentrated by a rotary evaporator at 40 °C to remove ethanol and then they were lyophilized. A 25× solution was obtained by adding 10 mL of sterile water, and the samples were filtered with a 0.22 μm pore size filter and used for cell treatments. Cells in 24 well plates (5 × 10⁵ cells/well) were put in starvation medium for 6 h and then treated with each sample (0.125, 0.25, 0.5, 1.0, 2.0 and 4.0 µL) for 1 h. Finally, they were incubated with lipopolysaccharide (LPS) (1 μg/mL) for 20 h and subjected to further analysis. Negative controls (cells without sample) and positive controls (cells treated by LPS alone) were also prepared.

2.6. Cell Viability Assay

Cell cytotoxicity was evaluated by the MTT (3-(4,5-Dimethylthiazol-2-yl)-2,5-Diphenyltetrazolium Bromide, MTT, Sigma-Aldrich) method by evaluating the capacity of succinate dehydrogenase to convert MTT into visible formazan crystals in viable cells [33]. To each well, 500 µL of a solution composed by 0.5 mg/mL MTT in DMEM without red phenol was added and incubated in the dark at 37 °C for 45 min. Subsequently, 200 μL of dimethyl sulfoxide (DMSO) was added to each well to dissolve any deposited formazan. The optical density (OD) of each well was measured at 595 nm with a microplate reader (Bio-Rad Laboratories Inc., Hercules, CA, USA). The optical density of the control (cells without samples) was taken as 100% cell viability. Samples were measured in duplicate, and the experiment was repeated three times.

2.7. Measurement of Intracellular Reactive Oxygen Species (ROS)

The intracellular levels of reactive oxygen species (ROS) were determined using the fluorescent probe 2,7-dichlorofluorescin diacetate (DCFH-DA) Sigma-Aldrich) that is a cell-permeant indicator for ROS that is not fluorescent until removal of the acetate groups by intracellular esterase and subsequent oxidation. Cells were incubated with 2 µL of each sample, and after incubation and LPS treatment, the probe (25 μM in DMSO) was added to the medium and cells were incubated for 1 h. Fluorescence was measured with a Synergy H1 microplate reader (BioTek, Winooski, VT, USA) at excitation/emission wavelengths of 485/538 nm. Values were normalized on protein content and results were expressed as percentage of ROS formation relative to the signal obtained with LPS. Treatment with 0.05 mM Ascorbic acid was also performed. Proteins were assayed by the BCA method (Pierce™ BCA Protein Assay Kit, ThermoFisher Scientific, Waltham, MA, USA).

2.8. IκB and iNOS Immunoblot Detection

RAW 264.7 cells were treated with 2 µL of sample for 1 h and then co-incubated with LPS (1 µg/mL) for 20 h. After incubation, cells were lysed in Laemnli buffer. Aliquots of 30 μg were resolved by 10% SDS-PAGE and transferred to PVDF membranes. The membranes were blocked with 2.5% BSA–phosphate-buffered saline (PBS), 0.1% Tween 20 for 1 h at room temperature before being incubated overnight with primary antibodies (actin 13E5, IκB 44D4, iNOS, Cell Signaling Technology, MA, USA) diluted 1:1000 in 5% BSA Tween 20 (0.1%) in PBS. The membranes were then washed three times in Tween 20 (0.1%) in PBS and incubated with horseradish peroxidase-conjugated secondary anti-rabbit antibodies (Cell Signaling) diluted 1:2000 in 5% BSA Tween 20 (0.1%) in PBS for 1 h. After exhaustive washes, the membranes were developed using an Enhanced Chemo Luminescence kit (GE healthcare, Little Chalfont, UK). Luminescence was recovered by Amersham Imager 600 (GE healthcare, UK) and results were expressed as IκB and iNOS intensity. All the obtained values were then normalized on the actin signal.

2.9. Statistical Analysis

Statistical analysis were performed with STATISTICA 7 software (StatSoft, Tulsa, OK, USA) using one-way ANOVA (for multiple groups) followed by post-testing (Tukey test) and Student’s t test (for comparisons between two groups).

3. Results and Discussion

3.1. Cell Growth and Fermentation Kinetics of S. cerevisiae Strains

The four commercial and two indigenous S. cerevisiae strains were inoculated in synthetic must instead of real must in order to exclude the fraction of antioxidant compounds naturally present in grapes. Growth as well as fermentation kinetics were daily monitored and the experimental data were fitted to Gompertz’s modified equation (Table 1). The applied nonlinear model presented goodness of fit for all responses (R2 > 0.99).
All the S. cerevisiae strains started to grow soon after the inoculation at 1 × 10⁶ cell/mL in synthetic wine so that no noticeable lag phase was recorded. Nevertheless, the commercial strain Premium® Zinfandel showed the lowest specific growth rate (Table 1). Although differences in growth kinetic among various yeast strains occurred, only BM45 displayed a significantly higher growth yield, reaching cell concentrations of 7 × 10⁷ cell/mL whereas the other strains attained about 5 × 10⁷ cell/mL.
Concerning the fermentation kinetics, the Premium® Zinfandel strain displayed the longest lag phase. Indeed, calculation of fermenting vigour, that is CO2/100 mL produced in first 48 h indicating the speed of fermentation, pointed out that the same strain exhibited the lowest value (1.82 ± 0.12 g/100 mL) while the commercial BM45 and the indigenous R6 strains showed the highest values, that were 5.35 ± 0.42 and 5.51 ± 0.29 g/100 mL, respectively. Notwithstanding the different fermentation kinetics according to the yeast strain, all experimental fermentations were completed and the ethanol content ranged from 11.5 to 11.7% (v/v), confirming the total degradation of the initial sugar concentration (200 g/L).

3.2. Ability of S. cerevisiae Strains to Produce Bioactive Compounds in Experimental Wines

While hydroxytyrosol was not found in any of the six experimental wines analysed, all the other compounds were found at variable concentrations. Among the six tested strains, the BM45 strain showed the highest concentrations of all the bioactive compounds analysed (Table 2).
In particular, all the strains of S. cerevisiae studied were capable of synthesizing more than 4 mg/L tyrosol; however, there were significant differences among the strains tested. The BM45 experimental wine contained the highest tyrosol concentration, while the lowest values were found in those produced by Zinfandel and EC 1118 strains. The indigenous strain R6 showed an appreciable capability in the production of tyrosol reaching 6.17 mg/L, while the strain P8 produced an amount comparable to that found in VL1 experimental wine. Such quantities are in agreement with those found in wines by several authors, since the presence of tyrosol in wines is completely attributable to yeast metabolism [21,34].
As described above, hydroxytyrosol was not detected in the experimental wines. Although Álvarez-Fernández et al. [35] recently demonstrated that such secondary metabolite accumulates during the alcoholic fermentation as a consequence of yeast activity, it has also been suggested that endogenous enzymes occurring in grapes, such as polyphenol oxidase (PPO), could catalyse the hydroxylation of tyrosol to hydroxytyrosol [36]. However, in our case, no effect of such enzymatic activity could have occurred, since we used a synthetic must and not a grape juice must.
Tryptophol accumulation in experimental wines was also influenced by the strain conducting the alcoholic fermentation. Once again, the BM45 experimental wine was characterized by the highest content, while the Zinfandel and EC1118 yeast strains produced the lowest amounts of tryptophol. As for tyrosol, the other strains showed an intermediate capability in terms of production. Interestingly, the final amount of tyrosol and tryptophol found in the experimental wines showed a positive correlation (R2 = 0.97, p < 0.05), indicating a strain-specific behaviour in the production of these two higher alcohols.
The final amount of reduced-glutathione (GSH) was significantly different among the experimental wines. The highest concentration was found in the BM45 experimental wines, reaching values comparable to those proposed by recent OIV resolutions [37,38], in which the organization recommended a maximum dose (20 mg/L) of added glutathione for the protection of wines from oxidation. Moreover, analogous concentrations were recovered in some wines [39]. In agreement with our results, Lavigne et al. [40] and Kritzinger [22] suggested that the amount of GSH present after alcoholic fermentation was yeast strain-dependent; however, the results of Fracassetti [41], who found weak or a non-significant effect of different S. cerevisiae strains on the GSH concentration trend, studied under industrial winemaking conditions, did not support our results.
By assessing the results of the melatonin content produced by the 6 S. cerevisiae strains tested, it emerged that 3 of the 6 were able to produce more than 10 ng/mL of melatonin (BM45, P8 and EC1118). These amounts were higher than values found by another study [42] carried out on wines after the fermentation of musts obtained from three grape varieties (Sangiovese, Albana and Trebbiano).

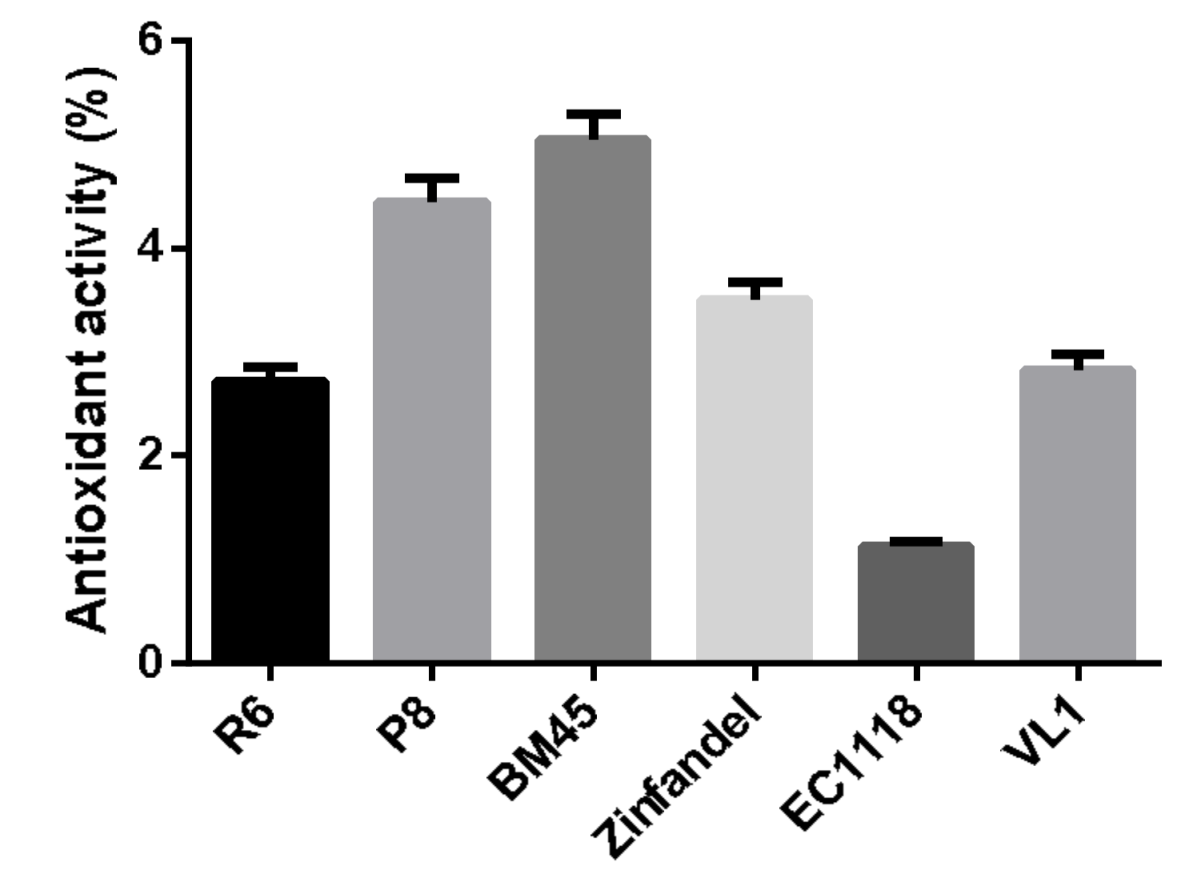
3.3. Antioxidant Activity of Experimental Wines In Vitro Assay

To verify the presence of a generic antiradical capability of the fermented samples, the DPPH assay was used (Figure 1). The results showed that the fermented samples obtained with the strain BM45 demonstrated the highest antioxidant capability, confirming the previous results shown in Table 2. On the contrary, the fermented sample obtained with R6 showed the lowest antioxidant capability.

3.4. Antioxidant and Anti-Inflammatory Activities of Samples from Experimental Wines in Ex-Vivo Assays

The experimental wines samples, once lyophilized (composition Table 3) to remove the ethanol and suspended in water, were used to investigate their effect on cell vitality of RAW 264.7 murine macrophage in order to assess the lack of their in vitro cytotoxicity. In particular, these cells were treated with two different quantities of the various samples. The MTT test showed that cell viability was not strongly affected by this treatment (Figure 2). With the exception of the samples obtained from the S. cerevisiae R6 and P8 strains, that were, however, able to counteract the LPS stimuli in a statistical manner, all the other samples were able to restore the cell vitality to values comparable to that obtained in cells treated with the cultural medium only, that is the negative control.

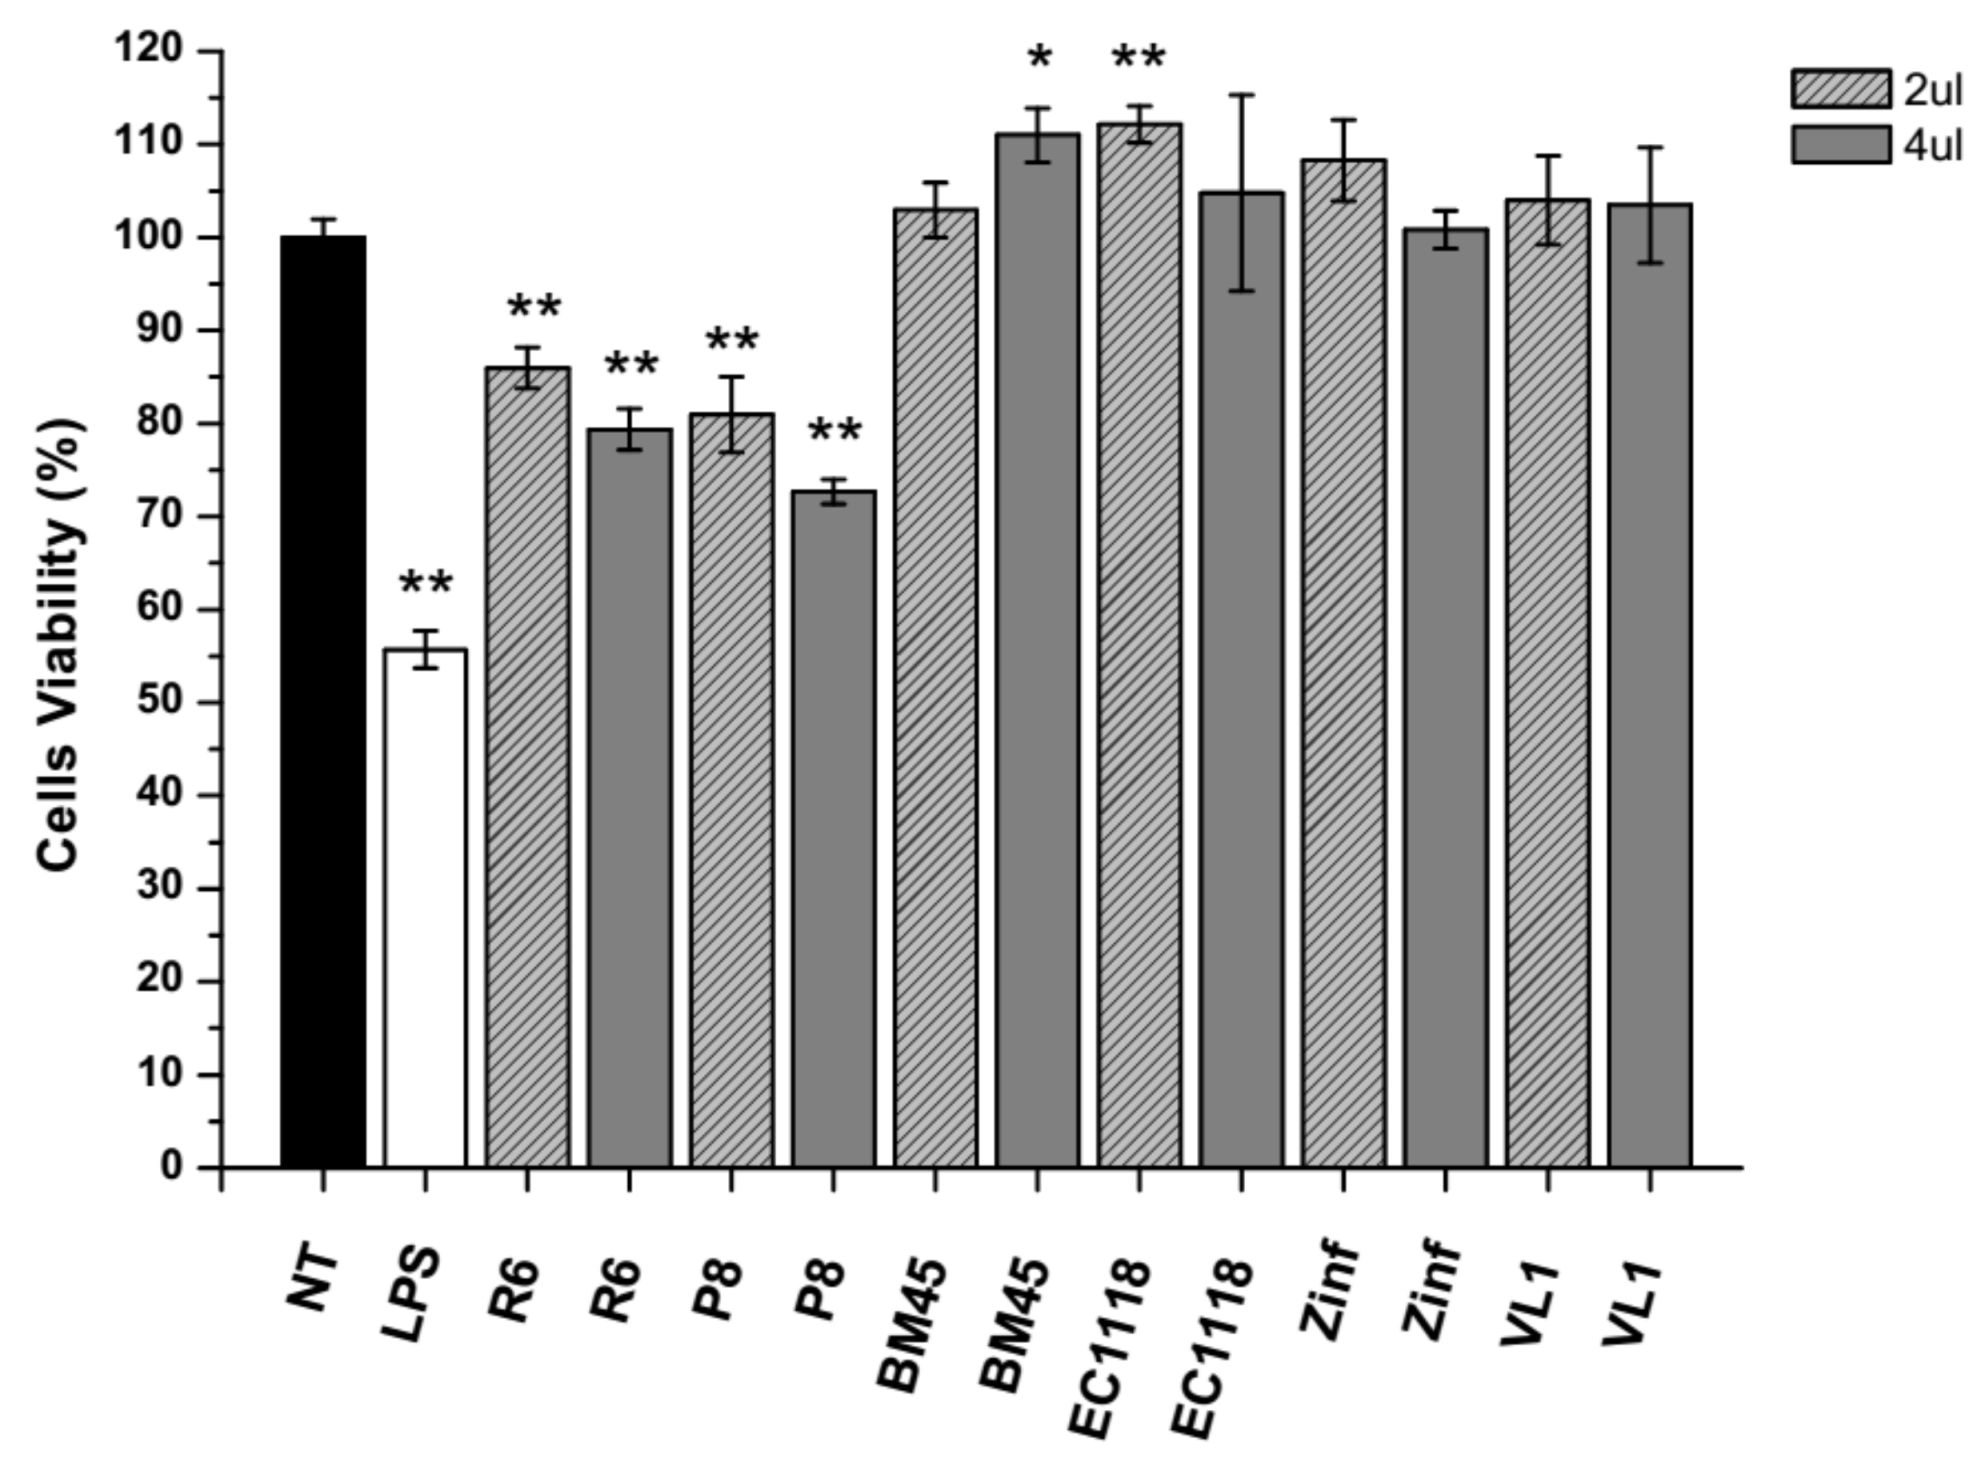
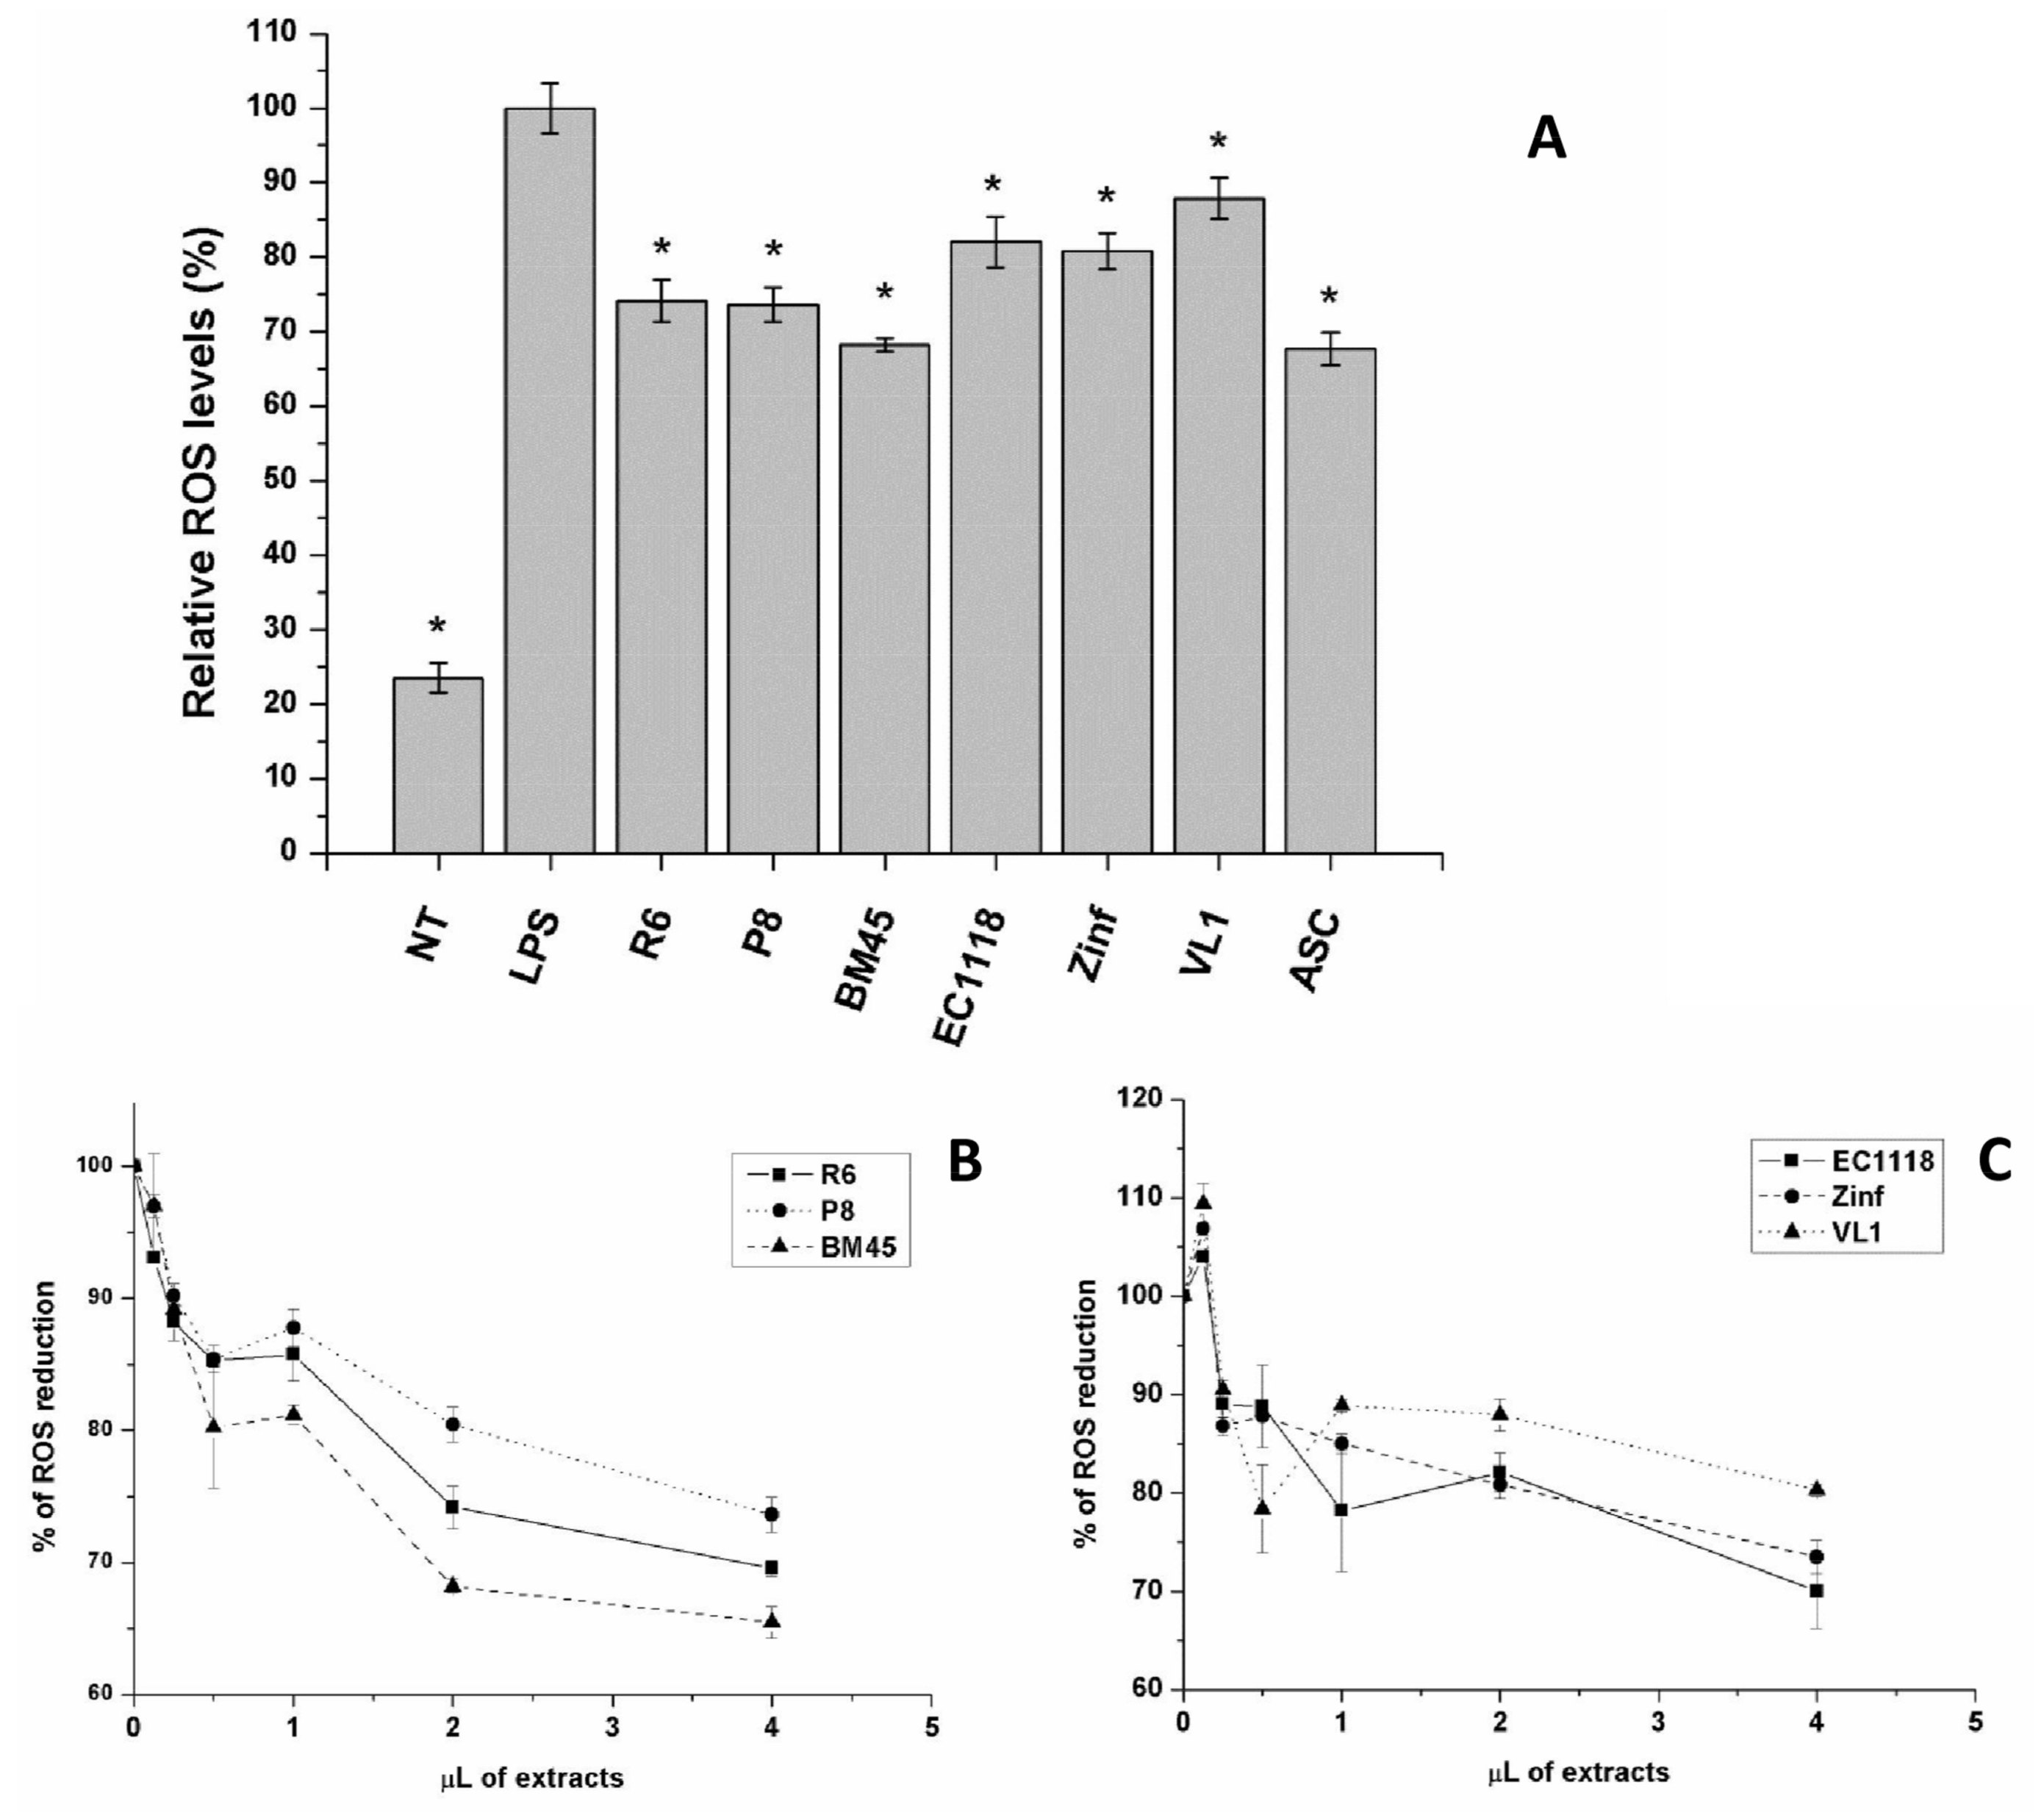
3.4.1. Antioxidant Activity in Cultured Cells

RAW 264.7 cells were also used to highlight the putative antioxidant activity of the samples obtained from experimental wines. For this purpose, the 2 µL aliquot was chosen to get an overall look of the role that samples could have as intracellular scavengers of reactive oxygen species. The intracellular level of ROS was notably enhanced after LPS treatment, but the ROS level markedly decreased in cells previously treated with samples. The detection of ROS levels in cells pre-treated with samples highlighted the antioxidant properties of the samples that were able to significantly decrease (p < 0.001) the formation of ROS induced by LPS. In particular, BM45 showed an antioxidant capacity like ascorbate (Figure 3A). Moreover, to determine the lowest concentration able to decrease the intracellular ROS content, a dose-effect relationship was obtained for all the samples (Figure 3B,C). Analysis of the dose-response curve indicated that 0.5 µL was the lowest concentration able to induce a significant reduction in ROS formation. The samples from S. cerevisiae R6, P8 and BM45 strains (Figure 3B) were the most efficient ones in ROS reduction, in agreement with the results obtained with the 2 µL dose (Figure 3A).

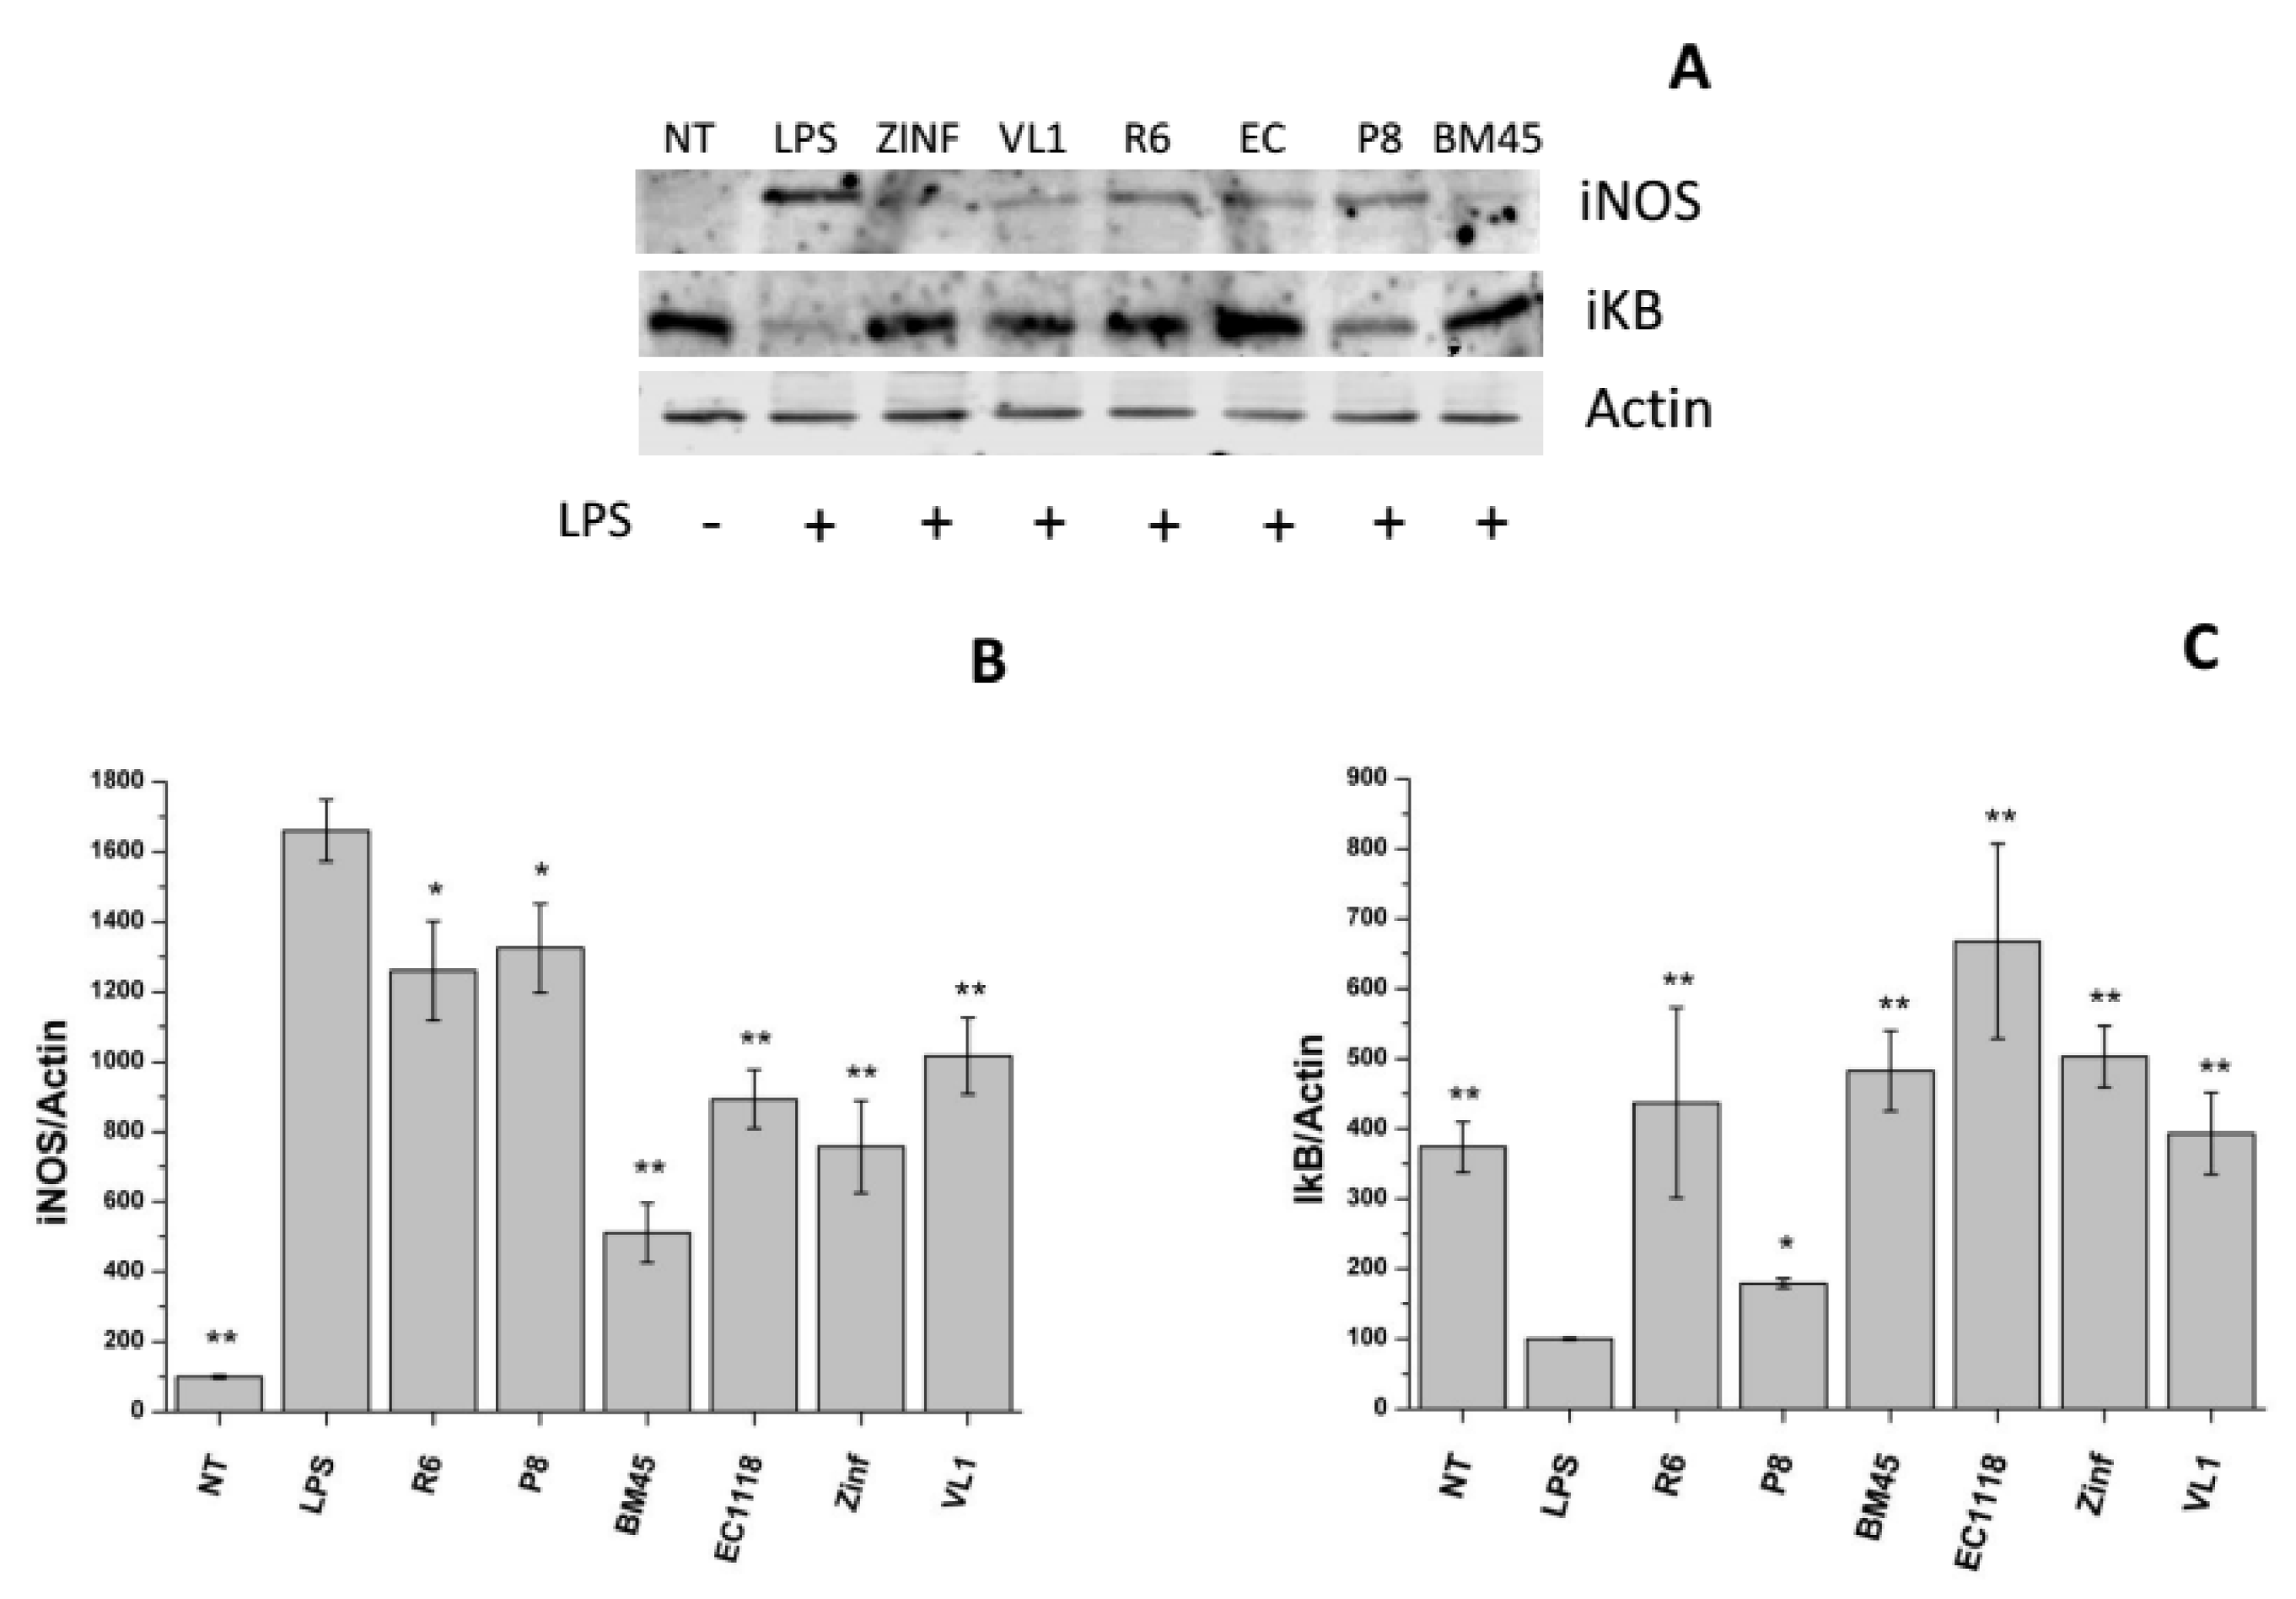
3.4.2. Anti-Inflammatory Activity of Experimental Samples

Considering the results obtained by ROS detection, some anti-inflammatory markers were also analyzed based on the evidence that the oxidative response is deeply involved in the regulation of inflammatory processes [43]. Firstly, expression of IκB in treated cells was detected, since IκB is the major inhibitor of NFκB, a central signalling complex, controlling the transcription of the majority of genes involved in inflammation. Therefore, a high expression profile of IκB indicates a lower inflammatory state of cells. Expression levels of iNOS (inducible Nitric Oxide Synthase) were also analysed. iNOS is known to produce NO that is a strictly pro-inflammatory macrophage product. Results are reported in Figure 4A,B and indicate a general anti-inflammatory activity by the most of the samples. In particular, all the samples showed a significant decrease in iNOS expression levels, indicating a reduction of NO production (and consequently inflammation mediators) in stressed cells (Figure 4B). Moreover, data from IκB expression levels confirmed the result: with the exception of the sample obtained from the S. cerevisiae P8 strain, all the other samples were able to revert the decrease in IκB levels in LPS-treated cells, thus confirming anti-inflammatory activity.

4. Conclusions

In this study, the production in a synthetic wine of tyrosol, tryptophol, melatonin and glutathione, which are human health-promoting compounds, was found to be significantly influenced by the S. cerevisiae strain conducting the alcoholic fermentation. In particular, the commercial strain BM45® proved to be able to produce the highest amounts of all the bioactive compounds considered, with a reduced glutathione content at a concentration close to 20 mg/L that is the maximum dose allowed by OIV for must and wine treatment to limit the oxidation phenomena and protect aromatic substances [oiv-oeno-445 and 446-2015].
Moreover, ex-vivo and immunological assays demonstrated that experimental synthetic wines, obtained from different S. cerevisiae strains and treated in order to remove the ethanol content, exhibited antioxidant and anti-inflammatory properties. In the case of three samples obtained from two commercial S. cerevisiae strains, (BM45 and EC1118) and the indigenous R6 strain, the antioxidant activity was comparable with that of ascorbic acid (vitamin C), which was used as a positive control.
In conclusion, the findings here reported indicated that the production of health-promoting compounds is a strain-specific property. Therefore, the use of an appropriate S. cerevisiae strain to induce alcoholic fermentation in wine could represent a suitable tool to enhance the content of some health-promoting compounds, in addition to the well-known phenolic compounds occurring in grape and wines, especially red wines. Nevertheless, it is noteworthy to stress that the results here discussed were obtained in a synthetic medium. Hence, although the capability of the six strains tested in the production of some bioactive compounds and their peculiar antioxidant and anti-inflammatory properties were demonstrated, future studies in grape should be carried out in order to investigate yeast metabolic behaviour during wine fermentation.
Indeed, the accumulation of compounds taken into consideration, possessing antioxidant properties, during alcoholic fermentation might enhance the protection of wines from oxidation, thus potentially assuming an important role in the sensorial quality and the potential longevity of the final products.

Author Contributions

Simona Guerrini, Silvia Mangani, Yuri Romboli, Simone Luti, Luigia Pazzagli and Lisa Granchi conceived and designed the experiments; Silvia Mangani, Simone Luti and Yuri Romboli, performed the experiments; Simona Guerrini, Silvia Mangani, Yuri Romboli, Simone Luti, Luigia Pazzagli and Lisa Granchi analysed the data and contributed to writing the paper.

Conflicts of Interest

The Authors declare no conflict of interest.

References

  1. Renaud, S.D.; de Lorgeril, M. Wine, alcohol, platelets, and the French paradox for coronary heart disease. Lancet 1992, 339, 1523–1526. [Google Scholar] [CrossRef]
  2. Renaud, S.; Gueguen, R. The French paradox and wine drinking. Novartis Found. Symp. 1998, 216, 208–217. [Google Scholar] [PubMed]
  3. Ruf, J.C. Overview of epidemiological studies on wine, health and mortality. Drugs Exp. Clin. Res. 2003, 29, 173–179. [Google Scholar] [PubMed]
  4. Guilford, J.M.; Pezzuto, J.M. Wine and health: A review. Am. J. Enol. Vitic. 2011, 62, 471–486. [Google Scholar] [CrossRef]
  5. Poli, A.; Marangoni, F.; Avogaro, A.; Barba, G.; Bellentani, S.; Bucci, M.; Cambieri, R.; Catapano, A.L.; Costanzo, S.; Cricelli, C.; et al. Moderate alcohol use and health: A consensus document. Nutr. Metab. Cardiovasc. Dis. 2013, 23, 487–504. [Google Scholar] [CrossRef] [PubMed] [Green Version]
  6. Monagas, M.; Bartolome, B.; Gomez-Cordoves, C. Updated knowledge about the presence of phenolic compounds in wine. Crit. Rev. Food Sci. Nutr. 2005, 45, 85–118. [Google Scholar] [CrossRef] [PubMed]
  7. Fernandes, I.; Pérez-Gregorio, R.; Soares, S.; Mateus, N.; De Freitas, V. Fermented Foods in Health and Disease Prevention; Frías, J., Martínez-Villaluenga, C., Peñas, E., Eds.; Elsevier Inc.: New York, NY, USA, 2017; pp. 593–621. ISBN 978-0-12-802309-9. [Google Scholar]
  8. Ferreira, V.; Fernandes, F.; Pinto-Carnide, O.; Valentão, P.; Falco, V.; Martín, J.P.; Ortiz, J.M.; Arroyo-García, R.; Andrade, P.B.; Castro, I. Identification of Vitis vinifera L. grape berry skin color mutants and polyphenolic profile. Food Chem. 2016, 194, 117–127. [Google Scholar] [CrossRef] [PubMed]
  9. Wang, J.; Ho, L.; Zhao, Z.; Seror, I.; Humala, N.; Dickstein, D.L.; Thiyagarajan, M.; Percival, S.S.; Talcott, S.T.; Pasinetti, G.M. Moderate consumption of Cabernet Sauvignon attenuated beta-amyloid neuropathology in a mouse model of Alzheimer’s disease. FASEB J. 2006, 20, 2313–2320. [Google Scholar] [CrossRef] [PubMed]
  10. Zell, J.A.; McEligot, A.J.; Ziogas, A.; Holcombe, R.F.; Anton-Culver, H. Differential effects of wine consumption on colorectal cancer outcomes based on family history of the disease. Nutr. Cancer 2007, 59, 36–45. [Google Scholar] [CrossRef] [PubMed]
  11. Pierini, R.; Gee, J.M.; Belshaw, N.J.; Johnson, I.T. Flavonoids and intestinal cancers. Br. J. Nutr. 2008, 99, ES53–ES59. [Google Scholar] [CrossRef] [PubMed]
  12. Fenwick, E.K.; Xie, J.; Man, R.E.K.; Lim, L.L.; Flood, V.M.; Finger, R.P.; Wong, T.Y.; Lamoureux, E.L. Moderate consumption of white and fortified wine is associated with reduced odds of diabetic retinopathy. J. Diabetes Complic. 2015, 29, 1009–1014. [Google Scholar] [CrossRef] [PubMed]
  13. Bassig, B.A.; Lan, Q.; Rothman, N.; Zhang, Y.; Zheng, T. Current understanding of lifestyle and environmental factors and risk of non-hodgkin lymphoma: An epidemiological update. J. Cancer Epidemiol. 2012, 2012, 978930. [Google Scholar] [CrossRef] [PubMed]
  14. Lindberg, M.L.; Amsterdam, E.A. Alcohol, wine, and cardiovascular health. Clin. Cardiol. 2008, 31, 347–351. [Google Scholar] [CrossRef] [PubMed]
  15. Ribéreau-Gayon, P.; Glories, Y.; Maujean, A.; Dubourdieu, D. Phenolic Compounds. In Handbook of Enology, the Chemistry of Wine Stabilization and Treatments, 2nd ed.; Ribéreau-Gayon, P., Glories, Y., Maujean, A., Dubourdieu, D., Eds.; John Wiley and Sons Ltd.: Chichester, UK, 2000; Volume 2, pp. 141–201, ISBN-13 978-0-470-01037-2 (HB). [Google Scholar]
  16. El Darra, N.; Turk, M.F.; Ducasse, M.A.; Grimi, N.; Maroun, R.G.; Louka, N.; Vorobiev, E. Changes in polyphenol profiles and color composition of freshly fermented model wine due to pulsed electric field, enzymes and thermovinification pretreatments. Food Chem. 2016, 194, 944–950. [Google Scholar] [CrossRef] [PubMed]
  17. Muller, C.J.; Fugelsang, K.C. Red wine but not white: The importance of fully characterizing wines used in health studies. Am. J. Clin. Nutr. 1997, 66, 447. [Google Scholar] [CrossRef] [PubMed]
  18. Morata, A.; Gómez-Cordovés, M.C.; Colomo, B.; Suárez, J.A. Pyruvic acid and acetaldehyde production by different strains of Saccharomyces cerevisiae: Relationship with vitisin A and B formation in red wines. J. Agric. Food Chem. 2003, 51, 7402–7409. [Google Scholar] [CrossRef] [PubMed]
  19. Romboli, Y.; Mangani, S.; Buscioni, G.; Granchi, L.; Vincenzini, M. Effect of Saccharomyces cerevisiae and Candida zemplinina on quercetin, vitisin A and hydroxytyrosol contents in Sangiovese wines. World J. Microbiol. Biotechnol. 2015, 31, 1137–1145. [Google Scholar] [CrossRef] [PubMed]
  20. Mas, A.; Guillamon, J.M.; Torija, M.J.; Beltran, G.; Cerezo, A.B.; Troncoso, A.M.; Garcia-Parrilla, M.C. Bioactive Compounds Derived from the Yeast Metabolism of Aromatic Amino Acids during Alcoholic Fermentation. Biomed. Res. Int. 2014. [Google Scholar] [CrossRef] [PubMed]
  21. Fernández-Mar, M.I.; Mateos, R.; García-Parrilla, M.C.; Puertas, B.; Cantos-Villar, E. Bioactive compounds in wine: Resveratrol, hydroxytyrosol and melatonin: A review. Food Chem. 2012, 130, 797–813. [Google Scholar] [CrossRef]
  22. Kritzinger, E.C. Winemaking Practices Affecting Glutathione Concentrations in White Wine. Ph.D. Thesis, Stellenbosch University, Matieland, South Africa, 2012. [Google Scholar]
  23. Mezzetti, F.; De Vero, L.; Giudici, P. Evolved Saccharomyces cerevisiae wine strains with enhanced glutathione production obtained by an evolution-based strategy. FEMS Yeast Res. 2014, 14, 977–987. [Google Scholar] [CrossRef] [PubMed]
  24. RESOLUTION OIV-OENO 370-2012 Guidelines for the Characterization of Wine Yeasts of the Genus Saccharomyces Isolated from Vitivinicultural Environment. Available online: http://www.oiv.int/public/medias/1429/oiv-oeno-370-2012-en.pdf (accessed on 22 June 2012).
  25. Granchi, L.; Carobbi, M.; Guerrini, S.; Vincenzini, M. Rapid enumeration of yeasts during wine fermentation by the combined use of Thoma chamber and epifluorescence microscopy. In Proceedings of the XXIXth World Congress of Vine and Wine, Logroño, Spain, 25–30 June 2006; pp. 1–5. [Google Scholar]
  26. Lefebvre, D.; Gabriel, V.; Vayssier, Y.; Fontagné-Faucher, C. Simultaneous HPLC Determination of Sugars, Organic Acids and Ethanol in Sourdough Process LWT. Food Sci. Technol. 2002, 35, 407–414. [Google Scholar] [CrossRef]
  27. Hernández, T.; Estrella, I.; Carlavilla, D.; Martín-Álvarez, P.J.; Moreno-Arribas, M.V. Phenolic compounds in red wine subjected to industrial malolactic fermentation and ageing on lees. Anal. Chim. Acta 2006, 563, 116–125. [Google Scholar] [CrossRef]
  28. Rodriguez-Naranjo, I.M.; Gil-Izquierdo, A.; Troncoso, A.M.; Cantos-Villar, E.; Garcia-Parrilla, C.M. Melatonin is synthesised by yeast during alcoholic fermentation in wines. Food Chem. 2011, 126, 1608–1613. [Google Scholar] [CrossRef] [PubMed]
  29. Rodriguez-Naranjo, M.I.; Gil-Izquierdo, A.; Troncoso, A.M.; Cantos, E.; García-Parrilla, M.C. Melatonin: A new bioactive compound in wine. J. Food Compost. Anal. 2011, 24, 603–608. [Google Scholar] [CrossRef]
  30. Jones, D.P.; Carlson, J.L.; Samiec, P.S.; Sternberg, P., Jr.; Mody, V.C., Jr.; Reed, R.L.; Brown, L.A. Glutathione measurement in human plasma. Evaluation of sample collection, storage and derivatization conditions for analysis of dansyl derivatives by HPLC. Clin. Chim. Acta 1998, 275, 175–184. [Google Scholar] [CrossRef]
  31. Tuberoroso, C.I.G.; Congiu, F.; Serrelli, G.; Mameli, S. Determination of dansylated amino acids and biogenic amines in Cannonau and Vermentino wines by HPLC-FLD. Food Chem. 2015, 175, 29–35. [Google Scholar] [CrossRef] [PubMed]
  32. Sharma, O.M.; Bhat, T.K. DPPH antioxidant assay revisited. Food Chem. 2009, 113, 1202–1205. [Google Scholar] [CrossRef]
  33. Tolosa, L.; Donato, M.T.; Gómez-Lechón, M.J. General Cytotoxicity Assessment by Means of the MTT Assay. Methods Mol. Biol. 2015, 1250, 333–348. [Google Scholar] [CrossRef] [PubMed]
  34. Piñeiro, Z.; Cantos-Villar, E.; Palma, M.; Puertas, B. Direct liquid chromatography method for the simultaneous quantification of hydroxytyrosol and tyrosol in red wines. J. Agric. Food Chem. 2011, 59, 11683–11689. [Google Scholar] [CrossRef] [PubMed]
  35. Álvarez-Fernández, M.A.; Fernández-Cruz, E.; Cantos-Villar, E.; Troncoso, A.M.; García-Parrilla, M.C. Determination of hydroxytyrosol produced by winemaking yeasts during alcoholic fermentation using a validated UHPLC–HRMS method. Food Chem. 2018, 242, 345–351. [Google Scholar] [CrossRef] [PubMed]
  36. García-García, M.I.; Hernández-García, S.; Sánchez-Ferrer, A.; Garcia-Carmona, F. Kinetic study of hydroxytyrosol oxidation and its related compounds by Red Globe grape polyphenol oxidase. J. Agric. Food Chem. 2013, 61, 6050–6055. [Google Scholar] [CrossRef] [PubMed]
  37. RESOLUTION OIV-OENO 445-2015. Treatment of Must with Glutathione. Available online: http://www.oiv.int/public/medias/1686/oiv-oeno-445-2015-en.pdf (accessed on 10 July 2015).
  38. RESOLUTION OIV-OENO 446-2015. Treatment of Wine with Glutathione. Available online: http://www.oiv.int/public/medias/1687/oiv-oeno-446-2015-en.pdf (accessed on 10 July 2015).
  39. Du Toit, W.J.; Lisjak, K.; Stander, M.; Prevoo, D. Using LC-MSMS to asses glutathione levels in South African white grape juices and wines made with different levels of oxygen. J. Agric. Food Chem. 2007, 55, 2765–2769. [Google Scholar] [CrossRef] [PubMed]
  40. Lavigne, V.; Pons, A.; Dubourdieu, D. Assay of glutathione in must and wines using capillary electrophoresis and laser-induced fluorescence detection—Changes in concentration in dry white wines during alcoholic fermentation and aging. J. Chromatogr. 2007, 1139, 130–135. [Google Scholar] [CrossRef] [PubMed]
  41. Fracassetti, D. Investigation on Cysteinyl Thiol Compounds from Yeast Affecting Wine Properties. Ph.D. Thesis, Universita’ degli Studi di Milano, Milano, Itlay, 2010. [Google Scholar]
  42. Mercolini, L.; Addolorata Saracino, M.; Bugamelli, F.; Ferranti, A.; Malaguti, M.; Hrelia, S.; Raggi, M.A. HPLC-F analysis of melatonin and resveratrol isomers in wine using an SPE procedure. J. Sep. Sci. 2008, 31, 1007–1114. [Google Scholar] [CrossRef] [PubMed]
  43. Park, J.S.; Park, M.Y.; Cho, Y.J.; Lee, J.H.; Yoo, C.G.; Lee, C.T.; Lee, S.M. Anti-inflammatory Effect of Erdosteine in Lipopolysaccharide-Stimulated RAW 264.7 Cells. Inflammation 2016, 39, 1573–1581. [Google Scholar] [CrossRef] [PubMed]
Figure 1. Antioxidant activity of the experimental wines measured as absorbance produced by the reduction of DPPH.
Fermentation 04 00026 g001
Figure 2. Effect of samples on cell viability. RAW 264.7 cells were treated with 2 and 4 µL of the samples and subjected to an MTT test. Absorbance of formazan was determined at 595 nm and cell viability was reported as a percentage. A positive control (□) was obtained by treating cells with lipopolysaccharide (LPS). Values from non-treated cells (NT) were used as a negative control (■). Results are the mean of three different experiments performed in duplicate. Bars indicate S.D. (* p < 0.05; ** p < 0.001 vs. NT i.e., negative control).
Fermentation 04 00026 g002
Figure 3. Effect of samples obtained from experimental wines on intracellular ROS level. (A) ROS were determined in RAW 264.7 cells pre-treated with samples (2 µL) and stimulated with LPS (1 µg/mL). A positive control was obtained by treating cells with LPS. Values from non-treated cells (NT) were used as a negative control. ASC represents cells pre-treated with 0.05 mM. Results are expressed as % ROS content taking the value of the positive control as 100 and they are the mean of three different experiments performed in duplicate. Bars indicate S.D. (* p < 0.01 vs. positive control) (B,C) dose-response relation of samples. 0.25–4.0 µL of each sample was used to treat cells, and ROS levels were determined as in A.
Fermentation 04 00026 g003
Figure 4. Western blot analysis of iNOS and IκB from RAW 264.7 cells. (A) Western blot analysis of the cell lysates detected by anti-IκB and anti-iNOS monoclonal antibodies. Actin was used as a loading control. The intensity of each band was measured by using a Molecular Imaging Station from Kodak. (B,C) Relative protein level from Western Blot data. (B) iNOS expression level; (C) IκB expression level. Intensity of each signal was measured and normalized on the actin signal. Results are the mean (± SD) of three different experiments performed in duplicate. Statistical analysis was performed for each sample vs. the LPS values (* p < 0.05; ** p < 0.01).
Fermentation 04 00026 g004
Table 1. Growth and fermentation parameters obtained by fitting to Gompertz’s equation the yeast cell counts and % CO2 determined during alcoholic fermentation carried out in synthetic must by different S. cerevisiae strains. (µmax is the maximum specific growth rate; C = increase in log count from initial cell concentrations to maximum yeast population; Lag = time from the beginning of fermentation to exponential CO2 production; CO2Rmax = Maximum CO2 production rate, g/100 mL).
Gompertz Parameters
S. cerevisiae StrainGrowth ParametersFermentation Parameters
µmaxCLagCO2RmaxCO2 max
R62.43 ± 0.07 a1.75 ± 0.00 b0.36 ± 0.04 c2.26 ± 0.03 ab9.40 ± 0.30
P82.27 ± 0.15 a1.70 ± 0.02 b0.57 ± 0.08 bc2.06 ± 0.11 bc8.84 ± 0.15
BM452.49 ± 0.03 a1.83 ± 0.01 a0.51 ± 0.04 bc2.57 ± 0.10 a9.18 ± 0.28
EC11182.08 ± 0.11 ab1.70 ± 0.01 b0.74 ± 0.01 b2.53 ± 0.04 a9.40 ± 0.60
Zinfandel1.51 ± 0.09 b1.70 ± 0.04 b1.19 ± 0.06 a1.88 ± 0.23 bc9.55 ± 0.24
VL12.41 ± 0.37 a1.72 ± 0.01 b0.64 ± 0.09 b1.79 ± 0.00 c8.86 ± 0.14
Values are expressed as mean ± standard deviation. Means displaying different superscript letters (a, b, c) within the same column are significantly different (ANOVA, Tukey’s test at p < 0.05).
Table 2. Bioactive compounds quantified at the end of alcoholic fermentation carried out in synthetic must by different S. cerevisiae strains.
S. cerevisiae StrainTyrosol (mg/L)Tryptophol (mg/L)Glutathione (mg/L)Melatonin (ng/mL)
R66.17 ± 0.18 b4.70 ± 0.83 ab7.29 ± 0.48 bc6.23 ± 0.87 b
P84.97 ± 0.25 c3.47± 1.22 abc5.39 ± 0.03 c11.74 ± 1.71 ab
BM457.10 ± 0.11 a5.46 ± 0.28 a16.28 ± 1.85 a12.98 ± 3.34 a
EC11184.11 ± 0.07 d2.11 ± 0.18 c5.84 ± 0.45 c11.01 ± 0.74 ab
Zinfandel4.06± 0.15 d1.73 ± 0.33 c6.85 ± 0.48 c9.24 ± 0.98 ab
VL14.63 ± 0.00 cd2.72 ± 0.30 bc10.51 ± 0.76 b5.34 ± 0.53 b
Values are expressed as mean ± standard deviation. Means displaying different superscript letters (a, b, c) within the same column are significantly different (ANOVA, Tukey’s test at p < 0.05).
Table 3. Concentrations of bioactive compounds in experimental wines, after the treatment to remove ethanol, and used in ex-vivo assays.
S. cerevisiae StrainsTyrosol (µg/µL)Tryptophol (µg/µL)Glutathione (µg/µL)Melatonin (ng/µL)
R60.20.160.240.2
P80.1660.1160.180.4
BM450.240.180.760.42
EC11180.140.070.20.36
ZINFANDEL0140.060.220.3
VL10.1540.080.340.18

