Effects of Ultrasound on Fermentation of Glucose to Ethanol by Saccharomyces cerevisiae


Department of Food, Agricultural, and Biological Engineering, The Ohio State University; 1680 Madison Ave., Wooster, OH 44691, USA
*
Author to whom correspondence should be addressed.
Fermentation 2019, 5(1), 16; https://0-doi-org.brum.beds.ac.uk/10.3390/fermentation5010016
Submission received: 31 December 2018
/
Revised: 24 January 2019
/
Accepted: 27 January 2019
/
Published: 29 January 2019
(This article belongs to the Special Issue Biomass Conversion: Fermentation Chemicals and Fuels)
Abstract
:Previous studies have shown that pretreatment of corn slurries using ultrasound improves starch release and ethanol yield during biofuel production. However, studies on its effects on the mass transfer of substrates and products during fermentation have shown that it can have both beneficial and inhibitory effects. In this study, the effects of ultrasound on mass transfer limitations during fermentation were examined. Calculation of the external and intraparticle observable moduli under a range of conditions indicate that no external or intraparticle mass transfer limitations should exist for the mass transfer of glucose, ethanol, or carbon dioxide. Fermentations of glucose to ethanol using Saccharomyces cerevisiae were conducted at different ultrasound intensities to examine its effects on glucose uptake, ethanol production, and yeast population and viability. Four treatments were compared: direct ultrasound at intensities of 23 and 32 W/L, indirect ultrasound (1.4 W/L), and no-ultrasound. Direct and indirect ultrasound had negative effects on yeast performance and viability, and reduced the rates of glucose uptake and ethanol production. These results indicate that ultrasound during fermentation, at the levels applied, is inhibitory and not expected to improve mass transfer limitations.
Keywords:
ultrasound; fermentation; glucose; ethanol; yeast; Saccharomyces cerevisiae; mass transfer1. Introduction
Ethanol is the principal biofuel used in the United States, with 15,800 million gallons produced in 2017. This represents 58% of the total biofuel ethanol produced globally [1]. Ethanol fermentation is accomplished using industrial strains of the yeast Saccharomyces cerevisiae, which are used due to their fast growth rate, high conversion efficiency, low byproduct production, and tolerance to high ethanol concentrations [2,3].
Various methods to improve biofuel ethanol production have been studied. These include genetic enhancements to increase the range of utilizable substrates [4]; as well as pretreatments, such as hydrodynamic cavitation to improve starch release [5,6] and enzyme additions to hydrolyze cellulose [6]. Another potential method to enhance ethanol production is ultrasound treatment, which could improve the mass transfer of substrates to, and products away from, yeast cells during fermentation.
Ultrasound is defined as sound waves with frequencies above 20 kHz. Human hearing range is between 20 to 20,000 Hertz (20 kHz). Ultrasound can be applied directly or indirectly. Direct application of ultrasound (probe ultrasound) refers to direct application to the sample medium. Indirect application (bath ultrasound) refers to the application of ultrasound into a secondary medium (e.g., water bath). Direct ultrasound is usually applied with an ultrasonic probe and has a high localized intensity compared to bath ultrasound. Indirect ultrasound can be used to process larger volumes of solution at a more consistent intensity [7].
Ultrasound generates alternating high- and low-pressures, causing compression and rarefaction cycles in the medium. Rarefaction leads to the formation of cavities, which implode during compression [8,9]. This is a function of the frequency and the amplitude of the oscillations. The sudden drop in pressure creates vacuum bubbles or cavities. This is followed by a rapid return to the original pressure, which causes the cavities to collapse, releasing energy, which is then transferred to the medium [9]. The intensity of cavitation creates high local temperatures and powerful pressures for brief periods of time [8]. This could potentially have beneficial effects on mass transfer.
Ultrasound has been used in bioprocessing for different purposes and with different types of equipment and methods of application. It has been used in feedstock pretreatment for de-agglomeration, particle size reduction, dispersion [6,10,11,12,13,14,15], particle separation [16], and corn ethanol and wastewater treatment processes [17,18]. It has also been used to disrupt cells [19,20,21,22,23,24] and cell membranes, allowing the recovery of intracellular components [25,26] and for the inactivation of microbes [27,28].
A few studies have focused on the benefits of ultrasound during fermentation. Improvements were found due to enhanced mixing, cell deagglomeration, and facilitating the release of CO2 from the medium, lowering its concentration [23,29,30,31,32,33,34]. Another mechanism by which ultrasound may impact ethanol fermentation is by reducing mass transfer limitations for glucose, ethanol, and carbon dioxide in the vicinity of yeast cells [35,36]. Mass transfer limitations may limit the rate of fermentation by reducing glucose concentration at the cell surface. High concentrations of ethanol and carbon dioxide close to the cell could also modify cell membranes and inhibit fermentation rates. Intraparticle and external mass transfer resistances related to porous catalysts, immobilized cell systems, and fungal pellets have all been shown to limit the rates of fermentation and bioconversion [37].
By applying ultrasound during fermentation, a greater rate of ethanol production may occur due to higher rates of glucose uptake, a decrease in the concentration of ethanol and CO2 at the cell surface, and a greater rate of release from the medium. The purpose of this study was to evaluate the effects of ultrasound in improving these mass transfer limitations during ethanol fermentation from glucose.
The hypothesis of the study was that ultrasound enhances the performance of Saccharomyces cerevisiae by interfering with the boundary layer at the cell surface and reducing mass transfer limitations for glucose, ethanol, and carbon dioxide. The external and intraparticle mass transfer resistances were first calculated for a range of conditions to determine whether these limitations may be significant. Then the effects of ultrasound were determined during fermentation by measuring glucose uptake, ethanol production, and yeast cell population and viability over a range of direct and indirect ultrasound intensities.
2. Materials and Methods
2.1. Inoculum and Medium Preparation
The inoculum used for fermentation was prepared based on methods described in Ramirez [6], Dowe and McMillan [38], and Montalbo-Lomboy [39]. Yeast extract and peptone (YP) 10× were prepared by mixing 100 g of yeast extract and 200 g of peptone into double-deionized water (DDIW), to a total volume of 1 L. This solution was autoclaved at 121 °C for 30 min and used as a stock solution for media preparation. Glucose solution (50%) was prepared by diluting 500 g of glucose in DDIW to a total volume of 1 L. YP-glucose (5%) was prepared by mixing 100 mL of YP 10× and 100 mL of 50% glucose solution in 800 mL of DDIW. Citrate buffer (pH 4.5, 1 M) was prepared by adding 192 g of anhydrous citric acid to DDIW to a total volume of 1 L; the solution was titrated to a pH of 4.3 with a solution of sodium hydroxide 10 M (NaOH). The yeast pre-culture media was prepared by mixing 1 L of YP-glucose 5%, 100 mL of citrate buffer, and adding 3.07 g of magnesium sulfate heptahydrate (MgSO4·7H2O), 1.80 g of potassium phosphate monobasic (KH2PO4), 4.87 g of sodium phosphate monohydrate (Na2HPO4·H2O), 0.32 g of zinc sulfate heptahydrate (ZnSO4·7H2O), and DDIW to a total volume of 1.5 L. To this, 1.0 g of dried Saccharomyces cerevisiae (Bio-Ferm XR, North American Bioproducts Corporation) was added. The yeast inoculum was incubated at 32 °C, 180 rpm for 19 h in a shaker (InnovaTM 2300, Platform shaker, New Brunswick) to a viable yeast concentration of ~1 × 10⁸ cells/mL.
2.2. Fermentation
Glucose was used as the sole carbon substrate to eliminate the effects of ultrasound on starch release. Fermentations for all treatments were conducted in autoclaved 125 mL Erlenmeyer flasks (total volume 155 mL). Fermentation medium consisted of 112.5 mL of glucose solution (200 g/L), 6.25 mL YP 10×, and 6.25 mL of yeast inoculum, for a total volume of 125 mL. Flasks were sealed and a syringe needle was inserted through the stopper to vent CO2. All treatments were placed in a water-bath-shaker (Model G76D, Gyrotory®, New Brunswick Scientific Co. Inc., Edison, NJ, USA) in a 32 °C warm room.
2.3. Ultrasound
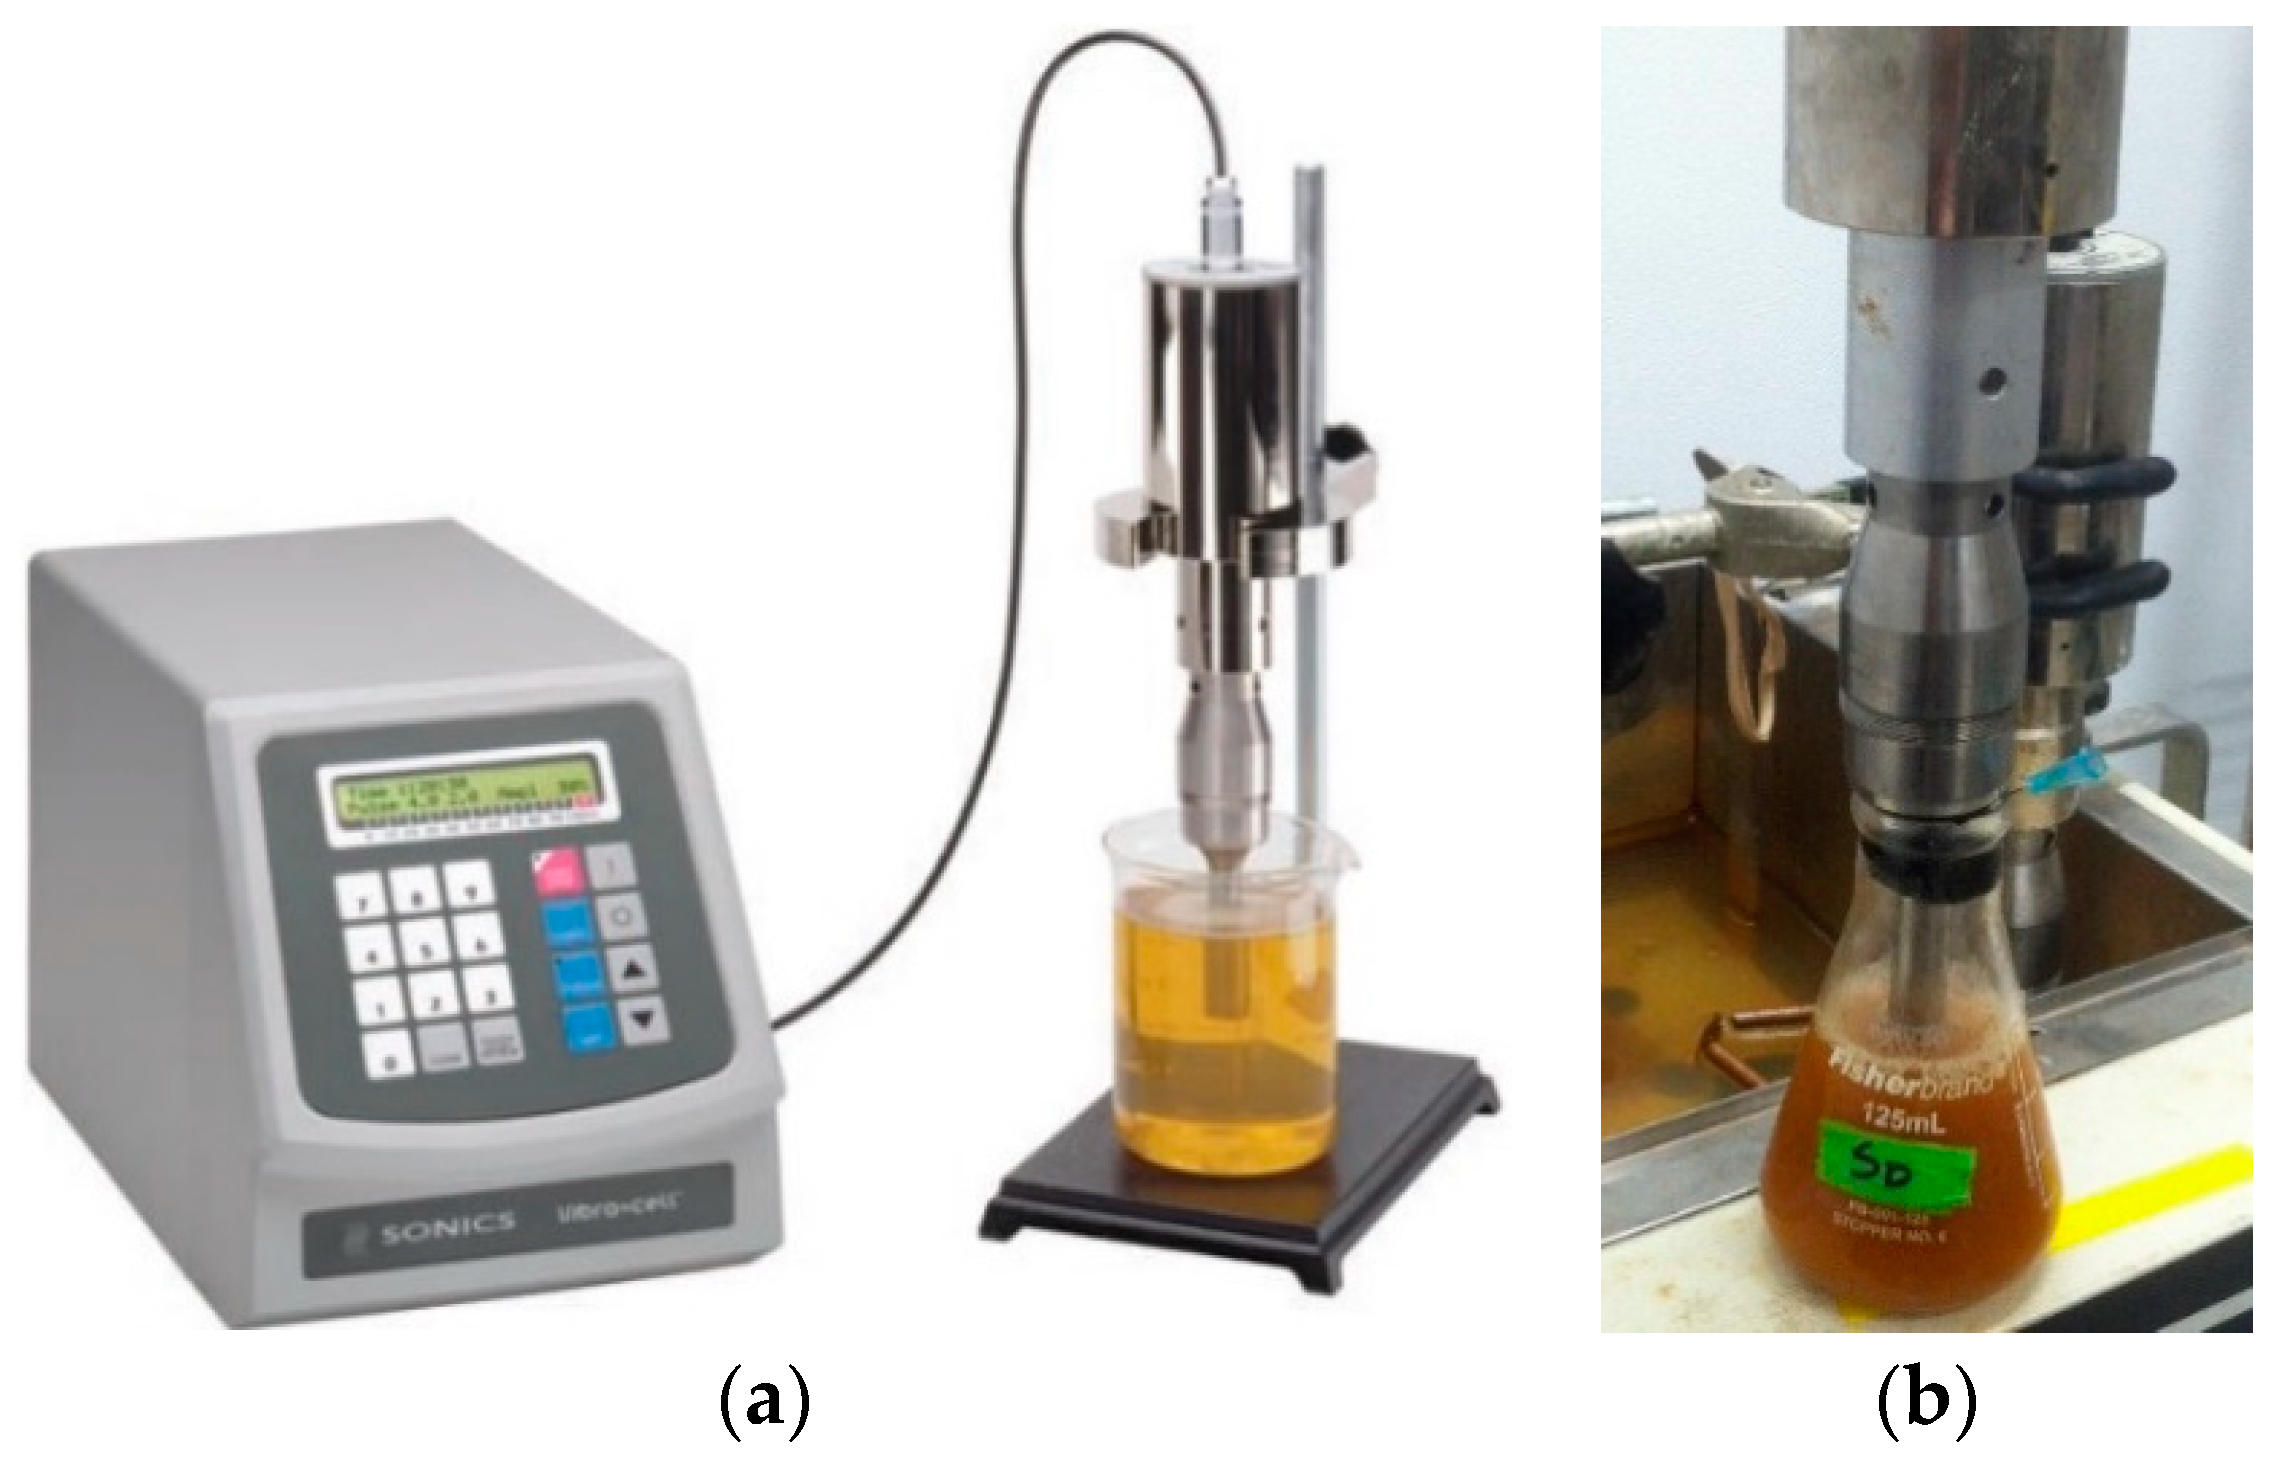
The ultrasound equipment (Sonics® & Materials, Inc., Newtown, CT, USA) used included a vibracell control panel operating at 750 W, a converter (Model CV33), and a probe (13 mm diameter, threaded end) (Figure 1a,b). The ultrasound intensity was controlled by changing the amplitude and duty cycle. The duty cycle used was 15 s, with 1 s on and 14 s off, for a total of 4 s/min. The duty cycle expressed in percentage is equal to the pulse time divided by the cycle time, in this case (1/15) = 6.67% duty cycle. Ultrasound was provided to the fermentation broth at a frequency of 20 kHz and depth of 1 cm. The energy densities for the different treatments were calculated by dividing the total number of Joules applied by the cumulative amount of time that the probe was on, and the volume of the medium.
2.4. Sampling and Measurements
The fermentation medium was sampled every 12 h for 36 h. The experiments were stopped after 36 h when more than 75% of the glucose had been consumed and ethanol production had slowed. Glucose and ethanol concentrations were measured by centrifuging and filtering samples and then using high performance liquid chromatography (HPLC, Agilent Technologies 1200 series). The mobile phase was 0.005 mol/L H2SO4, at 0.6 mL/min; and an injection volume of 10 µL. A Rezex ROA-Organic acid H+ (8%) column and (Phenomenex®, Torrance, CA, USA) a security guard column AJO-4492 (Phenomenex®, Torrance, CA, USA) were used at a temperature of 80 °C.
Active and dead yeast cells were manually counted after staining with Trypan Blue solution. Counting was done using a hemocytometer and observed through a microscope. Hydrated yeast cells were considered active. Hydrated cells do not retain Trypan Blue stain while inactive and dead cells do and remain blue.
2.5. Experimental Design
Four different ultrasound intensities were investigated: direct ultrasound at 174 J/min (23 W/L) (D-1), direct ultrasound at 237 J/min (32 W/L) (D-2), indirect ultrasound at 1.4 W/L (I), and no-ultrasound (N), in a complete randomized design. All ultrasound treatments were placed inside a water-bath-shaker (D-1, D-2, and I). For treatments D-1 and D-2 the ultrasound probe was placed directly in the flask. Treatment I received the waves indirectly from the other two direct ultrasound treatments. Treatment N (control) was placed in a separate shaker. Treatments D-1 and D-2 had three replicates each, while treatments I and N had six replicates. The fermentation medium, inoculum, temperature, and agitation rates were the same for all treatments.
In previous studies, the ultrasound energy applied during fermentation ranged widely from low levels (5 W/L and 30 W/L), which improved ethanol production [14], to high levels (2000 W/L), which inhibited fermentation [19]. Various volumes, types of equipment, and conditions were used to distribute the ultrasound energy in these studies. The energy densities used in our study ranged from a low of approximately 1.4 W/L (indirect) to densities previously reported to improve fermentation (direct at 23 W/L and 32 W/L). Ultrasound was applied intermittently at a duty cycle of 6.67%
2.6. Mass Transfer Limitation
To determine whether ultrasound reduces external and intraparticle mass transfer limitations for glucose, ethanol, and carbon dioxide, the external and intraparticle observable moduli were calculated under a range of worst-case conditions (high ethanol concentration, saturating CO2 concentration, and low glucose concentration). The external and intraparticle observable moduli are factors used to evaluate the magnitude of external and intraparticle mass transfer resistances. These factors are a function of the reaction rate and concentrations in the bulk liquid (Cb) and the cell surface (Cs) as well as the diffusivity, viscosity, density, and yeast cell size and density.
The external mass transfer modulus is used to determine the ratio of the concentrations of a component at the surface of a particle (CAs) to the concentration in the bulk medium (CAb). If CAs/CAb ≈ 1, the external mass transfer limitation is not significant since the concentration in the bulk medium is nearly the same as the concentration at the surface of the particle [40]. However, if CAs/CAb << 1, the external mass transfer limitation is significant. The observable modulus for external mass transfer is calculated using the following equation:
where is the dimensionless observable modulus for external mass transfer, R is the radius of the particle (yeast, m), rA, obs is the observed reaction rate, ks is the mass transfer coefficient, and CAb is the substrate concentration in the bulk medium. The concentration at the surface of a particle (CAs) is calculated by:
where CAs is the concentration at the surface of the particle, is the dimensionless observable modulus for external mass transfer, and CAb is the substrate concentration in the bulk medium. When << 1, CAs/CAb ≈ 1 [40].
The intraparticle mass transfer is calculated using the Thiele modulus, also called Weisz’s modulus. It is a dimensionless number defined as a ratio of the reaction rate to the diffusion rate [41]. It can be used to estimate intraparticle mass transfer limitations for substrates, without previous knowledge of the reaction kinetics [37]. If the Thiele observable modulus () has a value greater than 0.3, it indicates that internal mass transfer limitations are significant. If the value is lower than 0.3, it indicates that there is no internal mass transfer limitation in the system. The Thiele modulus is calculated using the following equation:
where Φ is the dimensionless observable Thiele modulus, R is the radius of the yeast (m), rA,obs is the observed reaction rate per unit volume of catalyst, DAe is the effective diffusivity of substrate, and CAs is the substrate concentration at the external surface.
The external and intraparticle moduli were calculated using relevant ranges of values for yeast radius, diffusivity, concentration, and rate of uptake (or production) of glucose, ethanol, and carbon dioxide (Table 1). Values used for concentrations and rates are based on experimental conditions and results.
2.7. Statistical Analysis
The results of experiments on the effects of ultrasound on glucose uptake, ethanol production, and active and dead yeast cells were statistically analyzed using JMP® Pro 12.2.0. Data was collected at 0, 12, 24, and 36 h. ANOVA or Welch ANOVA were performed within each response variable; p-values < 0.05 were considered significant and response variable means were analyzed by Tukey—Kramer’s HSD test.
3. Results and Discussion
3.1. Mass Transfer Limitation
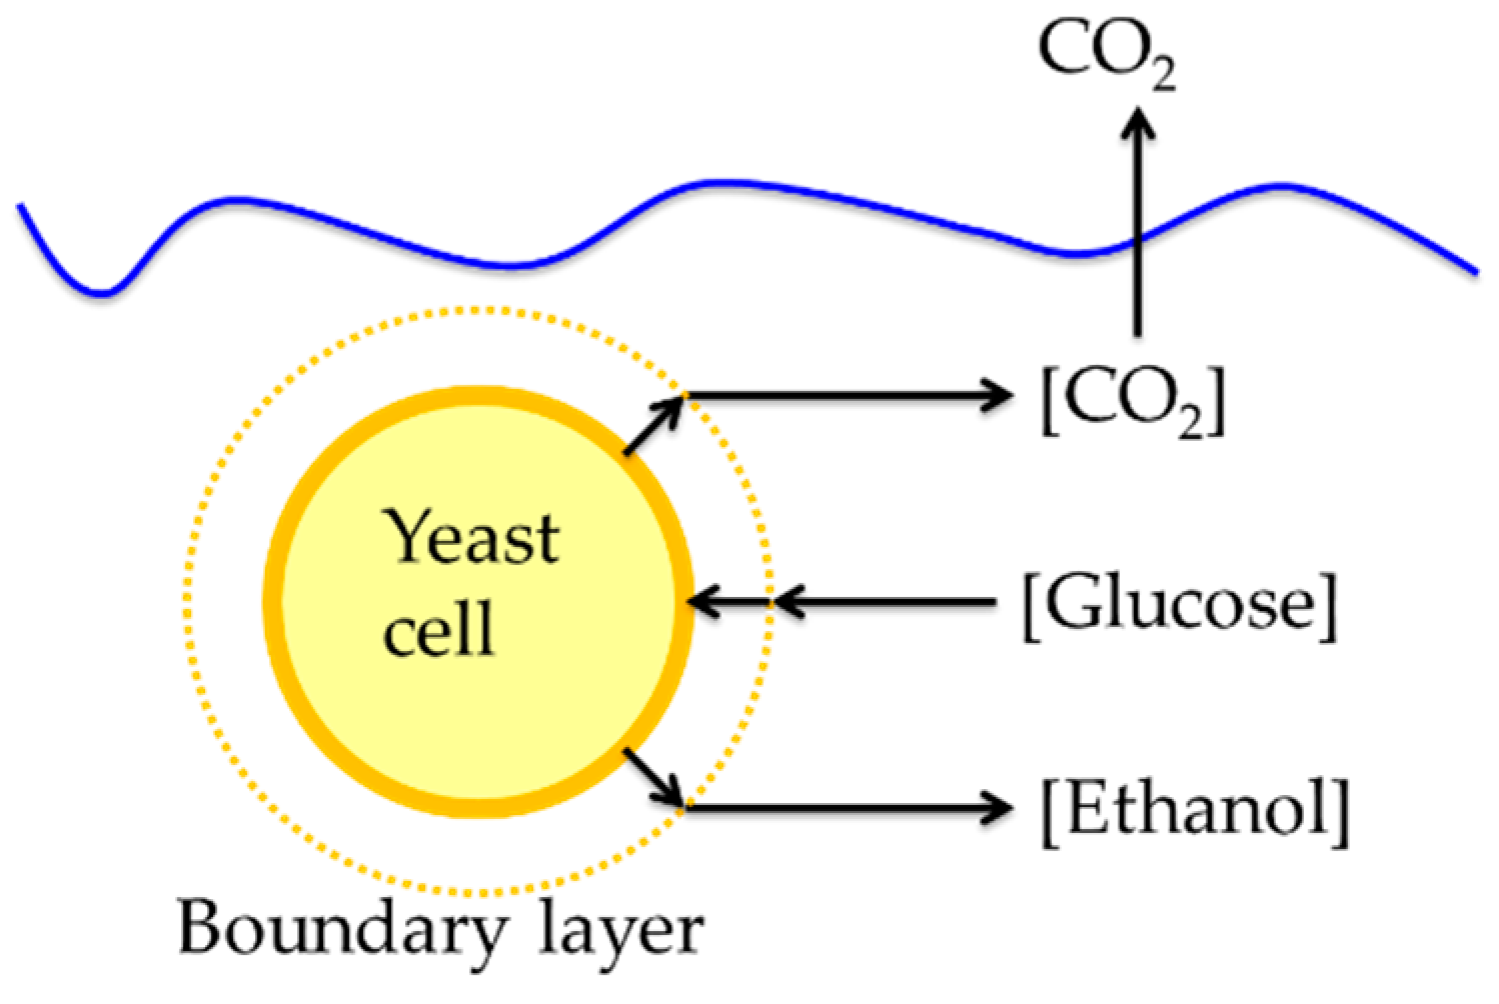
Mass transfer in yeast fermentations occurs as substrates and products move to and from cells in the fermentation broth (Figure 2). Glucose moves from the bulk liquid to the boundary layer, where the concentration begins to decrease due to cell uptake, then to the cell surface, through the cell wall, and finally inside the cell. Ethanol and carbon dioxide produced within the cell must move from within cells through the boundary layer to the bulk liquid [40].
In order to calculate the external and intraparticle modulus for glucose, ethanol, and carbon dioxide, a range of values for yeast radii, diffusivity, concentration, and rate of uptake or production were used. The values were based on experimental conditions or literature sources. The values for yeast radii used were 1.5 and 5 µm. The diffusivity values used were 7.3 × 10⁻¹⁰ m2/s for glucose [42], 1.4 × 10⁻⁹ m2/s for ethanol [42], and 2.1 × 10⁻⁹ m2/s for carbon dioxide [43]. The concentrations of glucose and ethanol used were based on the range of values observed during experiments. Glucose concentrations were 200 and 20 g/L, corresponding to different times during fermentation. Ethanol concentrations were 10 and 100 g/L and carbon dioxide concentration used was 1.6 × 10⁻² M [43]. The rates of glucose, ethanol, and carbon dioxide used were low and high values obtained during experiments over a 12 h period, glucose 25 and 75 (g/L)/12 h, and ethanol and carbon dioxide 15 and 50 (g/L)/12 h.
The results of the calculations of the external mass transfer moduli () were well below a value of 1 in all cases (Table 2). This indicates that the concentration of substrate in the bulk liquid would be expected to be essentially the same as at the surface of the yeast cell, and that no mass transfer limitation exists.
The intraparticle (Φ) Thiele observable modulus, calculated over a range of concentrations, rates, and yeast radii, were all well below a value of 0.3 (Table 2). This indicates that there should be no limitation for glucose entering the yeast cell. Similarly, low modulus values were found for ethanol and carbon dioxide leaving the cell.
These results indicate that it is not likely that the improvements observed in ethanol production in previous studies were due to reducing the mass transfer limitation of the system [35].
3.2. Fermentation
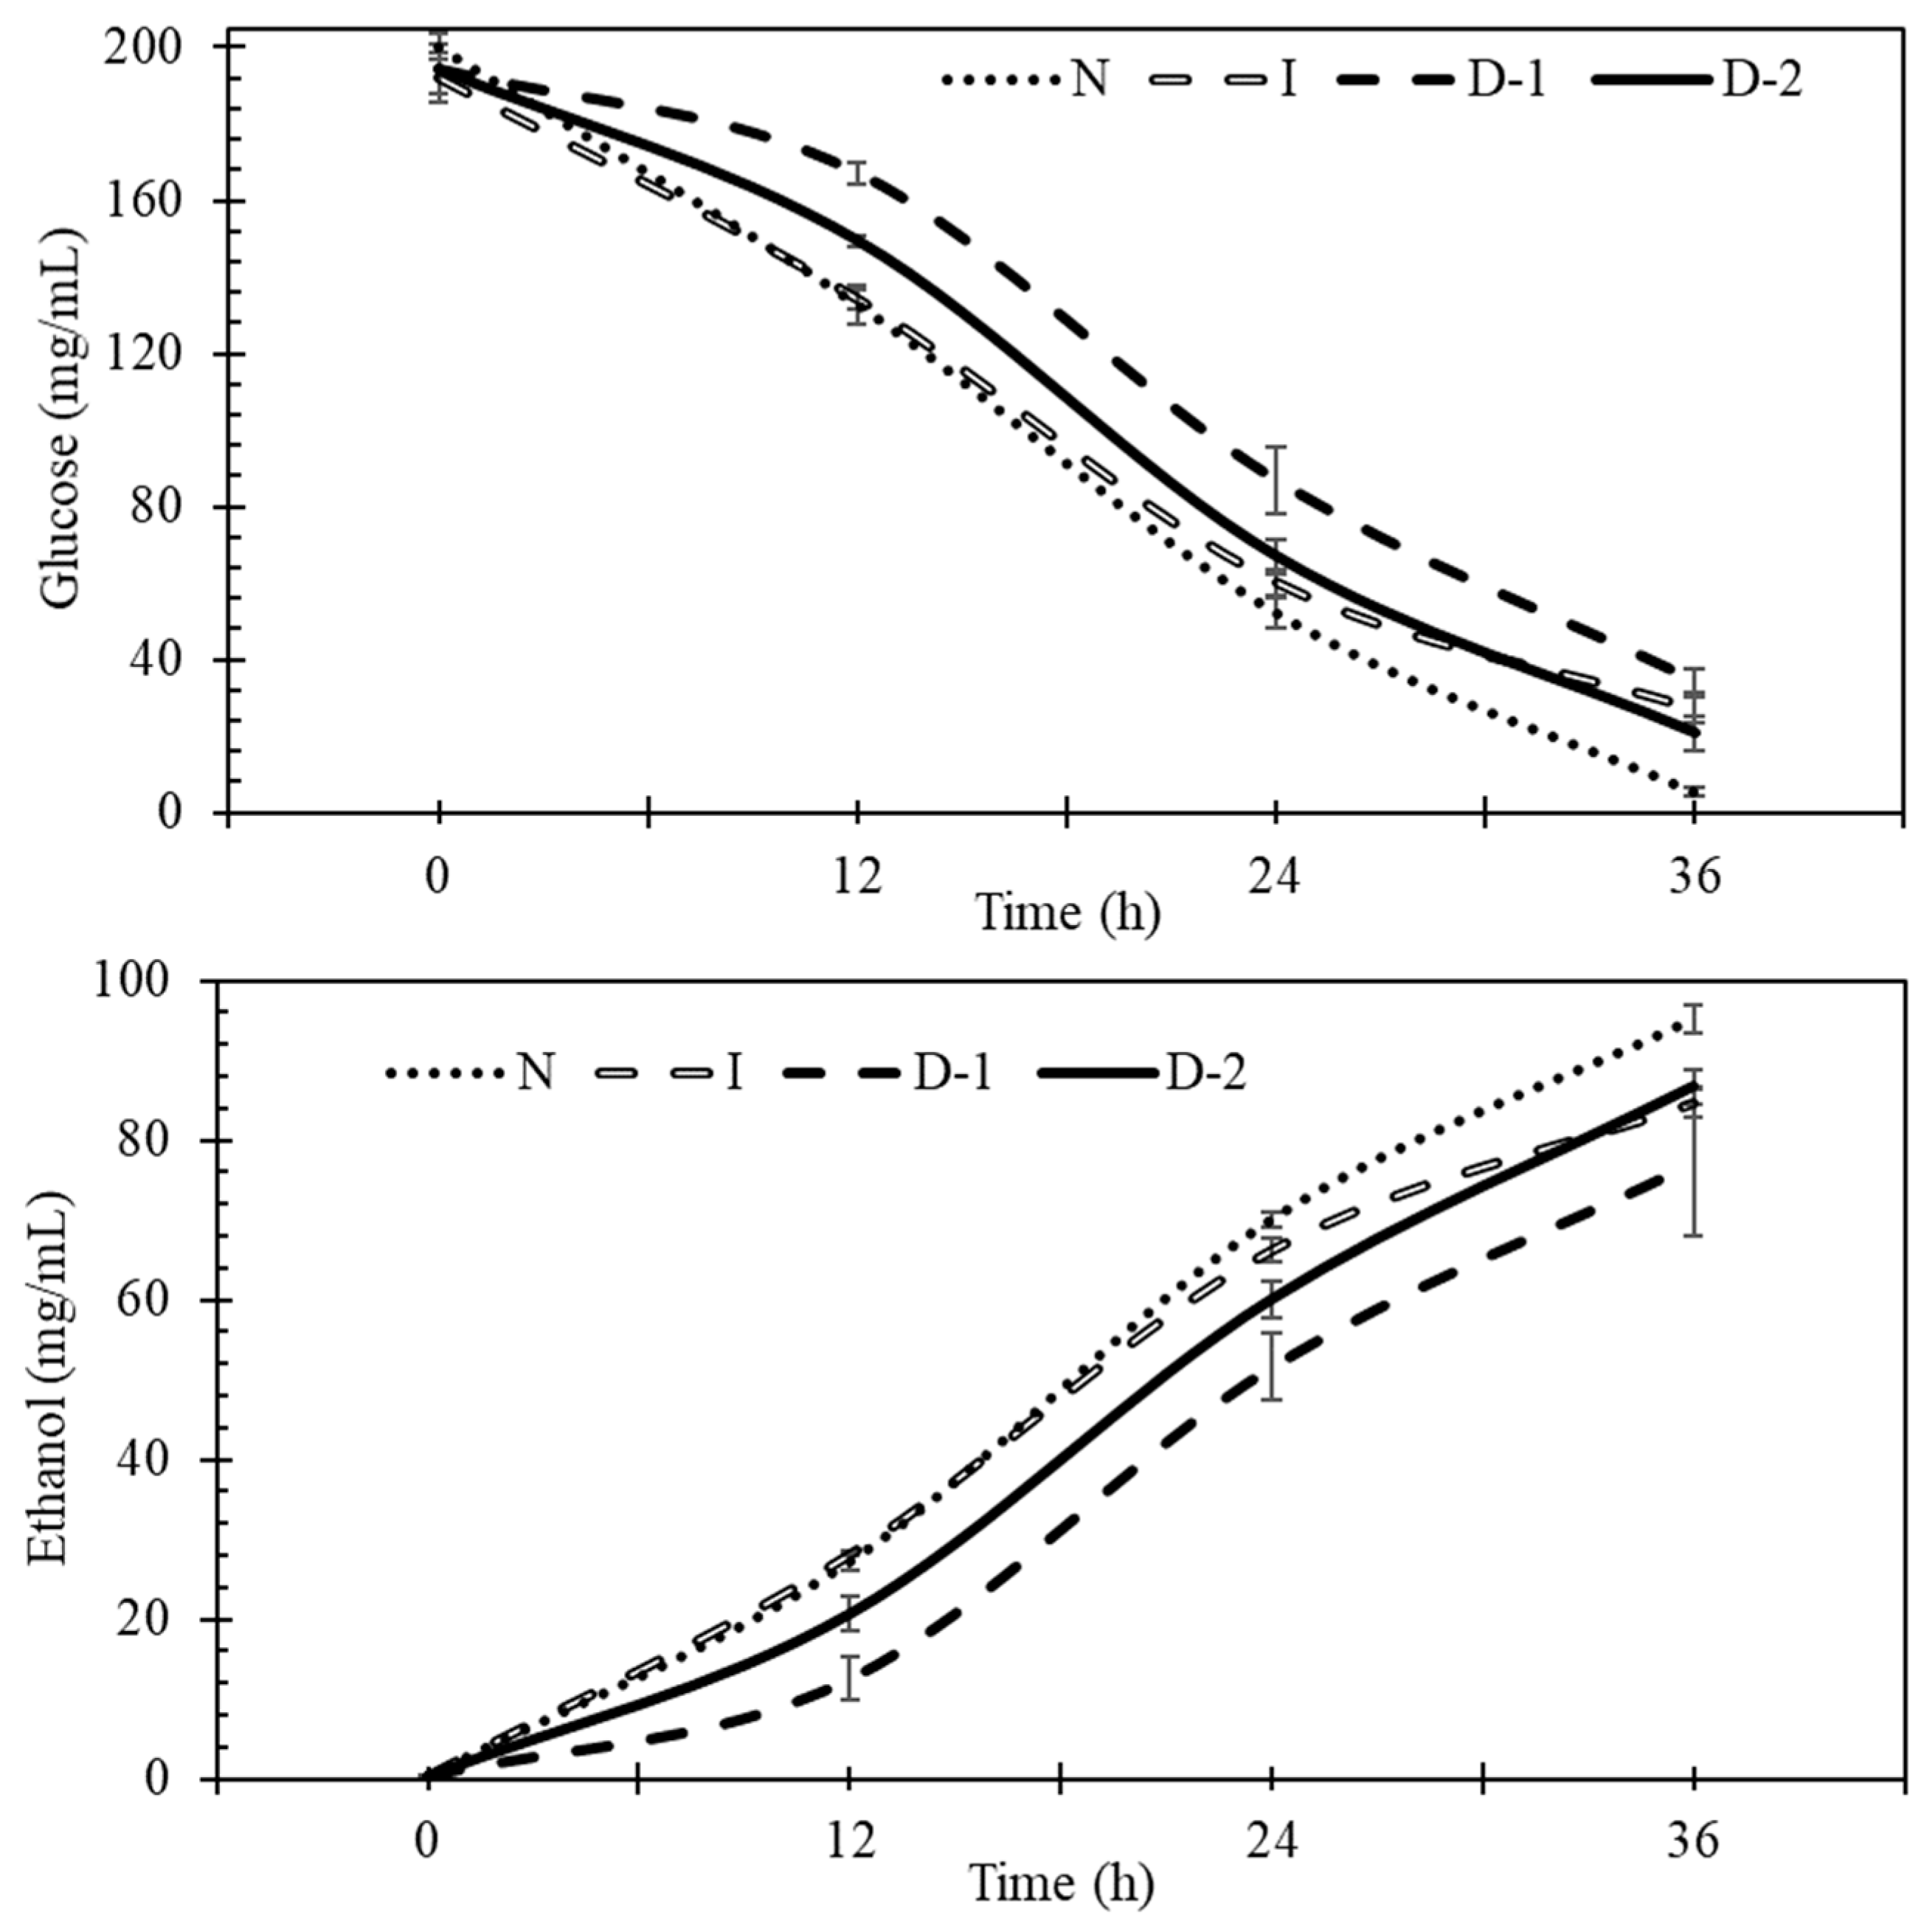
Experiments were conducted to better understand the effects of direct and indirect ultrasound on glucose uptake, ethanol production, and yeast cells during fermentation. Glucose uptake and ethanol production during fermentation for the four treatments showed that indirect ultrasound (I) and no ultrasound (N) treatments had faster glucose uptake and ethanol production rates than direct ultrasound treatments, especially during the first 12 h (Figure 3).
3.3. Glucose Uptake
Glucose is a used as the carbon source for energy and growth by Saccharomyces cerevisiae. In this study, glucose was used as the only substrate to restrict the effects of ultrasound to glucose mass transfer, and not more complex substrate interactions. Biomass substrates such as corn slurry have already been shown to release additional starch under ultrasound or cavitation conditions [5,6,10,15]. Furthermore, there is no evidence that ultrasound affects the glucose molecule itself, since ultrasound wavelengths are too long compared to the size of the glucose molecule [44].
The initial concentration of glucose was 200 g/L. This concentration is not expected to inhibit the yeast due to osmotic pressure effects [45], as this typically occurs at concentrations greater than 380 g/L [46]. During the first 12 h, glucose uptake in treatment N was significantly faster than in D-1 and D-2, by 64% and 38%, respectively (Figure 4). These findings indicate that ultrasound manifested negative effects at the beginning of the fermentation. The highest glucose uptake rates were observed between 12 and 24 h for all the treatments, and no significant differences were found during this period. Between 24 and 36 h, the rates of glucose uptake by D-1 and D-2 were greater than for N. This was likely because they had more glucose remaining during this period, as compared to treatment N. After 36 h, the total glucose consumption in N was 19%, 12%, and 15% higher than D-1, D-2, and I, respectively (Figure 4). The lower glucose uptake rates in the ultrasound treatments indicates that there was a negative impact of ultrasound. According to Radel [20], sub-lethal levels of ultrasound may not directly kill yeast, but may affect the morphology of some cell structures, such as the vacuole, which may negatively impact yeast metabolism.
3.4. Ethanol Production
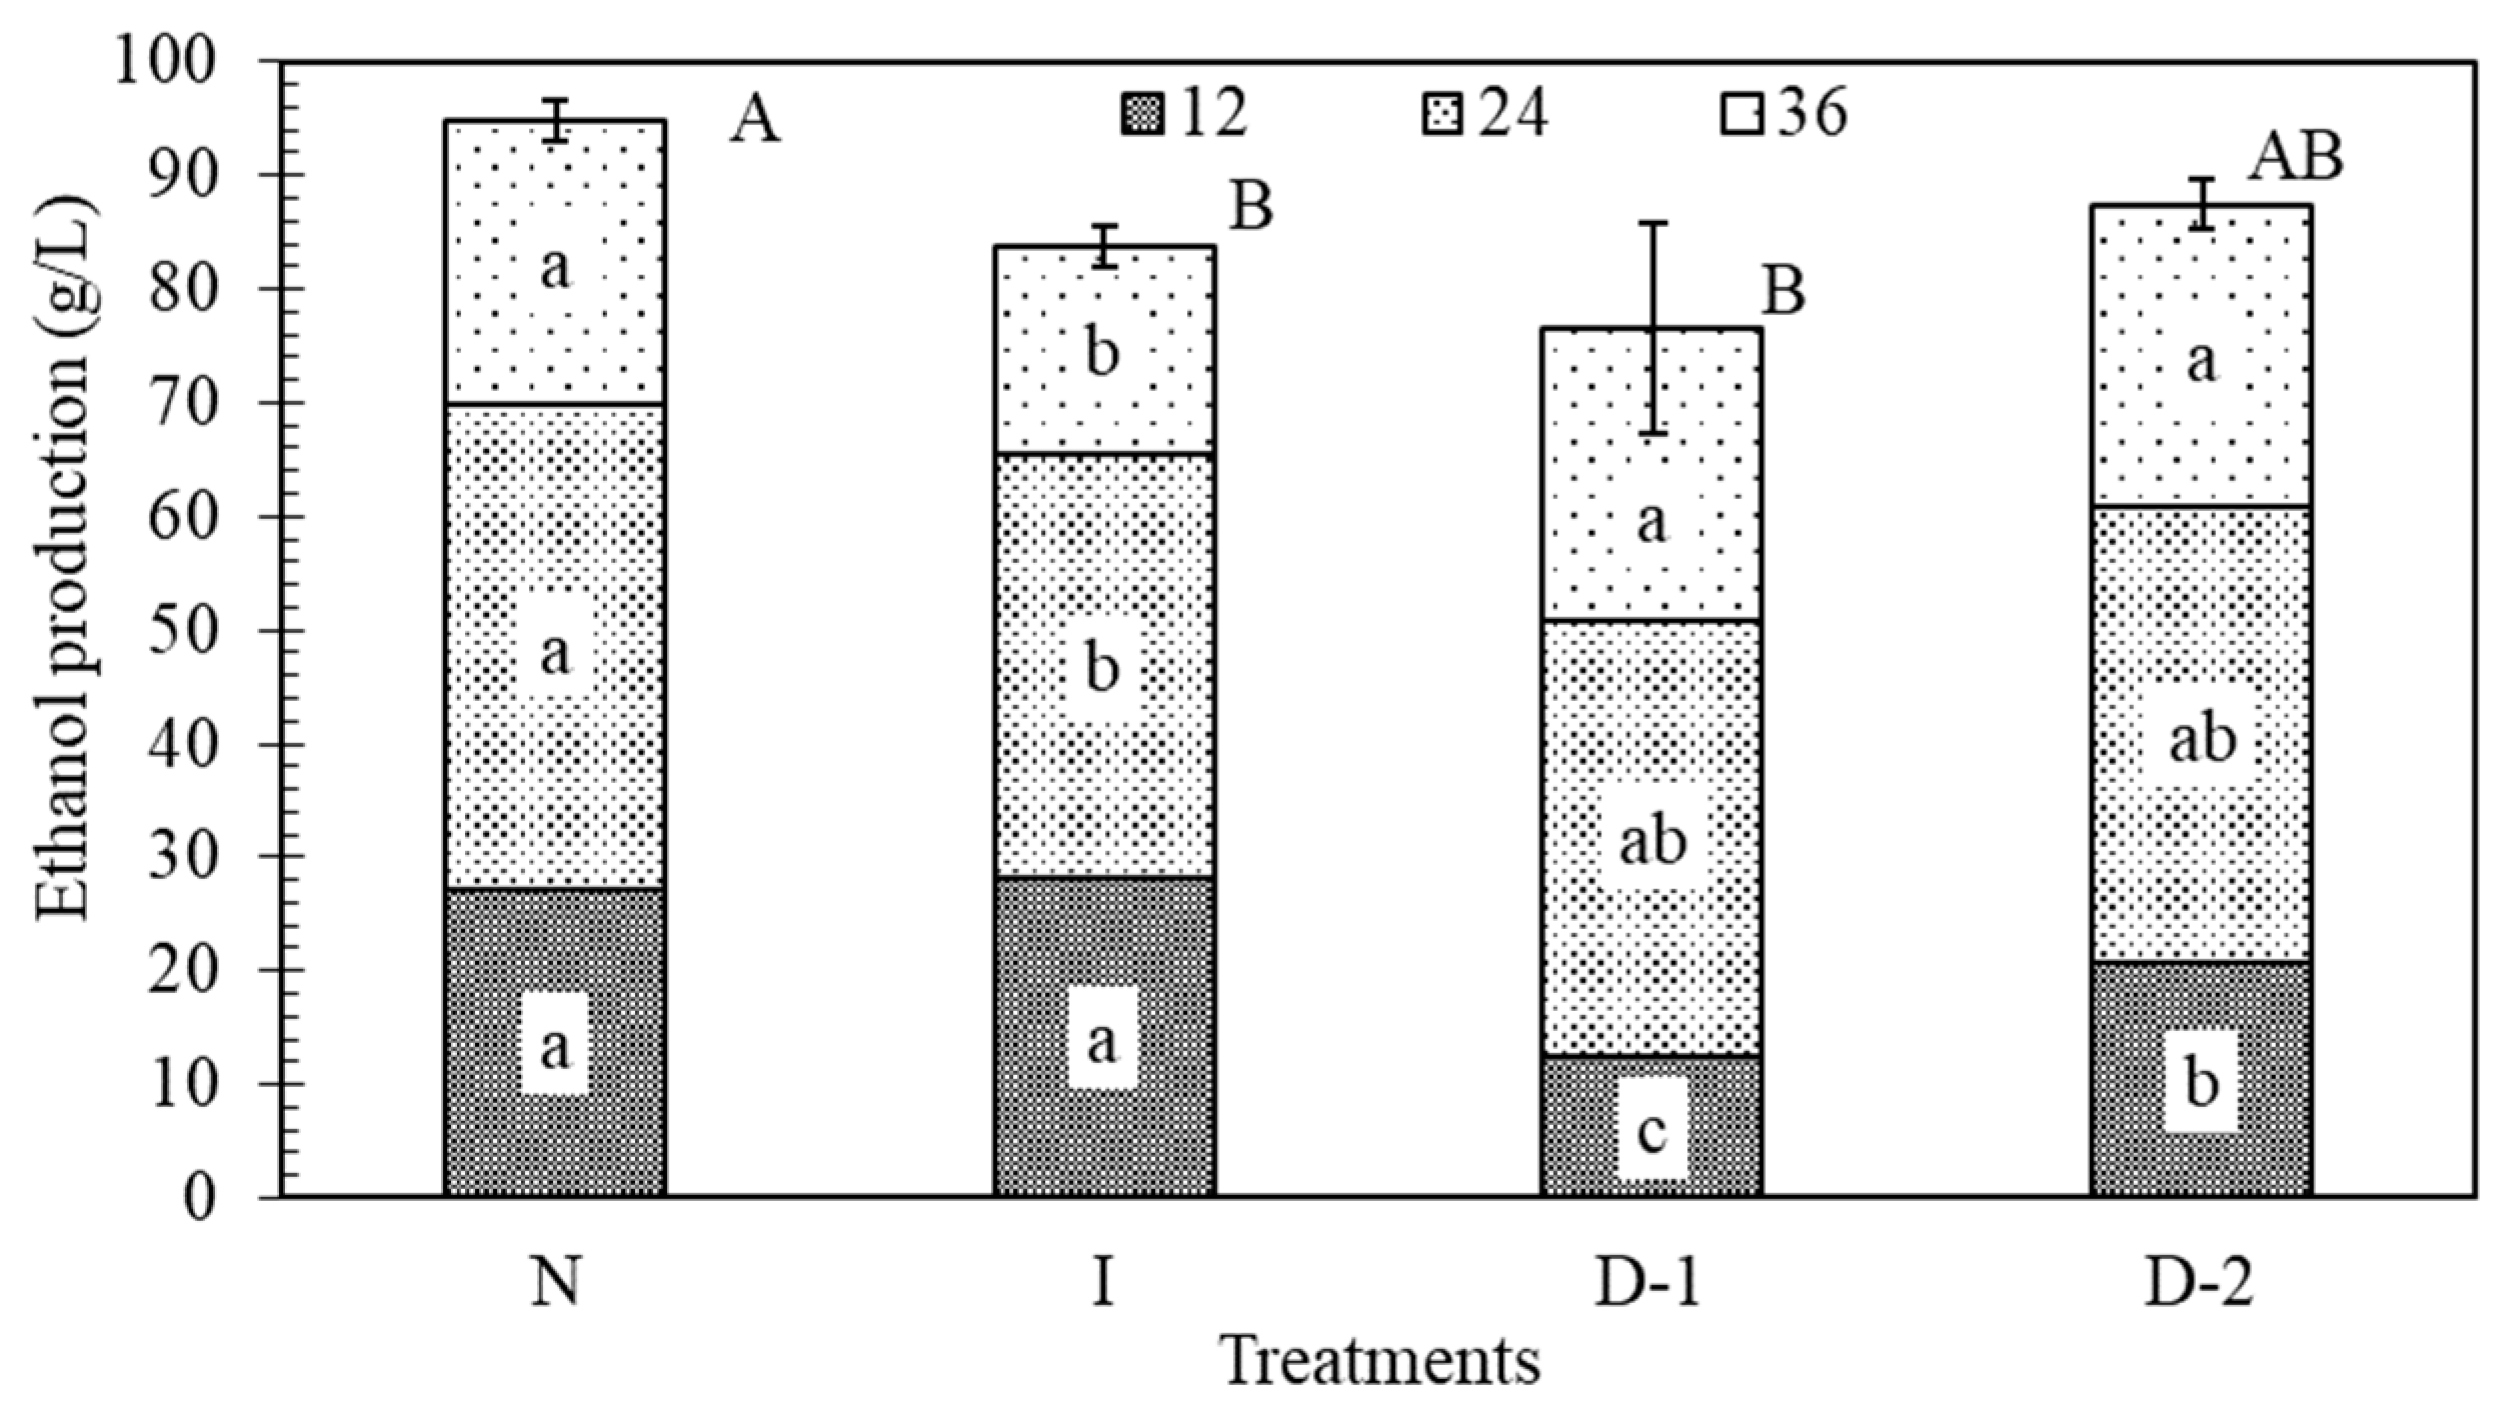
Ethanol is the product of interest, but also an inhibitor to yeast. If it accumulates near the yeast cell at high concentrations it can inhibit the rate of fermentation. During the first 12 h of fermentation, the ethanol production in treatments D-1 and D-2 was significantly lower than in N and I, which indicated that direct ultrasound had a negative effect on the production of ethanol (Figure 5). Lanchun [47] found that yeast cells are more sensitive to environmental perturbations during the lag phase when they are preparing for growth and reproduction. Between the 12 and 24 h, treatment N had the highest ethanol production rate, but it was not significantly greater than the rate in the other treatments. From 24 to 36 h, treatments D-1 and D-2 produced more ethanol than treatments N and I. The reason is likely the same as for glucose uptake. Treatments D-1 and D-2 initially produced ethanol at a slower rate than N and I, which allowed them to have more sugar to convert to ethanol at the end. After 36 h, N had produced 11%, 19%, and 9% more ethanol than treatments I, D-1, and D-2, respectively. Ultrasound had a negative impact on the production of ethanol, which was significant in treatments I and D-1 (Figure 5).
3.5. Yeast Viability
Results showed that treatment N had higher concentrations of active yeast cells and less dead cells than all the other treatments during fermentation (Figure 6). The fastest growth of yeast occurred during the first 12 h, and the differences between N and D-1 were significant. After 12 h of fermentation, D-1 and D-2 had significantly higher quantities of dead cells than the other treatments. After 36 h, treatment N had significantly fewer dead cells than treatments I and D-1 (Figure 6). All three levels of ultrasound significantly increased the quantity of dead cells during the first 12 h.
Yeast viability, calculated as the ratio of living to total cells, was negatively affected by ultrasound (Figure 7). Ultrasound is known to cause cytolytic effects, but these effects depend on experimental conditions and type of microbes. In D-1 and D-2, smaller cells and particulate matter were found to be scattered in the extracellular medium (Figure 8), similar to observations made by Radel [20]. Yeast viability for N was above 90% during the entire fermentation, while viability in I, D-1, and D-2 after 36 h was 78%, 74%, and 84%, respectively. After only 12 h of fermentation, the fraction of viable yeast cells in D-2 was lower, and in D-1 was significantly lower, than in the other treatments. At 24 h, treatment D-1 was significantly lower than I and N; and at 36 h, all ultrasound treatments were less viable than the control (N).
The decrease in viability in treatment N at the end of the fermentation was likely caused by the ethanol in the medium, which is a known inhibitor of yeast [48,49], and not due to ultrasound as no-ultrasound was applied. During fermentation, the concentration of ethanol reached ~80 g/L, and it has been found that ethanol concentrations of 70 g/L begin to inhibit yeast cells [46]. In biological membranes, water penetrates the lipid bilayer and forms hydrogen bonds with the polar groups of phospholipids, at increased ethanol concentrations, this water is replace by ethanol, altering the structure and function of the membrane [50]. Another possibility is that ethanol denatures proteins by interacting with non-polar parts of the molecules [51].
The combined effects of ethanol on the cell membrane and ultrasound seem to have contributed to a faster decline in yeast cell viability in the other treatments. The beginning of the decline in viability for treatment N coincided with increasing ethanol concentrations. Both the higher ethanol concentration plus ultrasound were causes of the viability declines in the other treatments. Other studies have not found negative effects on cell physiology by using standing waves in retention systems [52], but have found morphological changes on the cell vacuole, intracellular material leakage, increased intracellular material in the extracellular space, and dead cells [20].
To further understand the qualitative effects of ultrasound on yeast morphology, images of the yeast were made for two treatments at 24 and 36 h of fermentation (Figure 8). More cells are apparent in treatment N (Figure 8A,C) as compared to treatment D-1 (Figure 8B,D). Treatment N also had fewer dead yeast cells (blue dots), less intracellular material lysed from the cells (blurry dots in the background), and more and bigger cells as compared to ultrasound treatment D-1 (Figure 8B,D).
In contrast to the results of this study, Neel [35] reported that ultrasound improved the rate of ethanol production during fermentation of glucose by Saccharomyces cerevisiae. Indirect ultrasound was applied at 40 kHz and 120 W, using an ultrasonic bath with a 4.5 L volume, where the flasks were located. These were compared to stirred (1000 rpm) and unstirred treatments. Yeast agglomerated more in the control treatments than in the bath sonication treatments, which may have led to the observed beneficial effects of ultrasound. Indirect ultrasound fermentation was complete after 11 h, compared to the control treatment which required 18 h. Neel found that ultrasound provided better mixing and reduced cell agglomerates and hypothesized that it may have removed ethanol from the yeast surface and CO2 from the fermentation medium, promoted changes in membrane permeability, and enhanced mass transfer. However, Neel also found that horn-type ultrasound treatments ruptured yeast cells and produced no ethanol. The inhibitory effects observed in our study, may be due to the direct application of ultrasound applied and the lack of cell agglomeration.
5. Conclusions
In this study, direct and indirect ultrasound were applied to a medium during ethanol fermentation and its effect on glucose uptake, ethanol production, and yeast viability were investigated. The hypothesis was that ultrasound may enhance the performance of Saccharomyces cerevisiae by reducing the boundary layer at the cell surface and reduce mass transfer limitations for glucose, ethanol, and carbon dioxide, as has been reported in other studies [35,36]. However, our calculations of the external and intraparticle moduli showed that there should not be mass transfer limitations for glucose, ethanol, or carbon dioxide at the yeast surface, despite this being reported elsewhere [35]. In fact, experimentation showed that both direct and indirect ultrasound negatively affected the performance of yeast during fermentation. The three ultrasound treatments had significantly lower rates of glucose uptake and ethanol production compared to the control treatment (no-ultrasound). Yeast cell density and viability were also negatively affected by ultrasound. Direct ultrasound had a greater negative effect on yeast cell density and viability than indirect treatment or no-ultrasound. The quantity of dead cells was also significantly lower in the control treatment. The negative effects of ultrasound were mostly found at the beginning of the fermentation, during the first 12 h. However, direct ultrasound treatments also exhibited lower rates of glucose uptake, ethanol production, and cell viability, as compared to indirect and no-ultrasound treatments throughout the study. Findings from this study differ from some previous studies and suggest that ultrasound can have multiple impacts on fermentation processes.
Author Contributions
L.H. and F.C.M.J. planned the study, L.H. performed the experiments and wrote the manuscript, L.H. and F.C.M.J. analysed the data and F.C.M.J. and A.S. revised the manuscript.
Funding
The research was funded through a graduate research stipend provided to Luis Huezo by the Department of Food, Agricultural, and Biological Engineering of The Ohio State University.
Acknowledgments
The authors acknowledge sonication equipment use and research discussions with Arisdyne System, LLC of Cleveland OH.
Conflicts of Interest
The authors declare no conflicts of interest. The funders had no role in the design of the study; in the collection, analyses, or interpretation of data; in the writing of the manuscript, or in the decision to publish the results.
References
- Renewable Fuel Association World Fuel Ethanol Production. [Internet]. (2016). Available online: http://ethanolrfa.org/resources/industry/statistics/#1454098996479-8715d404-e546 (accessed on 27 December 2016).
- Aristidou, A.; Baghaei, N.; Javed, M.; Hartley, B. Conversion of Renewable Resources to Biofuel and Fine Chemicals: Current Trends and Future Prospects. In Fermentation Microbiology and Biotechnology; El-Mansi, E., Bryce, C., Dahhou, B., Sanchez, S., Demain, A., Allman, A., Eds.; CRC Press: New York, NY, USA, 2012; pp. 222–262. [Google Scholar]
- Fleet, G. The microorganisms of wine making—Isolation, enumeration and identification. In Wine Microbiology and Beotechnology; CRC Press: Boca Raton, FL, USA, 1993; pp. 1–25. [Google Scholar]
- Dequin, S. The potential of genetic engineering for improving brewing, wine-making and baking yeasts. Appl. Microbiol. Biotechnol. 2001, 56, 577–588. [Google Scholar] [CrossRef]
- Ramirez-cadavid, D.A.; Kozyuk, O.; Lyle, P.; Michel, F.C. Effects of hydrodynamic cavitation on dry mill corn ethanol production. Process Biochem. 2016, 51, 500–508. [Google Scholar] [CrossRef] [Green Version]
- Ramirez, D.; Kozyuk, O.; Michel, F. Improvement in commercial scale dry mill corn ethanol production using controlled flow cavitation and cellulose hydrolysis. Biomass Conver. Biorefinery 2013, 211–224. [Google Scholar]
- Dhanalakshmi, N.P.; Nagarajan, R. Ultrasonic Intensification of the Chemical Degradation of Methyl Violet: An experimental Study. Int. J. Chem. Mol. Nucl. Mater. Metallurg. Eng. 2011, 5, 537–542. [Google Scholar]
- Suslick, K.S.; Didenko, Y.; Fang, M.M.; Hyeon, T.; Kolbeck, K.J.; McNamara, W.B., III; Mdleleni, M.M.; Wong, M. Acoustic cavitation and its chemical consequences. Philos. Trans. R. Soc. A 1999, 357, 335–353. [Google Scholar] [CrossRef] [Green Version]
- Michel, F.; Kozyuk, O. Hydrodynamic Cavitation Processing. In Chemical Processes for a Sustainable Future; Letcher, T., Scott, J., Patterson, D., Eds.; The Royal Society of Chemistry: London, UK, 2015; pp. 84–142. [Google Scholar]
- Khanal, S.K.; Montalbo, M.; Van Leeuwen, J.H.; Srinivasan, G.; Grewell, D. Ultrasound Enhanced Glucose Release From Corn in Ethanol Plants. Biotechnol. Bioeng. 2007, 98, 978–985. [Google Scholar] [CrossRef] [PubMed]
- Nitayavardhana, S.; Shrestha, P.; Rasmussen, M.L.; Lamsal, B.P.; van Leeuwen, J.; Khanal, S.K. Ultrasound improved ethanol fermentation from cassava chips in cassava-based ethanol plants. Bioresour. Technol. 2010, 101, 2741–2747. [Google Scholar] [CrossRef] [PubMed]
- Nikoli, S.; Mojovi, L.; Rakin, M.; Pejin, D.; Pejin, J. Ultrasound-assisted production of bioethanol by simultaneous saccharification and fermentation of corn meal. Food Chem. 2010, 122, 216–222. [Google Scholar] [CrossRef]
- Bussemaker, M.; Zhang, D. Effect of Ultrasound on Lignocellulosic Biomass as a Pretreatment for Biorefinery and Biofuel Applications. Ind. Eng. Chem. Res. 2013, 52, 3563–3580. [Google Scholar] [CrossRef]
- Sulaiman, A.Z.; Ajit, A.; Yunus, R.M.; Chisti, Y. Ultrasound-assisted fermentation enhances bioethanol productivity. Biochem. Eng. J. 2011, 54, 141–150. [Google Scholar] [CrossRef]
- Ramirez, D. Improvement of Ethanol Production on Dry-Mill Process Using Hydrodynamic Cavitation Pretreatment; The Ohio State University: Columbus, OH, USA, 2012. [Google Scholar]
- Feng, X.; Deng, J.; Lei, H.; Bai, T.; Fan, Q.; Li, Z. Dewaterability of waste activated sludge with ultrasound conditioning. Bioresour. Technol. 2009, 100, 1074–1081. [Google Scholar] [CrossRef]
- Entezari, M.; Petrier, C. A combination of ultrasound and oxidative enzyme: Sono-biodegradation of substituted phenols. Ultrasound Sonochem. 2003, 10, 241–246. [Google Scholar] [CrossRef]
- Khanal, S.K.; Grewell, D.; Sung, S.; Van Leeuwen, J. Ultrasound Applications in Wastewater Sludge Pretreatment: A Review. Crit. Rev. Environ. Sci. Technol. 2007, 37, 277–313. [Google Scholar] [CrossRef]
- Anderson, J.M. Effects of Ultrasonic Radiation on Growth and Fermentation in the Yeast, Saccharomyces cerevisiae. Biochim. Biophys. Acta 1953, 11, 122–137. [Google Scholar] [CrossRef]
- Radel, S.; McLoughlin, A.J.; Gherardini, L.; Doblhoff-Dier, O.; Benes, E. Viability of yeast cells in well controlled propagating and standing ultrasonic plane waves. Ultrasonics 2000, 38, 633–637. [Google Scholar] [CrossRef]
- Guerrero, S.; Tognon, M.; Alzamora, S.M. Response of Saccharomyces cerevisiae to the combined action of ultrasound and low weight chitosan. Food Control 2005, 16, 131–139. [Google Scholar] [CrossRef]
- Tsukamoto, I.; Constantinoiu, E.; Furuta, M.; Nishimura, R.; Maeda, Y. Inactivation effect of sonication and chlorination on Saccharomyces cerevisiae. Calorimetric Analysis. Ultrason. Sonochem. 2004, 11, 167–172. [Google Scholar] [CrossRef] [PubMed]
- Tsukamoto, I.; Yim, B.; Stavarache, C.E.; Furuta, M.; Hashiba, K.; Maeda, Y. Inactivation of Saccharomyces cerevisiae by ultrasonic irradiation. Ultrason. Sonochem. 2004, 11, 61–65. [Google Scholar] [CrossRef]
- Ma, Y.Q.; Chen, J.C.; Liu, D.H.; Ye, X.Q. Effect of ultrasonic treatment on the total phenolic and antioxidant activity of extracts from citrus peel. J. Food Sci. 2008, 73, T115–T120. [Google Scholar] [CrossRef]
- Liu, D.; Zeng, X.A.; Sun, D.W.; Han, Z. Disruption and protein release by ultrasonication of yeast cells. Innov. Food Sci. Emerg. Technol. 2013, 18, 132–137. [Google Scholar] [CrossRef]
- Iida, Y.; Tuziuti, T.; Yasui, K.; Kozuka, T.; Towata, A. Protein release from yeast cells as an evaluation method of physical effects in ultrasonic field. Ultrason. Sonochem. 2008, 15, 995–1000. [Google Scholar] [CrossRef] [PubMed]
- Mason, T.J.; Paniwnyk, L.; Lorimer, J.P. The uses of ultrasound in food technology. Ultrason. Sonochem. 1996, 3, S253–S260. [Google Scholar] [CrossRef]
- Vivek, K.; Subbarao, K.V.; Srivastava, B. Optimization of postharvest ultrasonic treatment of kiwifruit using RSM. Ultrason. Sonochem. 2016, 32, 328–335. [Google Scholar] [CrossRef] [PubMed]
- Wood, B.E.; Aldrich, H.C.; Ingram, L.O. Ultrasound Stimulates Ethanol Production during the Simultaneous Saccharification and Fermentation of Mixed Waste Office Paper. Biotechnol. Prog. 1997, 13, 232–237. [Google Scholar] [CrossRef] [PubMed]
- Chuanyun, D.; Bochu, W.; Chuanren, D.; Sakanishi, A. Low ultrasonic stimulates fermentation of riboflavin producing strain Ecemothecium ashbyii. Colloids Surf. B Biointerfaces 2003, 30, 37–41. [Google Scholar] [CrossRef]
- Matsuura, K.; Hirotsune, M.; Nunokawa, Y.; Satoh, M.; Honda, K. Acceleration of Cell Growth and Ester Formation by Ultrasonic Wave Irradiation. J. Ferment. Bioeng. 1994, 77, 36–40. [Google Scholar] [CrossRef]
- Schläfer, O.; Sievers, M.; Klotzbücher, H.; Onyeche, T.I. Improvement of biological activity by low energy ultrasound assisted bioreactors. Ultrasonics 2000, 38, 711–716. [Google Scholar] [CrossRef]
- Choi, E.J.; Ahn, H.; Kim, M.; Han, H.; Kim, W.J. Effect of ultrasonication on fermentation kinetics of beer using six-row barley cultivated in Korea. J. Inst. Brew. 2015, 121, 510–517. [Google Scholar] [CrossRef] [Green Version]
- Chisti, Y.; Moo-Young, M. Disruption of microbial cells for intracellular products. Enzym. Microb. Technol. 1986, 8, 194–204. [Google Scholar] [CrossRef] [Green Version]
- Neel, P.; Gedanken, A.; Schwarz, R.; Sendersky, E. Mild sonication accelerates ethanol production by yeast fermentation. Energy Fuels 2012, 26, 2352–2356. [Google Scholar] [CrossRef]
- Lanchun, S.; Bochu, W.; Zhiming, L.; Chuanren, D.; Chuanyun, D.; Sakanishi, A. The research into the influence of low-intensity ultrasonic on the growth of S. cerevisiaes. Colloids Surf. B Biointerfaces 2003, 30, 43–49. [Google Scholar] [CrossRef]
- Michel, F.C.; Grulke, E.A. A Kinetic Model for the Fungal Pellet Lifecycle. AIChE J. 1992, 38, 1449–1460. [Google Scholar] [CrossRef]
- Dowe, N.; McMillan, J. SSF Experimental Protocols—Lignocellulosic Biomass Hydrolysis and Fermentation; Laboratory Analytical Procedure: Washington, DC, USA, 2008.
- Montalbo-lomboy, M.T. Ultrasonic Pretreatment for Enhanced Saccharification and Fermentation of Ethanol Production from Corn; Iowa State University: Ames, IA, USA, 2008. [Google Scholar]
- Doran, P.M. Heterogeneous Reactions. In Bioprocess Engineering Principles; All Rights Reserved; Elsevier Ltd.: Amsterdam, The Netherlands, 2013; ISBN 9780471186588. [Google Scholar]
- Kraakman, N.J.R.; Rocha-Rios, J.; Van Loosdrecht, M.C.M. Review of mass transfer aspects for biological gas treatment. Appl. Microbiol. Biotechnol. 2011, 91, 873–886. [Google Scholar] [CrossRef] [PubMed] [Green Version]
- Gutenwik, J.; Nilsson, B.; Axelsson, A. Mass transfer effects on the reaction rate for heterogeneously distributed immobilized yeast cells. Biotechnol. Bioeng. 2002, 79, 664–673. [Google Scholar] [CrossRef] [PubMed]
- Chaix, E.; Guillaume, C.; Guillard, V. Oxygen and Carbon Dioxide Solubility and Diffusivity in Solid Food Matrices: A Review of Past and Current Knowledge. Compr. Rev. Food Sci. Food Saf. 2014, 13, 261–286. [Google Scholar] [CrossRef] [Green Version]
- Bang, J.H.; Suslick, K.S. Applications of ultrasound to the synthesis of nanostructured materials. Adv. Mater. 2010, 22, 1039–1059. [Google Scholar] [CrossRef] [PubMed]
- Moulin, G.; Boze, H.; Galzy, P. Inhibition of Alcoholic Fermentation. Biotechnol. Genet. Eng. 1984, 2, 365–382. [Google Scholar] [CrossRef] [Green Version]
- Maiorella, B.; Blanch, H.W.; Wilke, C.R. By-product inhibition effects on ethanolic fermentation by Saccharomyces cerevisiae. Biotechnol. Bioeng. 1983, 25, 103–121. [Google Scholar] [CrossRef]
- Lanchun, S.; Bochu, W.; Liancai, Z.; Jie, L.; Yanhong, Y.; Chuanren, D. The influence of low-intensity ultrasonic on some physiological characteristics of Saccharomyces cerevisiae. Colloids Surf. B Biointerfaces 2003, 30, 61–66. [Google Scholar] [CrossRef]
- Rosa, M.F.; Sá-Correia, I. Intracellular acidification does not account for inhibition of Saccharomyces cerevisiae growth in the presence of ethanol. FEMS Microbiol. Lett. 1996, 135, 271–274. [Google Scholar] [CrossRef]
- Lucero, P.; Penalver, E.; Moreno, E.; Lagunas, R. Internal trehalose protects endocytosis from inhibition by ethanol in Saccharomyces cerevisiae. Appl. Environ. Microbiol. 2000, 66, 4456–4461. [Google Scholar] [CrossRef] [PubMed]
- Crowe, L.M.; Mouradian, R.; Crowe, J.H.; Jackson, S.A.; Womersley, C. Effects of carbohydrates on membrane stability at low water activities. Biochim. Biophys. Acta BBA Biomembr. 1984, 769, 141–150. [Google Scholar] [CrossRef]
- Liu, Z.; Li, X. The kinetics of ethanol fermentation based on adsorption processes. Kem. Ind. J. Chem. Chem. Eng. 2014, 63, 259–264. [Google Scholar]
- Doblhoff-Dier, O.; Gaida, T.; Katinger, H.; Burger, W.; Gröschl, M.; Benes, E. A novel ultrasonic resonance field device for the retention of animal cells. Biotechnol. Prog. 1994, 10, 428–432. [Google Scholar] [CrossRef] [PubMed]
Figure 1.
Ultrasound equipment. (a) Ultrasound equipment including vibracell control panel at 750 W, converter (Model CV33), and probe (b) 3 mm diameter, threaded end inside the flask, laboratory set up.
Figure 1.
Ultrasound equipment. (a) Ultrasound equipment including vibracell control panel at 750 W, converter (Model CV33), and probe (b) 3 mm diameter, threaded end inside the flask, laboratory set up.

Figure 2.
Diagram showing substrate and product mass transfer pathways to a yeast cell during fermentation.
Figure 2.
Diagram showing substrate and product mass transfer pathways to a yeast cell during fermentation.

Figure 3.
Glucose and ethanol concentrations during fermentation. No-ultrasound (N), indirect ultrasound (I), direct ultrasound 1 (D-1), and direct ultrasound 2 (D-2).
Figure 3.
Glucose and ethanol concentrations during fermentation. No-ultrasound (N), indirect ultrasound (I), direct ultrasound 1 (D-1), and direct ultrasound 2 (D-2).

Figure 4.
Effect of ultrasound on glucose uptake (g/L) during fermentation at different time periods. Each total bar height indicates the amount of glucose consumed in 36 h. Shaded sections indicate amounts used during 12 h periods. Each texture pattern and treatment contain the result of the Tukey–Kramer HSD test, α = 0.05; lower case letters indicate significance of differences among treatments at the same time range; capital letters indicate differences among the total glucose uptake between treatments. The error bars indicate the standard deviation. No-ultrasound (N), indirect ultrasound (I), direct ultrasound 1 (D-1), and direct ultrasound 2 (D-2).

Figure 5.
Effects of ultrasound on ethanol production (g/L). Each treatment bar contains the amount of ethanol produced in 36 h, broken down in 12-h periods. Each texture pattern and treatment contain the result of the Tukey–Kramer HSD test, α = 0.05; lower case letters indicate significance of differences among treatments at the same time range; capital letters indicate differences among the total ethanol produced between treatments. No-ultrasound (N), indirect ultrasound (I), direct ultrasound 1 (D-1), and direct ultrasound 2 (D-2).

Figure 6.
Effects of ultrasound on concentrations of active and dead yeast cells during fermentation. No-ultrasound (N), indirect ultrasound (I), direct ultrasound 1 (D-1), and direct ultrasound 2 (D-2).
Figure 6.
Effects of ultrasound on concentrations of active and dead yeast cells during fermentation. No-ultrasound (N), indirect ultrasound (I), direct ultrasound 1 (D-1), and direct ultrasound 2 (D-2).

Figure 7.
Effects of ultrasound on the percentage of viable cells during fermentation. No-ultrasound (N), indirect ultrasound (I), direct ultrasound 1 (D-1), and direct ultrasound 2 (D-2).
Figure 7.
Effects of ultrasound on the percentage of viable cells during fermentation. No-ultrasound (N), indirect ultrasound (I), direct ultrasound 1 (D-1), and direct ultrasound 2 (D-2).

Figure 8.
Effects of ultrasound on yeast viability. (A,B) yeast cells after 24 h of inoculation for N and D-1, respectively; and (C,D) 36 h after inoculation for N and D-1, respectively. Each square with a triple line border represents approximately 1 mm2.
Figure 8.
Effects of ultrasound on yeast viability. (A,B) yeast cells after 24 h of inoculation for N and D-1, respectively; and (C,D) 36 h after inoculation for N and D-1, respectively. Each square with a triple line border represents approximately 1 mm2.


Table 1.
Range of values used to calculate mass transfer resistances.
| Yeast Radii (µm) | Compounds | Diffusivity (m2/s) | Concentrations (g/L) | Rates (g/L)/12 h |
|---|---|---|---|---|
| 1 and 5 | Glucose | 7.3 × 10⁻¹⁰ | 200 and 20 | 25 and 75 |
| Ethanol | 1.4 × 10⁻⁹ | 10 and 100 | 15 and 50 | |
| CO2 | 2.1 × 10⁻⁹ | 1.6 × 10⁻² M | 15 and 50 |
Table 2.
Calculated external mass transfer modulus and intraparticle Thiele observable modulus for glucose, ethanol, and carbon dioxide during fermentation.
Table 2.
Calculated external mass transfer modulus and intraparticle Thiele observable modulus for glucose, ethanol, and carbon dioxide during fermentation.
| External Mass Transfer Modulus, Ω | ||||
| Yeast Radius (m) | ||||
| 1.50 × 10⁻⁶ | 5.00 × 10⁻⁶ | |||
| Glucose (g/m3) | Rate ((g/L)/12 h) | |||
| 25 | 75 | 25 | 75 | |
| 200,000 | 3.33 × 10⁻⁹ | 9.99 × 10⁻⁹ | 1.11 × 10⁻⁸ | 3.33 × 10⁻⁸ |
| 20,000 | 3.33 × 10⁻⁸ | 9.99 × 10⁻⁸ | 1.11 × 10⁻⁷ | 3.33 × 10⁻⁷ |
| Ethanol (g/m3) | Rate ((g/L)/12 h) | |||
| 15 | 50 | 15 | 50 | |
| 10,000 | 2.01 × 10⁻⁸ | 6.69 × 10⁻⁸ | 6.69 × 10⁻⁸ | 2.23 × 10⁻⁷ |
| 100,000 | 2.01 × 10⁻⁹ | 6.69 × 10⁻⁹ | 6.69 × 10⁻⁹ | 2.23 × 10⁻⁸ |
| CO2 (g/m3) | Rate ((g/L)/12 h) | |||
| 15 | 50 | 15 | 50 | |
| 704 | 1.87 × 10⁻⁷ | 6.22 × 10⁻⁷ | 6.22 × 10⁻⁷ | 2.07 × 10⁻⁶ |
| Intraparticle Thiele Observable Modulus, Φ | ||||
| Yeast Radius (m) | ||||
| 1.50 × 10⁻⁶ | 5.00 × 10⁻⁶ | |||
| Glucose (g/m3) | Rate ((g/L)/12 h) | |||
| 25 | 75 | 25 | 75 | |
| 200,000 | 1.03 ×10⁻⁹ | 3.09 × 10⁻⁹ | 1.14 × 10⁻⁸ | 3.43 × 10⁻⁸ |
| 20,000 | 1.03 × 10⁻⁸ | 3.09 × 10⁻⁸ | 1.14 × 10⁻⁷ | 3.43 × 10⁻⁷ |
| Ethanol (g/m3) | Rate ((g/L)/12 h) | |||
| 15 | 50 | 15 | 50 | |
| 10,000 | 6.17 × 10⁻⁹ | 2.06 × 10⁻⁸ | 6.85 × 10⁻⁸ | 2.28 × 10⁻⁷ |
| 100,000 | 6.17 × 10⁻¹⁰ | 2.06 × 10⁻⁹ | 6.85 × 10⁻⁹ | 2.28 × 10⁻⁸ |
| CO2 (g/m3) | Rate ((g/L)/12 h) | |||
| 15 | 50 | 15 | 50 | |
| 704 | 5.76 × 10⁻⁸ | 1.92 × 10⁻⁷ | 6.40 × 10⁻⁷ | 2.13 × 10⁻⁶ |
© 2019 by the authors. Licensee MDPI, Basel, Switzerland. This article is an open access article distributed under the terms and conditions of the Creative Commons Attribution (CC BY) license (http://creativecommons.org/licenses/by/4.0/).
Share and Cite
MDPI and ACS Style
Huezo, L.; Shah, A.; Michel Jr., F.C. Effects of Ultrasound on Fermentation of Glucose to Ethanol by Saccharomyces cerevisiae. Fermentation 2019, 5, 16. https://0-doi-org.brum.beds.ac.uk/10.3390/fermentation5010016
AMA Style
Huezo L, Shah A, Michel Jr. FC. Effects of Ultrasound on Fermentation of Glucose to Ethanol by Saccharomyces cerevisiae. Fermentation. 2019; 5(1):16. https://0-doi-org.brum.beds.ac.uk/10.3390/fermentation5010016
Chicago/Turabian StyleHuezo, Luis, Ajay Shah, and Frederick C. Michel Jr. 2019. "Effects of Ultrasound on Fermentation of Glucose to Ethanol by Saccharomyces cerevisiae" Fermentation 5, no. 1: 16. https://0-doi-org.brum.beds.ac.uk/10.3390/fermentation5010016
Note that from the first issue of 2016, this journal uses article numbers instead of page numbers. See further details here.