Antioxidant Activity, Total Polyphenol, Flavonoid and Tannin Contents of Fermented Green Coffee Beans with Selected Yeasts


Department of Horticulture and Bio-system Engineering, Kangwon National University, Chuncheon 24341, Korea
*
Author to whom correspondence should be addressed.
Fermentation 2019, 5(1), 29; https://0-doi-org.brum.beds.ac.uk/10.3390/fermentation5010029
Submission received: 24 February 2019
/
Revised: 15 March 2019
/
Accepted: 20 March 2019
/
Published: 22 March 2019
Abstract
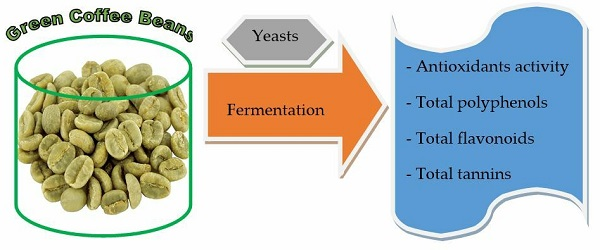
:We examined the antioxidant activity, total polyphenol content (TPC), total flavonoid content (TFC), total tannin content (TTC) and physical characteristics of green coffee beans fermented with selected yeasts. There was no significant (p > 0.05) interaction effect between yeast-fermented coffee extracts and duration of fermentation on antioxidant activity (oxygen radical absorbance capacity [ORAC] and superoxide dismutase-like [SOD-like] activity). However, the mean of the antioxidant activity (ORAC and SOD-like activity) significantly (p < 0.05) increased in the fermented coffee extracts compared to unfermented coffee. There were significant (p < 0.05) interaction effects between yeast-fermented coffee extracts and duration of fermentation (24 h and 48 h) on the TPC, TFC, TTC and pH of the fermented solution and on the colors of the ground-roasted coffee. The TPC showed a pattern of increase in samples Ferm-1 and Ferm-3 as fermentation time increased from 24 h to 48 h. However, a decreasing TPC trend was observed in Ferm-2 as the number of fermentation hours increased from 24 to 48. The fermented coffee beans had a significantly higher flavonoid content than the unfermented coffee beans, while fermentation significantly decreased the tannin content compared to that in unfermented coffee.

1. Introduction
Post-harvest coffee processing has a significant impact on coffee quality [1]. Fermentation is one of the most critical post-harvest processing steps during wet processing. Fermentation in coffee is primarily undertaken to remove the mucilage layer from the coffee parchment; however, fermentation is becoming an unskippable step in improving attributes of quality coffee. As described by Sunarharum et al. [2] coffee aroma is influenced by diverse factors from the farm to the cup. Both dry- and wet-processed coffees have been analyzed for their sensory profiles and have been perceived as more aromatic with fruity with acidic characteristics and retained minor bitter, burnt and woody notes [3,4]. These variations in sensory attributes are most likely associated with the fermentation process. The solid-state fermentation of food products, such as rice, soybeans and vegetables, is common in producing foods with notable and desirable aroma profiles [5,6]. Likewise, the fermentation and biotransformation of various coffee matrices along the coffee processing chain have resulted in coffees with novel and desirable traits. However, there is limited reporting about the fermentation of green coffee beans for coffee aroma modulation and improvement in antioxidant activity or total phenolic and flavonoid content. A few studies have examined the effects of solid-state fermentation of green coffee beans, using several indigenous filamentous fungi, on the aroma of coffee [7,8].
The functionality of food products can be improved by fermentation [9]. One of the best known foods produced through a fermentation process, particularly in Korea, is ginseng. The solid microbial fermentation of white ginseng significantly improves the superoxide dismutase-like (SOD-like) activity and ginsenoside contents [10,11]. It has also frequently been noted that antioxidant activity and phenolic compounds increase in fermented products.
Fermentation has improved the antioxidant activity and phenolic and flavonoid contents in fermented soybeans [12], okra seeds [13], legumes [14,15,16,17,18] and coffee [19]. As reported, soaking coffee beans in mulberry extract increases the antioxidant activity, total polyphenol content (TPC) and consumer acceptability [20]. However, the fermentation of green coffee beans to increase antioxidant activity and phenolic compounds has not been widely studied as a second processing step with respect to whether the coffee beans were obtained through dry-processing or wet-processing methods on the farm. To the best of the authors’ knowledge, only one study has been published, by Kwak et al. [19], regarding the fermentation effect on the antioxidant activity of green coffee beans fermented for 24 h and few studies have been published on the effect of fermenting green coffee beans on the aroma profile of the coffee. In previous experiments, green coffee was fermented with different yeast strains, yielding different unique results. This showed that different yeast species or strains can produce significant differences in antioxidant activity, TPC and TFC in fermented green coffee beans.
Therefore, we designed this experiment to study the antioxidant and physicochemical properties of green coffee beans fermented with different selected yeasts. The yeasts, previously identified in our lab from fermented coffee using wet-processing methods, are pectinase enzyme-producing yeasts. Further understanding of their impact on the quality parameters will increase the significance of their use as a starter culture.
2. Materials and Methods
2.1. Green Coffee Beans, Yeast Strains and Chemicals
The coffee cherry was harvested from mature coffee plants (Coffea arabica L.) in Kenya and followed the normal processing steps. Green coffee beans that obtained through wet-processing method were imported from Kenya and used in this study. The freeze-dried yeast cultures previously identified from coffee fermentation in our lab were used for this experiment. These yeasts are as follows: Saccharomyces cerevisiae (strain KNU18Y13), given the code Ferm-1 in this paper; Saccharomycopsis fibuligera (strain KNU18Y4), coded as Ferm-2; and Saccharomyces cerevisiae (strain KNU18Y12), coded as Ferm-3, where “Ferm” refers to “fermentation.” The selected yeasts have an important feature in coffee fermentation. All are pectinase enzyme producing yeasts. However, that is one of the most criteria for yeasts to be selected as a starter culture in coffee fermentation. In this experiment, we insisted to see further their impact on some coffee quality parameters through fermenting green coffee beans.
Disodium phosphate (Na2HPO4), aluminum chloride (AlCl3⋅6H2O), monosodium phosphate (NaH2PO4), sodium carbonate (Na2CO3), D-glucose and sodium nitrite (NaNO2) were supplied by Dae-Jung Chemicals & Metals Co., Ltd., (Jeongwang-dong, Shiheung-city, Gyeonggi-do, South Korea). Pyrogallol, 2, 2□-azobis (2-amidinopropane) dihydrochloride (AAPH), 3, 5-dinitrosalicylic acid (DNS) and fluorescein sodium were purchased from Santa Cruz Biotechnology, Inc. (Dallas, TX, USA). NaCl, ethylenediaminetetraacetic acid, yeast peptone dextrose, gallic acid, Folin-Ciocalteu’s phenol reagent, quercetin and Trolox were purchased from Sigma Aldrich LLC (St. Louis, MO, USA). Methanol was supplied by Merck KGaA (Darmstadt, Germany) and HCl was purchased from Junsei Chemical Co., Ltd. (4-4-16 Nihonbashi-honcho, Chuo-ku, Tokyo, Japan).
2.2. Fermentation of Green Coffee Beans
Pure cultures were prepared by propagating a freeze-dried yeast culture in a sterile yeast peptone dextrose broth (1% w/v casein peptone, 0.5% w/v yeast extract and 2% w/v dextrose) adjusted to pH 5.0 with 1 M hydrochloric acid at 30 °C for 48 h under aerobic conditions. Cell counts of approximately 1 × 10⁴ CFU/mL were prepared. The yeast cells were collected via centrifugation at 8000× g and were washed twice and resuspended in an equal volume of 100 mM phosphate buffer saline solution.
Green coffee beans (1000 g) were soaked in deionized water at 4 °C for 24 h, were steamed at 80 °C for 40 min and were cooled to room temperature under sterile conditions prior to fermentation. The heat-treated green coffee beans (250 g/ treatment) were put in water and were separately inoculated with three yeasts (1.0 × 10⁴ CFU/g coffee beans) in different plastic containers (2 L size). There was also a control (coffee beans subjected to the same treatment steps except for yeast inoculation). Fermentation was conducted for 24 h and then a total of 48 h at 30 °C. After fermentation, the green coffee beans were cleaned by washing three times using sterile water. A dry oven was used to dry the fermented coffee beans, adjusted to 45 °C to maintain the moisture content at 10%.
2.3. Fermentation Characteristics
The pH of the fermentation solution was regularly measured using a pH meter at 0 h, 24 h and 48 h. Similarly, the yeast-containing solutions were taken from the fermentation solutions after yeasts inoculation at 0 h, 24 h and 48 h and were serially diluted and spread onto the surface of YPD agar plates. The spread plates were incubated for 24 h at 30 °C to determine the total microbial counts.
2.4. Coffee Roasting and Grinding
The green coffee beans were roasted at 245 °C for 16 min using a coffee roaster (GeneCafe CR-100 coffee roaster, Genesis, Korea) to ensure a uniform roasting condition for all the fermented coffee. The roasted coffee beans were cooled for 30 min and kept at room temperature. The roasted coffee beans were then ground using the medium option on a coffee grinder (Latina 600N electric grinder).
2.5. Physical Characteristics of Roasted Coffee
The moisture content was determined according to procedures of the Association of Official Agricultural Chemists [21]. Approximately 1 g of ground coffee beans was dried at 105 °C after roasting until a consistent weight was achieved. A sensitive balance was used to measure the weights of the ground coffee before and after drying to determine the moisture content.
The color of the roasted ground coffee was measured using a Chroma meter (CR-400 Chroma Meter, Japan). Ground coffee (5 g) was put into a small weighing dish for measurement and lightness (L*), redness (a*) and yellowness (b*) were measured.
2.6. Coffee Brewing
Hot brew extraction was conducted using a coffee maker (HD7450, Philips, China) by mixing 36 g of coffee powder with 500 mL of water. A filter paper was used during brewing. After each brewing, the coffee machine was cleaned prior to brewing the next sample. Each experiment was performed in triplicate.
2.7. Antioxidant Activity
2.7.1. Oxygen Radical Absorbance Capacity
The oxygen radical absorbance capacity (ORAC) was measured using the method described by Ou et al. [22], with some modifications for in vitro antioxidant activity. Phosphate buffer (NaH2PO4-Na2HPO4, 10 mM, pH 7.0) was used to dissolve fluorescein powder. The coffee extract (50 μL) and 25 mM of the fluorescein solution (150 μL) were mixed and then incubated in a dark room for 10 min. A volume of 25 μL of 120 mM AAPH solution was then added to the coffee extract and fluorescein mixture. Meanwhile, the control used 10 mM phosphate buffer instead of coffee extract. Fluorescence was measured using a UV/visible spectrophotometer (U-2900, Hitachi High-Tech Corporation, Tokyo, Japan). Measurements were taken every minute for 90 min (excitation wavelength: 485 nm; emission wavelength: 535 nm). The ORAC values were calculated using the following formula and were presented as a μM Trolox equivalent/mL of coffee (μM TE/mL):
where CTrolox, k and AUC were the concentrations of Trolox (5 μM), the sample dilution factor and the area under the curve, respectively. AUC was calculated based on the following formula:
where fn was the fluorescence at time n (min).
ORAC (μM TE/g) = (CTrolox × (AUCSample − AUCBlank) × k)/AUCTrolox − AUCBlank
2.7.2. Superoxide Dismutase-Like Activity
SOD-like activity was determined using the method described by Marklund and Marklund [23], with some modifications. Coffee extract (400 μL), Tris-HCl buffer (600 μL, 50 mM tris (hydroxymethyl) aminomethane and 10 mM ethylenediaminetetraacetic acid, pH 8.0) and 7.2 mM pyrogallol (40 μL) were mixed together and kept at 25 °C for 10 min. The reaction was stopped by adding 0.1 N HCl (20 μL). The absorbance was measured at 420 nm using a UV/visible spectrophotometer (U-2900, Hitachi High-Tech Corporation, Tokyo, Japan). SOD-like activity was calculated based on the following equation:
where A was the absorbance of the sample and B was the absorbance of the control.
SOD-like activity (%) = (1 − A/B) × 100
2.8. Total Polyphenol Content
The TPC of the brewed coffee was measured using Singleton’s method [24], with some modifications. Coffee extract (20 μL) was diluted with 1580 μL of distilled water. Diluted coffee (160 μL) was mixed with Folin-Ciocalteu’s phenol reagent (10 μL) and was allowed to sit for 8 min. A volume of 30 μL of 20% Na2CO3 solution was added and the mixture was incubated in a dark room for 2 h. Distilled water instead of coffee extract was used as a control. The absorbance was measured at 765 nm by a UV/visible spectrophotometer (U-2900, Hitachi High-Tech Corporation, Tokyo, Japan). Gallic acid solutions (0–1 mg/mL) were used to generate a standard curve (r2 = 0.997). The results were presented as a mg gallic acid equivalent/mL (mg GAE/mL) of coffee extract.
2.9. Total Flavonoid Content
The total flavonoid content (TFC) for each coffee extract was evaluated according to the method described by Dewanto [25], with some modifications. Coffee extract (250 μL), distilled water (1 mL) and 75 μL of 5% NaNO2 were mixed together. After 5 min, 10% AlCl3 6H2O solution (150 μL) was added and incubated for 6 min. We injected 1 N NaOH (500 μL) and the mixture was incubated for 11 min. A blank sample was substituted for the diluted coffee extract with distilled water. The absorbance of the extract sample was measured at 510 nm against the blank sample, using a UV/visible spectrophotometer (U-2900, Hitachi High-Tech Corporation, Tokyo, Japan). The standard solution was prepared using a quercetin solution (0–1 mg/mL) to generate a standard curve (r2 = 0.999). The amount of flavonoids in the coffee was presented as a mg quercetin equivalent/mL of coffee extract.
2.10. Total Tannin Content
The tannins were determined using the Folin-Ciocalteu method, with minor modifications [26]. About 0.1mL of the coffee extract was added to a volumetric flask (10 mL) containing 7.5 mL of distilled water, 0.5 mL of Folin-Ciocalteu phenol reagent and 1 mL of 35% sodium carbonate solution and was then diluted to 10 mL with distilled water. The mixture was shaken well and kept at room temperature for 30 min. A set of reference standard solutions of tannic acid (20, 40, 60, 80, 100 μg/mL) was prepared. Absorbance for the test and standard solutions was measured with a UV/Visible spectrophotometer (U-2900, Hitachi High-Tech Corporation, Tokyo, Japan) against the blank (distilled water) at 700 nm. The estimation of the total tannin content (TTC) was carried out in triplicate. The tannin content was expressed in terms of mg/mL of tannic acid in the sample.
2.11. Statistical Analysis
The results were summarized using Microsoft Excel 2013. Analysis of variance (ANOVA), using SAS 9.4 software (SAS Institute, 100 Campus Drive, Cary, NC, USA), was performed to identify significant differences among samples.
3. Results
3.1. pH and Colony Count (log CFU/mL)
There were significant (p < 0.05) interactions between yeasts and fermentation hours on the pH of the solution used to ferment the green coffee beans. The pH of the solution was measured right after (0 h) the inoculation of the yeasts and it was 5.95 (Ferm-1), 6.42 (Ferm-2), 7.01 (Ferm-3) and 6.49 (control) (Figure 1). A significant pH reduction of 5.85 (Ferm-1), 5.71 (Ferm-2), 5.48 (Ferm-3) and 5.57 (control) was observed after the fermentation had proceeded for 24 h. The highest pH values were recorded in Ferm-2 (7.01) and Ferm3 (6.49). The lowest pH values were obtained in Ferm-2 (5.33) and Ferm-3 (5.43) after 48 h of fermentation. In all treatments, the pH of the solution during fermentation showed a decreasing pattern as the fermentation duration increased (Figure 1).
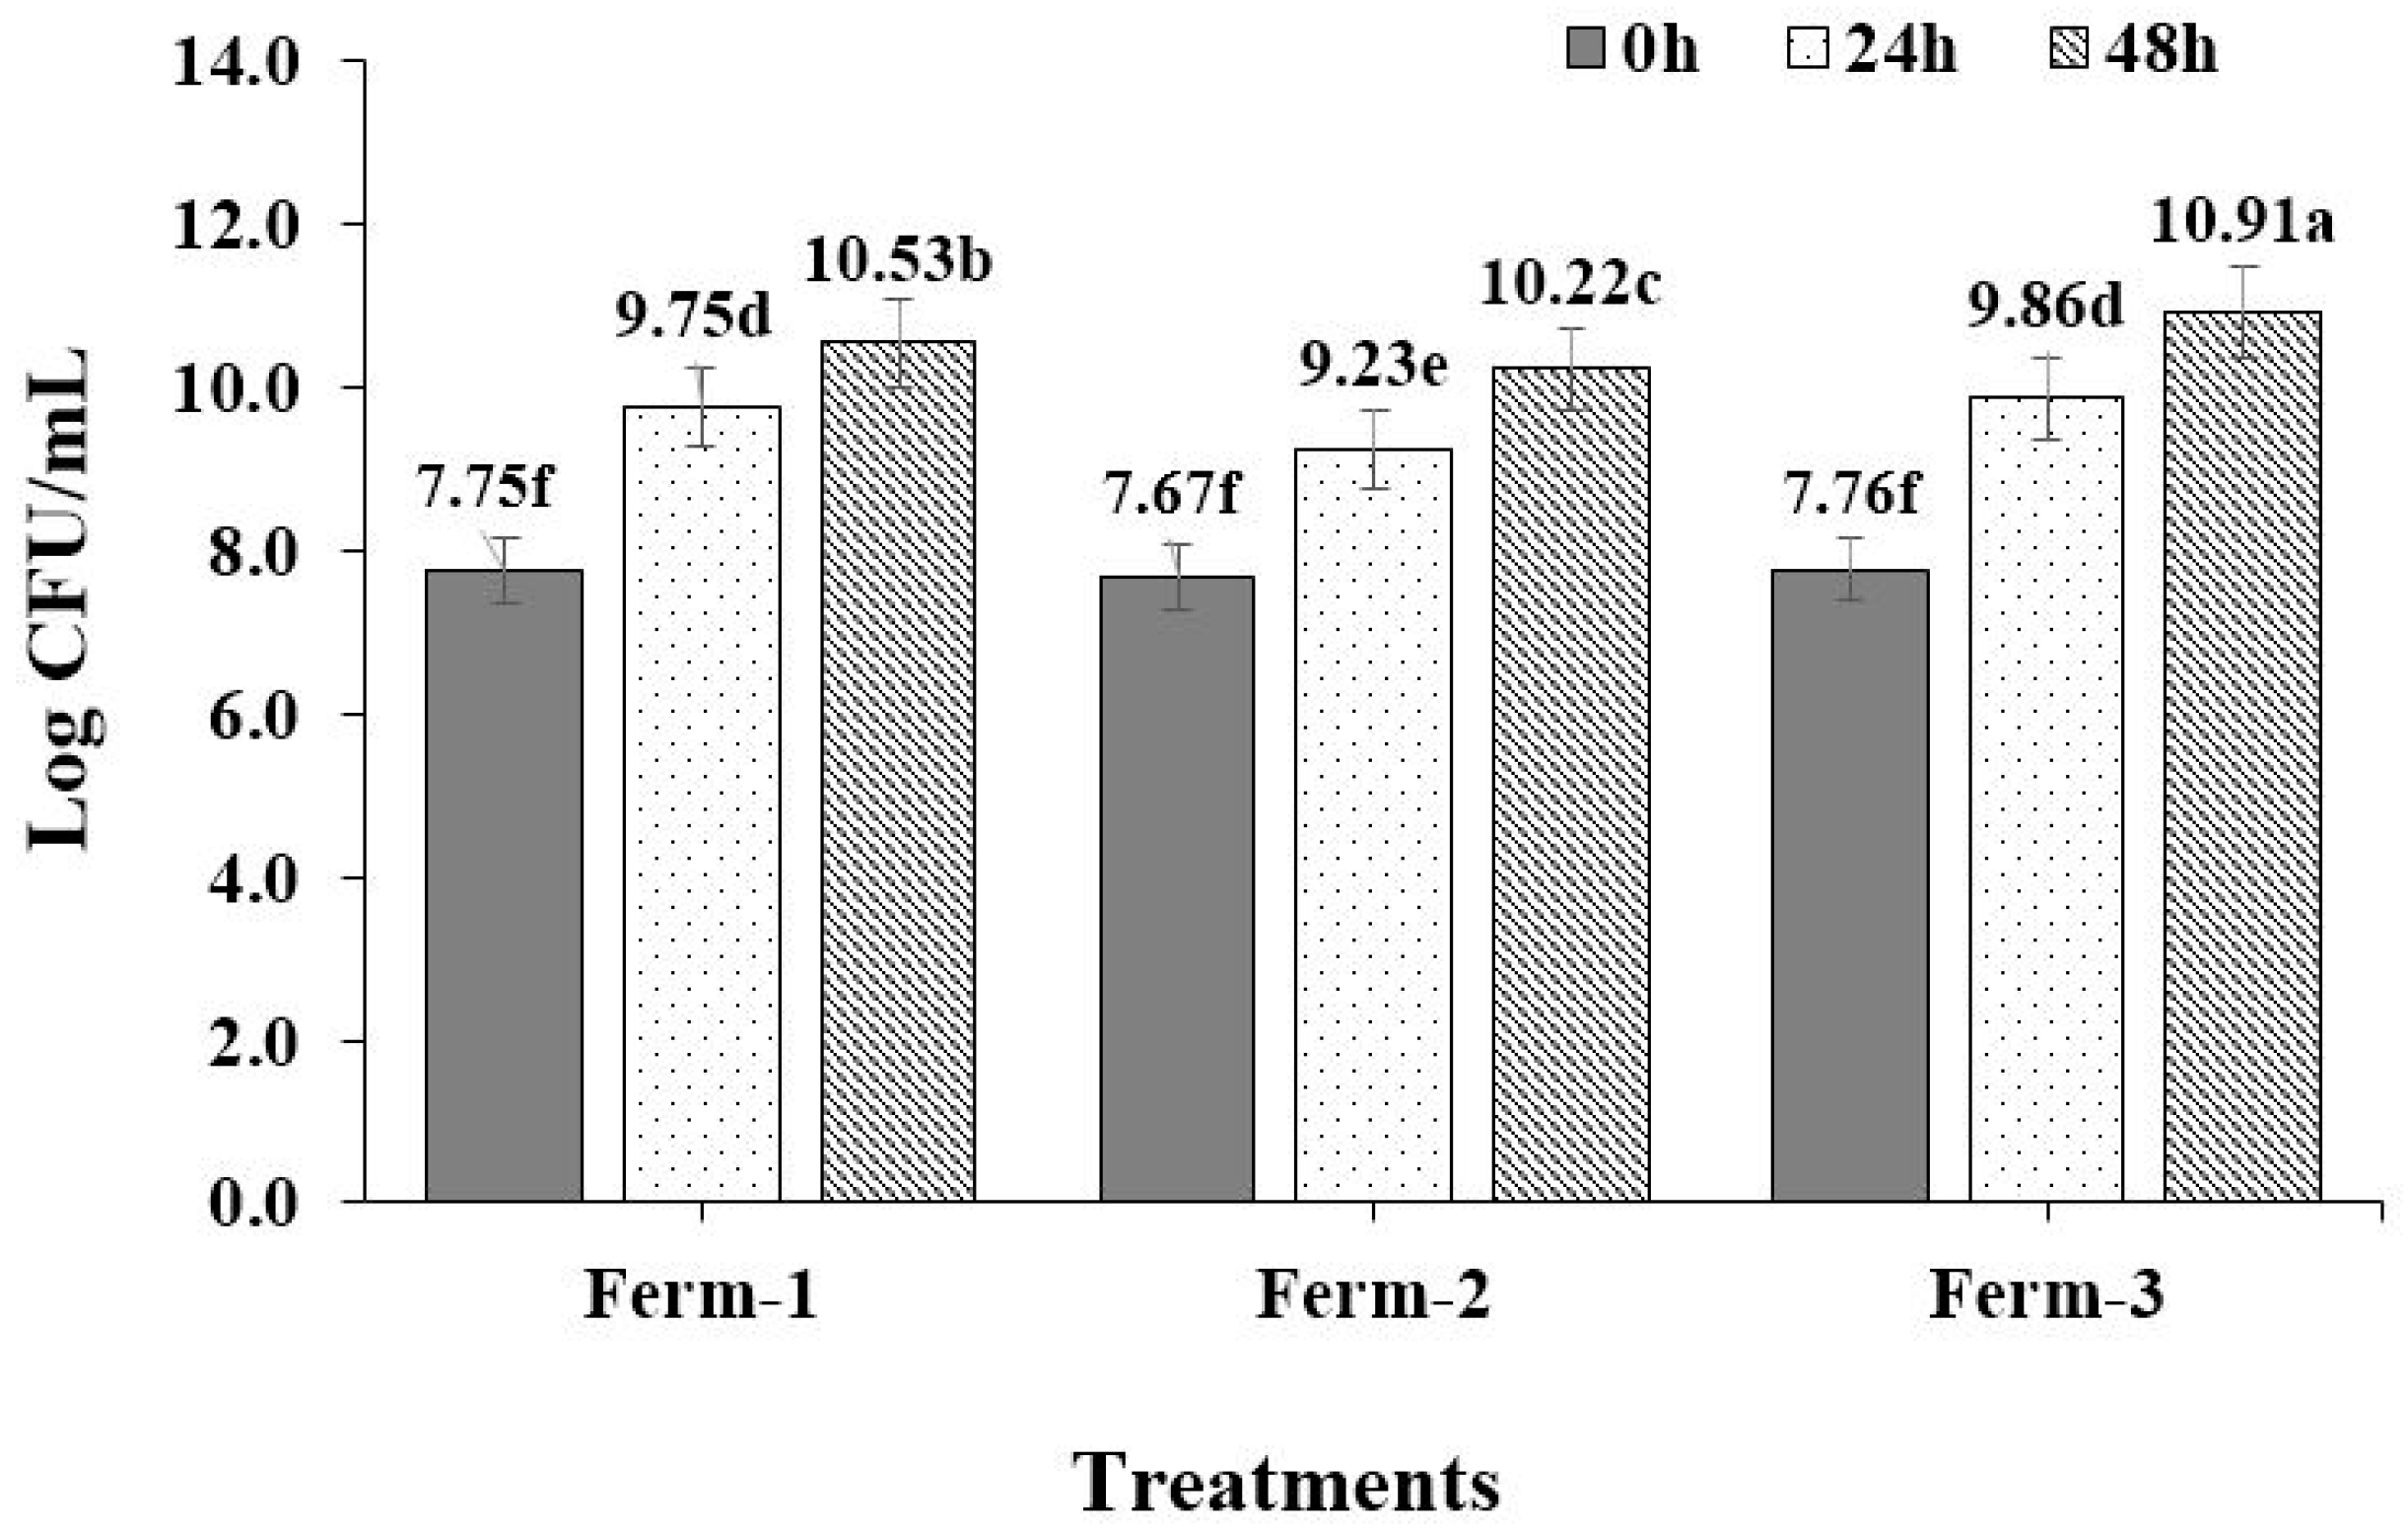
A significant (p < 0.05) interactions between yeast counts and fermentation hours (24 h and 48 h). A count of viable yeast cells was conducted after each hour during fermentation. As shown in Figure 2, the yeast cell count increased as the fermentation hours increased from 0 h to 48 h. The maximum viable yeast cells (10.53 log CFU/mL, Ferm-1; 10.22, Ferm-2; and 10.91, Ferm-3) were obtained at 48 h. The viable yeast cells were significantly (p < 0.05) lower in Ferm-2 compared to Ferm-1 and Ferm-3 at 24 h fermentation. The viable yeast cell counts in Ferm-1 and Ferm-3 were comparatively higher than the count in Ferm-2 (Figure 2).
3.2. Physical Characteristics of Fermented Coffee
3.2.1. Moisture Content
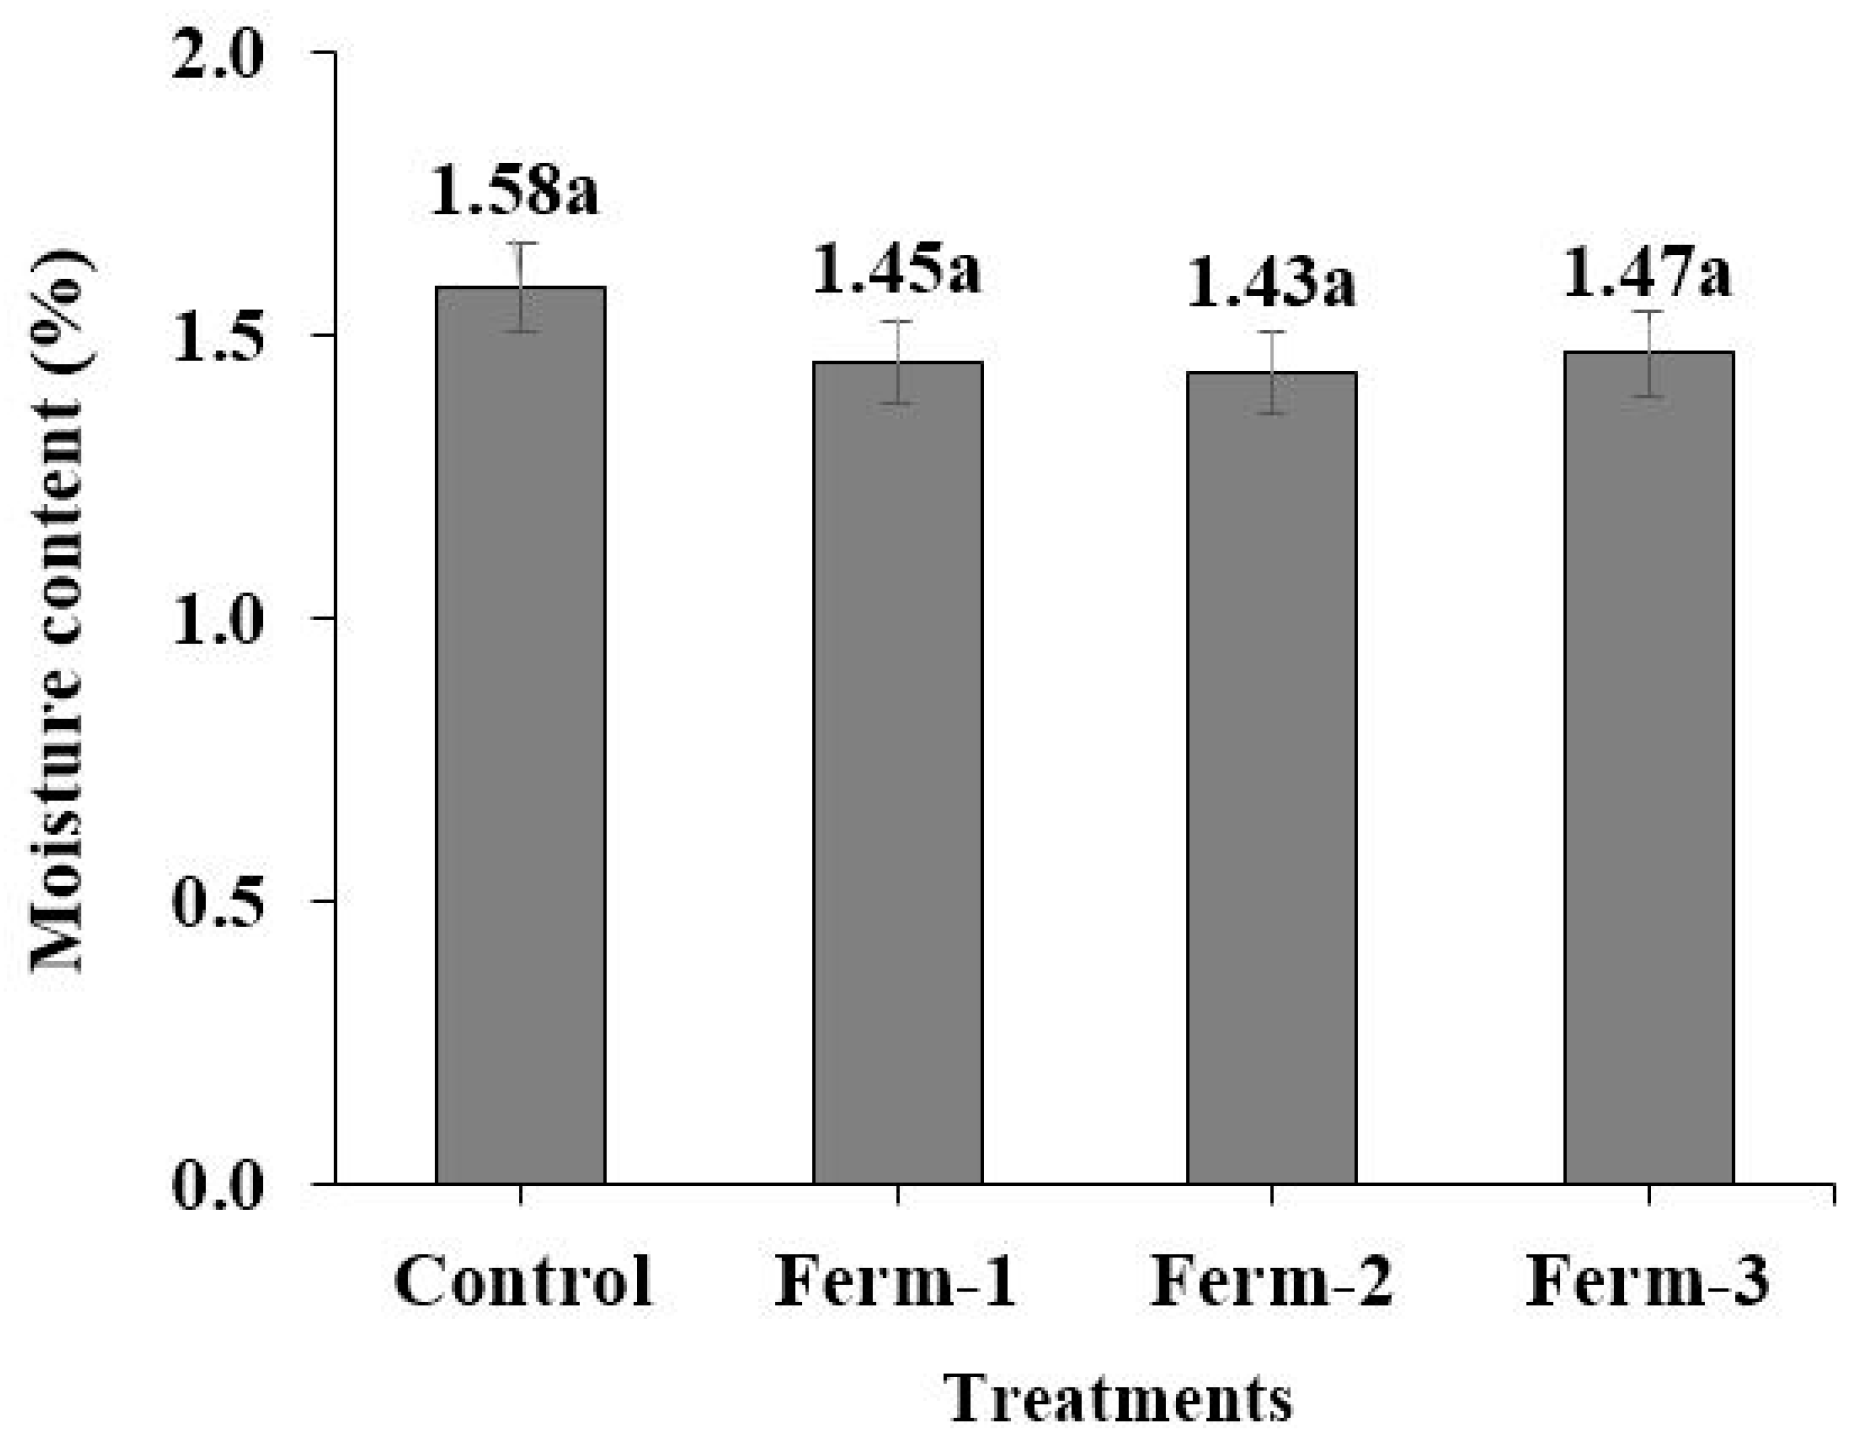
Regarding the moisture content of ground-roasted coffee, the interaction effect between yeasts-fermented coffee beans and fermentation hours had not significant (p > 0.05). The moisture content was 1.58 (Ferm-1), 1.45 (Ferm-2), 1.43 (Ferm-3) and 1.47% (control) (Figure 3).
3.2.2. Colorimeter Data
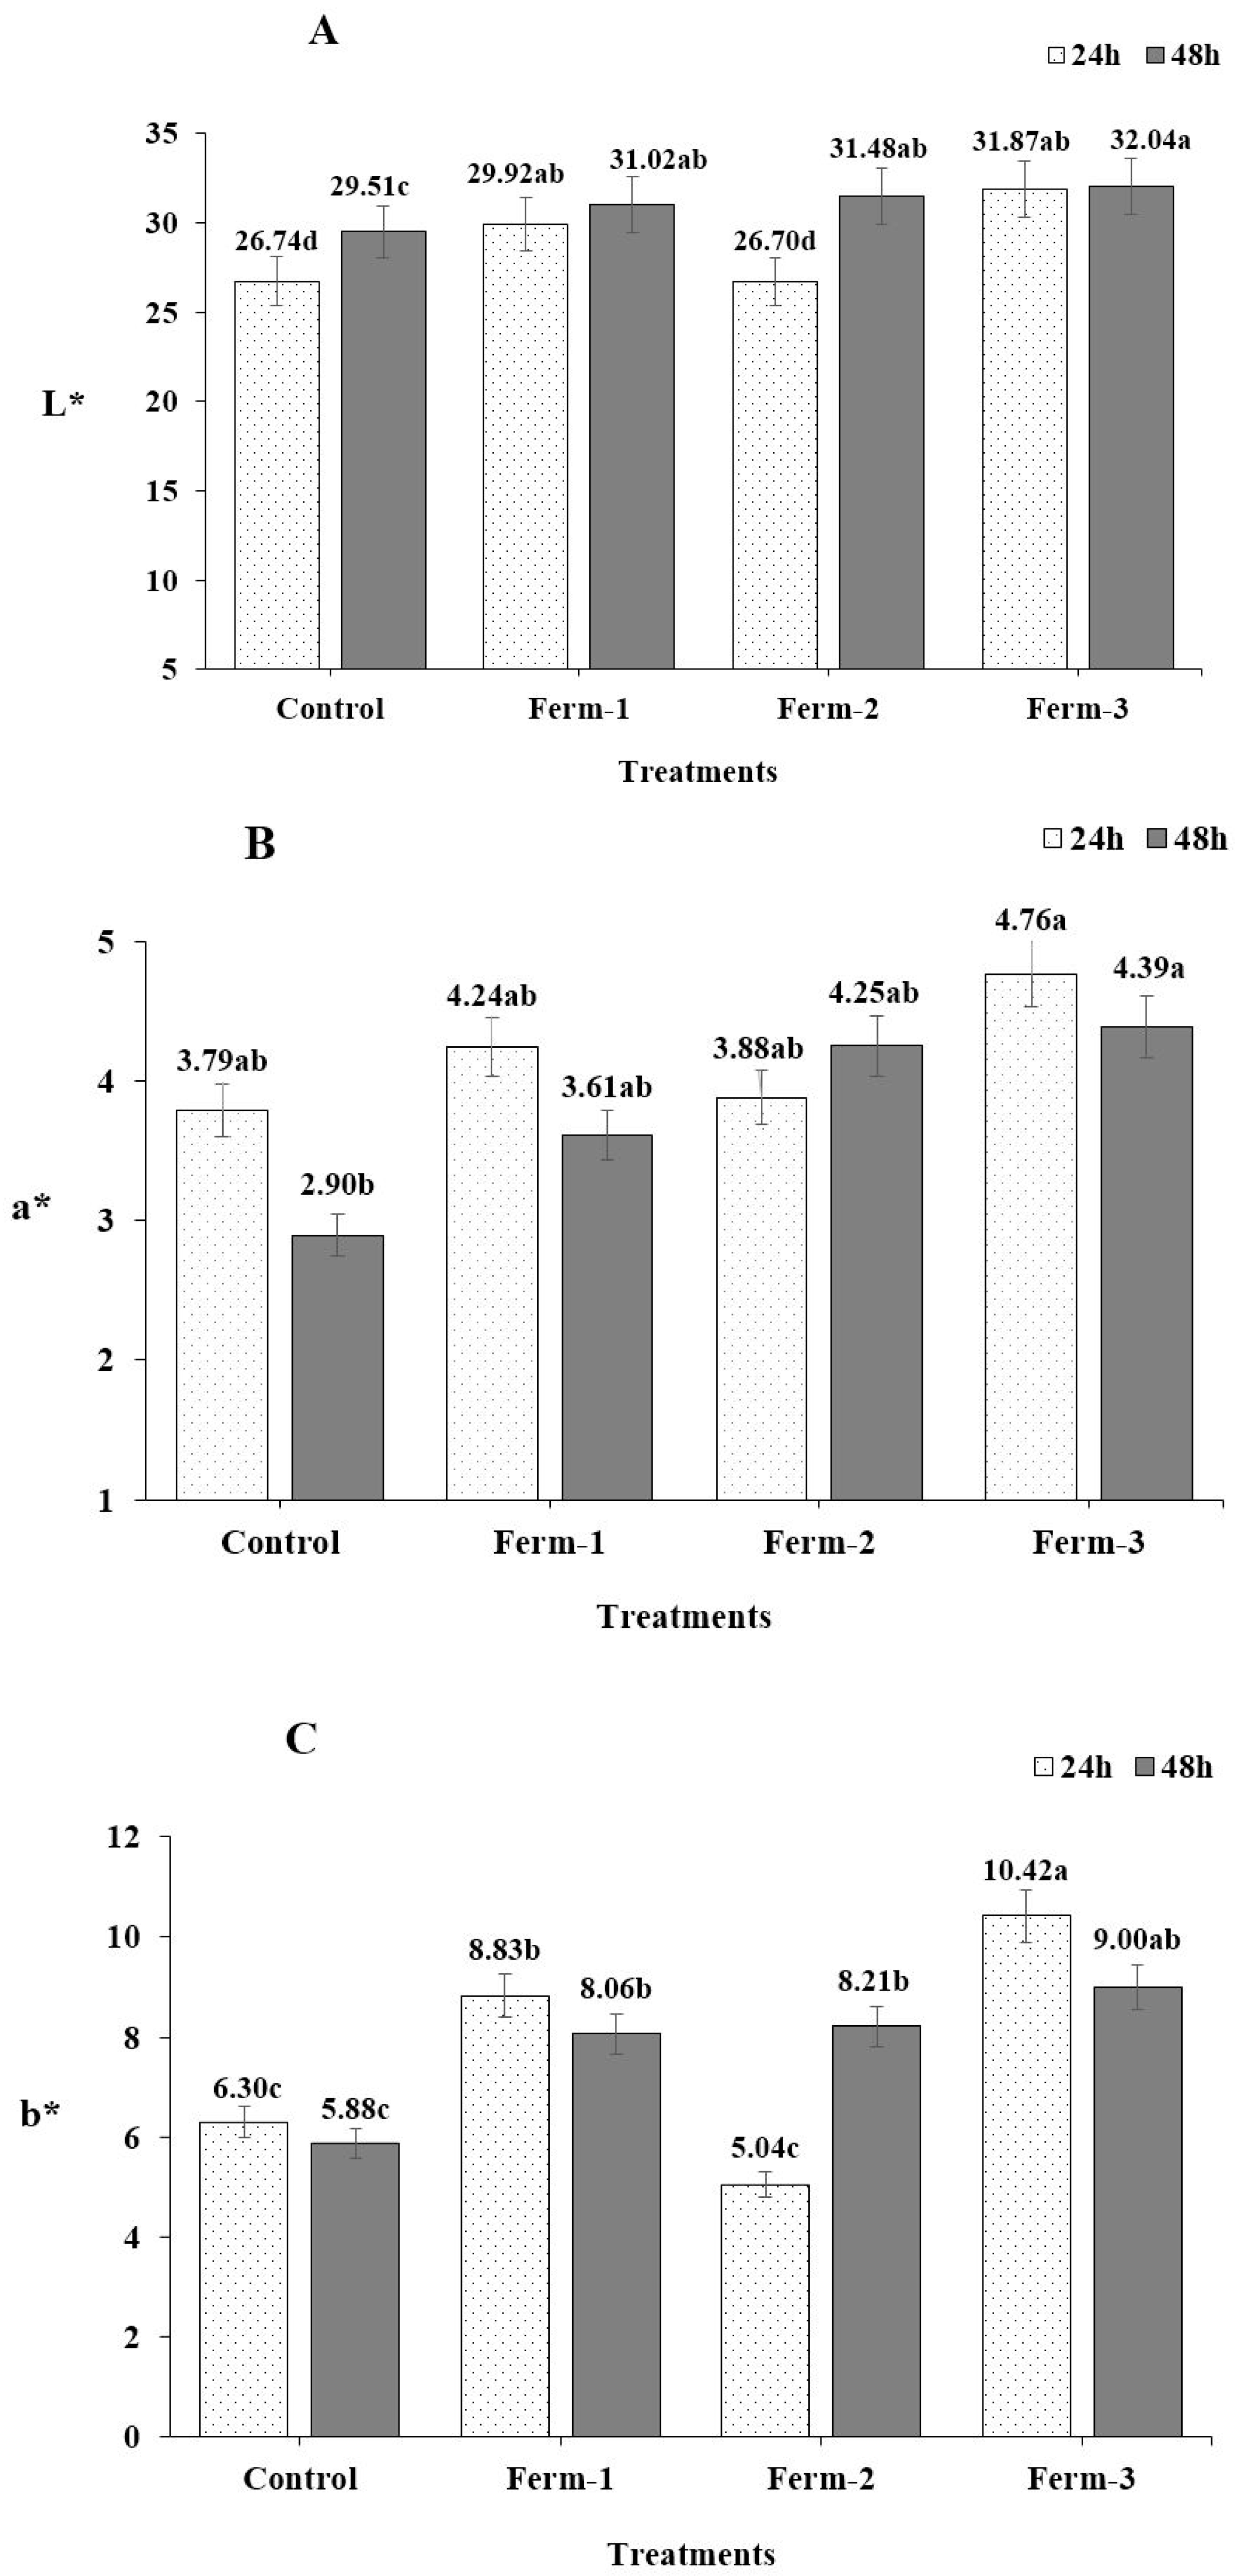
A statistically significant (p < 0.05) interactions have been observed between the yeasts and fermentation hours with respect to the colorimetric parameters (L*, a* and b*) of ground-roasted coffee. There was no significant difference in L* value between the control (26.74) and Ferm-2 (26.70) at 24 h fermentation (Figure 4A). Nor did the L* values significantly differ among Ferm-1, Ferm-2 (at 24 h) or Ferm-3. The L* value of ground-roasted coffee showed an increasing trend as the fermentation hours increased from 24 to 48 (Figure 4A). The a* and b* values reduced in coffee fermented for 48 h compared to compared to that fermented for 24 h in the Ferm-1 and Ferm-3 treatments as well as in the control treatment (Figure 4A,B). However, in Ferm-2, the colorimetric parameters (L*, a* and b*) had higher values at 48 h compared to those at 24 h in the fermented coffee. The highest a* and b* values (4.76 and 10.42, respectively) were found in Ferm-3 at 24 h fermentation, while the lowest a* and b* values showed in the control water-soaked coffee beans at 24 h and in Ferm-2 at 48 h fermentation (Figure 4B,C).
3.3. Antioxidant Activity
3.3.1. Oxygen Radical Absorbance Capacity
There were no significant (p > 0.05) interactions between the yeast-fermented coffee extracts and fermentation hours with respect to ORAC value. The mean of ORAC for the yeast-fermented coffee extracts was 42.42 μMTE/mL (Ferm-1), 42.09 (Ferm-2) and 48.83 (Ferm-3) (Figure 5). There was no significant difference (p > 0.05) in the average ORAC values of the fermented coffee with yeasts; however, comparatively, the value in Ferm-3 was higher. In general, fermentation increases the antioxidant activity in ORAC compared to unfermented coffee.
3.3.2. Superoxide Dismutase-Like Activity
The interactions effect between the yeasts and fermentation hours with respect to SOD-like activity were not significant (p > 0.05). The means of the SOD-like activity for the yeast-fermented coffee extracts were 82.12 (Ferm-1), 82.15 (Ferm-2) and 88.62% (Ferm-3) (Figure 6). The average SOD-like activity for the control (70.23%) was significantly (p < 0.05) lower than that of the fermented coffee extracts. There was no significant difference (p > 0.05) in the average SOD-like activity of the coffee fermented with yeasts (Figure 6). However, comparatively, this activity was higher in Ferm-3.
3.4. Total Polyphenol Content
A significant (p < 0.05) interactions were obtained between the yeast-fermented coffee extracts and fermentation hours with respect to the TPC of the coffee extracts. The TPC showed an increasing trend in Ferm-1 and Ferm-3 as the fermentation duration increased. However, in Ferm-2, a decreasing TPC trend was observed as the fermentation duration increased from 24 h to 48 h (Figure 7). In our experiment, there were no significant differences in TPC between Ferm-1 and Ferm-3 at 24 h fermentation. The maximum TPC was recorded in Ferm-1 (48 h; 0.90 GAEmg/mL of coffee extract), Ferm-2 (24 h; 0.89) and Ferm-3 (48 h; 0.88) (Figure 7). The lowest TPC was found in the control treatment after 24 h (0.74 GAEmg/mL of coffee extract) and 48 h (0.76) soaking in the water.
3.5. Total Flavonoid Content
There were significant (p < 0.05) interactions between the yeast-fermented coffee extracts and fermentation hours with respect to the TFCs of the coffee extracts. The TFC was improved in the fermented coffee with the tested yeasts (Ferm-1, 0.72 QEmg/mL; Ferm-2, 0.77 and Ferm-3, 0.77) at 24 h (Figure 8). The highest TFC was obtained in Ferm-1 at 48 h fermentation, while the lowest TFC was obtained from the control, at 0.67 QEmg/mL (24 h) and 0.63 QEmg/mL (48 h). As shown in Figure 3, the TFC in Ferm-2 and Ferm-3 significantly reduced as the time of fermentation increased from 24 h to 48 h. However, in Ferm-2, the TFC content was significantly enhanced as the fermentation time increased from 24 h to 48 h. The TPC was not significant in the water-soaked coffee bean control treatment between 24 h and 48 h.
3.6. Total Tannin Content
A significant (p < 0.05) interactions were found between the yeast-fermented coffee extracts and time of fermentation with respect to TTC (tannic acid mg/mL coffee extract). As the fermentation proceeded from 24 h to 48 h, the tannin content significantly reduced in Ferm-2 and Ferm-3 (Figure 9). The maximum tannin content was obtained in the control at 24 h (0.61 tannic acid mg/mL) and 48 h (0.58 tannic acid mg/mL). The lowest tannin content was found in the Ferm-2 treatment (0.22 tannic acid mg/mL) (Figure 9).
4. Discussion
A pH reduction was observed in the control treatment; however, the rate of pH reduction was less compared to that of the yeast-inoculated treatments. This decrease was likely due to the soluble organic acids released from the green coffee beans [27] and was produced by the fermentation of lactic acid bacteria which naturally occur in coffee beans. The average moisture contents from 24 h and 48 h were used for comparison and they did not significantly differ. This indicates that both the dried and roasted fermented green coffee beans performed identically.
The colorimeter parameters, a* and b* values showed a similar trend at both fermentation time measurements. We observed that the fermented coffee beans had slightly different colors, as the duration of fermentation increased from 24 h to 48 h than did the unfermented coffee beans. The greenness of the coffee beans was slightly lessened (Ferm-1 and Ferm-3) and became slightly darker (Ferm-2). Therefore, the different colors of the roasted coffee beans likely originated from the fermentation.
The antioxidant activities of the coffee extracts in the ORAC and SOD-like assays which were conducted are presented in Figure 5 and Figure 6, respectively. The peroxyl radical scavenging capabilities of aqueous soluble components present in the coffee could be evaluated more precisely with a modified ORAC assay [28,29]. The mean of the ORAC for the control (30.37 μMTE/mL) was significantly (p < 0.05) lower than that for the fermented coffee extracts. This result is in agreement with Kwak et al. [19], who reported that green coffee beans fermented with yeasts showed a significant increment of ORAC values compared to non-fermented coffee beans. They also reported that there was no significant difference among the fermented coffee beans with respect to ORAC value, which supports our results.
The inhibition of pyrogallol autoxidation catalyzed by the superoxide radical is used to estimate the SOD-like activity of natural antioxidants. The fermented coffee extracts showed significant increases of SOD-like activity compared to the unfermented coffee (Figure 6). Kwak et al. [19] reported that yeast-fermented coffee extracts exhibited significantly higher SOD-like activity compared to unfermented coffee. Similarly, after fermentation of rice bran using baker’s yeast and whiskey yeast, the SOD-like activities of the rice bran extract increased significantly compared to non-fermented rice bran extract [30].
Phenolic compounds are secondary metabolites which are present in plants and which produce beneficial activities. They may scavenge free radicals based on their electron donor ability. They are also important in the food industry, due to their lipid peroxidation-reducing ability [31]. A similar result was reported by Adetuyi and Ibrahim [13] for okra seeds; as fermentation time increased, the TPC decreased. This may be because of the action of the polyphenol oxidase enzyme which performs the diffusion of phenolics in cell liquids and oxidizes them. The results in our experiment are in agreement with reports on fermented seeds, where fermentation caused an increase in the phenolic content of seeds such as legumes [14,15,16,17,18], okra seeds [13], soybeans [12] and coffee [19]. In their natural form, phenolic compounds are combined or bound with sugar, which reduces their availability to the organism. During fermentation, proteolytic enzymes from the starter organism hydrolyze complexes of phenolics into simple, soluble-free phenols and biologically more active forms, which are readily absorbed [15,32].
A supporting result was published by, Adetuyi, F. O., & Ibrahim, T. A. [13], who reported that the TFC of okra seeds decreased as the fermentation period increased; this could be attributed either to the sample concentration of the flavonoid compound or to the duration of the fermentation process, as observed by Ehsan et al. [33] in the fermentation of pistachio hulls. The fermented coffee beans had significantly higher flavonoid content than the unfermented coffee beans. This is in agreement with reports on fermented seeds, where fermentation significantly increased the TFC compared to the TFC in unfermented seeds, for example in legumes [14,15,34], okra seeds [13], soybeans [12] and coffee beans [19]. The increase in the flavonoid content of okra seeds may be due to the increase in acidic values during fermentation, which liberates bound flavonoid components and makes them more bioavailable [13]. The increase in TFC in coffee may have occurred for a similar reason.
We found fermentation significantly reduced the tannin content compared to the TTC in the unfermented coffee. This result was supported by Hassan and El Tinay [35], who reported that fermentation significantly reduced the tannin content of fermented sorghum cultivars and also in a report published on the fermentation of Xuan Mugua fruit with lactic acid bacteria, where it caused a significant reduction in the tannin content [36].
In conclusion, fermentation of green coffee beans with yeasts has positive impacts, increasing antioxidant activity and polyphenol and flavonoid contents. It also decreases the tannin content, which is usually considered the cause of the astringent characteristics and bitterness of coffee. In this experiment Ferm-3 (Saccharomyces cerevisiae strain KNU18Y12) improved the antioxidant activities (SOD-like activity and ORAC) compared to other tasted yeasts. Similarly, Ferm-2 (Saccharomycopsis fibuligera strain KNU18Y4) greatly reduced the tannin contents of coffee compared to Ferm-1 (Saccharomyces cerevisiae strain KNU18Y13) and Ferm-3 (Saccharomyces cerevisiae strain KNU18Y12). We have clearly observed that fermenting coffee beans with different yeasts influence the coffee quality parameters differently. This is an indication to consider using various species and strains of yeasts will be important to select the better performing yeasts according to their potential. We have confirmed that the yeast used in our experiments improved most of the quality parameters studied in this paper. Further study is important to understanding the fermentation effect on other parameters.
Author Contributions
Conceptualization, W.H.K., M.H.; methodology, M.H.; Data curation, M.H.; validation, W.H.K.; formal analysis, M.H.; software, M.H.; investigation, W.H.K.; resources, W.H.K.; funding acquisition, W.H.K.; writing—original draft preparation, M.H.; writing—review and editing, W.H.K., M.H.; supervision, W.H.K.; project administration, W.H.K.
Acknowledgments
This study was supported by 2018 research grant from Kangwon National University (No. 520180086).
Conflicts of Interest
The authors declare no conflict of interest.
References
- Bhumiratana, N.; Adhikari, K.; Chambers, E. Evolution of sensory aroma attributes from coffee beans to brewed coffee. LWT Food Sci. Technol. 2011, 44, 2185–2192. [Google Scholar] [CrossRef]
- Sunarharum, W.B.; Williams, D.J.; Smyth, H.E. Complexity of coffee flavor: A compositional and sensory perspective. Food Res. Int. 2014, 62, 315–325. [Google Scholar] [CrossRef]
- Duarte, G.S.; Pereira, A.A.; Farah, A. Chlorogenic acids and other relevant compounds in Brazilian coffees processed by semi-dry and wet post-harvesting methods. Food Chem. 2010, 118, 851–855. [Google Scholar] [CrossRef]
- Leloup, V.; Gancel, C.; Liardon, R.; Rytz, A.; Pithon, A. Impact of wet and dry process on green coffee composition and sensory characteristics. In ASIC Proceedings of 20th Colloque Coffee; Association Scentifique Internationale pour le Cafe: Bangalore, India, 2004; pp. 93–100. [Google Scholar]
- Jelen, H.; Majcher, M.; Ginja, A.; Kuligowski, M. Determination of compounds responsible for tempeh aroma. Food Chem. 2013, 141, 459–465. [Google Scholar] [CrossRef] [PubMed]
- Feng, Y.; Cui, C.; Zhao, H.; Gao, X.; Zhao, M.; Sun, W. Effect of koji fermentation on generation of volatile compounds in soy sauce production. Int. J. Food Sci. Technol. 2013, 48, 609–619. [Google Scholar] [CrossRef]
- Iamanaka, B.T.; Teixeira, A.A.; Teixeira, A.R.R.; Vicente, E.; Frisvad, J.C.; Taniwaki, M.H.; Bragagnolo, N. Potential of volatile compounds produced by fungi to influence sensory quality of coffee beverage. Food Res. Int. 2014, 64, 166–170. [Google Scholar] [CrossRef]
- Li, P.-J.; Li, C.-C.; Li, C.-H. Method for Manufacturing Coffee by Solid State Fermentation. U.S. Patent No. US 20100239711A1, 23 September 2010. [Google Scholar]
- Mesfin, H.; Kang, W.H. The role of microbes in coffee fermentation and their impact on coffee quality. J. Food Qual. 2019, 2019, 4836709. [Google Scholar]
- Kim, B.G.; Choi, S.Y.; Kim, M.R.; Suh, H.J.; Park, H.J. Changes of ginsenosides in Korean red ginseng (Panax ginseng) fermented by Lactobacillus plantarum M1. Process Biochem. 2010, 45, 1319–1324. [Google Scholar] [CrossRef]
- Lim, S.I.; Cho, C.W.; Choi, U.K.; Kim, Y.C. Antioxidant activity and ginsenoside pattern of fermented white ginseng. J. Ginseng Res. 2010, 34, 168–174. [Google Scholar] [CrossRef]
- Amadou, I.; Yong-Hui, S.; Sun, J.; Guo-Wei, L. Fermented soybean products: Some methods, antioxidants compound extraction and their scavenging activity. Asian J. Biochem. 2009, 4, 68–76. [Google Scholar]
- Adetuyi, F.O.; Ibrahim, T.A. Effect of fermentation time on the phenolic, flavonoid and vitamin C contents and antioxidant activities of okra (Abelmoschus esculentus) seeds. Niger. Food J. 2014, 32, 128–137. [Google Scholar] [CrossRef]
- Moktan, B.; Saha, J.; Sarkar, P.K. Antioxidant activities of soybean as affected by Bacillus-fermentation to kinema. Food Res. Int. 2008, 41, 586–593. [Google Scholar] [CrossRef]
- Ademiluyi, A.O.; Oboh, G. Antioxidant properties of condiment produced from fermented bambara groundnut (Vigna subterranea L. Verdc). J. Food Biochem. 2011, 35, 1145–1160. [Google Scholar] [CrossRef]
- Dajanta, K.; Janpum, P.; Leksing, W. Antioxidant capacities, total phenolics and flavonoids in black and yellow soybeans fermented by Bacillus subtilis: A comparative study of Thai fermented soybeans (thua nao). Int. Food Res. J. 2013, 20, 3125. [Google Scholar]
- Guzmán-Uriarte, M.L.; Sánchez-Magaña, L.M.; Angulo-Meza, G.Y.; Cuevas-Rodríguez, E.O.; Gutiérrez-Dorado, R.; Mora-Rochín, S.; Reyes-Moreno, C. Solid state bioconversion for producing common bean (Phaseolus vulgaris L.) functional flour with high antioxidant activity and antihypertensive potential. Food Nutr. Sci. 2013, 4, 480. [Google Scholar]
- Plaitho, Y.; Kangsadalampai, K.; Sukprasansap, M. The protective effect of Thai fermented pigmented rice on urethane induced somatic mutation and recombination in Drosophila melanogaster. J. Med. Plant Res. 2013, 7, 91–98. [Google Scholar]
- Kwak, H.S.; Jeong, Y.; Kim, M. Effect of Yeast Fermentation of Green Coffee Beans on Antioxidant Activity and Consumer Acceptability. J. Food Qual. 2018, 2018, 5967130. [Google Scholar] [CrossRef]
- Lim, H.H.; Ji, S.; Kwak, H.S.; Eom, T.; Kim, M.; Lee, Y.; Jeong, Y. Quality characteristics of coffee brewed from green beans soaked in mulberry (Morus bombycis) extract. J. Korean Soc. Food Sci. Nutr. 2015, 44, 579–585. [Google Scholar] [CrossRef]
- Association of Official Analytical Chemists (AOAC). Official Methods of Analysis, 18th ed.; AOAC: Gaithersburg, MD, USA, 2005. [Google Scholar]
- Ou, B.; Hampsch-Woodill, M.; Prior, R.L. Development and validation of an improved oxygen radical absorbance capacity assay using fluorescein as the fluorescent probe. J. Agric. Food Chem. 2001, 49, 4619–4626. [Google Scholar] [CrossRef] [PubMed]
- Marklund, S.; Marklund, G. Involvement of the superoxide anion radical in the autoxidation of pyrogallol and a convenient assay for superoxide dismutase. Eur. J. Biochem. 1974, 47, 469–474. [Google Scholar] [CrossRef]
- Singleton, V.L.; Orthofer, R.; Lamuela-Raventós, R.M. Analysis of total phenols and other oxidation substrates and antioxidants by means of folin-ciocalteu reagent. Methods Enzymol. 1999, 299, 152–178. [Google Scholar]
- Dewanto, V.; Wu, X.; Liu, R.H. Processed sweet corn has higher antioxidant activity. J. Agric. Food Chem. 2002, 50, 4959–4964. [Google Scholar] [CrossRef] [PubMed]
- CI, K.C.; Indira, G. Quantitative estimation of total phenolic, flavonoids, tannin and chlorophyll content of leaves of Strobilanthes Kunthiana (Neelakurinji). J. Med. Plants 2016, 4, 282–286. [Google Scholar]
- Rodrigues, C.I.; Marta, L.; Maia, R.; Miranda, M.; Ribeirinho, M.; Máguas, C. Application of solid-phase extraction to brewed coffee caffeine and organic acid determination by UV/HPLC. J. Food Compos. Anal. 2007, 20, 440–448. [Google Scholar] [CrossRef]
- Kwon, D.Y.; Choi, K.H.; Kim, S.J.; Choi, D.W.; Kim, Y.S.; Kim, Y.C. Peroxyl radical-scavenging activity of coffee brews. Eur. Food Res. Technol. 2005, 221, 471–477. [Google Scholar]
- Gómez-Ruiz, J.Á.; Leake, D.S.; Ames, J.M. In Vitro Antioxidant Activity of Coffee Compounds and Their Metabolites. J. Agric. Food Chem. 2007, 55, 6962–6969. [Google Scholar] [CrossRef]
- Miyamoto, Y.; Noda, H.; Ohya, H.; Kamada, H. SOD-like activities of rice bran extracts after fermentation. J. Jpn. Soc. Food Sci. Technol. 2000, 47, 214–219. [Google Scholar] [CrossRef]
- Wojdyło, A.; Oszmiański, J.; Czemerys, R. Antioxidant activity and phenolic compounds in 32 selected herbs. Food Chem. 2007, 105, 940–949. [Google Scholar] [CrossRef]
- Shrestha, A.K.; Dahal, N.R.; Ndungutse, V. Bacillus fermentation of soybean: A review. J. Food Sci. Technol. 2010, 6, 1–9. [Google Scholar] [CrossRef]
- Ehsan, K.; Ehsan, O.; Rudi, H.; Jaafar, H.Z.E. Solid state fermentation effects on pistachio hulls antioxidant activities. King Khalid Univ. Res. J. 2010, 15, 260–266. [Google Scholar]
- Yao, Q.I.N.; Jin, X.N.; Heui, D.P. Comparison of antioxidant activities in black soybean preparations fermented with various microorganisms. Agric. Sci. China 2010, 9, 1065–1071. [Google Scholar]
- Hassan, I.A.; El Tinay, A.H. Effect of fermentation on tannin content and in-vitro protein and starch digestibilities of two sorghum cultivars. Food Chem. 1995, 53, 149–151. [Google Scholar] [CrossRef]
- Shang, Y.F.; Cao, H.; Ma, Y.L.; Zhang, C.; Ma, F.; Wang, C.X.; Wei, Z.J. Effect of lactic acid bacteria fermentation on tannins removal in Xuan Mugua fruits. Food Chem. 2019, 274, 118–122. [Google Scholar] [CrossRef] [PubMed]
Figure 1.
The pH of the solution in which the coffee beans fermented at different hours. The bars with different letters indicate a significant difference (p < 0.5) among treatments.
Figure 1.
The pH of the solution in which the coffee beans fermented at different hours. The bars with different letters indicate a significant difference (p < 0.5) among treatments.

Figure 2.
The viable yeast cells (log CFU/mL) at different fermentation hours. The bars with different letters indicate a significant difference (p < 0.5) among treatments.
Figure 2.
The viable yeast cells (log CFU/mL) at different fermentation hours. The bars with different letters indicate a significant difference (p < 0.5) among treatments.

Figure 3.
The average of moisture contents (24 h and 48 h) of fermented ground roasted coffee with different yeasts. The bars with the same letters indicate non-significant difference (p > 0.5) among treatments.
Figure 3.
The average of moisture contents (24 h and 48 h) of fermented ground roasted coffee with different yeasts. The bars with the same letters indicate non-significant difference (p > 0.5) among treatments.

Figure 4.
Colorimeter (L*, a* and b*) data of fermented coffee (A–C). The bars with different letters indicate a significant difference (p < 0.5) among treatments.
Figure 4.
Colorimeter (L*, a* and b*) data of fermented coffee (A–C). The bars with different letters indicate a significant difference (p < 0.5) among treatments.

Figure 5.
The average of oxygen radical absorbance capacity of fermented coffee (24 h and 48 h). The bars with different letters indicate a significant difference (p < 0.5) among treatments.
Figure 5.
The average of oxygen radical absorbance capacity of fermented coffee (24 h and 48 h). The bars with different letters indicate a significant difference (p < 0.5) among treatments.

Figure 6.
The averages of SOD-like activity (%) of fermented coffee (24 h and 48 h). The bars with different letters indicate a significant difference (p < 0.5) among treatments.
Figure 6.
The averages of SOD-like activity (%) of fermented coffee (24 h and 48 h). The bars with different letters indicate a significant difference (p < 0.5) among treatments.

Figure 7.
Total polyphenol contents (GAEmg/mL of coffee extract) of fermented coffee. The bars with different letters indicate a significant difference (p < 0.5) among treatments.
Figure 7.
Total polyphenol contents (GAEmg/mL of coffee extract) of fermented coffee. The bars with different letters indicate a significant difference (p < 0.5) among treatments.

Figure 8.
Total flavonoid contents (QEmg/mL of coffee extract) of fermented coffee. The bars with different letters indicate a significant difference (p < 0.5) among treatments.
Figure 8.
Total flavonoid contents (QEmg/mL of coffee extract) of fermented coffee. The bars with different letters indicate a significant difference (p < 0.5) among treatments.

Figure 9.
Total tannin contents (tannic acid mg/mL of coffee extract) of fermented coffee. The bars with different letters indicate a significant difference (p < 0.5) among treatments.
Figure 9.
Total tannin contents (tannic acid mg/mL of coffee extract) of fermented coffee. The bars with different letters indicate a significant difference (p < 0.5) among treatments.

© 2019 by the authors. Licensee MDPI, Basel, Switzerland. This article is an open access article distributed under the terms and conditions of the Creative Commons Attribution (CC BY) license (http://creativecommons.org/licenses/by/4.0/).
Share and Cite
MDPI and ACS Style
Haile, M.; Kang, W.H. Antioxidant Activity, Total Polyphenol, Flavonoid and Tannin Contents of Fermented Green Coffee Beans with Selected Yeasts. Fermentation 2019, 5, 29. https://0-doi-org.brum.beds.ac.uk/10.3390/fermentation5010029
AMA Style
Haile M, Kang WH. Antioxidant Activity, Total Polyphenol, Flavonoid and Tannin Contents of Fermented Green Coffee Beans with Selected Yeasts. Fermentation. 2019; 5(1):29. https://0-doi-org.brum.beds.ac.uk/10.3390/fermentation5010029
Chicago/Turabian StyleHaile, Mesfin, and Won Hee Kang. 2019. "Antioxidant Activity, Total Polyphenol, Flavonoid and Tannin Contents of Fermented Green Coffee Beans with Selected Yeasts" Fermentation 5, no. 1: 29. https://0-doi-org.brum.beds.ac.uk/10.3390/fermentation5010029
Note that from the first issue of 2016, this journal uses article numbers instead of page numbers. See further details here.