Article

Harnessing the Residual Nutrients in Anaerobic Digestate for Ethanol Fermentation and Digestate Remediation Using Saccharomyces cerevisiae

by
Victor Chinomso Ujor
1,*,
Christopher Chukwudi Okonkwo
2,
Brennen Bradley Rush
1,
Grace Ellen McCrea
1 and
Thaddeus Chukwuemeka Ezeji
2
1
Bioenergy and Water Treatment Management Program, Agricultural Technical Institute, The Ohio State University, 1328 Dover Road, Wooster, OH 44691, USA
2
Department of Animal Sciences, The Ohio State University, and Ohio State Agricultural; Research and Development Center (OARDC), 305 1680 Madison Avenue, Wooster, OH 44691, USA
*
Author to whom correspondence should be addressed.
Submission received: 14 April 2020 / Revised: 16 May 2020 / Accepted: 16 May 2020 / Published: 18 May 2020
(This article belongs to the Special Issue Biofuel Fermentation from Renewable Biomass)

Abstract

:
This study evaluated the feasibility of concomitant nutrient removal, cleaner water recovery, and improved ethanol production via glucose fermentation in the liquid fraction of anaerobic digestate (ADE) by Saccharomyces cerevisiae. The 25%, 50%, and 100% (v/v) ADE supported the growth of S. cerevisiae, glucose utilization (~100 g/L) and ethanol production (up to 50.4 ± 6.4 g/L). After a 144 h fermentation in the 50% ADE, the concentrations of ammonia, total nitrogen, phosphate, and total phosphorus decreased 1000-, 104.43-, 1.94-, and 2.20-fold, respectively. Notably, only 0.40 ± 0.61 mg/L ammonia was detected in the 50% ADE post-fermentation. Similarly, the concentrations of aluminum, copper, magnesium, manganese, molybdenum, potassium, sodium, iron, sulfur, zinc, chloride, and sulfate decreased significantly in the ADE. Further analysis suggests that the nitrogen (ammonia and protein), phosphate, and the metal contents of the digestate work in tandem to promote growth and ethanol production. Among these, ammonia and protein appear to exert considerable effects on S. cerevisiae. These results represent a significant first step towards repurposing ADE as a resource in bio-production of fuels and chemicals, whilst generating effluent that is economically treatable by conventional wastewater treatment technologies.

Graphical Abstract

1. Introduction

Due to our rapidly growing population, coupled with growing concerns over climate change, the clamor for water conservation has intensified in recent years. To limit leaching of nitrogen, phosphorus, and heavy metals into groundwaters, greater amounts of municipal solid wastes, food processing wastes and manure are being diverted from landfills to anaerobic digestion (AD) [1]. However, AD mostly removes carbon from organic wastes, leaving behind an effluent (anaerobic digestate—ADE) with high concentrations of ammonia nitrogen (NH4-N), phosphorus (PO4-P), magnesium, calcium, potassium, sulfur, and heavy metals [2]. Consequently, ADE is unfit for direct discharge into waterways [2]. Direct addition of ADE into municipal wastewater treatment systems is either prohibited or deemed unfeasible in most countries due to the high risk of wastewater treatment system overload with excess nitrogen, phosphorus, and metals, particularly heavy metals. Ultimately, this would increase the possibility of discharging nutrient-rich wastewater effluents into surface waters, which would in turn trigger eutrophication.
Although ADE is ideal for land application as fertilizer, land application of digestate has come under stringent regulations in recent years, aimed at protecting surface waters against nutrient overload. Additionally, large AD facilities typically produce significantly greater amounts of ADE beyond immediate land application needs [2]. Consequently, some AD plants discharge large amounts of digestate in landfills, a practice that is saddled with worrying environmental and economic consequences. To circumvent the cost of ADE disposal via landfilling or composting, some large AD plants store anaerobic digestate in lagoons, allowing farmers to collect legally required amounts of digestate for land application. However, this practice often pits AD facilities against local communities due to unpleasant odor resulting from the lagoons, and the risk of ground or surface water pollution, in the event of lagoon leakage or overflow (due to flooding). Therefore, nutrient sequestration from ADE attracts considerable attention, largely because it has the potential to relieve AD plants of the economic burden of digestate disposal, recover "cleaner effluent" that is amenable to conventional wastewater treatment technologies, and most importantly, significantly enhance the sustainability and water footprint of AD as a waste management technology. Phosphorus recovery from ADE has become particularly attractive in recent years, driven in part, by depleting global phosphate reserves [2,3,4].
Coupling nutrient sequestration and cleaner water recovery from ADE to the production of a value-added commodity (fuel and/or chemical) represents a promising approach in the quest to develop a cost-effective treatment strategy for ADE. Hence, the overarching aim of this study was to investigate the feasibility of Saccharomyces cerevisiae-(S. cerevisiae) mediated fermentation in ADE, as a means to simultaneously remove nitrogen, phosphorus, and metals from the ADE. Most importantly, we explored the recovery of less nutrient-laden wastewater, post fermentation that could be treated by conventional wastewater treatment technologies without overloading the water resource recovery system. Further, we investigated concomitant production of ethanol—a market-ready product—as a byproduct (Figure 1), during fermentation of glucose by S. cerevisiae in ADE. S. cerevisiae was chosen for this study for a number of reasons. First, S. cerevisiae as do other microorganisms, requires nitrogen, phosphorus and metals—which are typically abundant in ADE—for growth. Second, S. cerevisiae has been shown to deploy robust mechanisms for enhanced metal tolerance [5,6,7], thus, making it a viable candidate for fermentative pretreatment of ADE. Lastly, ADE is typically devoid of oxygen. Thus, the choice of S. cerevisiae—a facultative organism—eliminates the capital-intensive need for oxygenation of the ADE before or during fermentation.

2. Materials and Methods

2.1. Microorganisms and Culture Conditions

S. cerevisiae NRRL Y566 was obtained from the microbial culture collection of the Agricultural Research Services (ARS), USDA National Center for Agricultural Utilization Research, Peoria, IL, USA. Cell suspension (0.1 mL) was inoculated in yeast extract peptone dextrose (YEPD) agar containing yeast extract (10 g/L), peptone (20 g/L) and glucose (20 g/L), followed by incubation at 30 °C for 12–24 h [8]. A single colony from the YEPD plate was inoculated into 100 mL YEPD broth and incubated at 30 °C and 150 rpm for 16 h in an Innova™ 4000 rotary shaker (New Brunswick Scientific, Edison, NJ, USA). Subsequently, stock cultures were prepared in 40% glycerol and stored at −80 °C until further use.

2.2. Preparation of Anaerobic Digestate (ADE)

Five liters of dairy manure from the dairy facility of the Ohio Agricultural Research and Development Center (OARDC) in Wooster, OH, USA was digested at 37 °C and 100 rpm. Raw manure (~13% total solids, out of which 89% was volatile solid content) was diluted to a final concentration of 20% (v/v) in water before digestion. Digestion was conducted in a 7.5-L Bioflo 3000 reactor (New Brunswick Scientific, Edison, NJ, USA) for 4 weeks, until no detectable biogas production was observed. After digestion, the liquid fraction of the ADE was obtained by centrifuging the slurry 7 times at 10,000× g for 30 min in a J2-21M Beckman Induction drive centrifuge (Beckman Coulter Inc., Pasadena, CA, USA). The supernatant was then filter-sterilized by passing through a sterile 500 mL Nalgene filter system with pore size of 0.45 μm (Thermo Fisher Scientific, Waltman, MA, USA) under vacuum pressure. The filter-sterilized ADE was stored at −20 °C until further use.

2.3. Ethanol Fermentation in ADE

For ethanol fermentation, glucose was dissolved in filter-sterilized ADE to a final concentration of 100 g/L and then sterilized at 121 °C for 15 min. To better delineate the effect of the ADE on growth and ethanol production by S. cerevisiae, the fermentation medium was prepared in 100%, 50%, and 25% (v/v) of the ADE. At each concentration of ADE tested, the final concentration of glucose in the fermentation medium was 100 g/L. As a control, glucose (100 g/L) was dissolved in filter-sterilized distilled water. Fermentation media were inoculated with 6% (v/v) of preculture. The pre-culture was prepared by inoculating 100 mL of YEPD with 500 µL of S. cerevisiae stock and then, incubated at 30 °C and 150 rpm for 16 h. Fermentation was conducted by inoculating the YEPD-grown cultures into ADE (supplemented with 100 g/L glucose) and the control medium (100 g/L glucose in ddH2O). Fermentations were conducted in 125-mL media bottles with a fermentation volume of 50 mL at 30 °C and 150 rpm in an Innova™ 4000 rotary shaker (New Brunswick Scientific, Edison, NJ, USA). All experiments were set conducted in triplicate. Samples for analyses of cell optical density, ethanol, and nutrient concentrations were taken from the fermentation every 12 h for at least 72 h, and then every 24 h until fermentation terminated (144 h).

2.4. Effect of ADE-Borne Nutrients on Fermentation of Glucose by S. cerevisiae

2.4.1. Effect of Metals on Glucose Fermentation in ADE

Following fermentations in 25%, 50%, and 100% ADE, it was observed that S. cerevisiae grown in glucose-supplemented 50% ADE exhibited the best ethanol concentration and a superior growth profile. Clarification of the ADE was observed at all ADE concentrations tested (25%, 50%, 100%). Hence, subsequent experiments (except where otherwise stated) were conducted in 50% ADE, with the addition of glucose (100 g/L). To evaluate likely contributions of the metal contents of the ADE on the observed results, the control cultures (100 g/L glucose in ddH20) were supplemented with metallic salts, put together to mimic the mineral composition of the ADE, as much as possible. The supplements included (g/L): CaCl2 (0.01), NaCl (0.05), ZnCl2 (0.00034), NaMoO4.H2O (0.0025), FeSO4.7H2O (0.0016), CuSO4.5H2O (0.00016), Na2Cr2O7.2H2O (0.00003), CoSO4.H2O (0.000035), Al2(SO4)3 (0.000634), Pb(NO3)2 (0.00003), MnCl2.4H2O (0.002), MgSO4 (1.505); LiCl2 (0.00006), H3BO3 (0.003), KCl (0.765). Simultaneously, 50% ADE was supplemented with half- and quarter-strengths of the mineral composition (above) added to the control medium.

2.4.2. Combined Effects of Metals, Nitrogen, and Phosphorus on Glucose Fermentation in ADE

Considering the high content of total nitrogen—largely ammonia—and phosphorus in the ADE, we tested the effects of metals, nitrogen, and phosphorus on growth and ethanol production by S. cerevisiae. Both organic and inorganic sources of nitrogen were tested. First, the control medium (100 g/L glucose in ddH2O) was supplemented with metallic salts only, as described above. Second, the control medium was supplemented with metallic salts (as above) and phosphate [K2HPO4 (0.157 g/L), KH2PO4 (0.157 g/L)]. Third, the control medium was supplemented with metallic salts, phosphate (as above), and inorganic nitrogen [NH4OH (0.301 g/L), NaNO2 (0.002 g/L), (NH4)2SO4 (0.1 g/L), (NH4)2NO3 (0.001 g/L)]. Fourth, the control medium was supplemented with metallic salts, phosphate, inorganic nitrogen, and a source of organic nitrogen (Yeast extract: 0.7 g/L). Finally, the control medium was supplemented with excess organic nitrogen in the forms of yeast extract (1.5 g/L) and peptone (0.5 g/L).

2.4.3. Effect of Excess Nitrogen on Glucose Fermentation in ADE

In addition to high ammonia and phosphorus concentrations, the ADE used in this study was found to contain ~100 mg/L of protein, which represents a likely repository of organic nitrogen. Thus, we tested the possible effect of excess nitrogen (both organic and inorganic) during S. cerevisiae fermentation of glucose in ADE, in combination with phosphorus and select metals (iron, manganese, potassium, and magnesium), which are essential for the growth of S. cerevisiae. For this, 50% ADE + glucose (100 g/L) and the control medium (100 g/L glucose in ddH2O) were supplemented with: Yeast extract (1.5 g/L), peptone (0.5 g/L), MgCl2 (0.2 g/L), NH4Cl (1.0 g/L), FeCl3.7H2O (6.0 mg/L), MnCl2.2H2O (1.5 mg/L), KH2PO4 (5.0 g/L).

2.5. Analytical Methods

Cell growth was determined by measuring optical density (OD600nm) in a DU® Spectrophotometer (Beckman Coulter Inc. Brea, CA, USA). Ethanol and glucose concentrations were analyzed by gas and liquid chromatography, respectively, as previously described [9]. Nutrient concentrations in the ADE were analyzed using Agilent 5110 inductive coupled plasma optical emission spectroscopy (ICP-OES; Agilent Technologies Inc., Wilmington, DE, USA). The plasma gas flow rate was set at 13 L/min with a radiofrequency power of 1.3 kW. The samples were flushed for 25 s with an auxiliary flow rate of 1.0 L/min. Samples were replicated 3 times with a replicate read time of 10 s. Sea-spray nebulizer was used to spray samples at a flow rate of 0.6 L/min. The sample delay and stabilization times were set at 20 and 12 s, respectively. The ICP was set to detect wavelengths between 230nm and 267.7 nm [10]. Latchat Quick Chem 8500 Flow Injection Analyzer (FIA; Hach Company, Loveland, CO, USA) was used to quantify the concentrations of NH4-N, NO3/NO2-N, PO4-P, total N, and total P in the ADE, using QuickChem® methods 10-107-06-1B, 10-107-04-1-R, 10-115-01-1-V, 10-115-01-3-B, and 10-107-04-3B, respectively, as described by the manufacturer. Protein concentrations were determined by the Bradford method [11]. Chemical oxygen demand (COD) was measured using TNT 823 COD assay kit (Hach Company, Loveland, CO, USA), according to the manufacturer’s protocol.

2.6. Statistical Analysis

Analysis of variance (ANOVA) using Minitab version 19 (Minitab Inc., State College, PA, USA) was conducted and pairwise comparisons between initial and final nutrient and ethanol concentrations and optical densities were performed using Tukey’s test at a 95% confidence interval. Additionally, Dunnett’s test was used to compare ADE treatments to the control.

3. Results

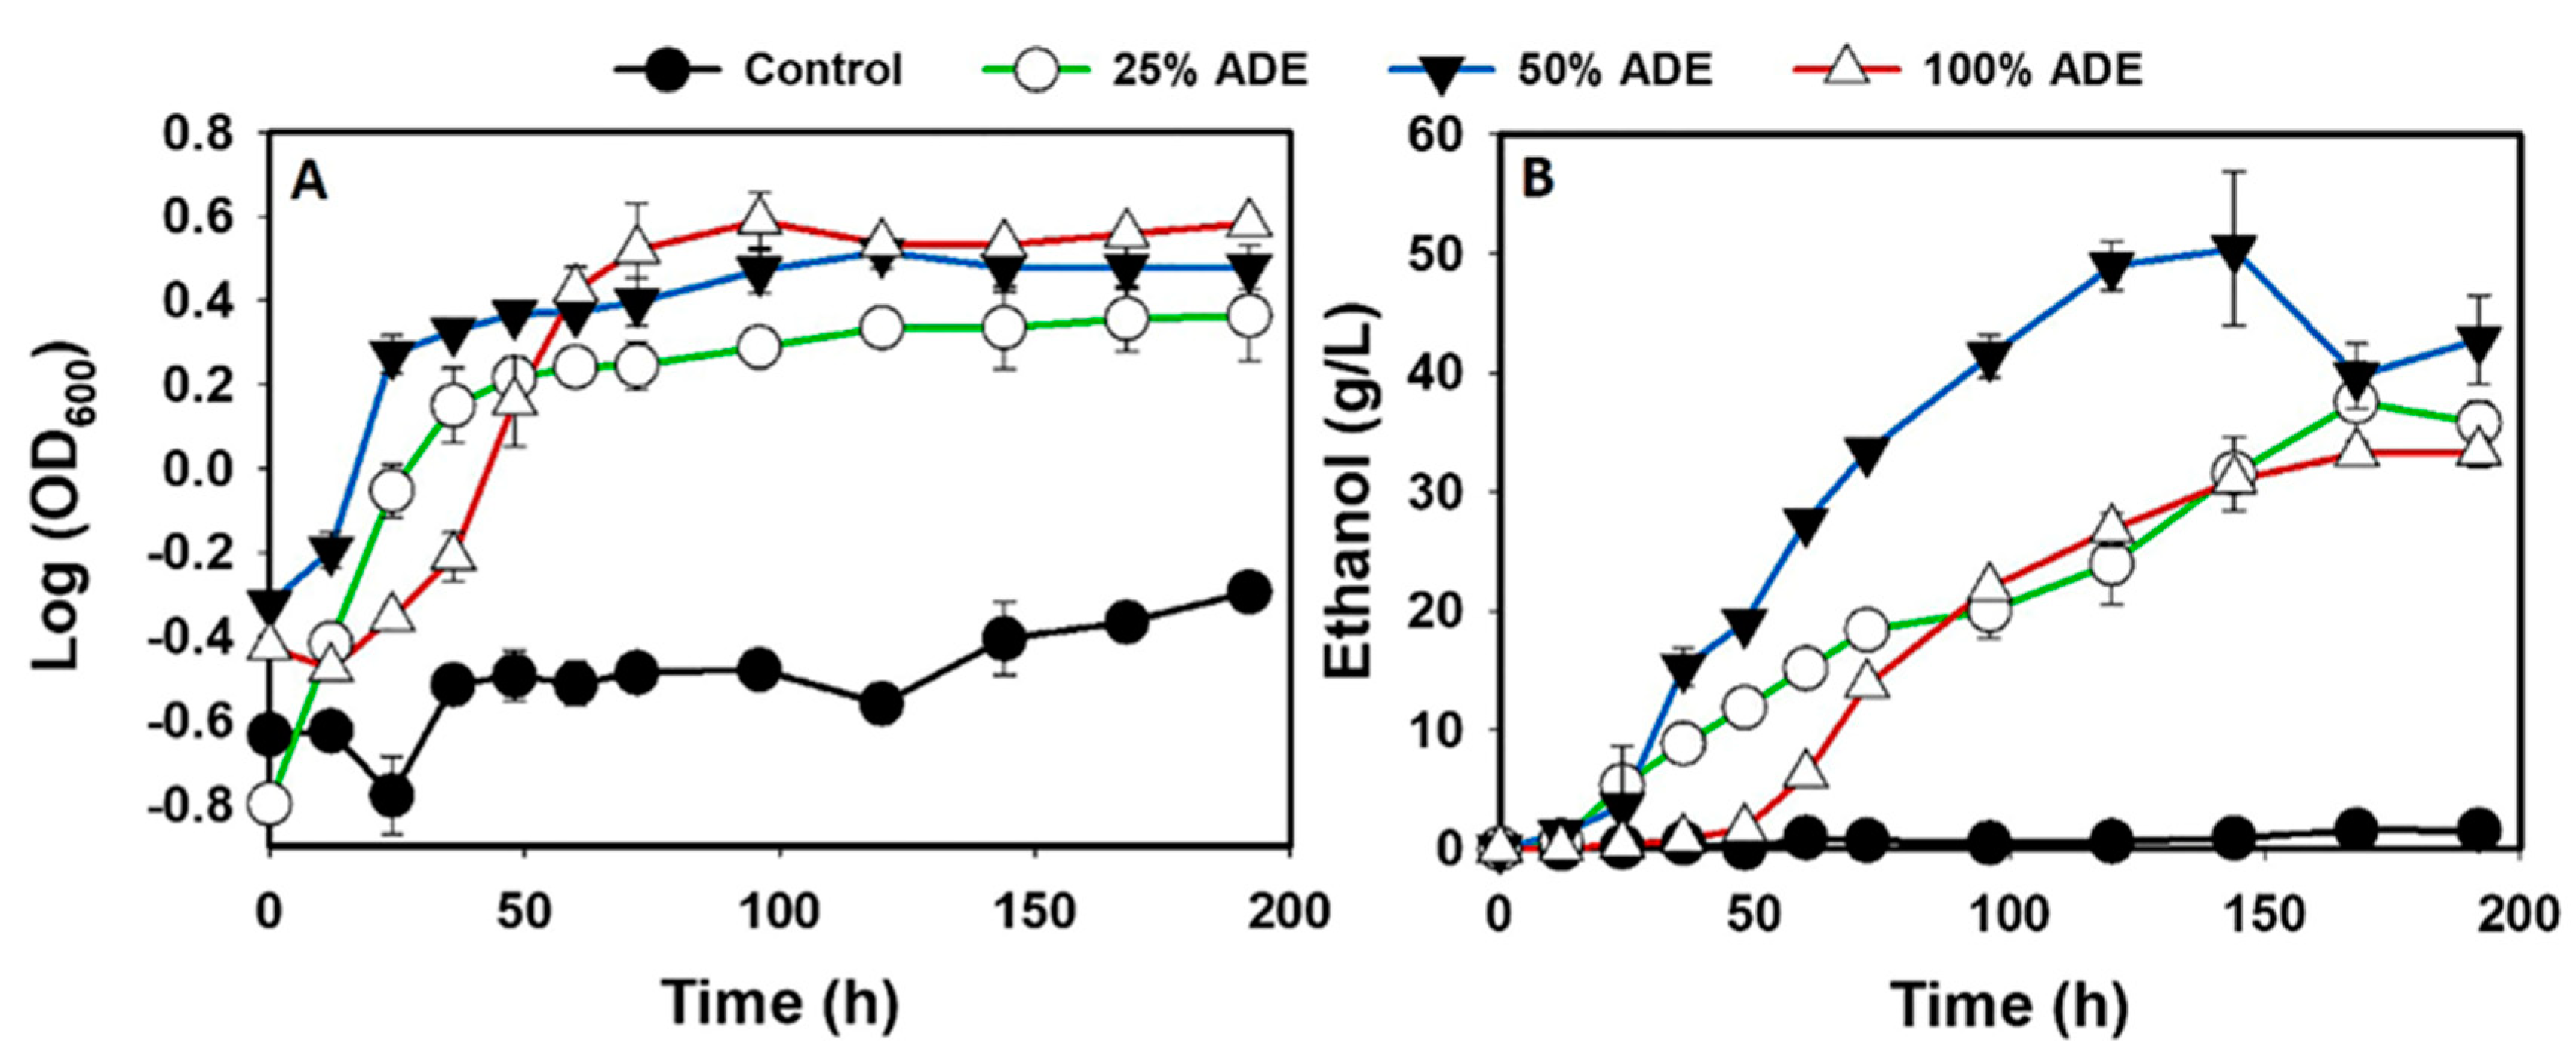
3.1. The fermentation Profiles of S. cerevisiae Grown in ADE

The residual nutrients contained in the ADE proved to be beneficial to the growth of S. cerevisiae. When compared to the nutrient-starved control medium, the ADE significantly supported the growth of S. cerevisiae in a concentration-dependent manner (p < 0.05). With 25% ADE, the optical density (OD600 nm) of S. cerevisiae increased 4.6-fold, relative to the control cultures (p < 0.05; Figure 2A). With 50% and 100% ADE, the OD600 nm of S. cerevisiae increased 5.9- and 7.53-fold, respectively (p < 0.05; Figure 2A). Similarly, ethanol concentrations were significantly higher in all the cultures grown in the ADE (p < 0.05). With 25%, 50% and 100% ADE, ethanol accumulated to maximum concentrations of 37.5 ± 3.3, 50.4 ± 6.4, and 33.3 ± 1.2 g/L, respectively, whereas the maximum ethanol concentration detected in the control medium was 1.6 ± 0.85 g/L (Table 1; Figure 2B). Similarly, Table 1 shows that ADE supports glucose utilization in a concentration-dependent manner. Relative to the control medium, fermentations in 25%, 50%, and 100% ADE led to 10.4-, 10.8-, and 12.3-fold increases in glucose utilization (p < 0.05; Table 1). Consequently, ethanol yields, and productivities were significantly greater in the ADE-containing media, relative to the control medium (p < 0.05; Table 1). In all, 50% ADE produced the best results, with yield and productivity of 0.45 ± 0.06 g/g glucose and 0.35 ± 0.04 g/L/h, respectively (Table 1).

3.2. Removal of Nutrients from the ADE by S. cerevisiae

Following cultivation of S. cerevisiae in the 25%, 50%, and 100% ADE, the resulting effluents were superior to the original ADE in terms of physical characteristics. Digestate clarification results for the 100% ADE are presented in Figure 3. Within 24 h of growth, gradual clarification of the ADE was observed (Figure 3). After 48 h, the ADE was considerably clearer in appearance, and the clarification remained evident to the end of fermentation (144 h; Figure 3). Likewise, significant reductions in nutrient concentrations were observed at the end of fermentation in the ADE (p < 0.05; Table 2). Except for nitrate, nickel, selenium, and silicon, concentrations of all the significantly present metals and non-metals detected in the 50% ADE decreased appreciably after fermentation (p < 0.05; Table 2). Notably, ammonia concentration decreased 1000-fold (Table 2). Similarly, sulfur, phosphate and total phosphorus concentrations decreased 7.72-, 1.94- and 2.20-fold, respectively (p < 0.05; Table 2). Significant reductions in concentration were also observed for the heavy metals: copper (6.03-fold), manganese (4.50-fold), molybdenum (2.10-fold), zinc (5.2-fold), and iron (1.20-fold). The anions bromide, chloride, and sulfate decreased 1.4-, 2.4-, and 3.7-fold, respectively (p < 0.05), following the growth of S. cerevisiae in the 50% ADE. Similarly, in the control medium, the concentrations of ammonia (181-fold), total nitrogen (131-fold), phosphate (380.2-fold), total phosphorus (376-fold), iron (1.8-fold), nickel (5-fold), potassium (25.6-fold), aluminum (7-fold), magnesium (3.1-fold), molybdenum (3.5-fold), manganese (4.6-fold), copper (2.7-fold), chloride (8.2-fold), sulfate (1.4-fold), and bromide (5.0-fold) reduced significantly in the control medium after fermentation (p < 0.05; Table 2). Conversely, silicon, selenium, sulfur, and zinc concentrations did not decrease in the control medium after fermentation (Table 2). A slight decrease in nitrate concentration was observed in the control medium.
The chemical oxygen demand (COD) of the ADE after solid removal was not extremely high (712.33 ± 27.50 mg/L), when compared to standard wastewater influent. However, ammonia (400 ± 7.94 mg/L), heavy metal (4.6 mg/L) and total phosphorus (1261.33 ± 1.53 mg/L) concentrations in the 50% ADE represent a formidable burden to the municipal wastewater treatment system. As expected, the addition of glucose to the ADE increased the COD significantly (2849.33 ± 39.80 mg/L). However, after fermentation, the COD reduced 1.6-fold (1647.33 ± 43.66 mg/L). The higher COD concentration observed for the 50% ADE after fermentation (when compared to the COD before glucose addition), indicates that S. cerevisiae likely secreted organic waste products, such as acetic acid into the broth during fermentation. Since ethanol was evaporated from the fermentation effluent before the COD assay, we measured acetic acid concentrations in the ADE and the control medium post-fermentation as a model byproduct of yeast in the effluent that likely contributes to COD. Indeed, acetic acid accumulated to maximum concentrations of 6.1 ± 0.00, 5.0 ± 1.20, 5.2 ± 0.00, and 9.6 ± 0.10 mg/L in the control medium, 25%, 50%, and 100% ADE, respectively, at the end of fermentation (Figure 4).
Considering the marked increases in the growth, ethanol and sugar utilization by S. cerevisiae grown in ADE, relative to the cultures grown in the control medium, we sought to understand the likely roles of the components of the ADE in the observed results. First, the control medium (100 g/L glucose in ddH2O) was supplemented with minerals—with emphasis on metallic salts—constituted to mimic the mineral composition of the ADE. Simultaneously, the 50% ADE was supplemented with zero-, half-, and quarter-strength of the same mineral concentrations added to the control medium. Mineral supplementation of the control medium alone did not enhance growth and ethanol production (Figure 5). Conversely, with half- and quarter-strength mineral supplementation of the 50% ADE, the OD600 nm of S. cerevisiae increased 2.0- and 2.3-fold, respectively, when compared to 50% ADE without mineral supplementation (p < 0.05; Figure 5). Notably, lower growth in the 50% ADE un-supplemented with additional minerals did not impede ethanol production. In fact, the final ethanol concentrations in the 50% ADE, 50% ADE + half-strength, and 50% ADE + quarter-strength minerals were similar, with a marginally greater ethanol concentration (an additional 4.7 ± 0.30 g/L) in the un-supplemented 50% ADE (Figure 5B). However, it is important to note that the rate of ethanol accumulation during the first 60 h of fermentation was considerably faster in the 50% ADE + half-strength and 50% ADE + quarter-strength minerals, when compared to the un-supplemented 50% ADE (p < 0.05; Figure 5B). Specifically, at 60 h, the ethanol productivities of cultures grown in 50% ADE, 50% ADE + half-strength, and 50% ADE + quarter-strength minerals were 0.46 g/L/h, 0.54 g/L/h, and 0.61 g/L/h, respectively. These translate to 1.2- and 1.3-fold increases in ethanol productivity, with 50% ADE + half-strength, and 50% ADE + quarter-strength minerals, relative to the 50% ADE un-supplemented with minerals (p < 0.05; Figure 5B).
Since supplementation with metals did not improve growth, ethanol production and glucose utilization by S. cerevisiae in the control medium (Figure 5), we further investigated whether nitrogen (organic and inorganic) and phosphorus—in addition to metals—which were present in the ADE, might be responsible for the marked increases in ethanol production and glucose utilization in the ADE. Hence, the control medium was supplemented with (a) minerals only, in the form of metallic salts, (b) metallic salts + phosphate only, (c) metallic salts + inorganic nitrogen and phosphate, (d) metallic salts + organic (0.7 g/L yeast extract) and inorganic nitrogen (ammonium compounds) and phosphate, and e) excess organic nitrogen only, in the form of yeast extract (1.5 g/L) and peptone (0.5 g/L). Again, supplementation of the control medium with metallic salts alone did not significantly improve growth and ethanol production (Figure 6). Likewise, supplementation of the growth medium with metallic salts and phosphate had a marginal effect on the growth of S. cerevisiae and ethanol production (Figure 6A). In contrast, relative to the control medium supplemented with only metallic salts or metal salts + phosphate, supplementation of the control medium with metallic salts + inorganic nitrogen and phosphate led to 2.82- and 1.9-fold increases in OD600nm, respectively, and 6.5- and 4.73-fold increases in ethanol concentration, respectively (p < 0.05; Figure 6). Furthermore, supplementation of the control medium with metallic salts + organic (0.7 g/L yeast extract) and inorganic nitrogen and phosphate led to 5.54- and 3.71-fold increases in OD600nm, whereas ethanol production increased 20.8- and 15.1-fold, relative to the control medium supplemented with only metal salts or metals salts + phosphate, respectively (p < 0.05; Figure 6).
When the control medium was supplemented with excess organic nitrogen (1.5 g/L yeast extract and 0.5 g/L peptone), the OD600nm increased 9.05- and 7.73-fold, respectively, when compared to the control medium supplemented with only metallic salts or metallic salts + phosphate (p < 0.05; Figure 6). Similarly, ethanol concentration increased 35.2- and 24.7-fold, accordingly (p < 0.05; Figure 6). Remarkably, addition of excess organic nitrogen only (1.5 g/L yeast extract and 0.5 g/L peptone), to the control medium led to significantly higher growth and ethanol production in the medium, even higher than when the control medium was supplemented with organic (0.7 g/L yeast extract) + inorganic nitrogen and phosphate, in addition to metals (minerals). In fact, with excess organic nitrogen, OD600nm and ethanol concentration increased 2.1- and 1.64-fold, respectively, relative to the control medium supplemented with metals (minerals), organic (0.7 g/L yeast extract) + inorganic nitrogen and phosphate (p < 0.05; Figure 6). Notably, supplementing the control medium (100 g/L glucose in ddH2O) with yeast extract (1.5 g/L) and peptone (0.5 g/L) either matched or outperformed the ADE in terms of growth and ethanol production, depending on the ADE concentration (25%, 50%, or 100%). For instance, addition of yeast extract (1.5 g/L) and peptone (0.5 g/L) to the control medium led to 3.4-, 2.4-, and 2.05-fold increases in OD600nm (p < 0.05; Figure 2A, Figure 6A), and 1.5-, 1.09-, and 1.7-fold increases in ethanol concentration (p < 0.05; Figure 2B, Figure 6B), when compared to 25%, 50%, and 100% ADE, respectively.
Apparently, nitrogen is a significant contributor to improved growth and ethanol production by S. cerevisiae in the ADE. In addition to ammonia (inorganic nitrogen), residual protein in the ADE is a veritable repository of organic nitrogen in this medium. Therefore, we quantified the protein content of the ADE. The 25%, 50% and 100% ADE contained 23.4 ± 3.15, 109 ± 21.49, and 163.1 ± 0.19 mg/L protein, respectively. Conversely, the control medium was devoid of protein, as expected. Interestingly, the protein in 25% ADE was completely utilized during fermentation, whereas protein concentrations decreased 1.2- and 1.1-fold in 50% and 100% ADE, respectively (data not shown). We further investigated the role that excess organic nitrogen might play during S. cerevisiae fermentation of ADE. Hence, the 50% ADE and the control medium were supplemented with 1.5 g/L yeast extract and 0.5 g/L peptone, as nitrogen sources, in addition to standard mineral components of S. cerevisiae fermentation medium including; MgCl2 (0.2 g/L), NH4Cl (1 g/L), FeCl3.7H2O (6 mg/L), MnCl2.2H2O (1.5 mg /L), and KH2PO4 (5 g/L).
Clearly, this did not increase the growth of S. cerevisiae, when compared to the control medium supplemented with yeast extract (1.5 g/L) and peptone (0.5 g/L) only (Figure 6A, Figure 7A). Interestingly, this treatment in the 50% ADE increased growth significantly (4.04-fold), when compared to the 50% ADE un-supplemented with additional nutrients (p < 0.05; Figure 2A, Figure 7A). Relative to the control medium supplemented with the same nutrients, the growth of S. cerevisiae in the 50% ADE supplemented with additional nutrients led to 1.73-fold higher OD600nm in the latter (p < 0.05; Figure 7A). Maximum ethanol concentrations in the control medium supplemented with yeast extract (1.5 g/L) and peptone (0.5 g/L) only, and the control medium supplemented with the same amounts of yeast extract and peptone with additional supply of minerals were 54.5 ± 3.64 and 49.2 ± 1.32 g/L, respectively (Figure 6B, Figure 7B). Apparently, additional supply of ammonium, magnesium, iron, potassium, manganese, and phosphate in the control medium slightly depressed ethanol production. With the 50% ADE, additional supply of yeast extract (1.5 g/L), peptone (0.5 g/L), ammonium, magnesium, iron, potassium, manganese, and phosphate did not affect ethanol production. In fact, both sets of cultures—50% ADE and 50% ADE + yeast extract (1.5 g/L), peptone (0.5 g/L), ammonium, iron, magnesium, manganese, potassium, and phosphate—produced 50.4 ± 6.45 and 50.5 ± 0.19 g/L, respectively (Figure 2B, Figure 7B).
The control medium and the 50% ADE supplemented with additional nutrients achieved approximately the same maximum ethanol concentration—49.2 ± 1.32 and 50.5 ± 0.19 g/L, respectively. However, worthy of note is that ethanol productivity in the 50% ADE (0.7 g/L/h) increased 2.1-fold, relative to the control medium (0.34 g/L/h), when both media were supplemented with additional nutrients (yeast extract, peptone, and minerals; Figure 7B; p < 0.05).

4. Discussion

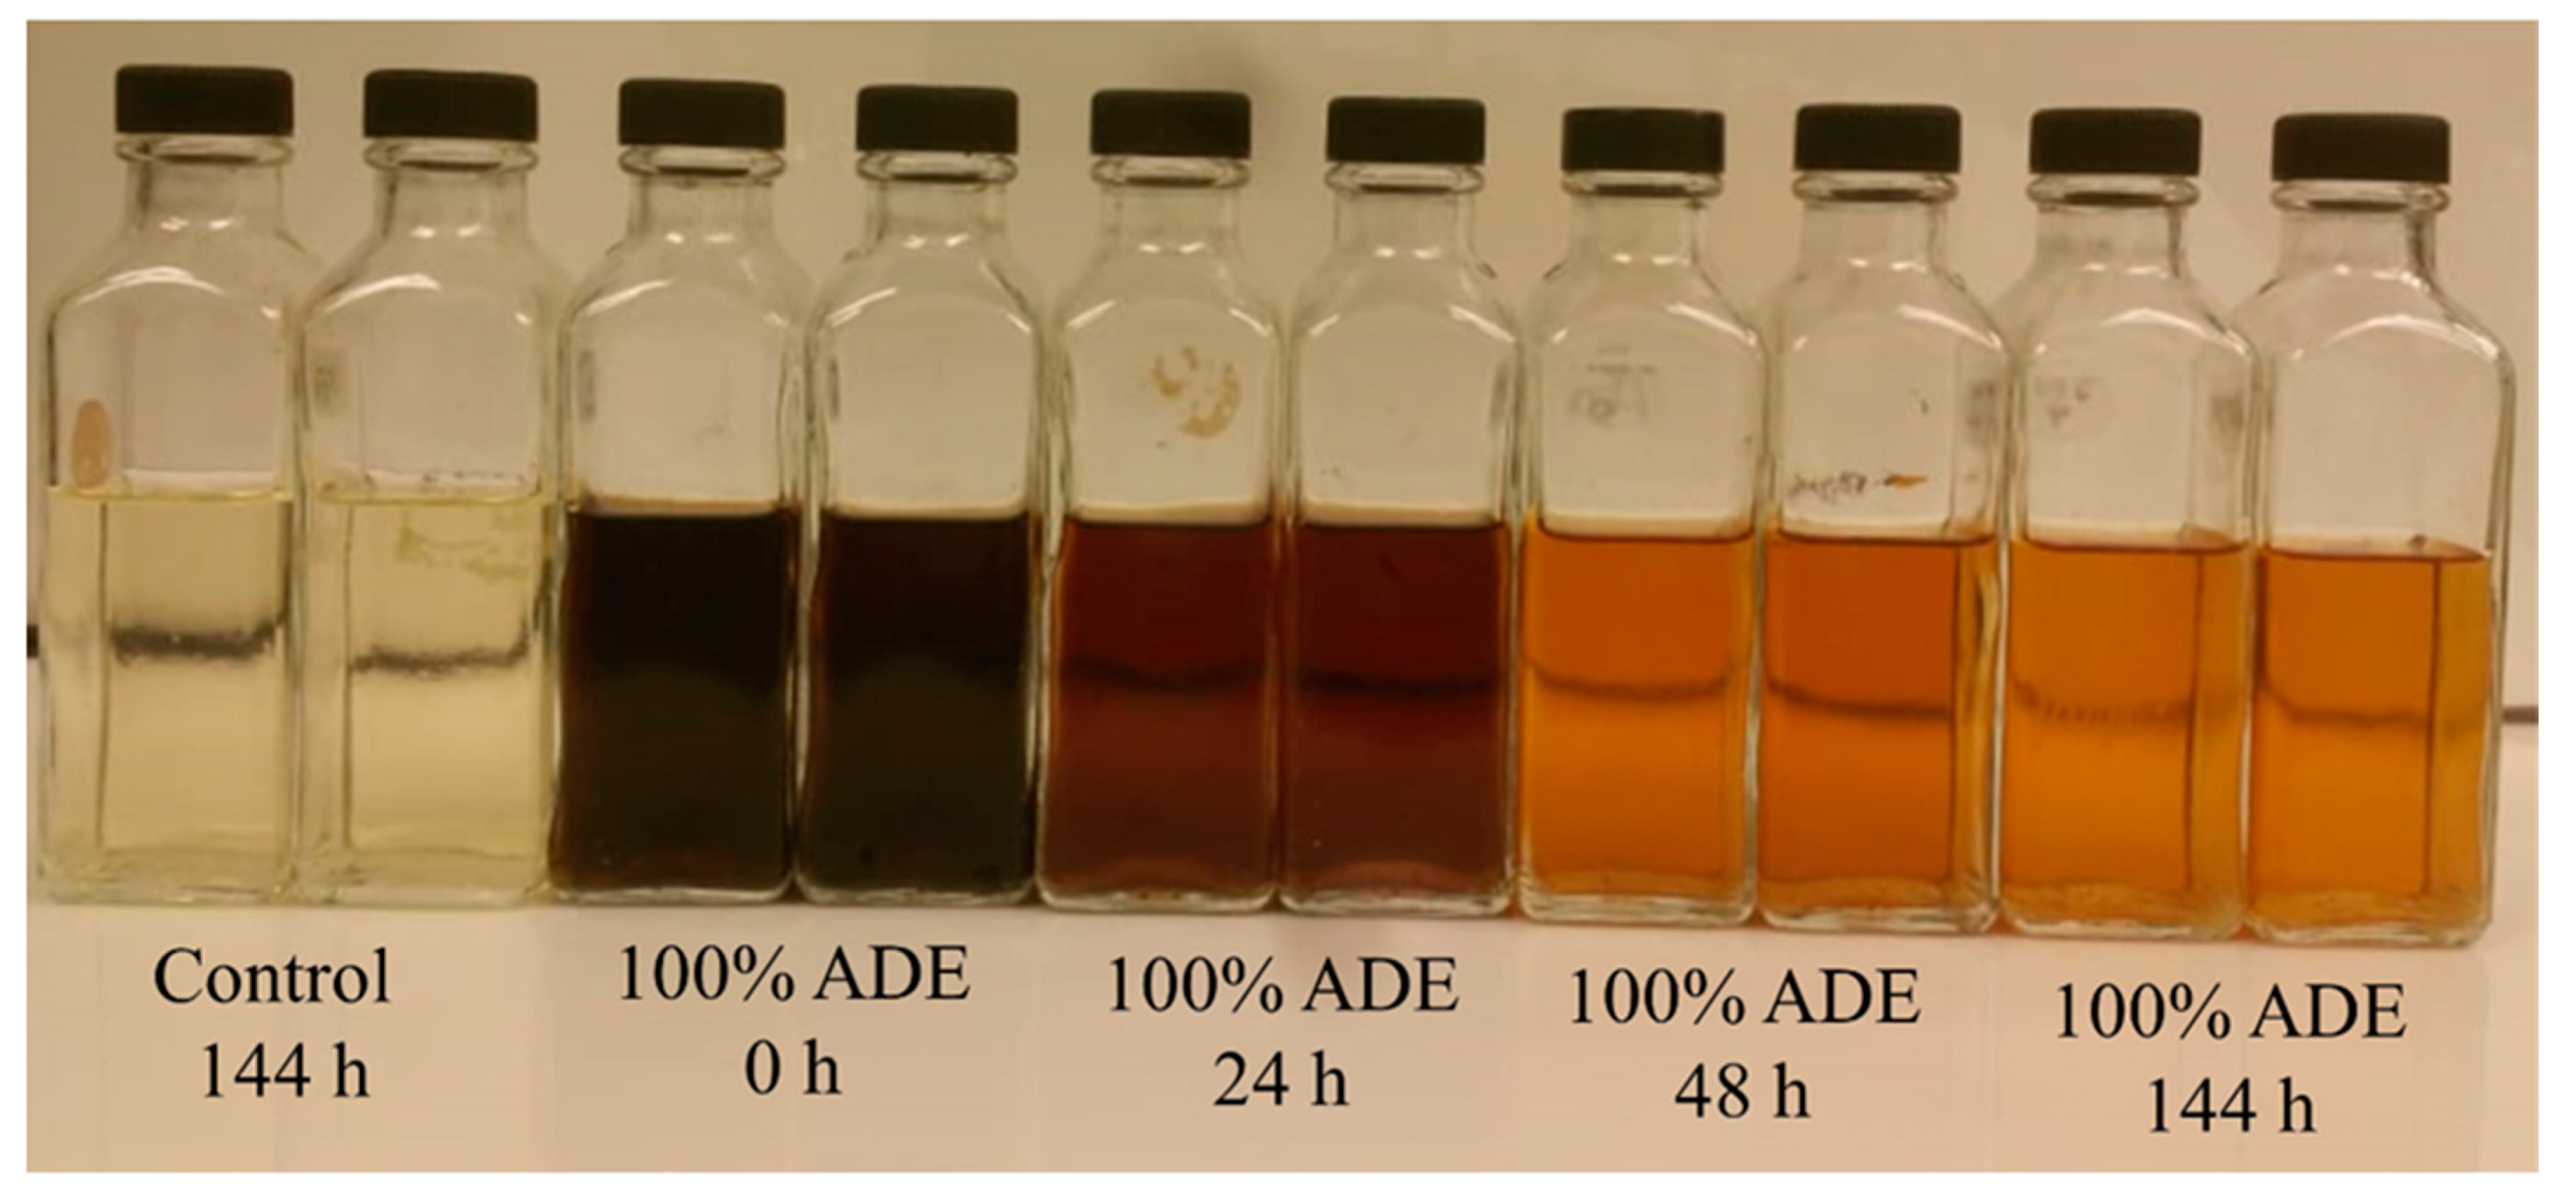
4.1. ADE Clarification and Nutrient Removal

The present study explored fermentation as a cost-effective means of recovering water—the most abundant component—from ADE. To the best of our knowledge, this is the first study to attempt fermentative recovery of cleaner water, with co-production of a value-added product using anaerobic digestate for medium formulation. Cleaner water recovery from ADE with concomitant production of a value-added product offers considerable promise, both economically and environmentally. Going forward, our overarching goal is to explore valorization of the nutrient-rich ADE as a resource for fermentative production of non-food, non-drug products, whilst reducing the enormous water footprint of AD. Indeed, S. cerevisiae fermentation of glucose in ADE led to significant clarification and considerable nutrient removal from the ADE, except for nitrate (NO3-N), nickel, selenium, and silicon. Further, S. cerevisiae fermentation in the ADE led to significant production of ethanol. The degree of ammonia removal from the 50% ADE (~100%) underscores the relevance of ammonia (and total assimilable nitrogen) to yeast biology. Most importantly, it highlights the potential of S. cerevisiae-mediated nutrient removal from ADE as a tool for water recovery and production of value-added commodities from ADE.
Nitrogen deficiency typically reduces growth and ethanol production, as observed with the nutrient-starved control medium. Although the nitrogen requirement of S. cerevisiae during fermentation varies from strain to strain and with fermentation conditions, ideal concentrations for efficient ethanol production range from 300 to 429 mg/L [12,13,14]. This likely explains superior ethanol production observed with the 50% ADE, in which ammonia concentration was ~400 mg/L, relative to the 25% and 100% ADE (Figure 2B) with lower and higher concentrations of ammonia, respectively. The inability of S. cerevisiae to remove NO3-N from the ADE agrees with previous reports that this organism is incapable of NO3-N assimilation [14,15,16]. Experimental variations might account for the slight reduction in NO3-N concentration observed with the control medium (Table 2). Given the considerably low amount of NO3-N in the ADE (0.243 ± 0.02 g/L), NO3-N does not represent a priority in the effort to remove nutrients from ADE. More importantly, nitrification is typically a limiting process, both technically and economically during wastewater treatment, due to the susceptibility of nitrifying bacteria to inhibition by sundry components of domestic wastewater and the immense oxygen requirement [17]. Therefore, removal of NH4+-N (and not NO3-N) from ADE is by far, a more pressing necessity.
In addition to ammonia removal, sequestration of metals, phosphorus and sulfur from ADE represents an important goal towards efficient treatment of the final effluent by conventional wastewater treatment. S. cerevisiae has been shown to harbor robust mechanisms for metal uptake, accumulation, and homeostasis [5,7]. Indeed, our results support these findings, as the concentrations of aluminum, copper, magnesium, manganese, molybdenum, zinc, iron, potassium, and sodium reduced significantly, following S. cerevisiae fermentation in the 50% ADE (Table 2). Conversely, the concentrations of nickel, selenium, and silicon remained relatively unchanged (Table 2). Metal antagonism—wherein the presence of one metal at an elevated concentration competitively dampens the uptake of another metal—might explain the lack of nickel removal from the ADE. High concentrations of magnesium in the growth medium was reported to competitively reduce the inhibitory effect of 0.5 mM nickel on S. cerevisiae, by preferentially reducing nickel uptake from the growth medium [18,19]. Magnesium-mediated inhibition of nickel uptake from the ADE appears plausible, given that magnesium was the most abundant metal detected in the ADE (435 ± 8.49 and 360 ± 5.41 mg/L, pre- and post-fermentation, respectively). Conversely, in the control medium which contained 58.66 ± 0.320 mg/L of magnesium (Table 2)—7.42-fold less than the concentration detected in the 50% ADE—nickel concentration reduced from 0.007 ± 0.02 to 0.001 ± 0.02 mg/L (5-fold reduction) after fermentation.
A similar mechanism likely accounts for non-removal of selenium from the ADE. This is because selenium uptake by S. cerevisiae occurs opportunistically via phosphate transporters [20]. Interestingly, selenium concentrations did not decrease in both the 50% ADE and the control medium (Table 2). Phosphate concentrations in the control medium and the 50% ADE were similar (10 ± 0.08 and 10.00 ± 0.004 μM, respectively), whereas selenium concentrations were 3.2 ± 0.05 and 1.41± 0.00 nM in the 50% ADE and the control medium, respectively. Another element that was not removed from the ADE was silicon. Brasser et al. [21] demonstrated that S. cerevisiae grown in a medium containing 10 mM silicon can accumulate up to 3.7 mg silicon/g cell dry weight. Evidently, S. cerevisiae harbors a mechanism for silicon uptake. However, in the same study, the authors noted that silicon depletion exerted no observable effect on the growth of S. cerevisiae. Since no dedicated silicon transporter has been identified in S. cerevisiae, it is likely that silicon is opportunistically assimilated by S. cerevisiae via a transporter(s) that primarily transport(s) another element(s). Thus, it could be inferred that whilst S. cerevisiae can assimilate silicon, silicon uptake is not a priority, unless when present in high amounts in the growth medium. The 50% ADE contained only 1.21 mM silicon, whereas 31.5 μM silicon was detected in the control medium. At these concentrations, especially with the numerous metals and non-metals present in the ADE, the need for silicon uptake seems unlikely.
Although the original concentrations reduced considerably, significant amounts of magnesium, sodium, and potassium persisted in the ADE after fermentation (Table 2). The high residual phosphate and chloride concentrations in the ADE suggest that magnesium, sodium, and potassium likely persist in the ADE as phosphates and chlorides (Table 2). While the degrees of reduction in concentrations observed for potassium, sodium, and magnesium represent a significant first step towards economical water recovery and nutrient removal from ADE, the residual concentrations warrant additional efforts. This is because the residual concentrations observed for these metals outstrip typical concentrations found in raw sewage.
As expected, COD reduced 1.6-fold in the 50% ADE after fermentation. However, the COD after fermentation was higher than the original COD of the ADE before glucose addition (pre-fermentation). Higher COD concentrations in the ADE after fermentation is ascribable to the secretion of organic waste products by S. cerevisiae during fermentation, as evidenced by an increase in acetic acid concentrations in all the cultures tested (both the ADE and the control medium; Figure 4). Whereas only acetic acid was measured in this study, several other S. cerevisiae-derived waste products such as glycerol likely contribute to the higher COD concentrations observed after fermentation. However, it is deserving of mention that given significant reductions in the concentrations of ammonia, total nitrogen, phosphate, total phosphorus, heavy metal, and anions (chloride, sulfate, and bromide), the resulting ADE-based effluent post-fermentation is plausibly more amenable to conventional municipal wastewater treatment technologies. Further, a COD concentration of 1,647.33 ± 43.66 mg/L is relatively similar to COD concentration previously reported for raw domestic effluent [22]. Notably, whereas acetic acid is readily biodegradable, it does affect effluent pH. For instance, the pH of the effluent following fermentation in the ADE reduced from 7.7 to 5.5 and from 5.5 to 4.0 for the control medium (data not shown), possibly due to the accumulation of acetic acid in the effluents. This would likely impact alkalinity in a conventional wastewater treatment system, depending on the ratio of sewage to ADE effluent. We are currently exploring blending the ADE effluents from this study with raw sewage in a simulated activated sludge system, to better evaluate their impact on, and amenability to an activated sludge system.

4.2. Effects of the ADE-Borne Nutrients on Growth and Ethanol Production by S. cerevisiae

The growth and ethanol profiles of S. cerevisiae cultivated in the ADE indicate that the nutrients contained in this medium work together to promote cell growth and ethanol production during glucose fermentation. For instance, additional mineral supplementation in the form of metallic salts led to significant increase in growth in the ADE, while only a marginal effect was observed in the control medium (Figure 5). However, the increase in growth did not lead to increase in total ethanol concentration in the ADE (Figure 5). Notably though, ethanol productivity increased in the ADE. The increase in ethanol productivity following additional metal supplementation may be as a result of increased cell population in the medium, thus, leading to a more rapid ethanol accumulation, and not due to increased capacity to produce ethanol. However, the fact that this effect was only observed with the ADE, and not in the control medium suggests that other components of the ADE that are not present in the control medium, perhaps augment the payoffs obtained with metal supplementation. Among other components of the ADE, high ammonia concentration is a likely key player in increased growth and ethanol production and productivity obtained with the ADE. The highest degree of nutrient removal from the ADE was observed for ammonia (1000-fold), which underscores the relevance of ammonia to growth and ethanol production by S. cerevisiae. This is not surprising as the preference for ammonia by S. cerevisiae is well documented [23]. S. cerevisiae exhibits a hierarchical order of nitrogen utilization, where ammonia, glutamine, and asparagine are preferentially utilized by S. cerevisiae over poor nitrogen sources such as urea and proline [23].
It is important to highlight that supplementation of the control medium with ammonia (inorganic nitrogen), phosphate, and metallic salts led to significant increases in growth and ethanol production when compared to the control medium alone, and the control medium supplemented with metal salts only (Figure 6). Apparently, whereas metallic salts exerted a modest effect on growth with hardly any effect on ethanol production, when co-supplemented with ammonia and phosphate, considerable increases in growth and ethanol production were observed. Further supplementation of the growth medium to include organic nitrogen (in addition to inorganic nitrogen, phosphate, and metallic salts), or supply of excess organic nitrogen in the form of yeast extract and peptone (1.5 g/L and 0.5 g/L, respectively), led to even greater increases in growth and ethanol production (Figure 6). Peptone and yeast extract are rich sources of amino acids—including asparagine, which is a preferred nitrogen source by S. cerevisiae—phosphate and metals [24,25]. As does ammonia, amino acids promote ethanol production by S. cerevisiae [26]. This is because amino acids feed into central nitrogen metabolism, thereby circumventing multiple, and often metabolically expensive biosynthesis steps [26]. Assaying the ADE for protein confirmed considerable protein content, which decreased during the growth of S. cerevisiae at all concentrations of ADE tested (data not shown). This indicates that in addition to ammonia, the protein content of the ADE likely serves as an added source of nitrogen, most plausibly in the form of amino acids. Supplementation of the control medium with yeast extract and peptone augmented with NH4Cl, FeCl3.7H2O, MnCl2.2H2O, and KH2PO4 elevated ethanol concentration to the levels obtained with the 50% ADE or 50% ADE supplemented with the same nutrients (yeast extract, peptone, and select metallic salts). Interestingly, this supplementation did not further increase ethanol production, when compared to the un-supplemented 50% ADE. Taken together, the ADE, even at 50% concentration contains enough nutrients to support efficient growth and ethanol production by S. cerevisiae.

5. Conclusions

In this study, anaerobic digestate was evaluated as a resource for ethanol fermentation by S. cerevisiae, leading to clarification of the digestate, with concomitant removal of the major nutrients namely, NH4+-N (1,000-fold), PO4-P (1.9-fold), total nitrogen (104.4-fold), and total phosphorus (2.2-fold). Additionally, the concentrations of aluminum, potassium, magnesium, sodium, iron, manganese, molybdenum, copper, zinc, chloride, and sulfate decreased significantly following fermentation in the digestate. S. cerevisiae grown in the digestate showed considerably greater growth than the cultures grown in the control media (as much as 7.5-fold), and produced up to 50.4 ± 6.4 g/L ethanol—31.5-fold higher ethanol than the concentration produced in the control medium (1.6 ± 0.9 g/L). Results following supplementation of the control medium with organic and inorganic nitrogen, phosphate, and metallic salts suggest that residual nutrients in the digestate work cooperatively to promote the growth of S. cerevisiae and ultimately, ethanol production.

Author Contributions

This study was conceived by V.C.U., T.C.E, and C.C.O. designed the experiments. The fermentations and analytical procedures were carried out by C.C.O., B.B.R., and G.E.M. The results were analyzed and interpreted by V.C.U., T.C.E., and C.C.O. V.C.U. wrote the manuscript. All authors revised the manuscript. All authors have read and agreed to the published version of the manuscript.

Acknowledgments

The authors wish to thank the Ohio Agricultural Research and Development Center (OARDC) SEEDS program (grant number 2018-028) and the United States Department of Agriculture – NIFA Hatch grants (Project Nos. OHO01478) for funding this work.

Conflicts of Interest

The authors declare no conflict of interest.

References

  1. Satchwell, A.J.; Scown, C.D.; Smoith, S.J.; Amirebrahimi, J.; Jin, L.; Kirchstetter, T.W.; Brown, N.J.; Preble, C.V. Accelerating the deployment of anaerobi digestion to meet zero waste goals. Environ. Sci. Technol. 2018, 52, 13663–13669. [Google Scholar] [CrossRef] [PubMed]
  2. Campos, J.L.; Crutchnik, D.; Franchi, O.; Pavissich, J.P.; Belmonte, M.; Pedrouso, A.; Mosquera-Correl, A.; Val del Rio, A. Nitrogen and phosphorus recovery from anaerobically pretreated agro-food wastes: A review. Front. Sustain. Food Syst. 2019, 2, 91. [Google Scholar] [CrossRef] [Green Version]
  3. Driver, J.; Lijmbach, D.; Steen, I. Why recover phosphorus for recycling, and how? Environ. Technol. 1991, 20, 651–662. [Google Scholar] [CrossRef]
  4. Münch, E.V.; Barr, K. Controlled struvite crystallization for removing phosphorus from anaerobic digester sidestreams. Wat. Res. 2001, 35, 151–159. [Google Scholar] [CrossRef]
  5. Sun, G.L.; Reynolds, E.E.; Belcher, A.M. Designing yeast as plant-like hyperaccumulators for heavy metals. Nature Commun. 2019, 10, 5080. [Google Scholar] [CrossRef]
  6. Soares, E.V.; Hebbelinck, K.; Soares, H.M.V.M. Toxic effects caused by heavy metals in the yeast Saccharomyces cerevisiae: A comparative study. Can J. Microbiol. 2003, 49, 336–343. [Google Scholar] [CrossRef]
  7. Hosiner, D.; Gerber, S.; Lichtenberg-Frate, H.; Glaser, W.; Schuller, C.; Klipp, E. Impact of acute metal stress in Saccharomyces cerevisiae. PLoS ONE 2014, 9, e83330. [Google Scholar] [CrossRef]
  8. Agu, C.V.; Ujor, V.; Ezeji, T.C. Allopurinol supplementation of the growth medium enhances the fermentation of lignocellulosic hydrolysates to ethanol by Saccharomyces cerevisiae. Biocat. Agric. Biotechnol. 2018, 14, 151–159. [Google Scholar] [CrossRef]
  9. Okonkwo, C.C.; Azam, M.M.; Ezeji, T.C.; Qureshi, N. Enhancing ethanol production from cellulosic sugars using Scheffersomyces (Pichia) stipitis. Bioprocess Biosyst. Eng. 2016, 39, 1023–1032. [Google Scholar] [CrossRef]
  10. Quinones, R.; Luliucci, R.J.; Behnke, G.; Brown, R.; Shoup, D.; Riedel, T.M.; Plavchak, C.; Lininger, B.E.; Spehar, J.M. Moving towards fast characterization of polymorphic drugs by solid-state NMR spectroscopy. J. Pharm. Biomed. Anal. 2018, 148, 163–169. [Google Scholar] [CrossRef]
  11. Bradford, M.M. A rapid and sensitive method for the quantification of microgram quantities of peotein utilizing the principle of protein-dye binding. Anal. Biochem. 1976, 72, 248–254. [Google Scholar] [CrossRef]
  12. Bely, M.; Sablayrolles, J.; Barre, P. Automatic detection of assimilable nitrogen deficiencies during alcoholic fermentation in oenological conditions. J. Ferment. Bioeng. 1990, 70, 246–252. [Google Scholar] [CrossRef]
  13. Jiranek, V.; Langridge, P.; Henschke, P.A. Regulation of hydrogen sulfide liberation in wine-Producing Saccharomyces cerevisiae strains by assimilable nitrogen. Appl. Environ. Microbiol. 1995, 61, 461–467. [Google Scholar] [CrossRef] [PubMed] [Green Version]
  14. de Souza, R.B.; de Menezes, J.A.; de Souza, R.F.R.; Dutra, E.D.; de Morais, M.A.A., Jr. Mineral composition of sugarcane juice and its influence on the ethanol fermentation. Appl. Biochem. Biotechnol. 2015, 175, 209–222. [Google Scholar] [CrossRef] [PubMed]
  15. Barnett, J.A.; Payne, R.W.; Yarrow, D. Yeasts: Characteristics and Identification; Cambridge University Press: Cambridge, UK, 1990. [Google Scholar]
  16. Siverio, J.M. Assimilation of nitrate by yeasts. FEMS Microbiol. Rev. 2002, 26, 277–284. [Google Scholar] [CrossRef] [PubMed]
  17. Anthonisen, A.C.; Loehr, R.C.; Prakasam, T.B.S.; Srinath, E.G. Inhibition of nitrification by ammonia and nitrous acid. J. Water Pollut. Control Fed. 1976, 48, 835–852. [Google Scholar]
  18. Nishimura, K.; Igarashi, K.; Kakinuma, Y. Proton gradient-driven nickel uptake by vacuolar membrane vesicles of Saccharomyces cerevisiae. J. Bacteriol. 1998, 180, 1962–1965. [Google Scholar] [CrossRef] [Green Version]
  19. Kücükgöze, G.; Alkim, C.; Yilmaz, Ü.; Kisakesen, H.I.; Gündüz, S.; Akman, S.; Çakar, P. Evolutionary engineering and transcriptomic analysis of nickel-resistant Saccharomyces cerevisiae. FEMS Yeast Res. 2013, 13, 731–746. [Google Scholar] [CrossRef] [Green Version]
  20. Lazard, M.; Blanquet, S.; Fisicaro, P.; Labbarraque, G.; Plateau, P. Uptake of selenite by Saccharomyces cerevisiae involves the high and low affinity orthophosphate transporters. J. Biol. Chem. 2010, 285, 32029–32037. [Google Scholar] [CrossRef] [Green Version]
  21. Brasser, H.J.; Krijger, G.C.; van Meerten, T.G.; Wolterbeek, H.T. Influence of silicon on cobalt, zinc, and magnesium in Baker’s yeast, Saccharomyces cerevisiae. Biol. Trace Elem. Res. 2006, 112, 175–189. [Google Scholar] [CrossRef]
  22. Cetin, E.; Karakas, E.; Dulegurkgen, E.; Ovez, S.; Kolukirik, M.; Yilmaz, G. Effects of high-concentration influent suspended solids on aerobic granulation in pilot-scale sequencing batch reactors treating real domestic wastewater. Water Res. 2018, 131, 74–89. [Google Scholar] [CrossRef] [PubMed]
  23. ter Schure, E.G.; van Riel, N.A.W.; Verrips, C.T. The role of ammonia metabolism in nitrogen catabolite repression in Saccharomyces cerevisiae. FEMS Microbiol. Rev. 2000, 24, 67–83. [Google Scholar] [CrossRef] [PubMed] [Green Version]
  24. Grant, C.L.; Pramer, D. Minor element composition of yeast extract. J. Bacteriol. 1962, 84, 869–870. [Google Scholar] [CrossRef] [PubMed] [Green Version]
  25. Andrews, A.T. The composition, structure and origin of proteose-peptone component 5 of bovine milk. Eur. J. Biochem. 1978, 90, 59–65. [Google Scholar] [CrossRef] [PubMed]
  26. Albers, E.; Larsson, C.; Liden, G.; Niklasson, C.; Gustafsson, L. Influence of the nitrogen source on Saccharomyces cerevisiae anaerobic growth and product formation. Appl. Environ. Microbiol. 1996, 62, 3187–3195. [Google Scholar] [CrossRef] [Green Version]
Figure 1. Schematic diagram of Saccharomyces cerevisiae-based fermentation in anaerobic digestate (ADE).
Fermentation 06 00052 g001
Figure 2. Growth and ethanol accumulation profiles of S. cerevisiae cultivated in different concentrations of anaerobic digestate (ADE) supplemented with glucose (100 g/L), relative to the control cultures (100 g/L glucose in ddH2O). (A): Growth profiles, (B): ethanol profiles.
Fermentation 06 00052 g002
Figure 3. Effluents samples showing progressive clarification of 100% ADE over the course of a 144-h fermentation. Cells were removed by centrifugation for each time point to clearly highlight ADE clarification.
Fermentation 06 00052 g003
Figure 4. Accumulation of byproducts such as acetic acid in the control medium- and ADE-grown cultures of S. cerevisiae likely account for increase in chemical oxygen demand (COD) after fermentation (when compared to the 50% ADE before sugar addition).
Fermentation 06 00052 g004
Figure 5. Evaluating the effect of the metallic components of the ADE on growth and ethanol production by S. cerevisiae. The control medium (glucose + water) and ADE were supplemented with different metal concentrations, based on the original metal concentrations of the ADE. (A): Growth profiles. (B): ethanol profiles.
Fermentation 06 00052 g005
Figure 6. The effects of nitrogen, phosphorus and the metals contents detected in the ADE on growth and ethanol production by S. cerevisiae. Metals, nitrogen (organic and inorganic) and phosphorus were sequentially added to the control medium (glucose + water). (A). Growth profiles; (B): ethanol profiles.
Fermentation 06 00052 g006
Figure 7. Supplementation of excess organic and inorganic nitrogen, phosphate, and select minerals led to similar maximum ethanol concentrations in the control medium (glucose + water) and the ADE, with higher growth in the ADE. Medium composition – (g/L): yeast extract (1.5), peptone (0.5), MgCl2 (0.2), NH4Cl (1), FeCl3.7H2O (6), MnCl2.2H2O (0.0015), and KH2PO4 (5). (A). Growth profiles; (B): ethanol profiles.
Fermentation 06 00052 g007
Table 1. The fermentation profiles of Saccharomyces cerevisiae grown in 25%, 50%, and 100% ADE, relative to the control medium.
TreatmentMaximum Ethanol Concentration (g/L)Ethanol Yield (g/g)Ethanol Productivity (g/L/h)Initial glucose Concentration (g/L)Final Glucose Concentration (g/L)Glucose Consumed (g/L)
Control medium1.6 ± 0.9a0.18 ± 0.10a0.01 ± 0.01a111.7 ± 0.3a102.3 ± 0.0a9.1 ± 0.3a
25% ADE37.5 ± 3.3b,c0.39 ± 0.08b0.22 ± 0.02b117.2 ± 9.5a22.5 ± 0.3b94.7 ± 9.4b
50% ADE50.4 ± 6.4b0.45 ± 0.06b,c0.35 ± 0.04c111.7 ± 0.3a0.0 ± 0.0c111.7 ± 0.3b
100% ADE33.3 ± 1.2c0.34 ± 0.03b0.17 ± 0.01b111.7 ± 0.3a13.7 ± 5.0d98.5 ± 5.2b
Tukey’s pairwise comparisons between treatments for maximum ethanol concentration, ethanol yield, ethanol productivity, and glucose consumed. Superscript (a, b and c) denote significant differences such that treatments with different superscripts within a column are significant at p < 0.05.
Table 2. Comparative concentrations of cationic and anionic nutrients in 50% ADE before and after the growth of S. cerevisiae.
NutrientInitial Concentration (mg/L)Final Concentration (mg/L)Fold DecreaseInitial Concentration (mg/L)Final Concentration (mg/L)Fold Decrease
*50% ADE*Control Medium
Aluminum0.491 ± 0.06a0.073 ± 0.005b6.70.474 ± 0.080a0.069 ± 0.008b7.0
Copper0.229 ± 0.01a0.038 ± 0.02b6.00.007 ± 0.001a0.0026 ± 0.019b2.7
Magnesium435 ± 8.49a360 ± 5.41b1.258.657 ± 0.320a18.957 ± 0.525b3.1
Manganese2.300 ± 0.03a0.514 ± 0.02b4.50.489 ± 0.001a0.106 ± 0.002b4.6
Molybdenum0.013 ± 0.004a0.0063 ± 0.00b2.10.007 ± 0.000a0.002 ± 0.0005b3.5
Zinc0.600 ± 0.02a0.116 ± 0.07b5.20.426 ± 0.021a0.404 ± 0.069a1.1
NH4-N400 ± 7.94a0.400 ± 0.61b1000.0266.000 ± 5.196a1.471 ± 0.494b181.0
NO3-N0.200 ± 0.02a0.243 ± 0.02a-13.494 ± 0.101a10.000 ± 1.080a1.4
Total nitrogen471 ± 5.33a4.510 ± 0.52b104.4291.333 ± 5.508a2.330 ± 2.222b131.0
Iron1.2 ± 0.02a1.010 ± 0.14a1.21.600 ± 0.006a0.913 ± 0.390a1.8
Potassium2.078 ± 46.48a1.239±29.08b1.71566.670 ± 8.021a61.173 ± 14.902b25.6
Sodium243 ± 7.75a204 ± 3.49b1.243.527 ± 0.071a116.253 ± 2.059b-
Nickel0.046 ± 0.003a0.055 ± 0.001b-0.005 ± 0.000a0.001 ± 0.0002b5.0
Sulfur21.400 ± 1.10a12.471 ± 0.56b1.712.190 ± 0.06a27.90 ± 0.581b-
Sulfate16.400 ± 2.19a4.400 ± 0.04b3.713.494 ± 0.101a9.961 ± 1.080a1.4
Selenium0.251 ± 0.047a0.335 ± 0.015b-0.111 ± 0.025a0.321 ± 0.028b-
Silicon17.000 ± 0.29a22.600 ± 0.37b-0.441 ± 0.006a3.962 ± 0.170b-
Chloride1.312 ± 11.01a554 ± 3.32b2.4907.371 ± 1.320a110.073 ± 1.960b8.2
Bromide1.300 ± 0.05a0.920 ± 0.08b1.40.26 ± 0.000a0.052 ± 0.000b5.0
Phosphate (PO4-P)960.00 ± 1.00a494.67 ± 8.08b1.9954.333 ± 3.060a2.51 ± 2.45b380.2
Total phosphorus1261.33 ± 1.53a576.67 ± 17.47b2.21255.333 ± 22.300a3.34 ± 2.61b376.0
Tukey’s pairwise comparisons between the initial and final concentrations of each cation or anion within treatments (50% ADE and control medium) were performed. Cations/anions with the same superscripts (a, b) within treatments are not significant at p < 0.05. *50% ADE: 100 g/L glucose in 50% (v/v) digestate; Control medium (100 g/L glucose in ddH2O).

